Article

Mitigation of Shock-Induced Separation Using Square-Shaped Micro-Serrations—A Preliminary Study

1
State Key Laboratory of High Temperature Gas Dynamics, Institute of Mechanics, Chinese Academy of Sciences, Beijing 100190, China
2
School of Engineering Science, University of Chinese Academy of Sciences, Beijing 100049, China
*
Authors to whom correspondence should be addressed.
Aerospace 2024, 11(2), 148; https://doi.org/10.3390/aerospace11020148
Submission received: 17 January 2024 / Revised: 7 February 2024 / Accepted: 10 February 2024 / Published: 12 February 2024
(This article belongs to the Special Issue Shock-Dominated Flow)

Abstract

:
Suppressing shock-induced flow separation has been a long-standing problem in the design of supersonic vehicles. To reduce the structural and design complexity of control devices, a passive control technique based on micro-serrations is proposed and its controlling effects are preliminarily investigated under test conditions in which the Mach number is 2.5 and the ramp creating an incident shock is 15 deg. Meanwhile, a vorticity-based criterion for assessing separation scales is developed to resolve the inapplicability of the zero skin friction criterion caused by wall unevenness. The simulations demonstrate that the height of the first stair significantly influences the separation length. Generally, the separation length is shorter at higher stairs, but when the height is greater than half of the thickness of the incoming boundary layer, the corresponding separation point moves upstream. A stair with a height of only 0.4 times the thickness of the boundary layer reduces the separation length by 2.69%. Further parametric analysis reveals that while the remaining serrations have limited effects on the flow separation, an optimization of their shape (depth and width) can create more favorable spanwise vortices and offer a modest improvement of the overall controlling performance. Compared to the plate case, a 9.13% reduction in the separation length can be achieved using a slightly serrated design in which the leading stair is 0.1 high and the subsequent serrations are 0.2 deep and 0.05 wide (nondimensionalized, with the thickness of the incoming boundary layer). Meanwhile, the micro-serration structure even brings less drag. Considering the minor modification to the structure, the proposed method has the potential for use in conjunction with other techniques to exert enhanced control on separations.

1. Introduction

The shock wave/boundary layer interaction (SWBLI) is a fundamental flow phenomenon involving the complex shock–shock and shock–boundary layer interactions that are common in both external and internal flows, such as flows at external surfaces, the intake and isolators of supersonic and hypersonic vehicles, transonic airfoil surfaces, and other positions. With a strong adverse pressure gradient, the boundary layer in the interaction region will inevitably separate, resulting in a significant energy loss and a lower total pressure recovery [1,2,3]. At the same time, separation can cause flow oscillations [4,5], excessive thermal loads [6,7,8], and other dangerous situations. Furthermore, SWBLI can also lead to a thickening of the boundary layer and even prevent the start in the intake of a scramjet engine [9,10]. SWBLI must be considered in aircraft design, and control of SWBLI is conducive to the safe and stable operation of aircraft.
Although significant progress has been achieved in SWBLIs in recent decades, since Ferri [11] first discovered this phenomenon experimentally, SWBLI control, particularly the control of separation, is still a hot topic in the field of aerodynamics. Several techniques have been used for separation control [12]: decrease in the imposed adverse pressure gradient, removal of the low-momentum near-wall flow, or addition of the momentum of the near-wall flow. The specific flow control methods can be categorized into passive control methods and active control methods. Passive control includes the use of a micro-vortex generator (MVG) [13,14,15], a local wall modification in the form of a bump [16,17], and a backward facing step [18,19]. Active control includes the application of boundary layer bleed/suction ahead of the shock-induced interaction [20,21], steady microjets [22,23], plasma jets [24,25], and spark jets [26]. Active control has a range of advantages, and researchers also prefer complex flow control systems that can be actively controlled with feedback. For example, boundary layer bleed/suction is an effective method of suppressing the separation in both laminar and turbulent boundary layers. However, the bleed system simultaneously dumps considerable amounts of captured airflow to obtain an acceptable control effect, which may lead to the poor aerodynamic performance and reduced propulsion efficiency of the aircraft. For example, engines equipped with active control may result in an intake with increased weight and aerodynamic drag [27] that cannot compensate for the induced loss. Thus, the current economical, structurally simple, and safe method for practical use is still based on passive control.
To date, the micro-vortex generator (MVG) has been widely used for passive control; it can reduce the size of the separation zone by 10~30% after design optimization [28,29]. The height of the MVG is approximately 10~70% of the boundary layer. The streamwise vortex pair generated by the wake of the MVG transports the high-energy airflow in the upper boundary layer into the bottom layer and mixes it with the low-energy airflow to increase the momentum of the low-velocity region near the wall, enhancing its resistance to the adverse pressure gradient and realizing the control of the separation of the boundary layer. Even though the vortices induced by the MVG can reconfigure the downstream boundary layer and the downstream shock wave shows clear deformation or even degeneration under the action of the vortices, the separation of the boundary layer remains severe at other locations in the spanwise direction due to the limited influence range of the vortices induced by MVGs. In addition, the MVG is far from capable of controlling the strong SWBLIs that occur in a finite-width channel [30]. To maximize the performance of the MVG, it is usually necessary to combine and rearrange a series of MVGs [29,31] and place them in suitable positions [32]. Because MVGs must be designed carefully for different configurations with different sizes, arrangements, and mounting positions, an alternative passive control method should be developed.
In this paper, a new technique using micro-surface serrations is developed to weaken shock-induced separations. This approach uses a simple structure and does not make any special demands on installation space. The primary objective of this work is to examine the effectiveness of this concept and to determine the basic effects of the key geometric parameters. The rest of the paper is organized as follows. First, the numerical method and its validation are introduced in Section 2. Then, some details about the control effect of the micro-serrations are described, including an alternative method to determine the location of the separation zone, the influence of the first windward stair, and the influence of the subsequent micro-serrations. A concise conclusion is provided in the final section.

2. Methodology

2.1. Description of the Computational Domain and Boundary Conditions

In this study, the wall micro-serration configuration is composed of a windward stair and subsequent micro-serrations. To capture the main flow characteristics, the computational domain for the numerical simulation is simplified to a two-dimensional case, as shown in Figure 1. The entire domain is filled with a structured mesh. The micro-serrations start at x = 0 and are arranged in a rectangular concave–convex shape with a length of 100, as illustrated in Figure 2. In addition, to eliminate the influence of the first windward stair on the incoming flow, a smooth plate with a length of 10 is set before the initial position. The height of the computational domain is 25. All the variables related to length are dimensionless and are given in terms of the thickness of the incoming boundary layer, except where specifically noted otherwise. The thickness of boundary layer used in the study is 2 mm.
As micro-serrations are described by many parameters, Table 1 provides a summary description of the relevant symbols. For example, h U 0 represents a smooth plate, and h U 0.1 is a small stair of height 0.1. Without loss of generality, if either w or h are equal to zero, these parameters are not labeled when naming the simulation case.
Prior to the simulation, the flow field of a smooth plate is calculated with the same settings, and the corresponding boundary layer thickness section is taken from the plate case as the inlet boundary condition of the subsequent cases so that the initial flow field is obtained. The outlet is set as the pressure outlet condition, the upper boundary is set as the pressure far field condition, and the lower boundary is set as an adiabatic no-slip wall. For all cases, the incoming stagnation pressure p t 0 is 101,325 Pa, and the stagnation temperature T t 0 is 300 K.
Instead of a traditional geometric shock generator, the incident shock is generated by setting discontinuous aerodynamics parameters upstream and downstream of point I on the upper pressure far field boundary [33,34,35]. Specifically, the conditions upstream of point I are set as the incoming flow parameters, i.e., M 0 , p 0 , and T 0 , and the conditions downstream of point I are set as the post-shock parameters with a deflection angle α . In this way, based on the initial flow field, the airflow can be deflected from the upper boundary, thus achieving the purpose, which is to generate an incident shock. Compared to the physical geometric shock generator, the use of this pneumatic shock generator prevents the separation shock of the large-scale separation zone from impinging on the wedge surface of the geometric generator and reflecting. This reflected shock may act on the separation zone on the lower wall again, thus destroying the main flow structure of the SWBLIs [35]. In addition, it can also reduce the complexity of the mesh and improve the computational efficiency.

2.2. Numerical Method

All the calculations in this study are based on the two-dimensional Reynolds-averaged Navier–Stokes (RANS) solver. For the calculation of the flow field, the turbulence model is k - ω shear stress transport (SST), which has been successfully applied to supersonic flows [36,37,38,39]. The fluid is an ideal gas model and is processed as calorically perfect air. Meanwhile, the viscosity coefficient is calculated according to the Sutherland formula. The Roe FDS scheme is utilized for vector flux splitting. As for the spatial discretization, a second-order upwind scheme is used for the gradient term, the flow term, the turbulent kinetic energy term, and the specific dissipation rate term.
The equations to be solved are as follows:
Continuity equation:
ρ u i x i = 0 .
Momentum equation:
ρ u i u j x j = p x i + τ i j x j ,
τ i j = μ u i x j + u j x i 2 3 μ u i x i δ i j .
Energy equation:
u j ρ E + p x j = k t T x j x j + τ i j u i x j ,
where ρ is the density, u i and u j are velocity components, p is the pressure, T is the temperature, E is the total energy per unit mass of fluid, τ i j is the viscous stress tensor, and k t is the heat conduction coefficient. The Einstein summation convention and Kronecker operator δ i j are used in the above equations.
Menter improved the standard k - ω model and first proposed the SST turbulence model [40]. The SST model combines the k - ω turbulence model and the k - ε turbulence model, which are suitable for solving the turbulence near the wall and the free-shear turbulence far away from the wall, respectively. SST realizes a more accurate prediction of the separated flow and the boundary layer flow under the adverse pressure gradient. The SST turbulence model is given by
ρ u j k x j = x j Γ k k x j + G k ρ β * f β * k ω ,
and
ρ u j ω x j = x j Γ ω ω x j + D ω + G ω ρ β f β ω 2 .
In these equations, G k represents the generated turbulence kinetic energy due to mean velocity gradients, G ω represents the generation of ω , and Γ k and Γ ω represent the effective diffusivity of k and ω , respectively. The last terms in Equations (5) and (6) represent the dissipation of k and ω due to turbulence. D ω represents the cross-diffusion term which is defined as
D ω = 2 1 F 1 ρ σ ω 2 1 ω k x j ω x j .
The effective diffusivities for the k - ω model are given by
Γ k = μ + μ t σ k , Γ ω = μ + μ t σ ω ,
where σ k and σ ω are the turbulent Prandtl numbers for k and ω , respectively, which are defined as follows:
σ k = 1 F 1 / σ k 1 + 1 F 1 / σ k 2 , σ ω = 1 F 1 / σ ω 1 + 1 F 1 / σ ω 2 ,
where
F 1 = tanh Φ 1 4 ,
Φ 1 = min m a x k 0.09 ω y , 500 μ ρ y 2 ω , 4 ρ σ ω 2 k D w + y 2 ,
D w + = m a x 2 ρ σ ω 2 1 ω k x j ω x j , 10 20 .
The turbulent viscosity μ t is computed using k and ω as follows:
μ t = ρ k ω 1 m a x 1 a * , S F 2 a 1 ω ,
F 2 = tanh Φ 2 2 ,
Φ 2 = m a x 2 k 0.09 ω y , 500 μ ρ y 2 ω ,
where S is the vorticity magnitude.
The corresponding generation of k and ω is described by
G k = μ t S 2 , G ω = a ω k G k .
The coefficient a is given by
a = a a * a 0 + R e t / R ω 1 + R e t / R ω ,
where
R e t = ρ k μ ω .
In the dissipative terms of k and ω ,
f β * = 1 , χ k 0 , 1 + 680 χ k 2 1 + 400 χ k 2 , χ k 0 ,
f β = 1 + 70 χ ω 1 + 80 χ ω ,
χ k 1 ω 3 k x j ω x j , χ ω = Ω i j 0.09 ω 3 ,
Ω i j = 1 2 u i x j u j x i ,
β * = β i * 1 + 1.5 F M t , β i * = β * 4 15 + R e t / 8 4 1 + R e t / 8 4 ,
β = β i 1 1.5 β i * β i F M t , β i = F 1 β i , 1 + 1 F 1 β i , 2 .
The compressibility function F ( M t ) improves the applicability of the model in free-shear flow at high Mach numbers, and the expressions are given by
F M t = 0 , M t M t 0 , M t 2 M t 0 2 , M t M t 0 ,
M t 2 2 k c 2 , c = γ R T .
The constants in the above expressions are [40,41]: a *   = 1, a = 0.52, a 0 = 1/9, a 1 = 0.34, R ω = 2.95, M t 0 = 0.3, β i , 1 = 0.075, β i , 2 = 0.0828, β * = 0.09, σ k 1 = 1.176, σ ω 1 = 2.0, σ k 2 = 1.0, and σ ω 2 = 1.168. More details can be found in References [40,41].

2.3. Code Validation

Code validation is conducted by comparison with the experimental results obtained by Grossman and Bruce [42]. The simulations match the experimental free-stream conditions with an incoming Mach number of 2.0 and a unit Reynolds number of approximately 2.0 × 10⁷ m−1. The deflection angle of the oblique incident shock is 12°. Figure 3 presents the comparison between the experimental and numerical surface pressure distributions, where the zero of the x-axis, named “CoordinateX”, is the impinging point of the inviscid shock wave and the y -axis is the surface pressure ratio based on the incoming static pressure. The curve obtained by simulation is essentially in agreement with the experimental results, including the starting point of the pressure jump, which suggests the initial position of the separation. It should be noted that the pneumatic shock generator, as mentioned above, is used to generate the incident shock. Therefore, the expansion wave emitting from the end of the wedge shock generator is not considered in this validation; it is also possible that, due to this reason, the pressure obtained from the simulation differs from the experimental results near the reattachment point.
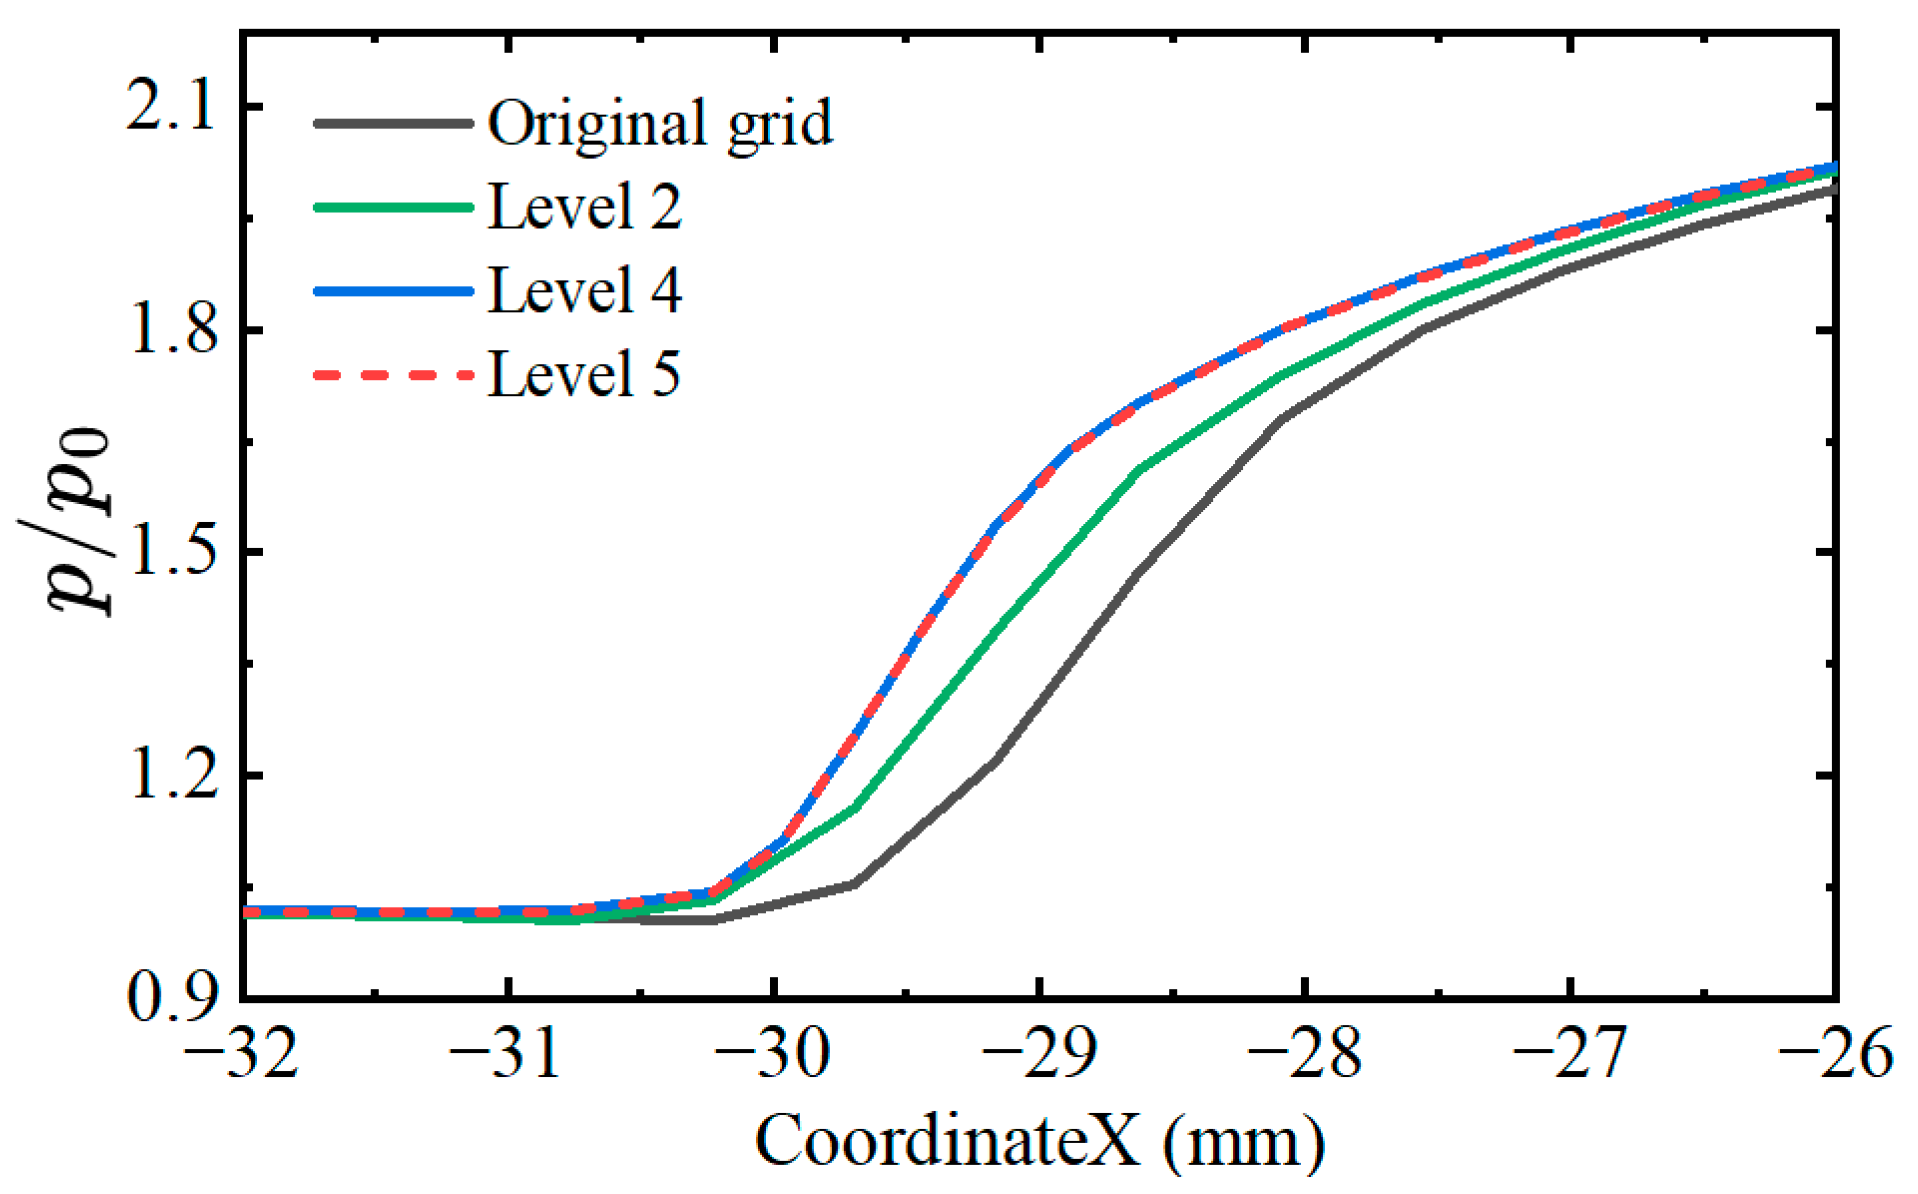
Due to the complexity of the micro-serrations of the lower wall of the computational domain and to save computing resources, we adopted automatic mesh adaptation to capture as much of the flow information as possible. After a certain number of iterations, the cells, whose density gradient is larger than d ρ 0 , will be refined once. In our study, d ρ 0 is 0.002 with an incoming Mach number of 2.5. Figure 4 shows the surface pressure distributions near the separation point with different refinement levels. The corresponding refinement levels are 0, 2, 4, and 5 and are called the original grid, level 2, level 4, and level 5, respectively. A total of 1000 × 400 grids are used originally. The curves from level 4 and level 5 overlap, suggesting that the simulation converges after four refinements. Under these circumstances, the streamwise size of the refined cells is less than 1.5 × 10⁻⁴ m. All of the other cases meet this cell size limitation after refining, and the final number of grid points is approximately 2 × 10⁶. In addition, a slat with a length of 0.1 mm has 7 grid points, and there are more grid points when the slat size is larger.

3. Results and Discussion

3.1. Vorticity-Based Criterion for Separation Assessment

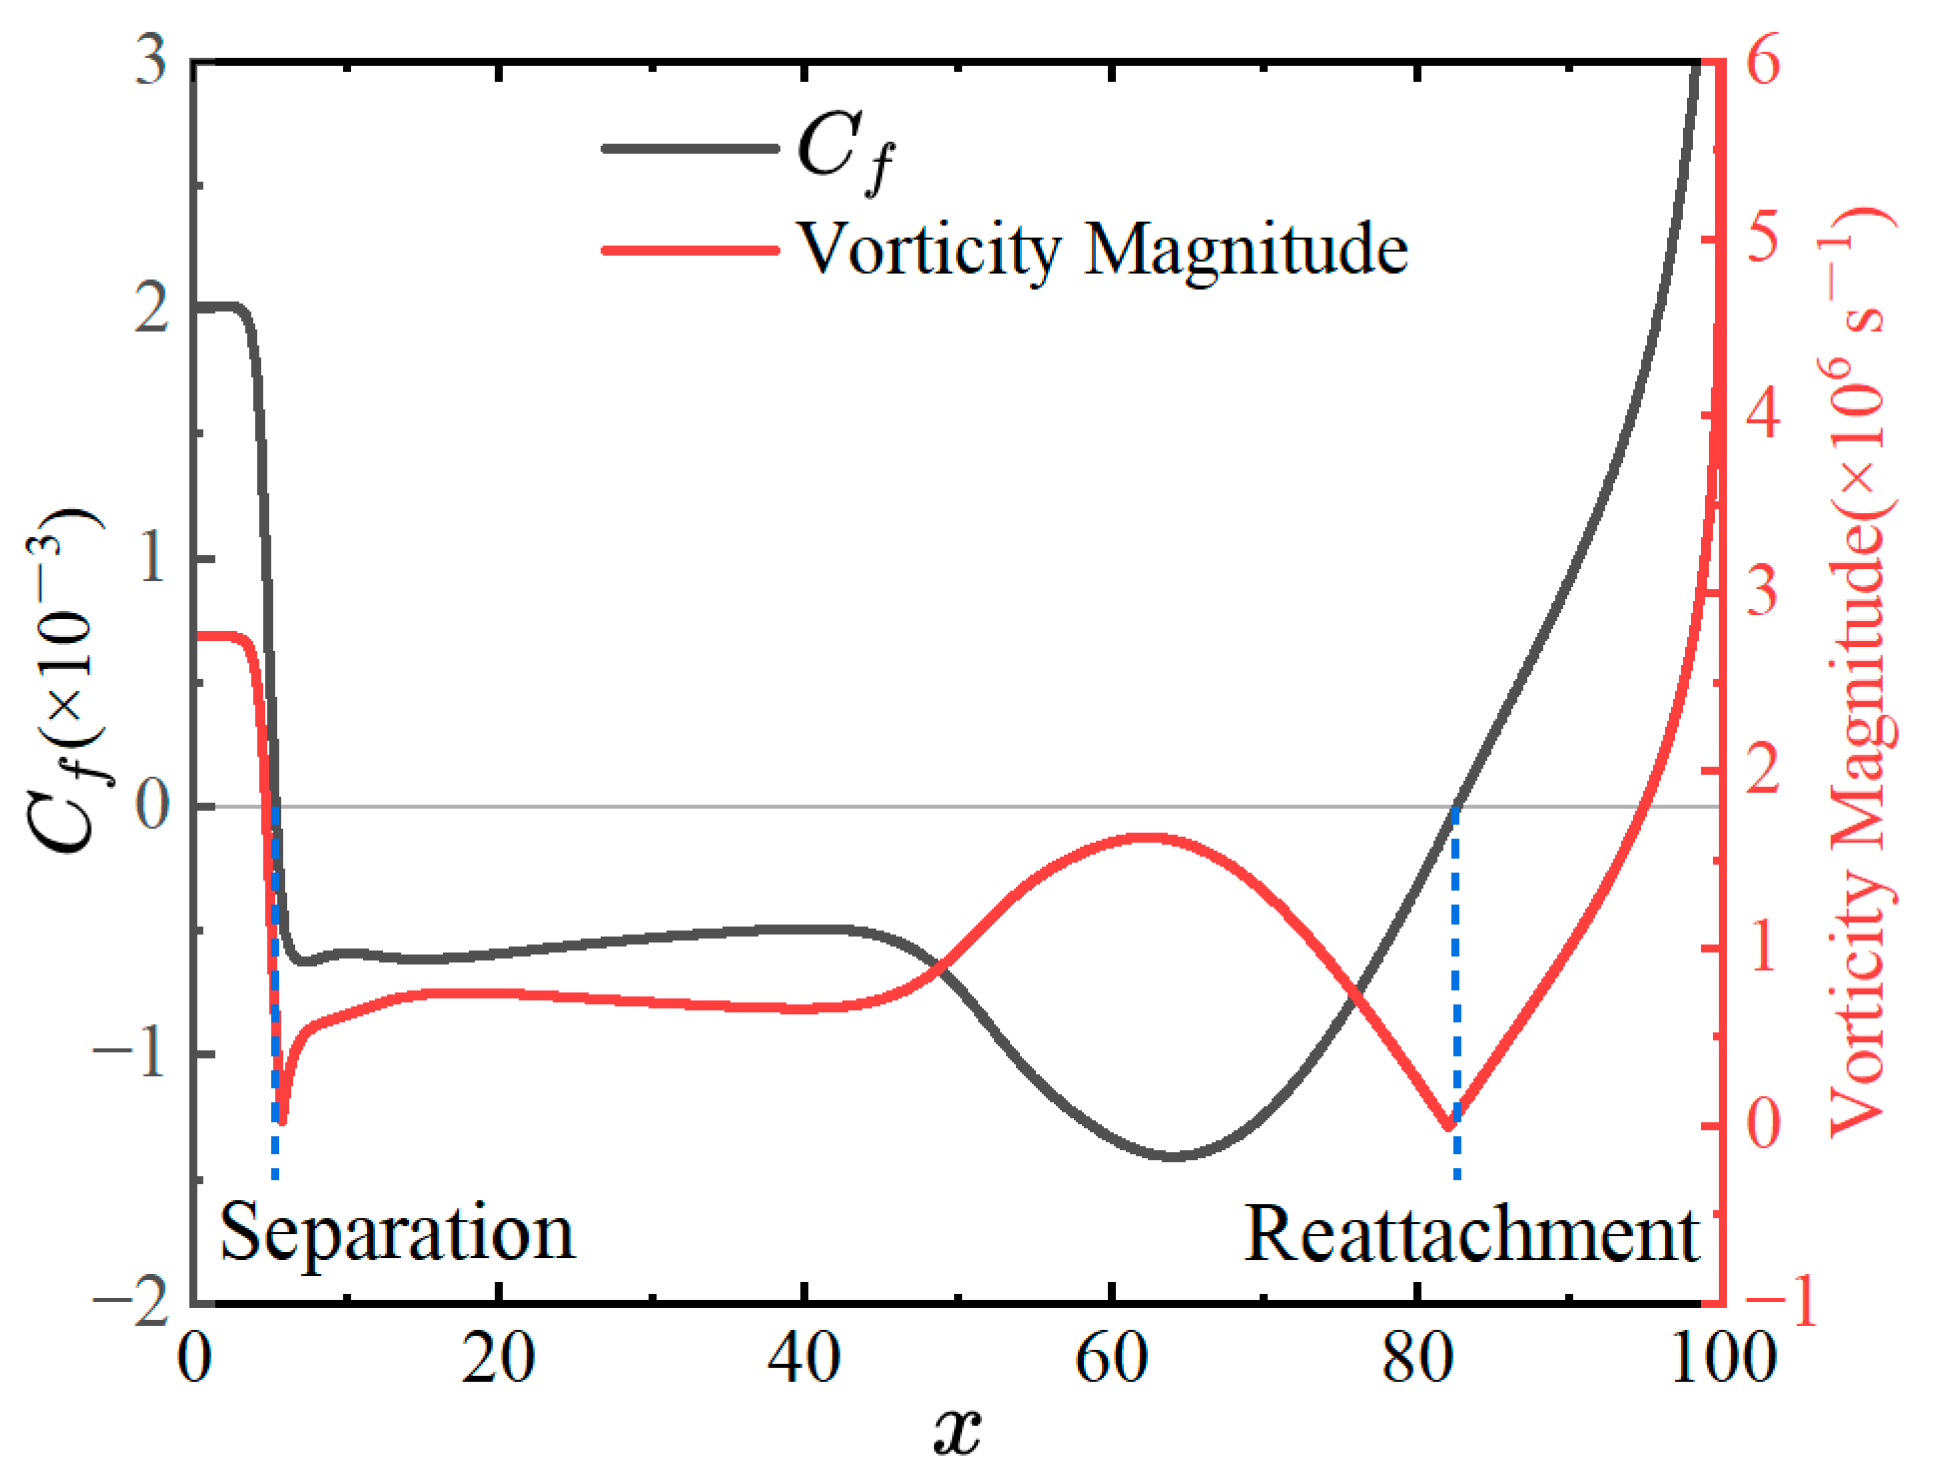
For conventional configurations, i.e., plate or curved surfaces, the skin friction coefficient C f can be utilized to determine the separation and reattachment point of the separation zone [43,44,45]. However, the wall surface with micro-serrations is not geometrically continuous; therefore, the method based on C f is no longer applicable, and a new basis for determining the separation zone must be considered. The analysis of the flow field of SWBLI with micro-serrations found that a sign inversion of the vorticity magnitude gradient appears near the separation point and reattachment point, and this parameter does not depend on the wall profile. Therefore, it can be inferred that the location of the separation zone can be determined by the vorticity magnitude along a line close to the wall.
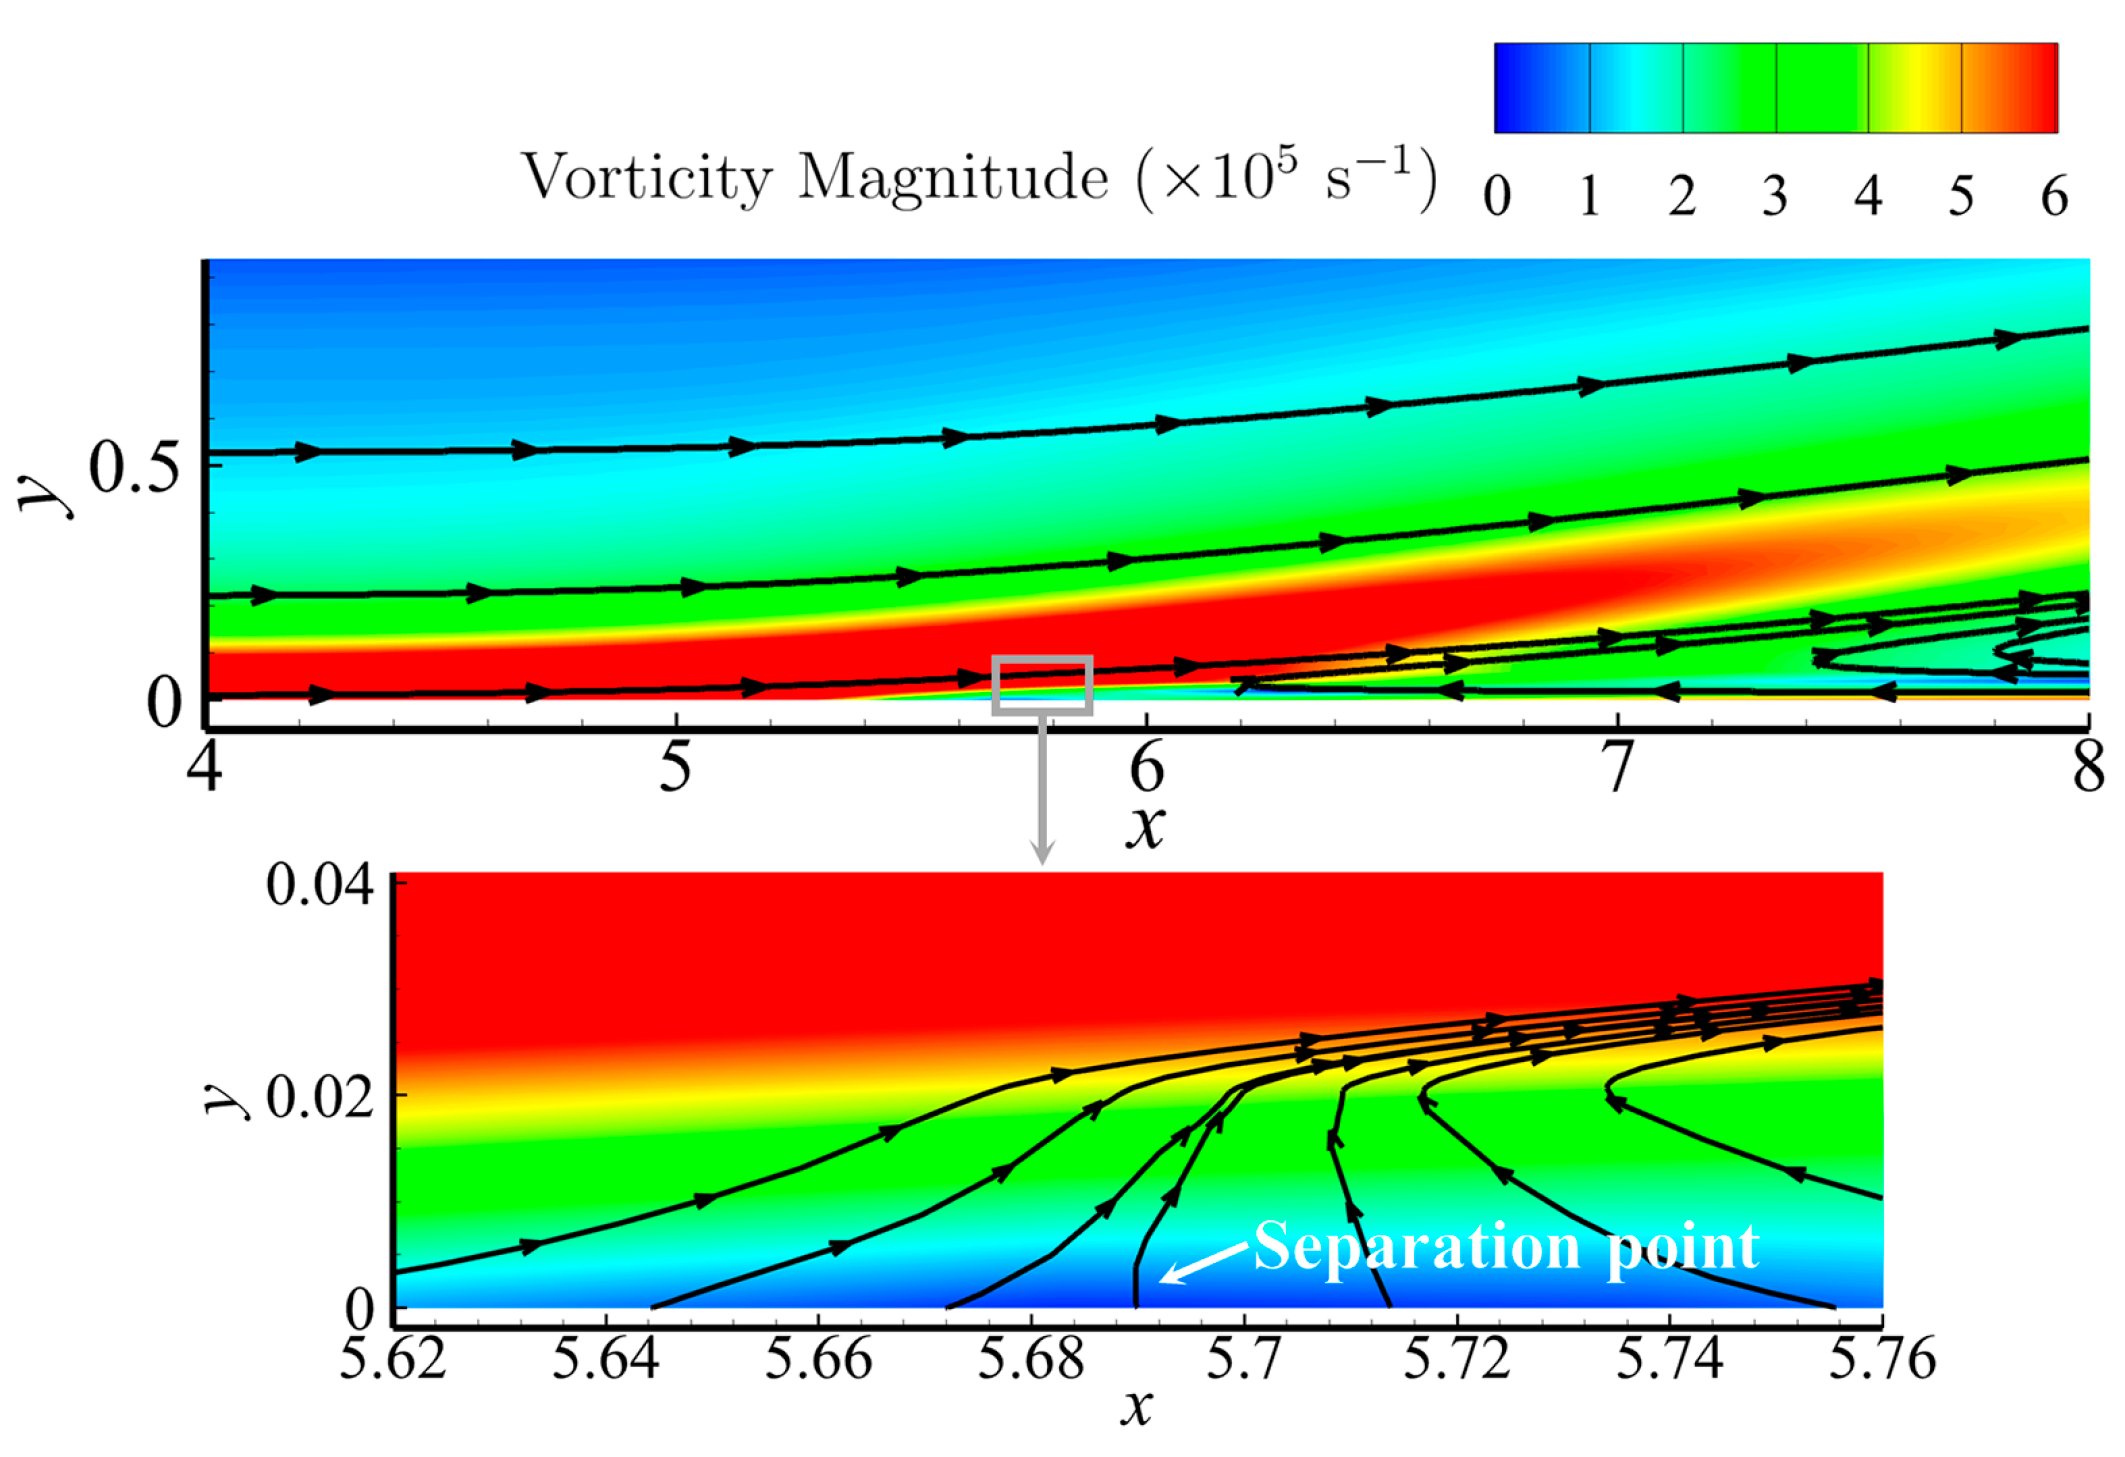
To test the applicability of vorticity magnitude in determining the location of the separation, the obtained results are compared to the numerical results for a typical smooth plate ( M 0 = 2.5, h U = 0, α = 15°, I P = 65). It is observed from the vorticity magnitude contours shown in Figure 5 that when the near-wall streamline is deflected, particularly in the case when the streamline is perpendicular to the wall, the vorticity magnitude is exactly near the extreme point, and this trend is synchronized, providing a preliminary verification of the feasibility of the new method. For a further quantitative evaluation, the C f along the lower wall is compared in Figure 6 with the vorticity magnitude distribution curve. It is easy to find that the vorticity magnitude takes the minimum value which has an essentially one-to-one correspondence with the location of the zero position of C f ; the resulting difference in the length of the separation zone is only approximately 1.14%, as shown in Table 2. This indicates that the minimum value of the vorticity magnitude can be used as an alternative method to determine the location of the separation zone in this study.

3.2. Effects of a Single Stair on Shock-Induced Separation

The wall profile shown in Figure 2 contains a series of convex structures, of which the first stair has the most direct effect on the flow. Because several geometrical parameters describe the micro-serration, the purely stair configurations, i.e., the cases where both w and h are 0, are first studied in detail to obtain preliminary information about the effect of the micro-serration on the separation.
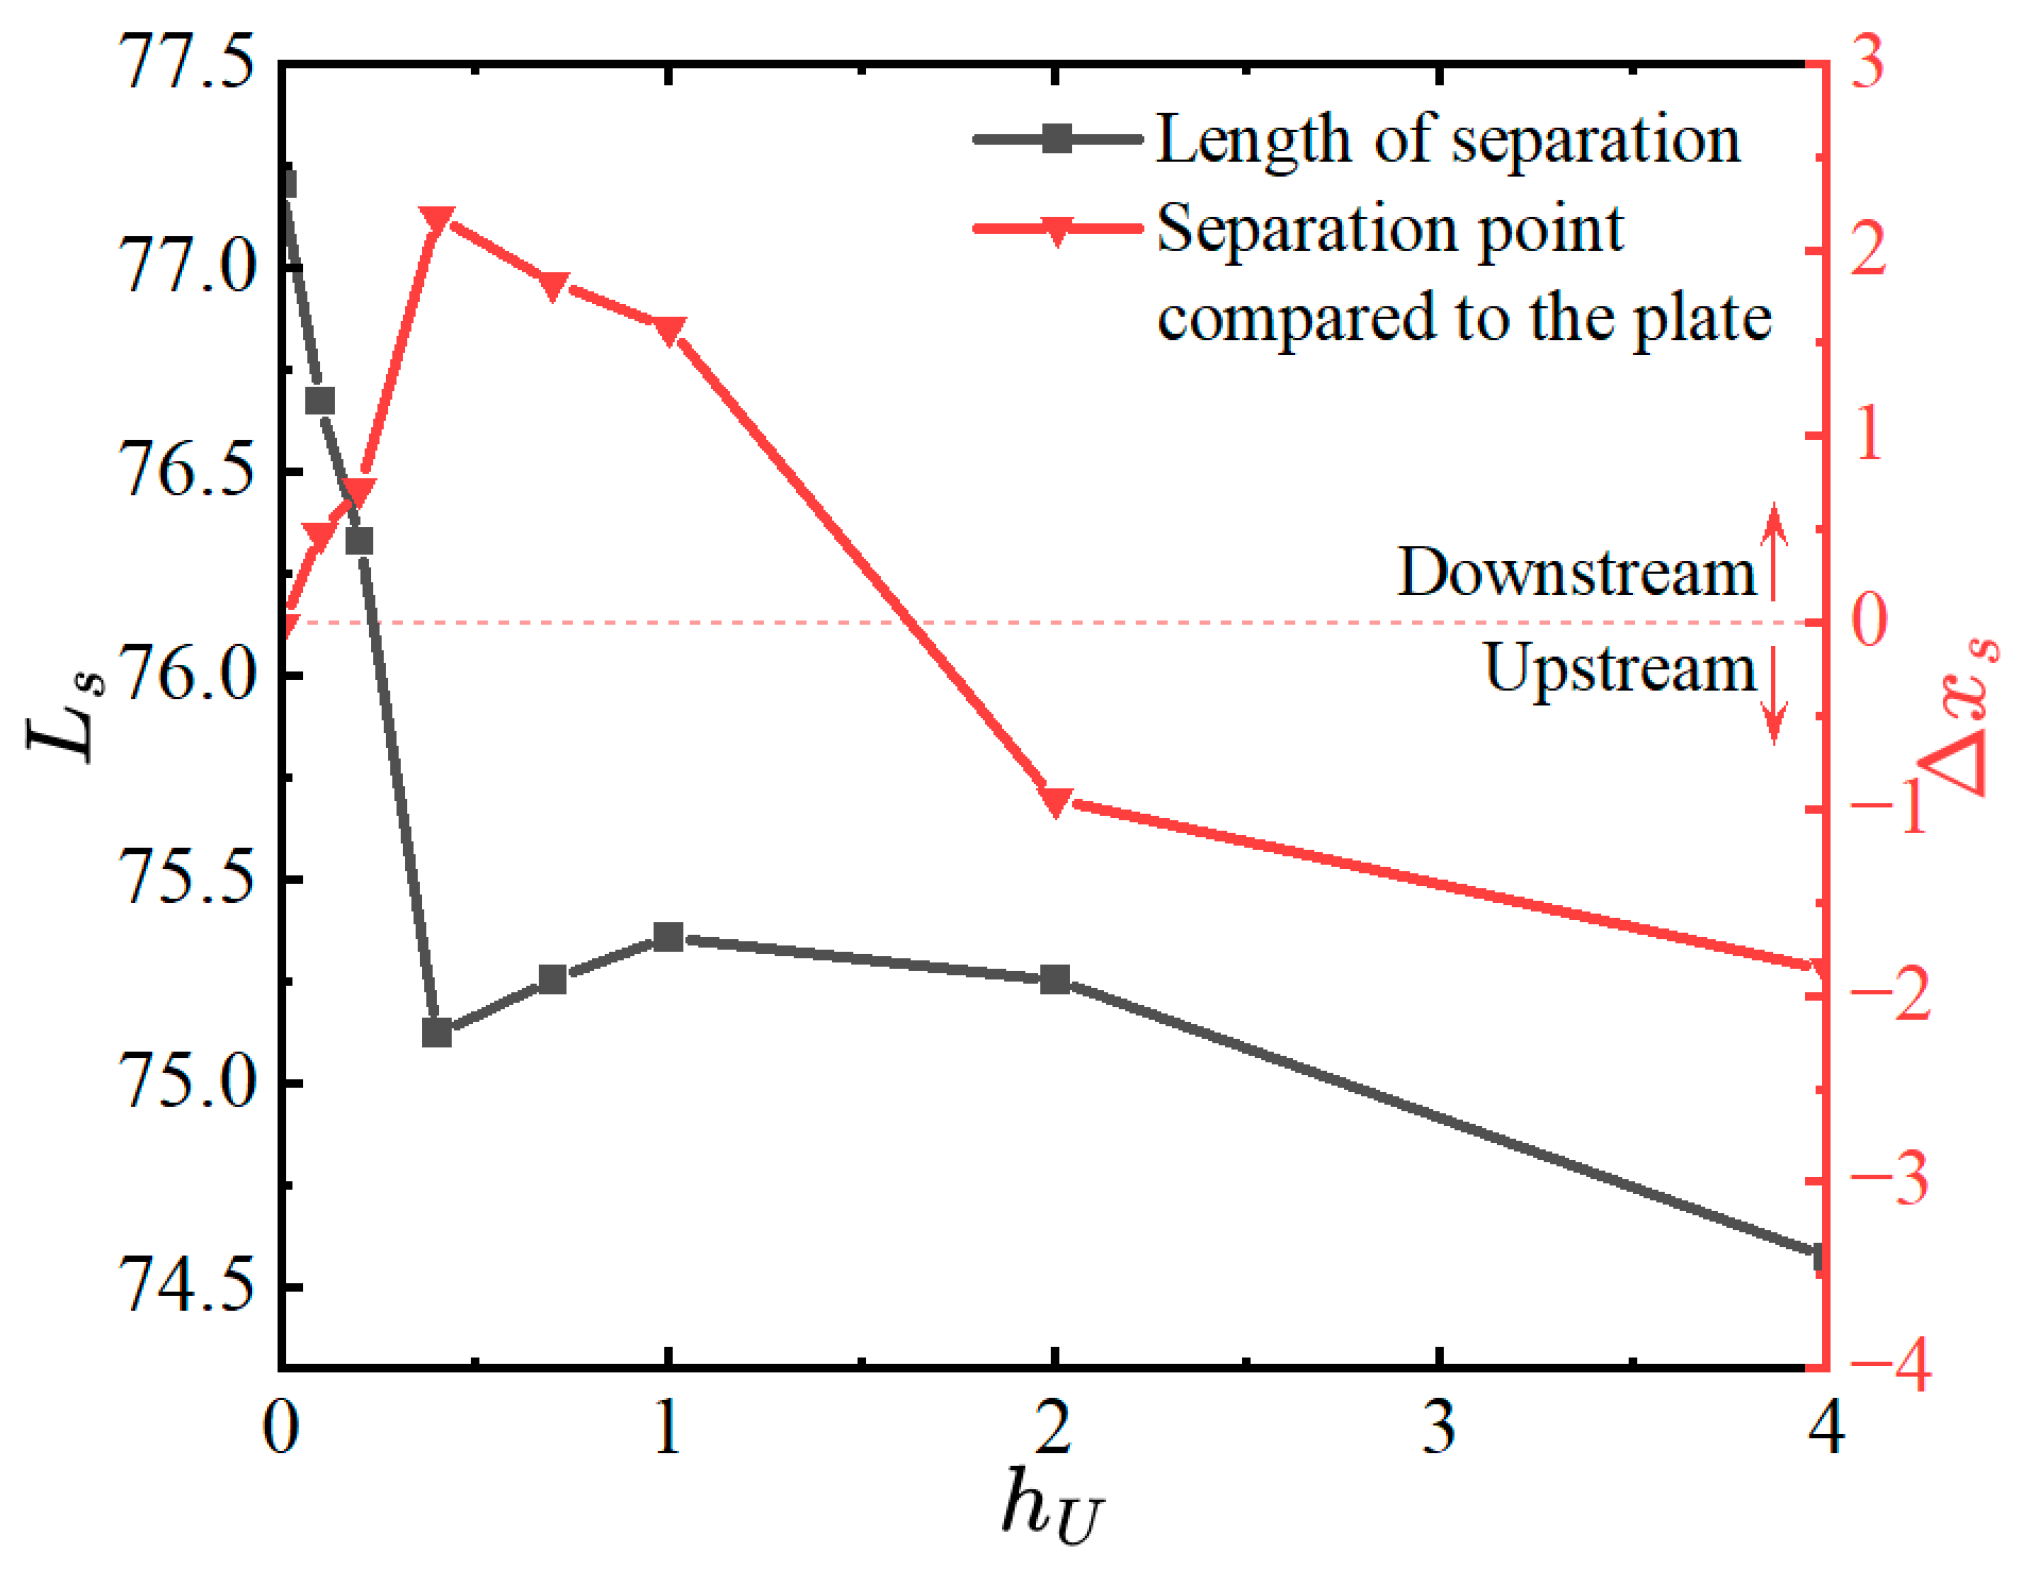
Figure 7 illustrates the numerical results for several stair configurations, with the h U values of 0, 0.1, 0.2, 0.4, 0.7, 1.0, 2.0, and 4.0. The left y -axis is the separation length ( L s ), and the right y -axis represents the position of the separation point compared to that in the plate case ( x s ). It should be noted that L s and x s are given relative to the thickness of the incoming boundary layer and are therefore dimensionless. It is observed from Figure 7 that when the height of the small stair is h U < 0.4, the separation length decreases rapidly and reaches a minimum at h U = 0.4, which is approximately half of the thickness of the incoming boundary layer, and the separation point moves downstream in this range. Then, with increasing h U , the separation length first increases slightly and then decreases. At the same time, the separation point starts to move upstream. Interestingly, the separation length does not vary much when the height of the first stair is close to the thickness of the incoming boundary layer, that is, 0.5 < h U < 2.0.
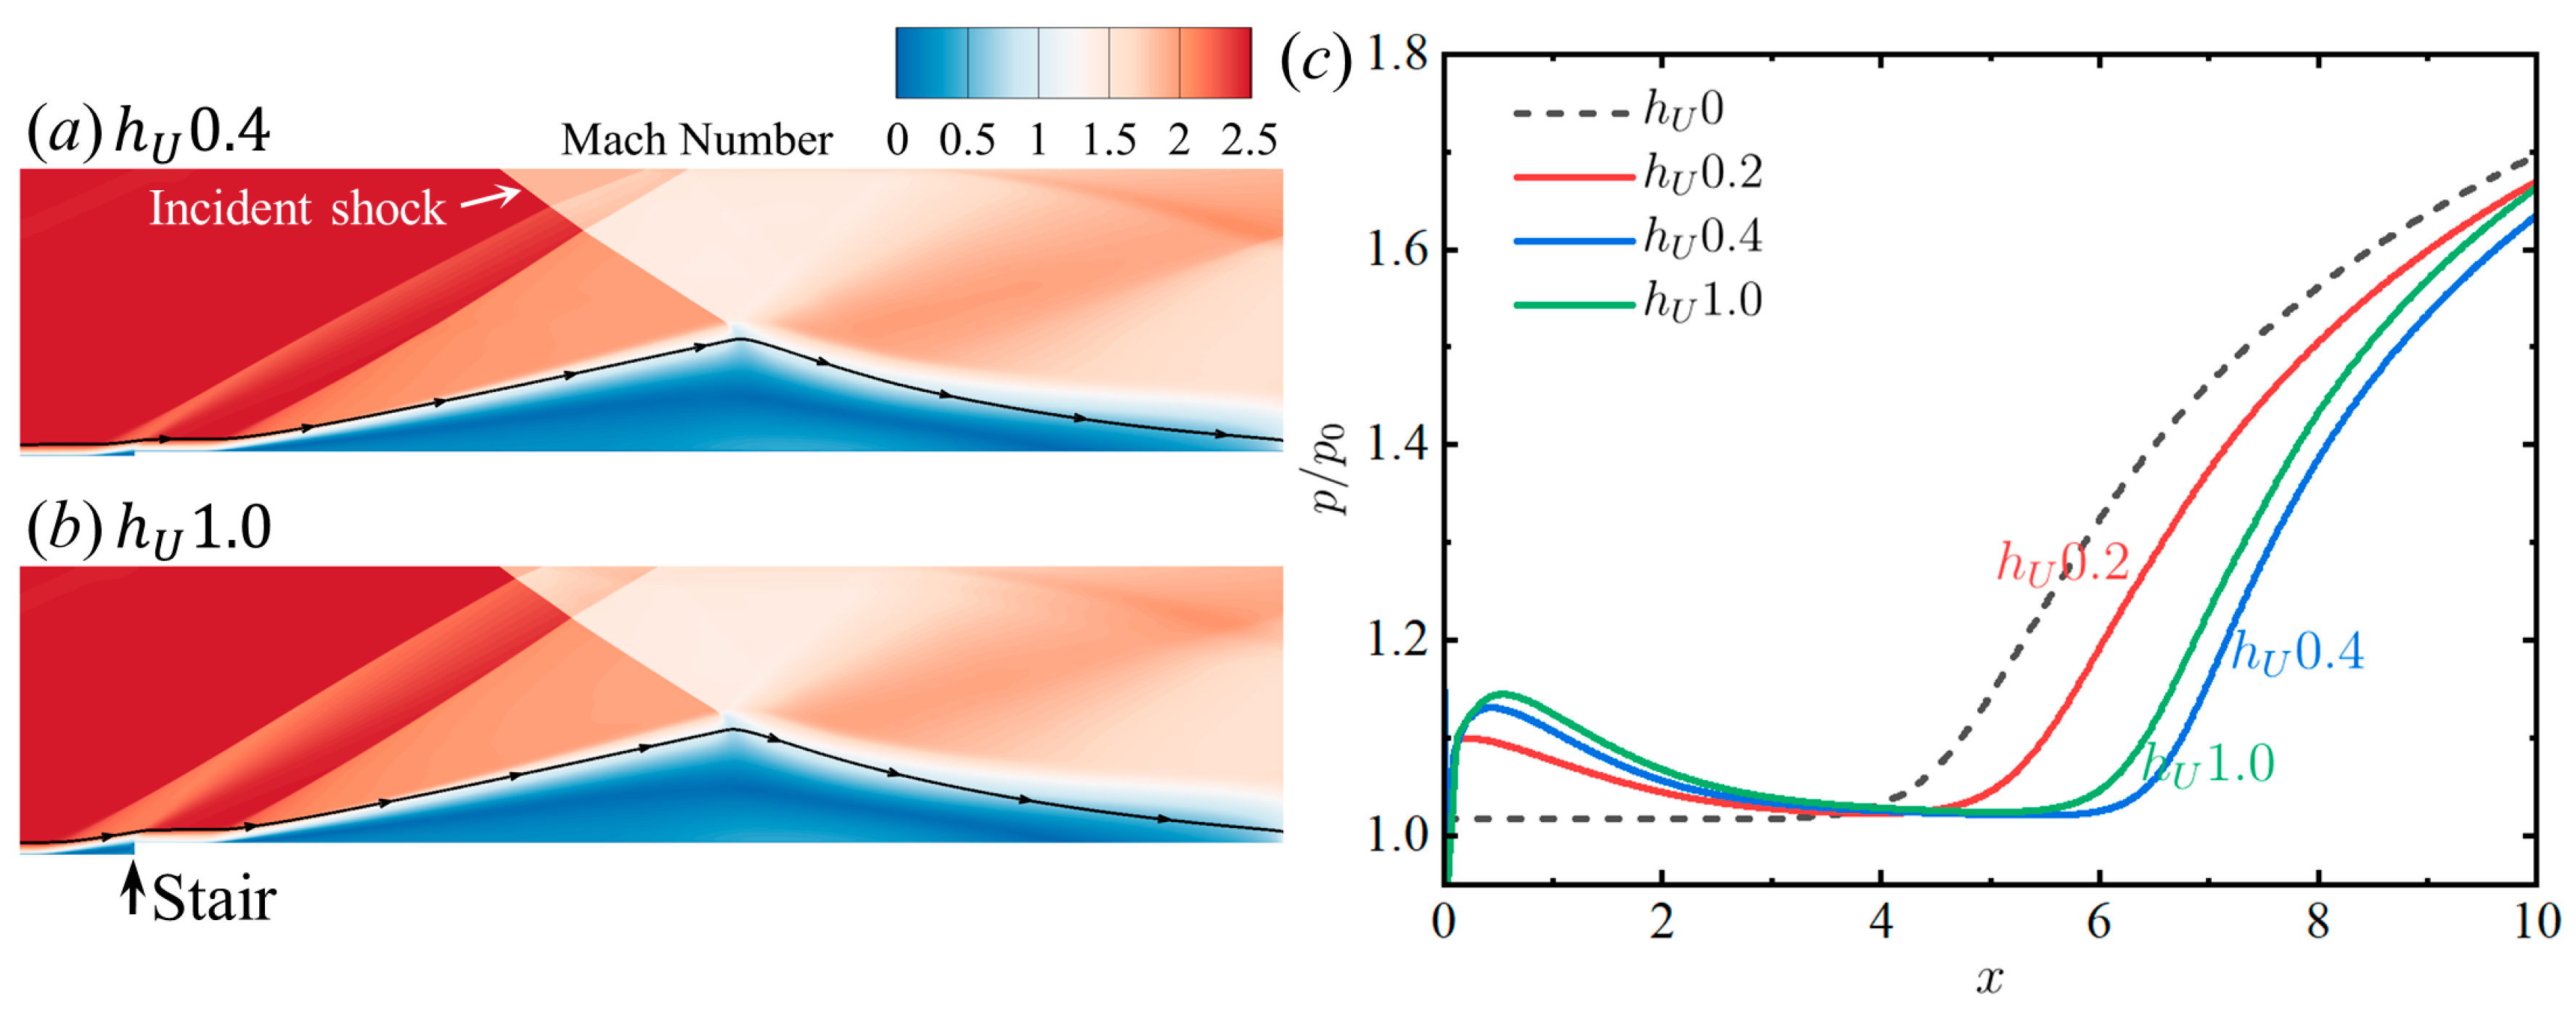
Figure 8a,b show the typical flow field of a pure stair configuration. A small separation that is similar to a pneumatic wedge is generated at the front of the stair. Due to the compression of this small pneumatic wedge, a weak shock wave is formed at the stair and intersects with the incident oblique shock, weakening the intensity of the incident shock to some extent. Additionally, it is also observed from Figure 8c that the local adverse pressure gradient near the separation point is reduced due to the pre-pressurization effect of the compression surface on the windward side. These two effects result in a reduction in the separation length under the influence of the stair. The height of the initial point of the streamlines in Figure 8a,b is equal to the thickness of the incoming boundary layer. After passing through the stair, the height of this streamline in h U 1.0 increases by 9.5% compared to h U 0.4, which can also be considered as an increase in the thickness of the boundary layer in front of the separation point. The thicker boundary layer attenuates the above two beneficial effects of separation control to some extent. Therefore, the separation length increases from h U = 0.4 to h U = 1.0 and the separation point moves upstream. However, the length of the separation zone of the stair configuration is generally smaller than that of the smooth plate.

3.3. Effects of Serration Size on Shock-Induced Separation

The above results indicate that the windward stair has a nonnegligible influence on the separation length, particularly for relatively large stair heights. Thereafter, based on the different effects of the size of h U on the separation length, the control effect of the wall micro-serration on the separation is investigated by taking h U equal to 0.1, 0.4, 1.0, and 4.0 as examples for the three typical cases in which h U is less than, equal to, and greater than the thickness of the incoming boundary layer, respectively.
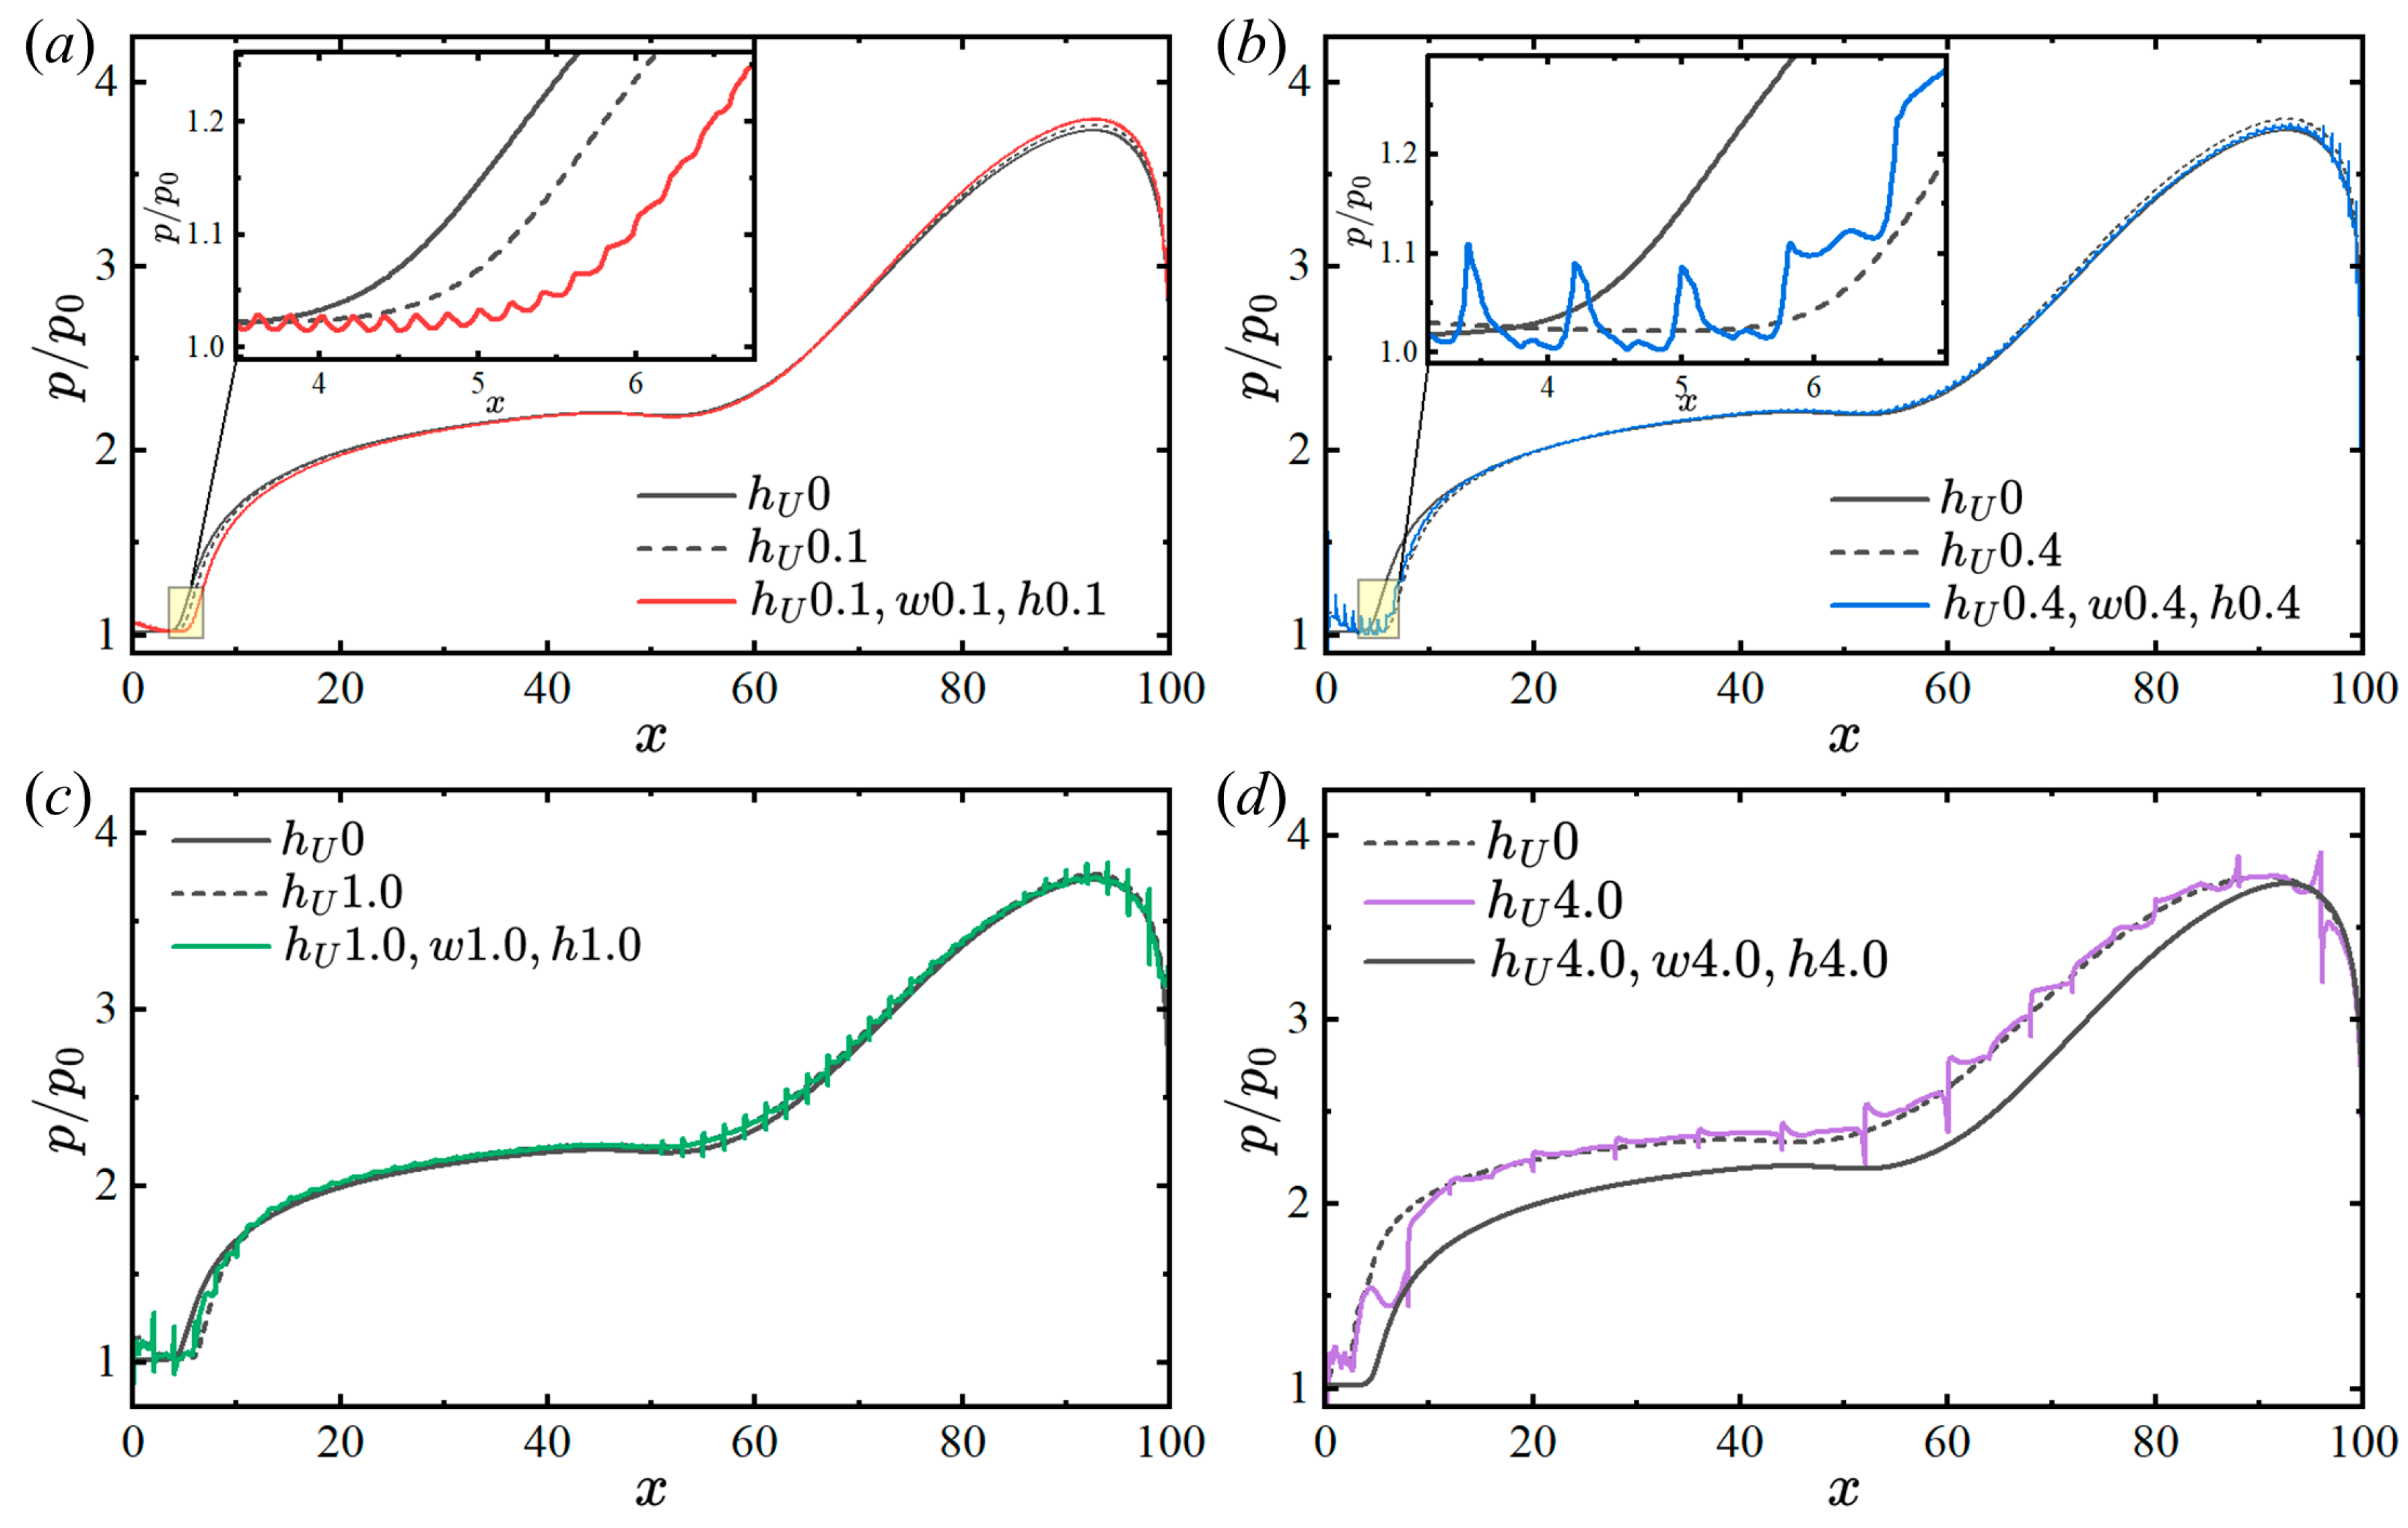
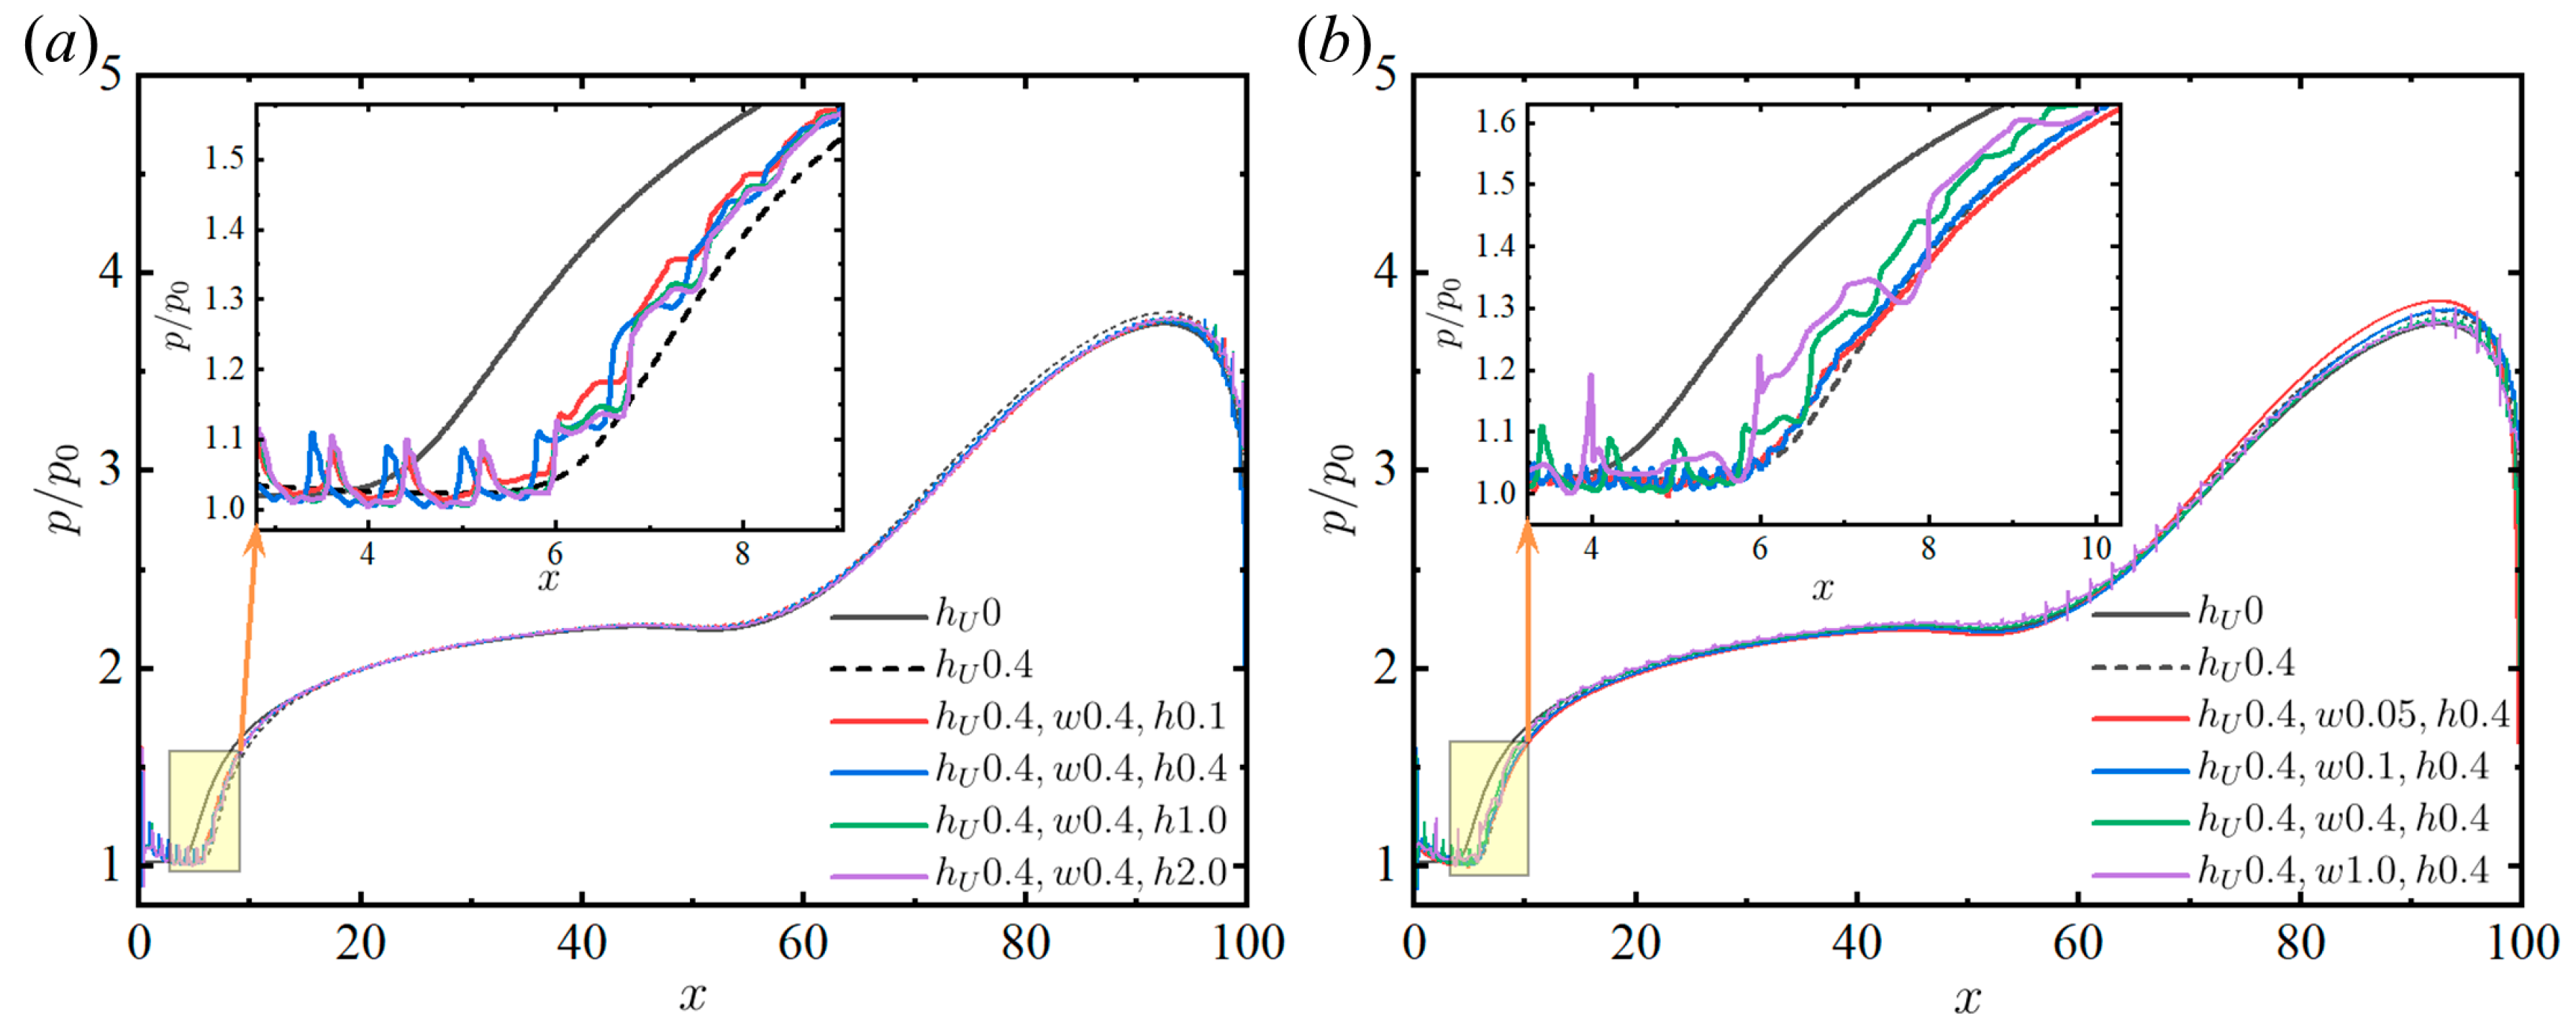
Figure 9 shows the pressure distributions for the different heights of the windward stair and the corresponding micro-serration configurations of equal size under an incoming Mach number of 2.5. The pressure value is taken from the line that is adjacent to the upper surface of the micro-serration, i.e., y = h U . For comparison, the pressure of the plate is also shown in the figure. It is observed that the onset of the pressure disturbance in the pressure distribution curve of the micro-serration configuration at h U = 0.1 clearly lags behind those of the plate and the pure stair. For h U = 0.4, 1.0, or 4.0, if the pressure fluctuation generated by the successive serrations of the wall microstructure is ignored, the pressure distribution curves basically coincide with that of the pure stair, and the pressure is slightly higher than that of the plate. In addition, a significant drop in the pressure for the micro-serration configuration at x = 4 is observed in Figure 9d, which is due to the end of the plateau at x = 4 and the subsequent larger notch. Furthermore, Figure 10 presents the pressure distributions of the micro-serration configurations with different depths and widths at h U = 0.4. The pressure profiles of the micro-serration configurations strongly resemble the pressure profile of the pure stair, indicating the negligible influence from subsequent micro-serrations on the separation length when the height of the first stair is approximately half of the thickness of the incoming boundary layer.
The above results suggest that micro-serration plays a certain role in the control of separation length. On the one hand, from the point of view of the pressure distribution, the large-scale micro-serration configuration is indistinguishable from that of the pure stair. On the other hand, the small-scale micro-serration configuration, although close to the effect of the pure stair, still produces a visible improvement in the control effect, indicating that, with the exception of the first stair, the subsequent micro-serrations still contribute to the flow control. Therefore, the influence laws of other parameters of micro-serrations are further investigated for small scales.
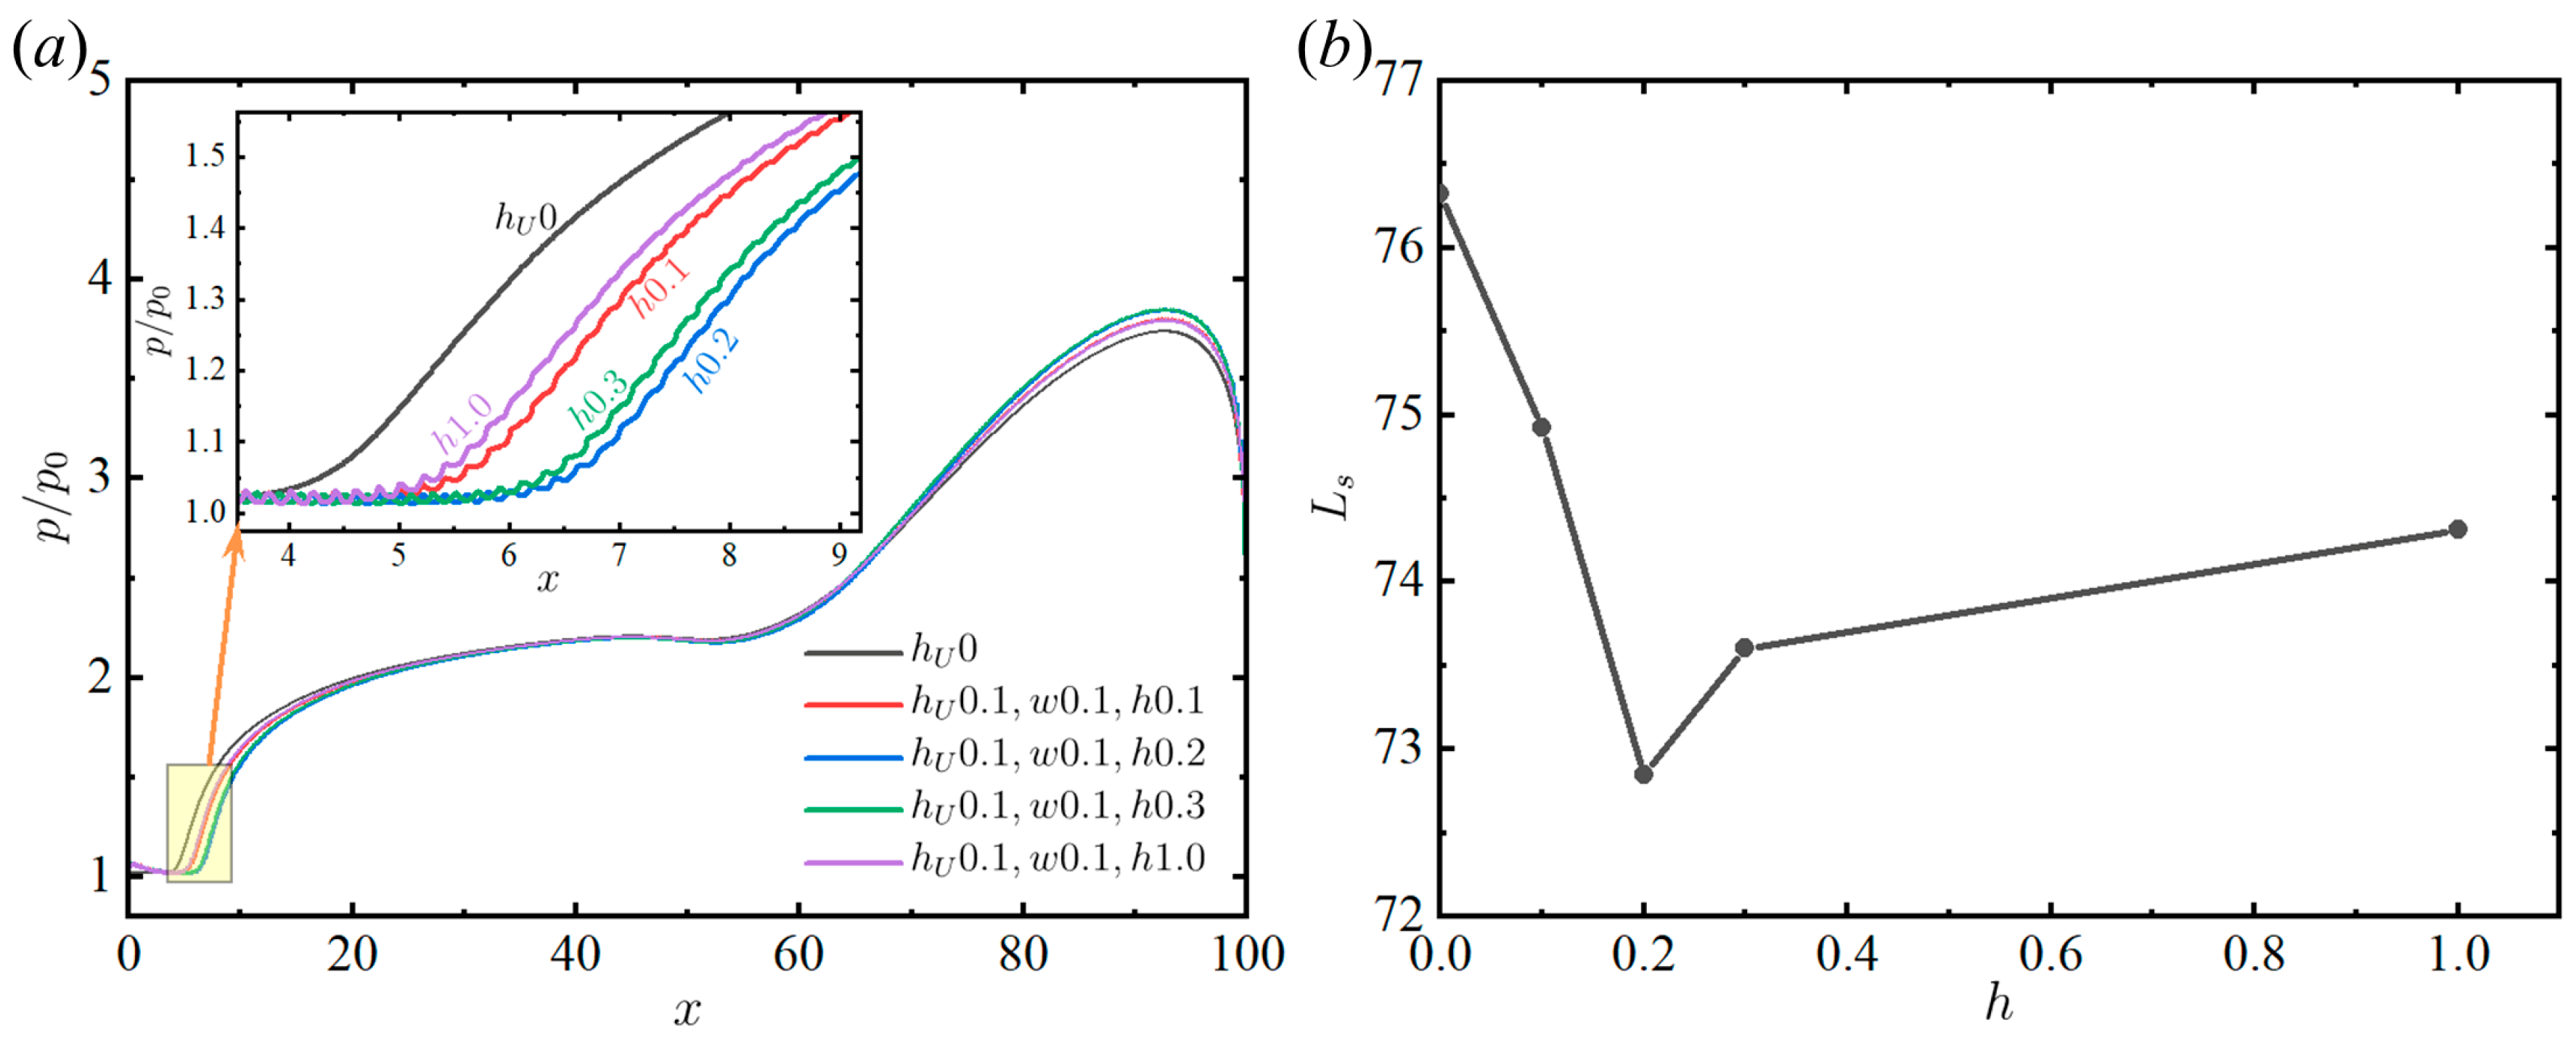
First, the influence of the depth of the micro-serrations in small-scale configurations is examined. Taking h U = 0.1 as an example, Figure 7 shows that this height of the stair has a slight influence on the separation length and the incoming boundary layer. The pressure distributions are shown in Figure 11a, with w = 0.1 unchanged and h = 0.1, 0.2, 0.3, and 1.0. As shown in the locally enlarged figure, the separation length, L s , is the smallest at h = 0.2, which is reduced by 4.56% compared with the smooth plate. As h continues to increase, the onset of pressure disturbance moves upstream, and L s increases concurrently. The comparison of this series of cases, which is summarized in Figure 11b, verifies that L s decreases as h increases within a specific range, beyond which the micro-serrations become less effective in controlling the separation length.
Next, based on the results of Figure 11, the pressure distributions for the depth h = 0.2 and the widths w of 0.025, 0.05, 0.1, and 0.2, are shown in Figure 12a. For comparison, the pressure curve of h U 0.1 is also shown in Figure 12a. The locally enlarged figure demonstrates that the onset of pressure disturbance for w = 0.05 is clearly located further downstream, where it exhibits better control of L s than w = 0.025, 0.1, and 0.2, resulting in a reduction of 9.13% compared to the smooth plate. Even taking into account the 2.69% error mentioned above, this reduction is still appreciable when compared to the original scale of the entire separation zone. To summarize, there exists an optimal width of micro-serrations that yields the best effect on the control of the separation length, and deviations from this optimal width that make it either too large or too small will tend towards the effect of the windward stair of the corresponding size.
The drag is also evaluated for the two-dimensional (2D) cases with a default spanwise distance of 1 m. Taking the plate and h U 0.1- w 0.05- h 0.2 as examples, it is assumed that there is an incoming flow condition on the other side of the wall (plate or micro-serration configuration), which is closer to the actual situation. Compared with 1.859 N for the plate, the drag of the micro-serration is reduced to 1.503 N. It follows that the micro-serration configuration does not introduce additional resistance.
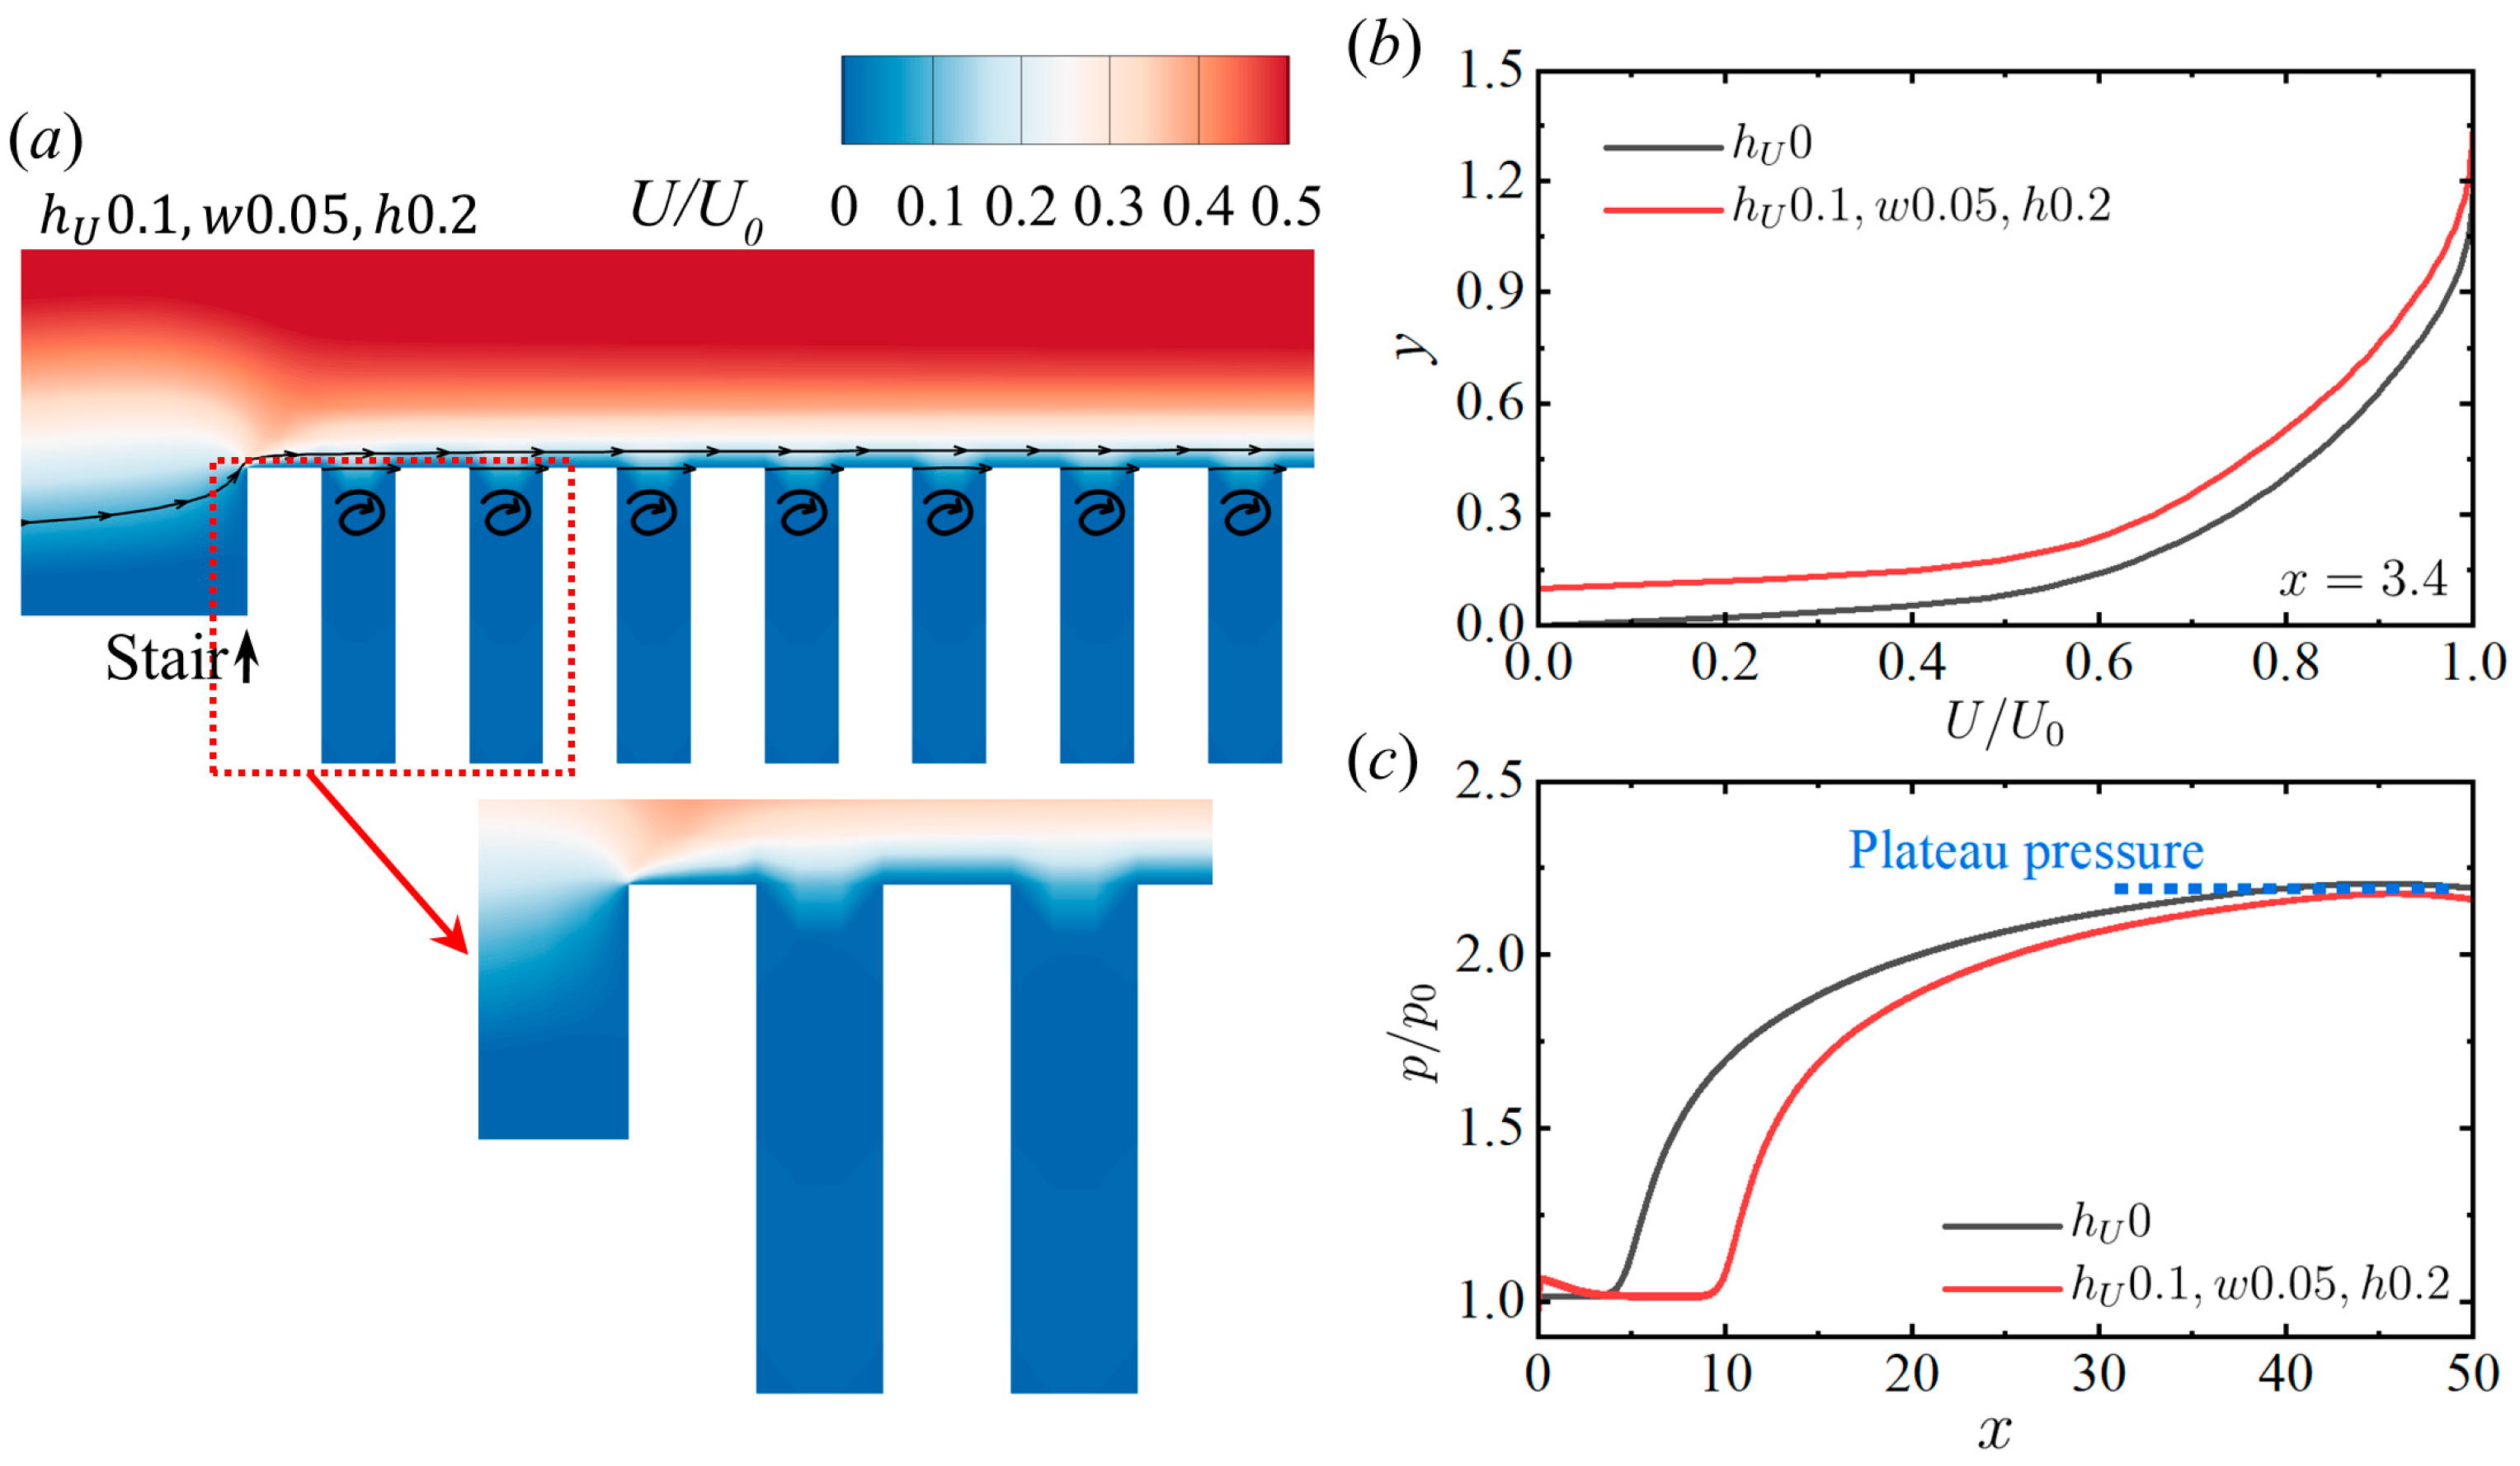
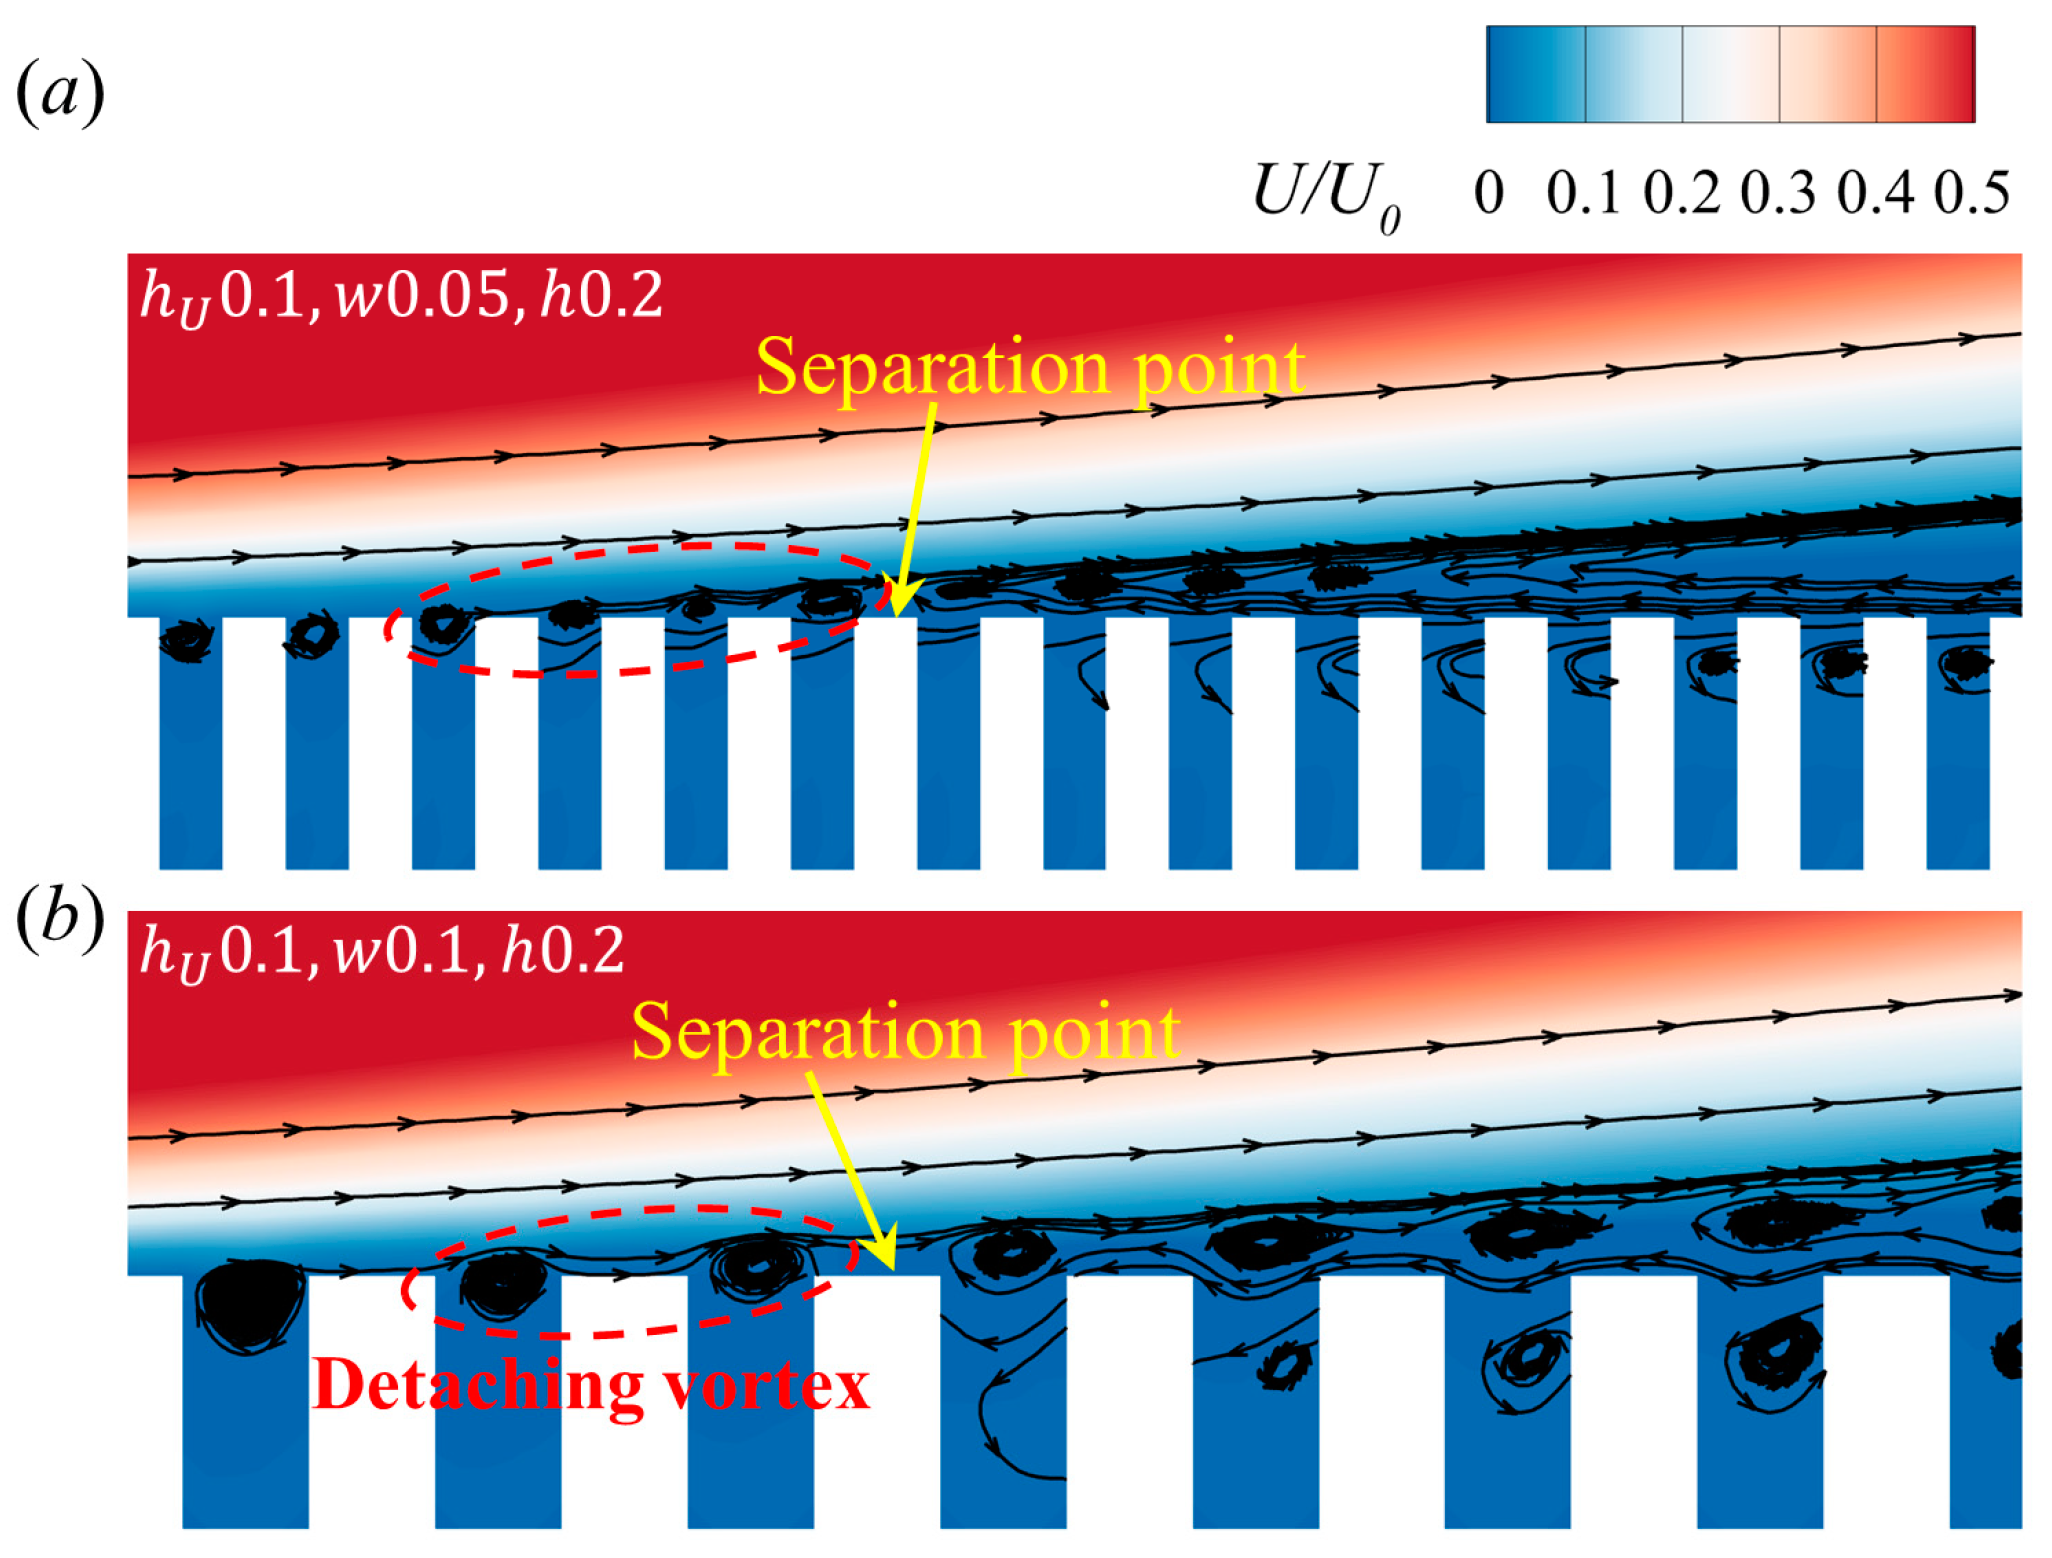
To further explore the role of micro-serrations in separation control, some typical flow fields from the above cases are investigated. Figure 13a displays the flow image near the first stair, revealing a series of vortices formed within the micro-serration. The presence of these vortices entrains high-momentum fluid, locally increasing the velocity near the wall, which is advantageous for separation control, as shown in Figure 13b. Interestingly, the vortices detach from the micro-serration before the separation point (Figure 14). These detaching vortices may increase the capability of the configuration to resist an adverse pressure gradient, as demonstrated in Figure 13c. In addition, as mentioned in the previous section, the effect of these micro-serrations is limited, and the thickening of the boundary layer brought about by the increase in h U will counteract the factors that are beneficial for separation control.
Finally, some speculations are made regarding the origins of the influence of the depth and width of the micro-serration. The impact of the depth of the micro-serration is mainly reflected in the position of the vortex within the micro-serration, as shown in Figure 15. The vortex develops in different locations for different h . A shallower position of the vortex, that is, a vortex that is in closer proximity to the upper surface of the micro-serration, is detached more easily. However, when the vortex is in a deep position, it cannot directly act on the boundary to bring high-momentum fluid. The development in both directions of h results in an optimal depth of the micro-serration. The width of the micro-serration exhibits a similar behavior, as depicted in Figure 14. The width directly determines the number of detaching vortices in front of the separation point, which to some extent represents the resistance that these vortices can provide to the adverse pressure gradient. The vortices in the micro-serration cannot be fully developed when w is too small, and the wall profile tends towards that of the plate when w is too large, which is also reflected in the pressure distributions in Figure 12a.

4. Conclusions

A new separation control method is proposed based on a square-shaped micro-serration configuration, and its control effects are examined in a preliminary investigation. Due to the geometrical discontinuity of the micro-serration, it is imperative to establish a new criterion for the determination of the separation zone. The differences between the separation zone determined by C f and the vorticity magnitude in the plate case are compared, and it is observed that both the separation point and the reattachment point correspond to the minimum vorticity magnitude. The separation length, which is determined by the vorticity magnitude, aligns closely with the separation location found by C f = 0 and can thus serve as a reliable basis for the subsequent quantification of the separation zone. First, the impact of the windward stair on the separation length is investigated; then, three representative sizes are chosen based on the findings from the small stairs to examine the controlling effects of micro-serration with varying sizes. The results show that the height of the stair significantly affects the separation length due to the pre-pressurization effect and the weak shock caused by the windward stair. Generally, the separation length is shorter with high stairs, whereas when the height of the stair exceeds a specific range, the separation point moves upstream, which is unfavorable for separation control. Additionally, when the height of the stair is less than half of the thickness of the incoming boundary layer, the micro-serration plays the dominant role in determining the separation control. However, when the height of the stair is large, the micro-serration becomes essentially ineffective. It is observed from the pressure distributions that the pressure curves of the micro-serration configurations coincide with that of the stair with the corresponding size. Based on this premise, a further investigation is conducted into the potential impacts of other parameters associated with micro-serrations in small-scale configurations. It is found that both the depth and width of the micro-serration exhibit significant effects arising from variations in the vortex positioning and the number of detached vortices. Relative to the plate, the separation length can be reduced by 9.13% using a slightly serrated design with less influence on the incoming boundary layer. In future applications that consider the minor modification of the structure, the micro-serration can be employed together with other techniques, such as MVG, to achieve better control.

Author Contributions

Conceptualization, Q.Z. and H.C.; methodology, F.Y. and H.C.; software, H.C.; validation, Z.G.; formal analysis, F.Y.; investigation, F.Y.; resources, H.C.; data curation, Q.Z. and Z.G.; writing—original draft preparation, F.Y.; writing—review and editing, H.C.; visualization, L.Y.; supervision, H.C.; project administration, L.Y.; funding acquisition, Q.Z. All authors have read and agreed to the published version of the manuscript.

Funding

This research was funded by National Natural Science Foundation of China, grant numbers 12102440, U2141220, and 11902325.

Data Availability Statement

The data supporting the findings of this study are available from the author upon reasonable request.

Conflicts of Interest

The authors declare no conflicts of interest.

References

  1. Huang, W.; Du, Z.B.; Yan, L.; Moradi, R. Flame propagation and stabilization in dual-mode scramjet combustors: A survey. Prog. Aerosp. Sci. 2018, 101, 13–30. [Google Scholar] [CrossRef]
  2. Pasquariello, V.; Grilli, M.; Hickel, S.; Adams, N.A. Large-eddy simulation of passive shock-wave/boundary-layer interaction control. Int. J. Heat Fluid Flow 2014, 49, 116–127. [Google Scholar] [CrossRef]
  3. Zhang, Y.; Tan, H.J.; Wang, Z.Y.; Li, X.; Guo, Y.J. Progress of shockwave/boundary layer interaction and its control in inlet. J. Propuls. Technol. 2020, 41, 241–259. (In Chinese) [Google Scholar] [CrossRef]
  4. Hadjadj, A.; Dussauge, J.P. Shock wave boundary layer interaction. Shock Waves 2009, 19, 449–452. [Google Scholar] [CrossRef]
  5. Meier, G.; Szumowski, A.P.; Selerowicz, W.C. Self-excited oscillations in internal transonic flows. Prog. Aerosp. Sci. 1990, 27, 145–200. [Google Scholar] [CrossRef]
  6. Spaid, F.W.; Frishett, J.C. Incipient separation of a supersonic, turbulent boundary layer, including effects of heat transfer. AIAA J. 1972, 10, 915–922. [Google Scholar] [CrossRef]
  7. Hou, W.T.; Qiao, W.Y.; Luo, H.L. Numerical simulation of effects of film-cooling on interaction between shock wave and boundary layer. J. Propuls. Technol. 2009, 30, 555–560. (In Chinese) [Google Scholar] [CrossRef]
  8. Huang, W.; Chen, Z.; Yan, L.; Yan, B.B.; Du, Z.B. Drag and heat flux reduction mechanism induced by the spike and its combinations in supersonic flows: A review. Prog. Aerosp. Sci. 2019, 105, 31–39. [Google Scholar] [CrossRef]
  9. Zhang, Q.F.; Tan, H.J.; Chen, H. Experimental study of unstart oscillatory flow control of hypersonic inlet with movable slot-plate. J. Propuls. Technol. 2017, 38, 1450–1458. (In Chinese) [Google Scholar] [CrossRef]
  10. He, L.H.; Chen, H.; Yue, L.J.; Zhang, Q.F. Interaction of a shock train with inherent isentropic waves in a curved isolator. Phys. Fluids 2022, 34, 066106. [Google Scholar] [CrossRef]
  11. Ferri, A. Experimental Results with Airfoils Tested in the High-Speed Tunnel at Guidonia. 1940, NACA-TM-946. Available online: https://ntrs.nasa.gov/citations/19930094471 (accessed on 6 September 2013).
  12. Panaras, A.G.; Lu, F.K. Micro-vortex generators for shock wave/boundary layer interactions. Prog. Aerosp. Sci. 2015, 74, 16–47. [Google Scholar] [CrossRef]
  13. Giepman, R.H.M.; Schrijer, F.F.J.; van Oudheusden, B.W. Flow control of an oblique shock wave reflection with micro-ramp vortex generators: Effects of location and size. Phys. Fluids 2014, 26, 066101. [Google Scholar] [CrossRef]
  14. Martis, R.R.; Misra, A. Separation attenuation in swept shock wave–boundary-layer interactions using different microvortex generator geometries. Shock Waves 2017, 27, 747–760. [Google Scholar] [CrossRef]
  15. Rybalko, M.; Babinsky, H.; Loth, E. Vortex generators for a normal shock/boundary layer interaction with a downstream diffuser. J. Propul. Power 2012, 28, 71–82. [Google Scholar] [CrossRef]
  16. Colliss, S.P.; Babinsky, H.; Nübler, K.; Lutz, T. Joint experimental and numerical approach to three-dimensional shock control bump research. AIAA J. 2014, 52, 436–446. [Google Scholar] [CrossRef]
  17. Bruce, P.J.K.; Colliss, S.P. Review of research into shock control bumps. Shock Waves 2015, 25, 451–471. [Google Scholar] [CrossRef]
  18. Li, W.P.; Liu, H. Large-eddy simulation of shock-wave/boundary-layer interaction control using a backward facing step. Aerosp. Sci. Technol. 2019, 84, 1011–1019. [Google Scholar] [CrossRef]
  19. Murugan, J.N.; Govardhan, R.N. Shock wave–boundary layer interaction in supersonic flow over a forward-facing step. J. Fluid Mech. 2016, 807, 258–302. [Google Scholar] [CrossRef]
  20. Slater, J.W. Improvements in modeling 90-degree bleed holes for supersonic inlets. J. Propul. Power 2012, 28, 773–781. [Google Scholar] [CrossRef]
  21. Li, J.; Tian, Y.; Zhong, F.Y.; Yang, S.H. Effects of boundary-layer bleeding on flow field in scramjet combustor. J. Propuls. Technol. 2019, 40, 2700–2707. (In Chinese) [Google Scholar] [CrossRef]
  22. Szwaba, R. Influence of air-jet vortex generator diameter on separation region. J. Therm. Sci. 2013, 22, 294–303. [Google Scholar] [CrossRef]
  23. Reese, B.M.; Collins, E.G., Jr.; Fernandez, E.; Alvi, F.S. Nonlinear adaptive approach to microjet-based flow separation control. AIAA J. 2016, 54, 3002–3014. [Google Scholar] [CrossRef]
  24. Kinefuchi, K.; Starikovskiy, A.Y.; Miles, R.B. Numerical investigation of nanosecond pulsed plasma actuators for control of shock-wave/boundary-layer separation. Phys. Fluids 2018, 30, 106105. [Google Scholar] [CrossRef]
  25. Bisek, N.J.; Rizzetta, D.P.; Poggie, J. Plasma control of a turbulent shock boundary-layer interaction. AIAA J. 2013, 51, 1789–1804. [Google Scholar] [CrossRef]
  26. Yang, G.; Yao, Y.F.; Fang, J.; Gan, T.; Li, Q.S.; Lu, L.P. Large-eddy simulation of shock-wave/turbulent boundary layer interaction with and without SparkJet control. Chin. J. Aeronaut. 2016, 29, 617–629. [Google Scholar] [CrossRef]
  27. Herrmann, D.; Blem, S.; Gulhan, A. Experimental study of boundary-layer bleed impact on ramjet inlet performance. J. Propul. Power 2011, 27, 1186–1195. [Google Scholar] [CrossRef]
  28. Wang, B.; Liu, W.D.; Zhao, Y.X.; Fan, X.Q.; Wang, C. Experimental investigation of the micro-ramp based shock wave and turbulent boundary layer interaction control. Phys. Fluids 2012, 24, 055110. [Google Scholar] [CrossRef]
  29. Blinde, P.L.; Humble, R.A.; van Oudheusden, B.W.; Scarano, F. Effects of micro-ramps on a shock wave/turbulent boundary layer interaction. Shock Waves 2009, 19, 507–520. [Google Scholar] [CrossRef]
  30. Zhang, Y. Flow Control Methods Based on Shape Memory Alloy for Hypersonic Inlets. Ph.D. Thesis, Nanjing University of Aeronautics and Astronautics, Nanjing, China, 2015. (In Chinese). [Google Scholar]
  31. Lu, F.K.; Li, Q.; Liu, C.Q. Microvortex generators in high-speed flow. Prog. Aerosp. Sci. 2012, 53, 30–45. [Google Scholar] [CrossRef]
  32. Pitt Ford, C.; Babinsky, H. Micro-ramp control for oblique shock wave/boundary layer interactions. In Proceedings of the 37th AIAA Fluid Dynamics Conference and Exhibit, Miami, FL, USA, 25–28 June 2007; p. 4115. [Google Scholar] [CrossRef]
  33. Benek, J.A.; Suchyta, C.J.; Babinsky, H. Simulations of incident shock boundary layer interactions. In Proceedings of the 54th AIAA Aerospace Sciences Meeting, San Diego, CA, USA, 4–8 January 2016; p. 0352. [Google Scholar] [CrossRef]
  34. Benhachmi, D.; Greber, I.; Hingst, W.R. Experimental and numerical investigation of an oblique shock wave/turbulent boundary layer interaction with continuous suction. In Proceedings of the 27th Aerospace Sciences Meeting, Reno, NV, USA, 9–12 January 1989; p. 357. [Google Scholar] [CrossRef]
  35. Xie, W.Z.; Yang, S.Z.; Zeng, C.; Liao, K.; Ding, R.H.; Zhang, L.; Guo, S.M. Improvement of the free-interaction theory for shock wave/turbulent boundary layer interactions. Phys. Fluids 2021, 33, 075104. [Google Scholar] [CrossRef]
  36. Huang, H.X.; Tan, H.J.; Sun, S.; Ling, Y. Evolution of supersonic corner vortex in a hypersonic inlet/isolator model. Phys. Fluids 2016, 28, 126101. [Google Scholar] [CrossRef]
  37. Li, N.; Chang, J.T.; Xu, K.J.; Yu, D.R.; Bao, W.; Song, Y.P. Prediction dynamic model of shock train with complex background waves. Phys. Fluids 2017, 29, 116103. [Google Scholar] [CrossRef]
  38. Sekar, K.R.; Karthick, S.; Jegadheeswaran, S.; Kannan, R. On the unsteady throttling dynamics and scaling analysis in a typical hypersonic inlet–isolator flow. Phys. Fluids 2020, 32, 126104. [Google Scholar] [CrossRef]
  39. Tang, D.G.; Li, J.P.; Zeng, F.Z.; Li, Y.; Yan, C. Bayesian parameter estimation of SST model for shock wave-boundary layer interaction flows with different strengths. Chin. J. Aeronaut. 2023, 36, 217–236. [Google Scholar] [CrossRef]
  40. Menter, F.R. Two-equation eddy-viscosity turbulence models for engineering applications. AIAA J. 1994, 32, 1598–1605. [Google Scholar] [CrossRef]
  41. ANSYS Inc. Fluent Theory Guide; ANSYS Inc.: Canonsburg, PA, USA, 2022. [Google Scholar]
  42. Grossman, I.J.; Bruce, P.J. Confinement effects on regular–irregular transition in shock-wave–boundary-layer interactions. J. Fluid Mech. 2018, 853, 171–204. [Google Scholar] [CrossRef]
  43. Matheis, J.; Hickel, S. On the transition between regular and irregular shock patterns of shock-wave/boundary-layer interactions. J. Fluid Mech. 2015, 776, 200–234. [Google Scholar] [CrossRef]
  44. Teramoto, S. Large eddy simulation of shock wave/boundary layer interaction. Trans. Jpn. Soc. Aeronaut. Space Sci. 2005, 47, 268–275. [Google Scholar] [CrossRef]
  45. Wollblad, C.; Davidson, L.; Eriksson, L.-E. Large eddy simulation of transonic flow with shock wave/turbulent boundary layer interaction. AIAA J. 2006, 44, 2340–2353. [Google Scholar] [CrossRef]
Figure 1. Computational domain and boundary conditions.
Aerospace 11 00148 g001
Figure 2. Schematic diagram of micro-serrations.
Aerospace 11 00148 g002
Figure 3. Comparison between experimental [42] and numerical surface pressure distributions.
Aerospace 11 00148 g003
Figure 4. Surface pressure distributions with different refinement levels ( M 0 = 2.5, h U = 0, α = 15°, I P = 65).
Aerospace 11 00148 g004
Figure 5. Computed contour plots of vorticity magnitude and streamline distributions near the separation point ( M 0 = 2.5, h U = 0, α = 15°, I P = 65).
Aerospace 11 00148 g005
Figure 6. Comparison of surface C f and vorticity magnitude distribution ( M 0 = 2.5, h U = 0, α = 15°, I P = 65).
Aerospace 11 00148 g006
Figure 7. Separation length and location of the separation point ( M 0 = 2.5, α = 15°, I P = 65).
Aerospace 11 00148 g007
Figure 8. Contours of the Mach number distributions with stair heights of (a) 0.4 and (b) 1.0 and (c) surface pressure distributions near the separation point ( M 0 = 2.5, α = 15°, I P = 65).
Aerospace 11 00148 g008
Figure 9. Comparison of the pressure distributions for the stair and micro-serration configurations at typical sizes (a) 0.1, (b) 0.4,(c) 1.0 and (d) 4.0 ( M 0 = 2.5, α = 15°, I P = 65).
Aerospace 11 00148 g009
Figure 10. Pressure distributions of micro-serration configurations with different (a) depths and (b) widths at h U = 0.4 ( M 0 = 2.5, α = 15°, I P = 65).
Aerospace 11 00148 g010
Figure 11. (a) Pressure distributions and (b) separation length of micro-serration configurations with different depths at h U = 0.1 ( M 0 = 2.5, α = 15°, I P = 65).
Aerospace 11 00148 g011
Figure 12. (a) Pressure distributions and (b) separation length of micro-serration configurations with different widths at h U = 0.1 ( M 0 = 2.5, α = 15°, I P = 65).
Aerospace 11 00148 g012
Figure 13. Role of vortices in separation control. (a) The vortices in the micro-serrations. (b) Comparison of velocity profiles upstream of the separation point. (c) Pressure distributions before the first pressure plateau ( M 0 = 2.5, α = 15°, I P = 65).
Aerospace 11 00148 g013
Figure 14. Vortices upstream of the separation point with different widths of the micro-serration: (a) w = 0.05, (b) w = 0.1 ( M 0 = 2.5, α = 15°, I P = 65).
Aerospace 11 00148 g014
Figure 15. Location of vortices in the micro-serration with different depths: (a) h = 0.2 and (b) h = 1.0; the micro-serration is not fully displayed ( M 0 = 2.5, α = 15°, I P = 65).
Aerospace 11 00148 g015
Table 1. Some parameters related to SWBLIs in this study.
ParametersExplanations
M 0 Incoming Mach number
h U Dimensionless height of the first windward stair at x = 0
w Dimensionless width of the micro-serration
h Dimensionless depth of the micro-serration
α The deflection angle of incident shock (deg.)
I P The impinging point of the inviscid incident shock at the bottom wall ( x = I P , y = 0)
Table 2. Comparison of the separation zone determined by C f and vorticity magnitude.
Separation PointReattachment PointSeparation Length
C f 5.3282.5377.21
Vorticity magnitude5.6982.0276.33
Disclaimer/Publisher’s Note: The statements, opinions and data contained in all publications are solely those of the individual author(s) and contributor(s) and not of MDPI and/or the editor(s). MDPI and/or the editor(s) disclaim responsibility for any injury to people or property resulting from any ideas, methods, instructions or products referred to in the content.