Abstract
To further increase efficiency and to significantly reduce climate impact in the aviation sector, new propulsion concepts must be developed. As full electrification in mid- and long-range aviation is impractical due to the low gravimetric energy density of batteries, new approaches must be developed. Therefore, the so-called hybrid electric ground demonstrator (HeBo), equipped with a Rolls Royce M250-C20B gas turbine is set up. The test rig serves as a development platform for various new gas turbine-based propulsion concepts for aviation, such as hybrid electric concepts or a novel cycle concept with steam injection to the combustor, which are described in this paper. The main focus of the work is on the experimental setup and the commissioning of the baseline test rig. This will place the test rig in the context of current research activities and serve as reference for subsequent research results.
1. Introduction
Among the different sectors that are undergoing fundamental changes in order to meet the Paris climate agreement, aviation is considered as a “hard to abate” sector. This is characterized by its high energy demand and its lack of scalable electrification solutions, as the gravimetric energy density of batteries is approximately 45 times lower than that of kerosene [1]. Thus, a fully electric flight only appears to be reasonable for small aircraft and over rather short distances. Nevertheless, studies show various feasible approaches to the successful implementation of changes to reduce emissions and achieve higher sustainability levels in aviation.
A significant part of the research is undertaken by targeting a less polluting combustion. As emissions are highly dependent on the fuel being used, the usage of sustainable aviation fuels (SAFs) is the most concrete solution for a significant reduction in climate impact. SAFs are derived from regenerative sources, which means that CO2 abatement on the entire life cycle can be 80% [2]. Furthermore, hydrogen propulsion is another option for full decarbonization and a potentially large reduction in climate impact of the aviation industry, given that green hydrogen is used. Key players in this field are fuel cells, whose usage in planes is investigated in a large number of projects [3,4,5]. Its major disadvantages, however, are the high initial costs, low flexibility and its high mass, where fuel cells fall behind conventional jet engines [6]. A comparison of the climate impact of H2 and SAF-powered turbo jet aircraft fleets is given by Silberhorn et al. [7]. Apart from fuel considerations, additional technical solutions are needed to enable high payload and long-distance air travel with reduced climate impact. Two approaches show high potential in this regard.
The partial electrification of aircraft propulsion systems with power generated by an electric system and a gas turbine has the potential to reduce the environmental footprint of aviation. As shown by Zong et al. [8], a hybrid approach is also able to greatly increase the mission profile of aircraft. Furthermore, several studies have indicated that the overall performance of such systems—when combined in a favorable way—offer considerable benefits and state-of-the-art technology [9,10].
The second promising approach is the water-enhanced turbofan (WET) concept developed by MTU. It has been demonstrated in various electric power plants that stationary gas turbines can be operated under such conditions, but a closed-loop water system has yet to be developed for airborne gas turbines. The effectiveness of the water-enhanced turbofan has been exemplified in various case studies, such as that in the report by Pouzolz et al. [11], in which an efficiency gain of 15% to 20% is estimated. Additionally, a positive impact on non-CO2 effects, such as contrail formation and NOX emissions, is expected [12].
As part of the ongoing cooperative project DINA2030+, and the DLR project EXACT [13], a new test rig at the German Aerospace Center in Stuttgart, Germany has been set up. This paper describes the design of the test rig, intended to address the aforementioned innovative propulsions concepts. The focus of the recent work is on the baseline setup of the test rig, without cycle or hybrid electric modifications. The results of the commissioning tests are presented and the pending investigations in the context of their corresponding projects are described, thus providing a reference for future work on the test rig.
2. State-of-the-Art and Research Topics
To increase gas turbine efficiency and specific power output, a variety of research and development work has been focused on several evolutional aspects, such as increased turbine inlet temperatures, new materials and optimization of components within the boundaries of state-of-the-art turbofan engines. At present, test rigs based on Allison M250-C20B engines (Rolls-Royce, London, UK) are already utilized in several research facilities. Staff at the Technical University of Munich or the University of the German Armed Forces in Munich perform experimental research focusing on the investigation of operational aspects of the gas turbine itself, using an in-house developed FADEC [14,15] and the characterization of its emission behavior [16]. The United States Naval Academy also operates test benches with military derivatives of M250 engines. Part of their research addresses the investigation of water injection after the compressor with mass flow rates up to 3.2% of nominal air flow [17]. Further research has focused on waste heat recovery with CO2 heat exchangers [18,19]. Higher humidification ratios have been investigated by de Paepe et al. in the context of small recuperated stationary gas turbines operated with gaseous fuels [20,21]. Currently existing turbo shaft gas turbine-based test rigs are mounted with eddy current or water brakes for torque generation and are thus not suited for the investigation of hybrid electric concepts. To achieve such an investigation, NASA operates an electric aircraft test bed to investigate hybrid electric concepts; however, this only emulates a turbine engine using electric motors [22].
The test rig described in this work aims to investigate conceptual changes to a potential flight application of gas turbine engines. After the commissioning and baseline characterization, the novel WET concept with water-to-gas ratios [23] of up to 20% will, alongside the project partners MTU und the university of Stuttgart, be initially demonstrated. In a later stage, the gas turbine test rig is integrated into a full hybrid electric setup, enabling the research of different combined usages of electric and gas turbine propulsion. The corresponding principles are explained in the subsequent sections.
2.1. Water-Enhanced Turbofan
Gas turbines with air–steam mixtures as the working fluid promise high efficiencies and high specific power outputs. The idea behind it is that injecting water or steam to the combustor increases the mass flow rate through the turbine. While the compressor work remains the same, the work required to pressurize the additional water is much lower compared with air. Hence the specific power output is increased. Additionally, a higher cycle efficiency is achieved when exhaust energy is recovered to preheat water or generate steam. Many different cycles with water or steam injection have been introduced in the past, although only a few have been commercialized [24]. The main drivers for gas turbine humidification include a higher power output and efficiency, a decreased formation of NOx in the combustor and a reduced power output degradation caused by high ambient temperatures or low ambient pressures. Lupandin et al. [25] describe the benefits of steam injection in combination with a water recovery system for industrial gas turbines. A different approach is shown by Utamura et al. [26], who achieved a reduction in compressor exit temperature and specific compressor work by injecting atomized water droplets into the compressor.
Despite the great potential in boosting efficiency and lowering emissions, commercial use of such technology is currently limited to stationary applications, even though aeroderivative gas turbines of this field appear to be better suited. Due to their larger compressor surge margin they are less likely to be afflicted by compressor stalls when steam is injected [23]. Currently steam injection in aircraft applications is only used to increase thrust during the takeoff [27].
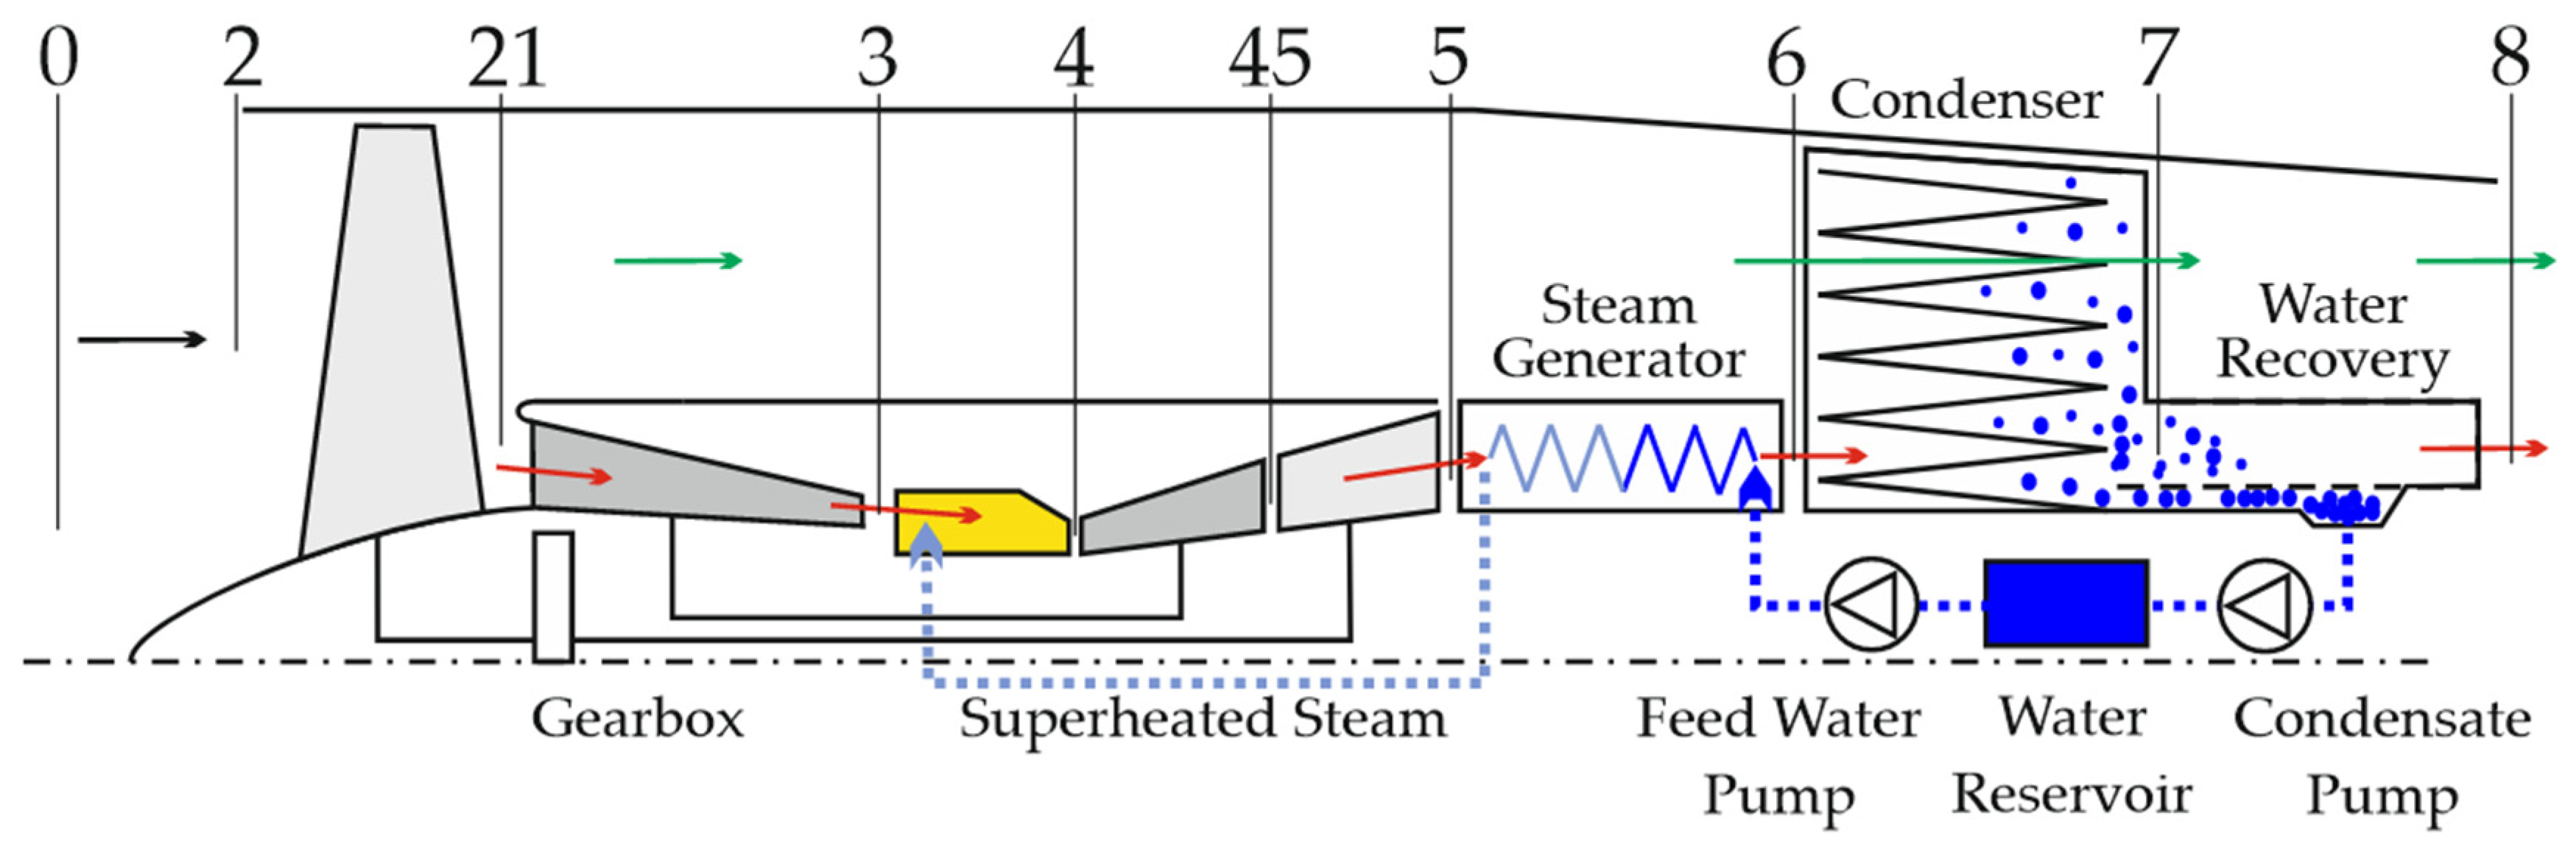
The novel WET concept utilizes residual heat from the engine exhaust gas to vaporize water, which is then, in the form of steam, injected into the combustion chamber. Schmitz et al. [28] present considerations of water-to-air ratios of up to 40%. To avoid carrying large amounts of water, a closed water–steam cycle needs to be established. Therefore, water is regained from the exhaust gas by means of the aforementioned vaporizer, a subsequent condenser and eventually a water recovery unit. A scheme of the concept is presented in Figure 1. The WET concept is foreseen for future generations of geared turbofans. It is compatible with kerosene, sustainable aviation fuels (SAFs) or hydrogen, and it is suitable for all kinds of routes.
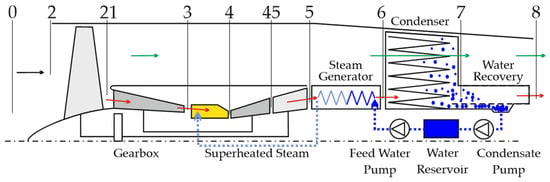
Figure 1.
Schematics of the proposed steam injecting and recovering aero-engine or WET concept adopted from Schmitz et al. [29] with numbers indicating engine stations and arrows representing the air flow that divides into core and bypass flow.
The effectiveness of the WET engine concept has been exemplified in various papers. As stated by Schmitz et al. [28] the mixing of compressed air and steam before combustion is expected to reduce fuel burn and carbon dioxide emissions by about 10 to 15%. Due to lower flame temperatures, the formation of NOX can be largely reduced compared with state-of-the-art engines. Furthermore, due to the reduction of particulate matter and water emissions, contrail formation can be reduced or even avoided. According to Pouzolz et al. [11], contrails and the subsequent effects of NOX have an effect on climate change in the same order of magnitude as emitted CO2. Thus, the climate impact can be significantly reduced.
2.2. Hybrid Electric Concepts
Hybrid electric concepts combine the benefits of electric drives with conventional or novel, fuel-based engine technology. It may become the enabler that allows the use of electric propulsion in short- and mid-range aircraft. Hence, most major OEMs in aviation pursue development projects.
Over the recent years, various concepts have been investigated. However, most authors identify the battery as the main critical parameter for the success of fully electric or hybrid electric aircraft designs. It is commonly agreed that hybrid electric aircrafts, with a combination of electrically driven propellers and gas turbine propulsion, have the potential to reduce fuel consumption and emissions, while also improving operational efficiency, reliability and reducing noise [30]. The potential in fuel burn reduction is predicted to be between 8% [31] and 20% [32], depending on the hybrid configuration. Furthermore, Bradley et al. [33] see the potential to reduce landing and take-off NOX emissions by 89% to 93%, as well as cruise emissions by 74%. They also find that electrified propulsion will have a positive effect on noise reduction. These advantages can be complemented with lower maintenance costs, as described by Réndon et al. [30], who expect a saving potential of 50%.
3. The Test Rig’s Main Objectives
The hybrid electric ground demonstrator, referred to in the following as a HeBo test rig, and its purpose as demonstrator of the WET concept, are first mentioned by Schmitz et al. [29]. Marcellan et al. [23] have described the numerical characterization of the M250-C20B gas turbine, designated as the basis for the HeBo rig in baseline configuration and with WET cycle modifications, based on literature data. Further, they have introduced the application of the rig as a testbed for hybrid electric concepts. To investigate both concepts, the test rig is currently utilized in two projects, as follows.
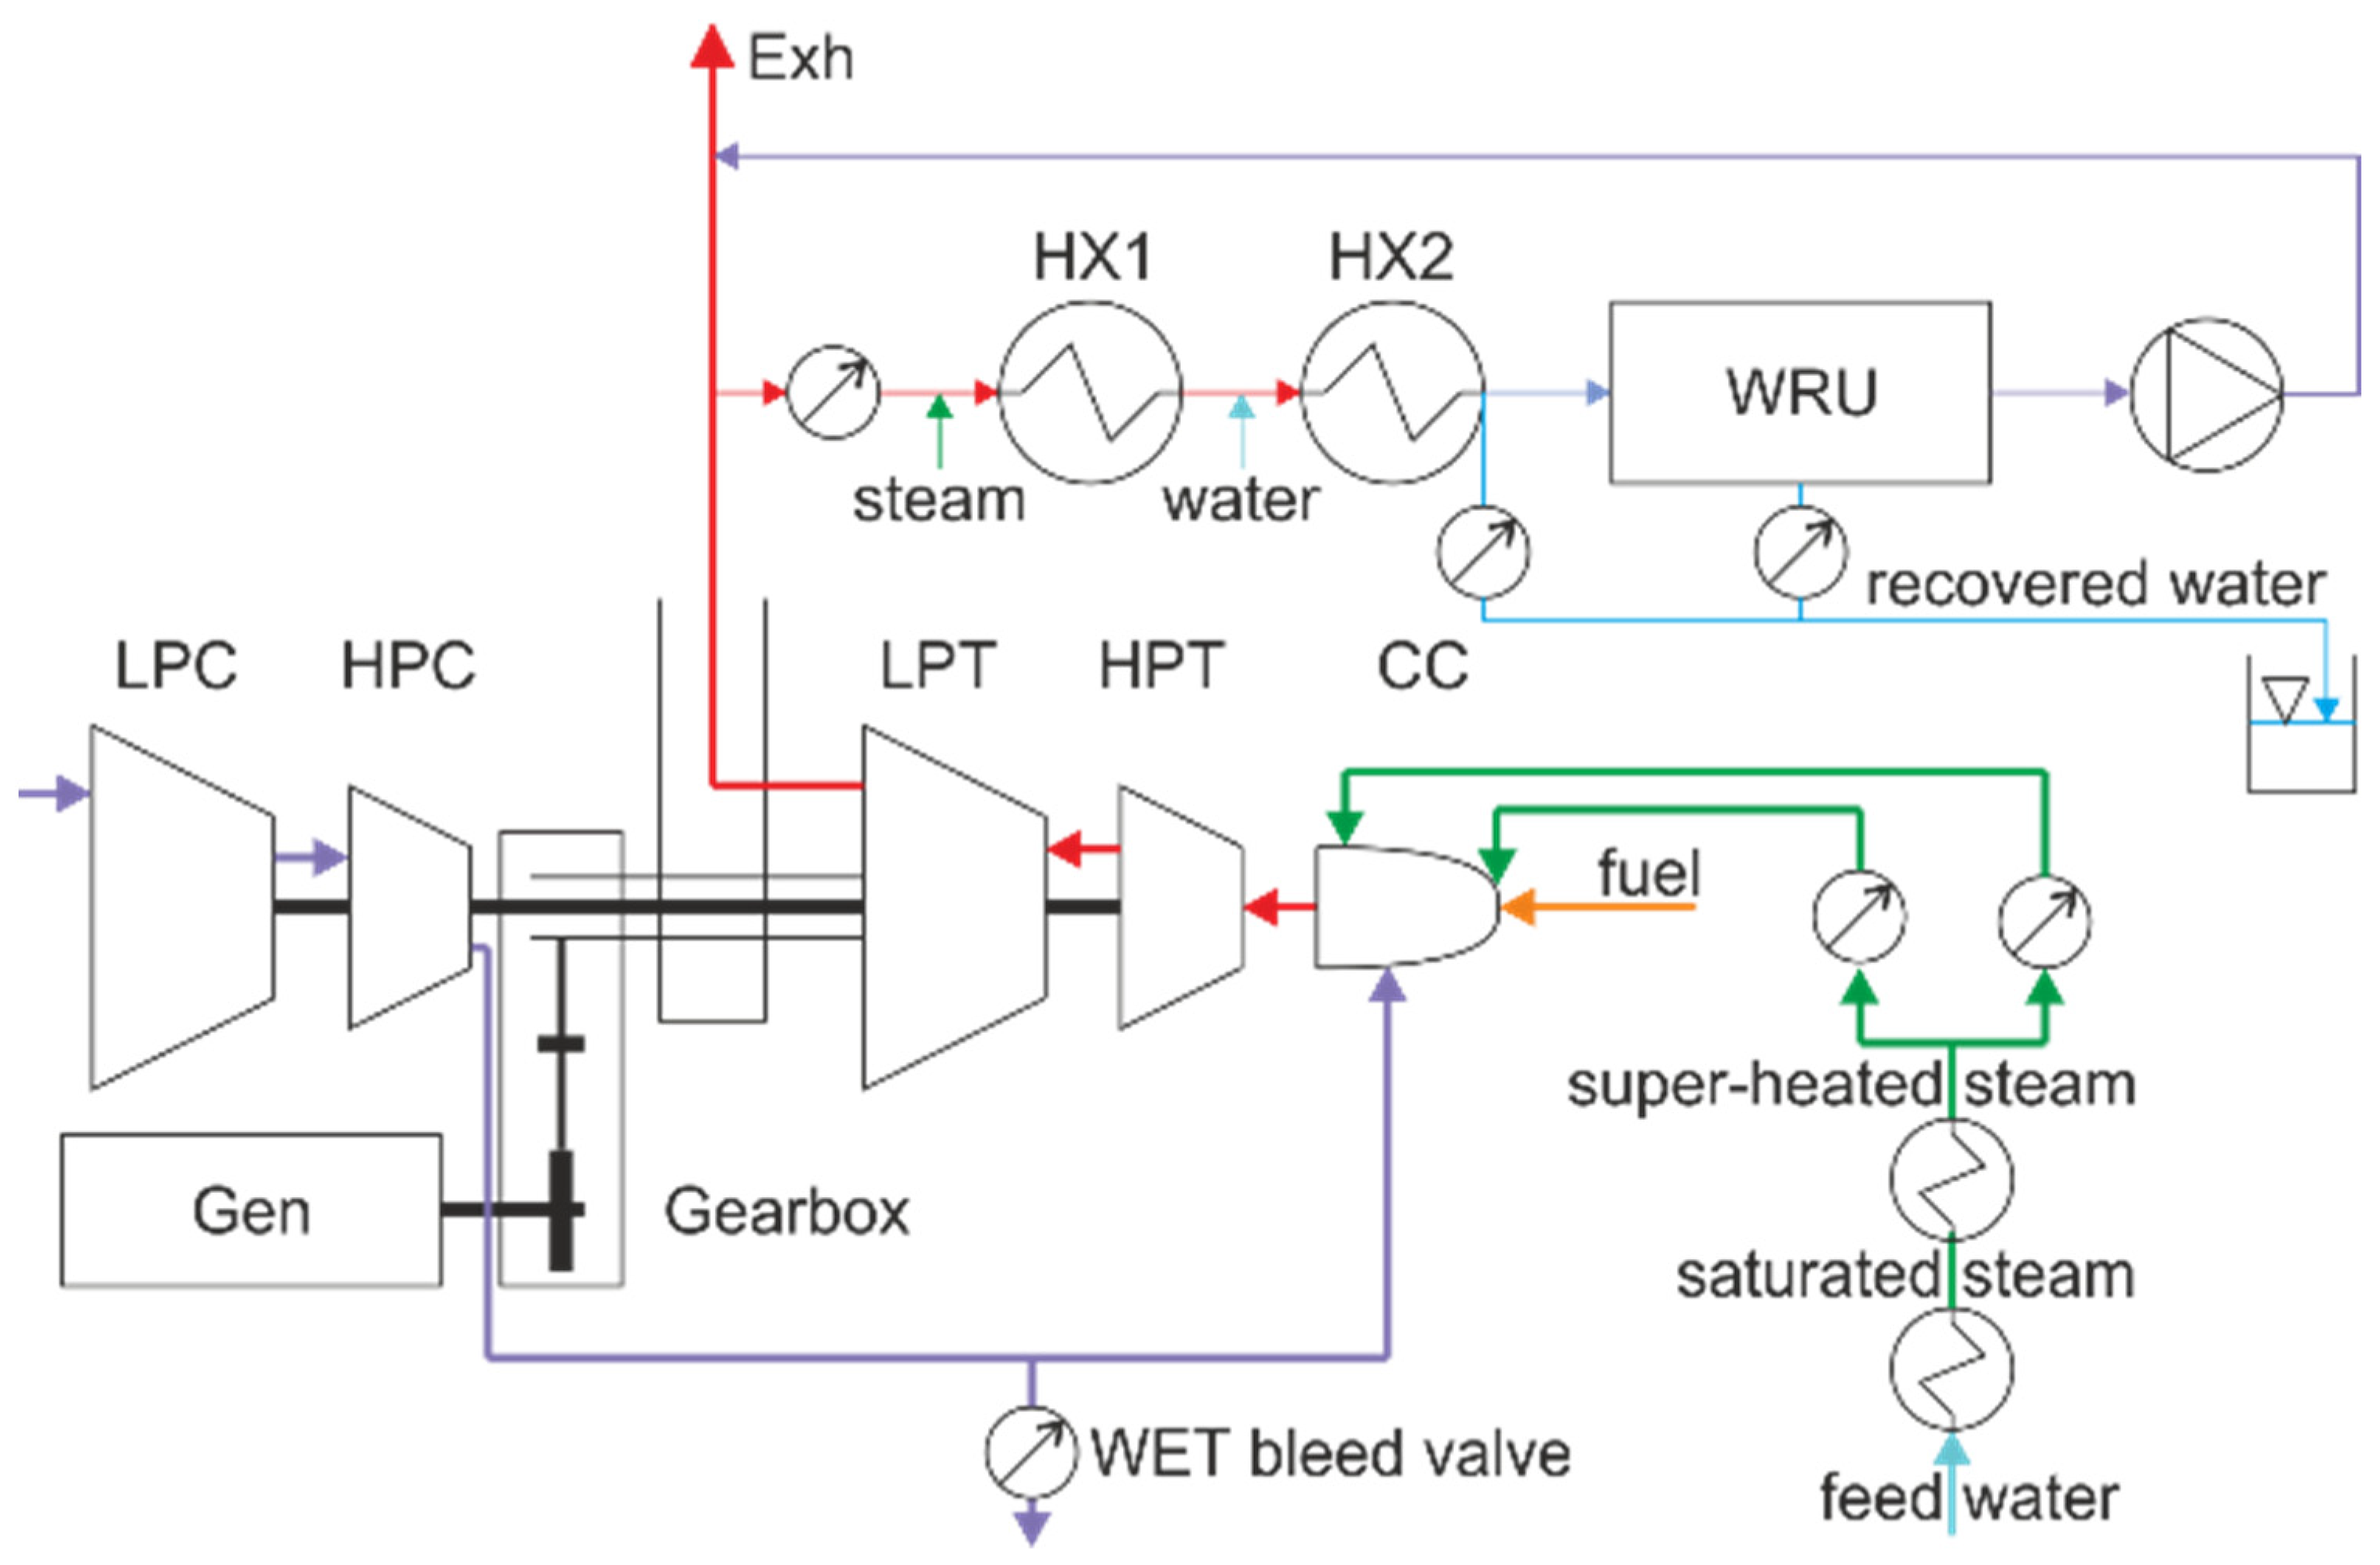
Within the project DINA2030plus the proof of concept of the WET at the laboratory scale will be carried out. The duration of the project is currently set until the end of 2026. A consortium of partners, such as MTU, Bauhaus Luftfahrt, university of Stuttgart, DLR Institute of Combustion Technology (DLR-VT) and five other DLR institutes are involved. The foundation is laid by numerical cycle simulations [23] which will be validated and further substantiated by the experimental characterization of the test rig. Subsequently, the HeBo will be extended as a WET demonstrator with the additions shown in Figure 2.
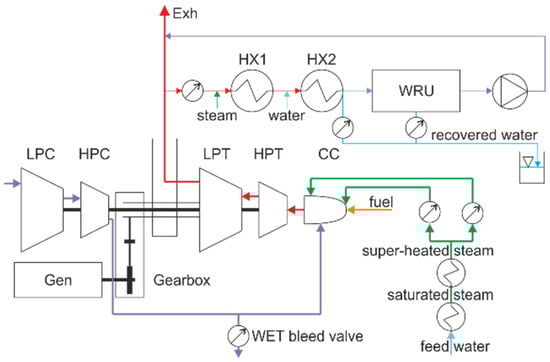
Figure 2.
Schematics of the WET demonstrator setup at DLR-VT.
For this purpose, the combustor will be modified with steam injection nozzles and a steam generation system will be set up. This includes a saturated steam generator, a steam superheater to reach compressor outlet conditions and two control paths to inject steam to the primary and secondary combustor sections. To compensate for the added steam mass flow a controlled bleed air valve is installed after the compressor in addition to the native bleed air valve. The gas turbine exhaust will be fitted with a water recovery test section. This consists of two heat exchangers—the vaporizer emulator (HX1) and the condenser (HX2)—and a water recovery unit (WRU) designed by the Institute of Thermodynamics of the University of Stuttgart. Further, options are foreseen by which to inject steam and water to this test section. Only a part of the M250’s exhaust gas will be extracted and investigated in the water recovery section in order to reduce the required cooling power to laboratory scale.
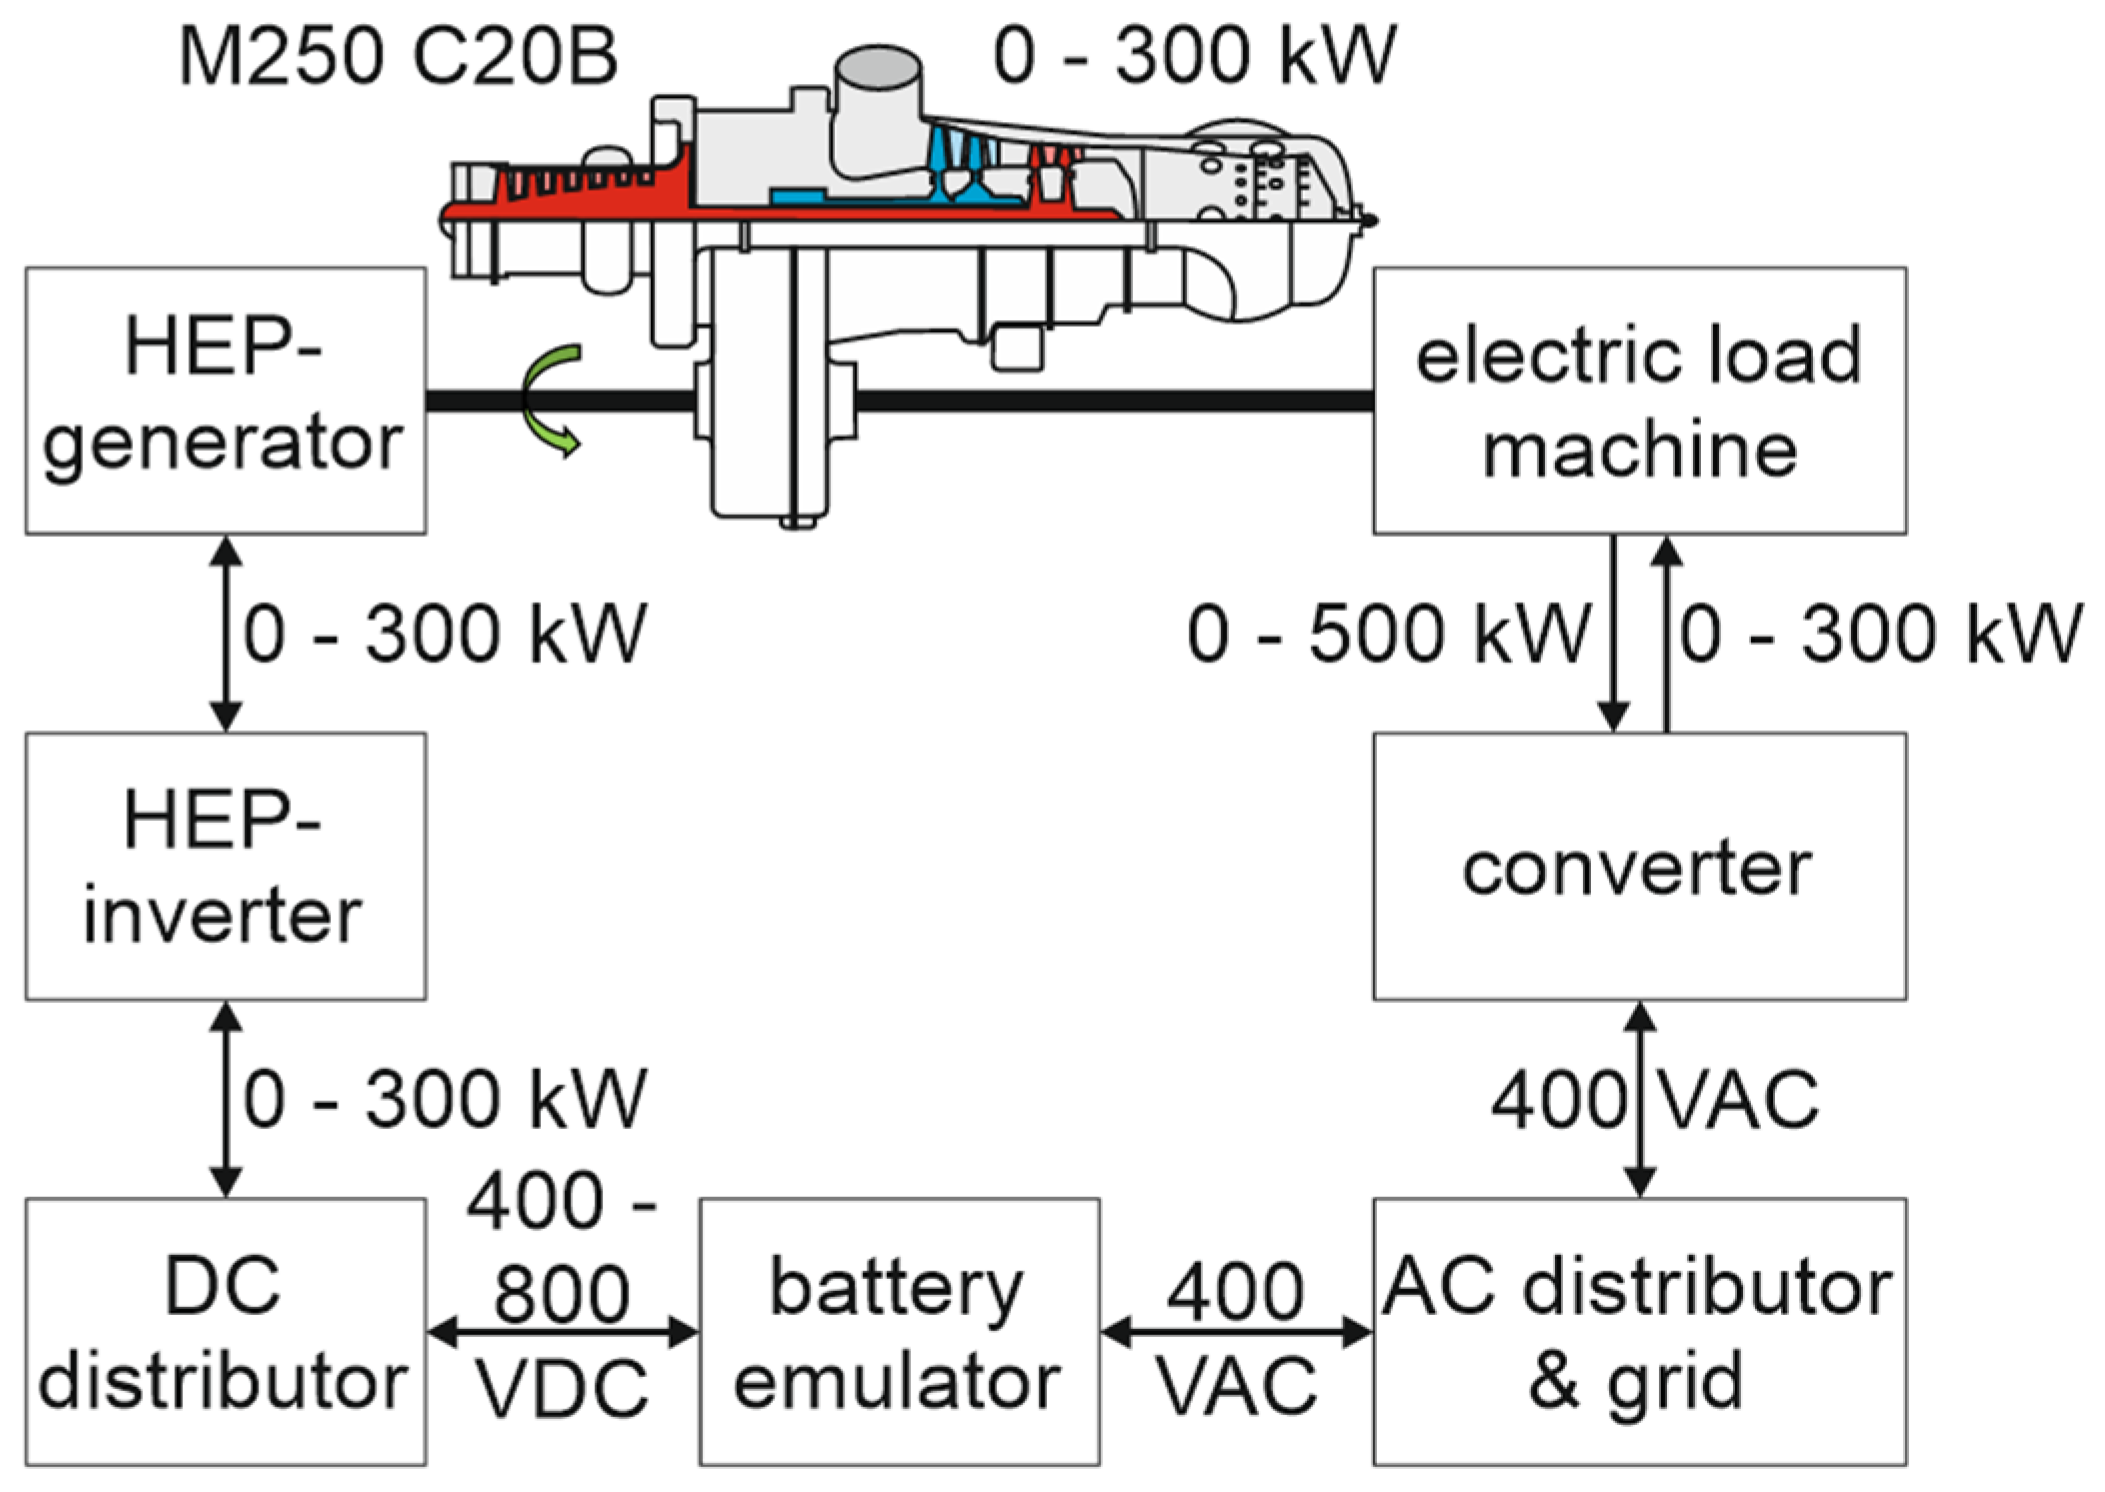
In the second appendant project, EXACT, which is a DLR internal project, various energy distribution options of hybrid electric propulsion systems will be experimentally analyzed. Therefore, the output shaft of the M250 is fitted with a high-power density hybrid electric propulsion (HEP) generator as a load sink/source. To investigate the different interconnections in future, a battery emulator will be connected to the inverter of the HEP generator and a bidirectional electric load machine will be coupled with the second gear box output of the M250, as shown in Figure 3. The energy flows can be distributed freely between the components as indicated by the arrows. This will enable the testing of the following hybrid concepts: turbo electric flight, boosted turboshaft, series hybrid, partial turbo electric flight and series partial hybrid. The focus of testing will be on mild hybrid propulsion and battery electric flight with a gas turbine range extender.

Figure 3.
Hybrid electric ground demonstrator setup at DLR-VT.
4. Experimental Setup and Instrumentation
In this chapter the setup of the HeBo test rig and its specific attributes are presented. The modifications to the M250, including the additional instrumentation, which are required in order to perform the intended research and to commission the gas turbine in the test rig are described in detail. Further, the integration of the rig into the laboratory infrastructure, which supplies the rig with the required media and control systems, is described.
4.1. Gas Turbine System
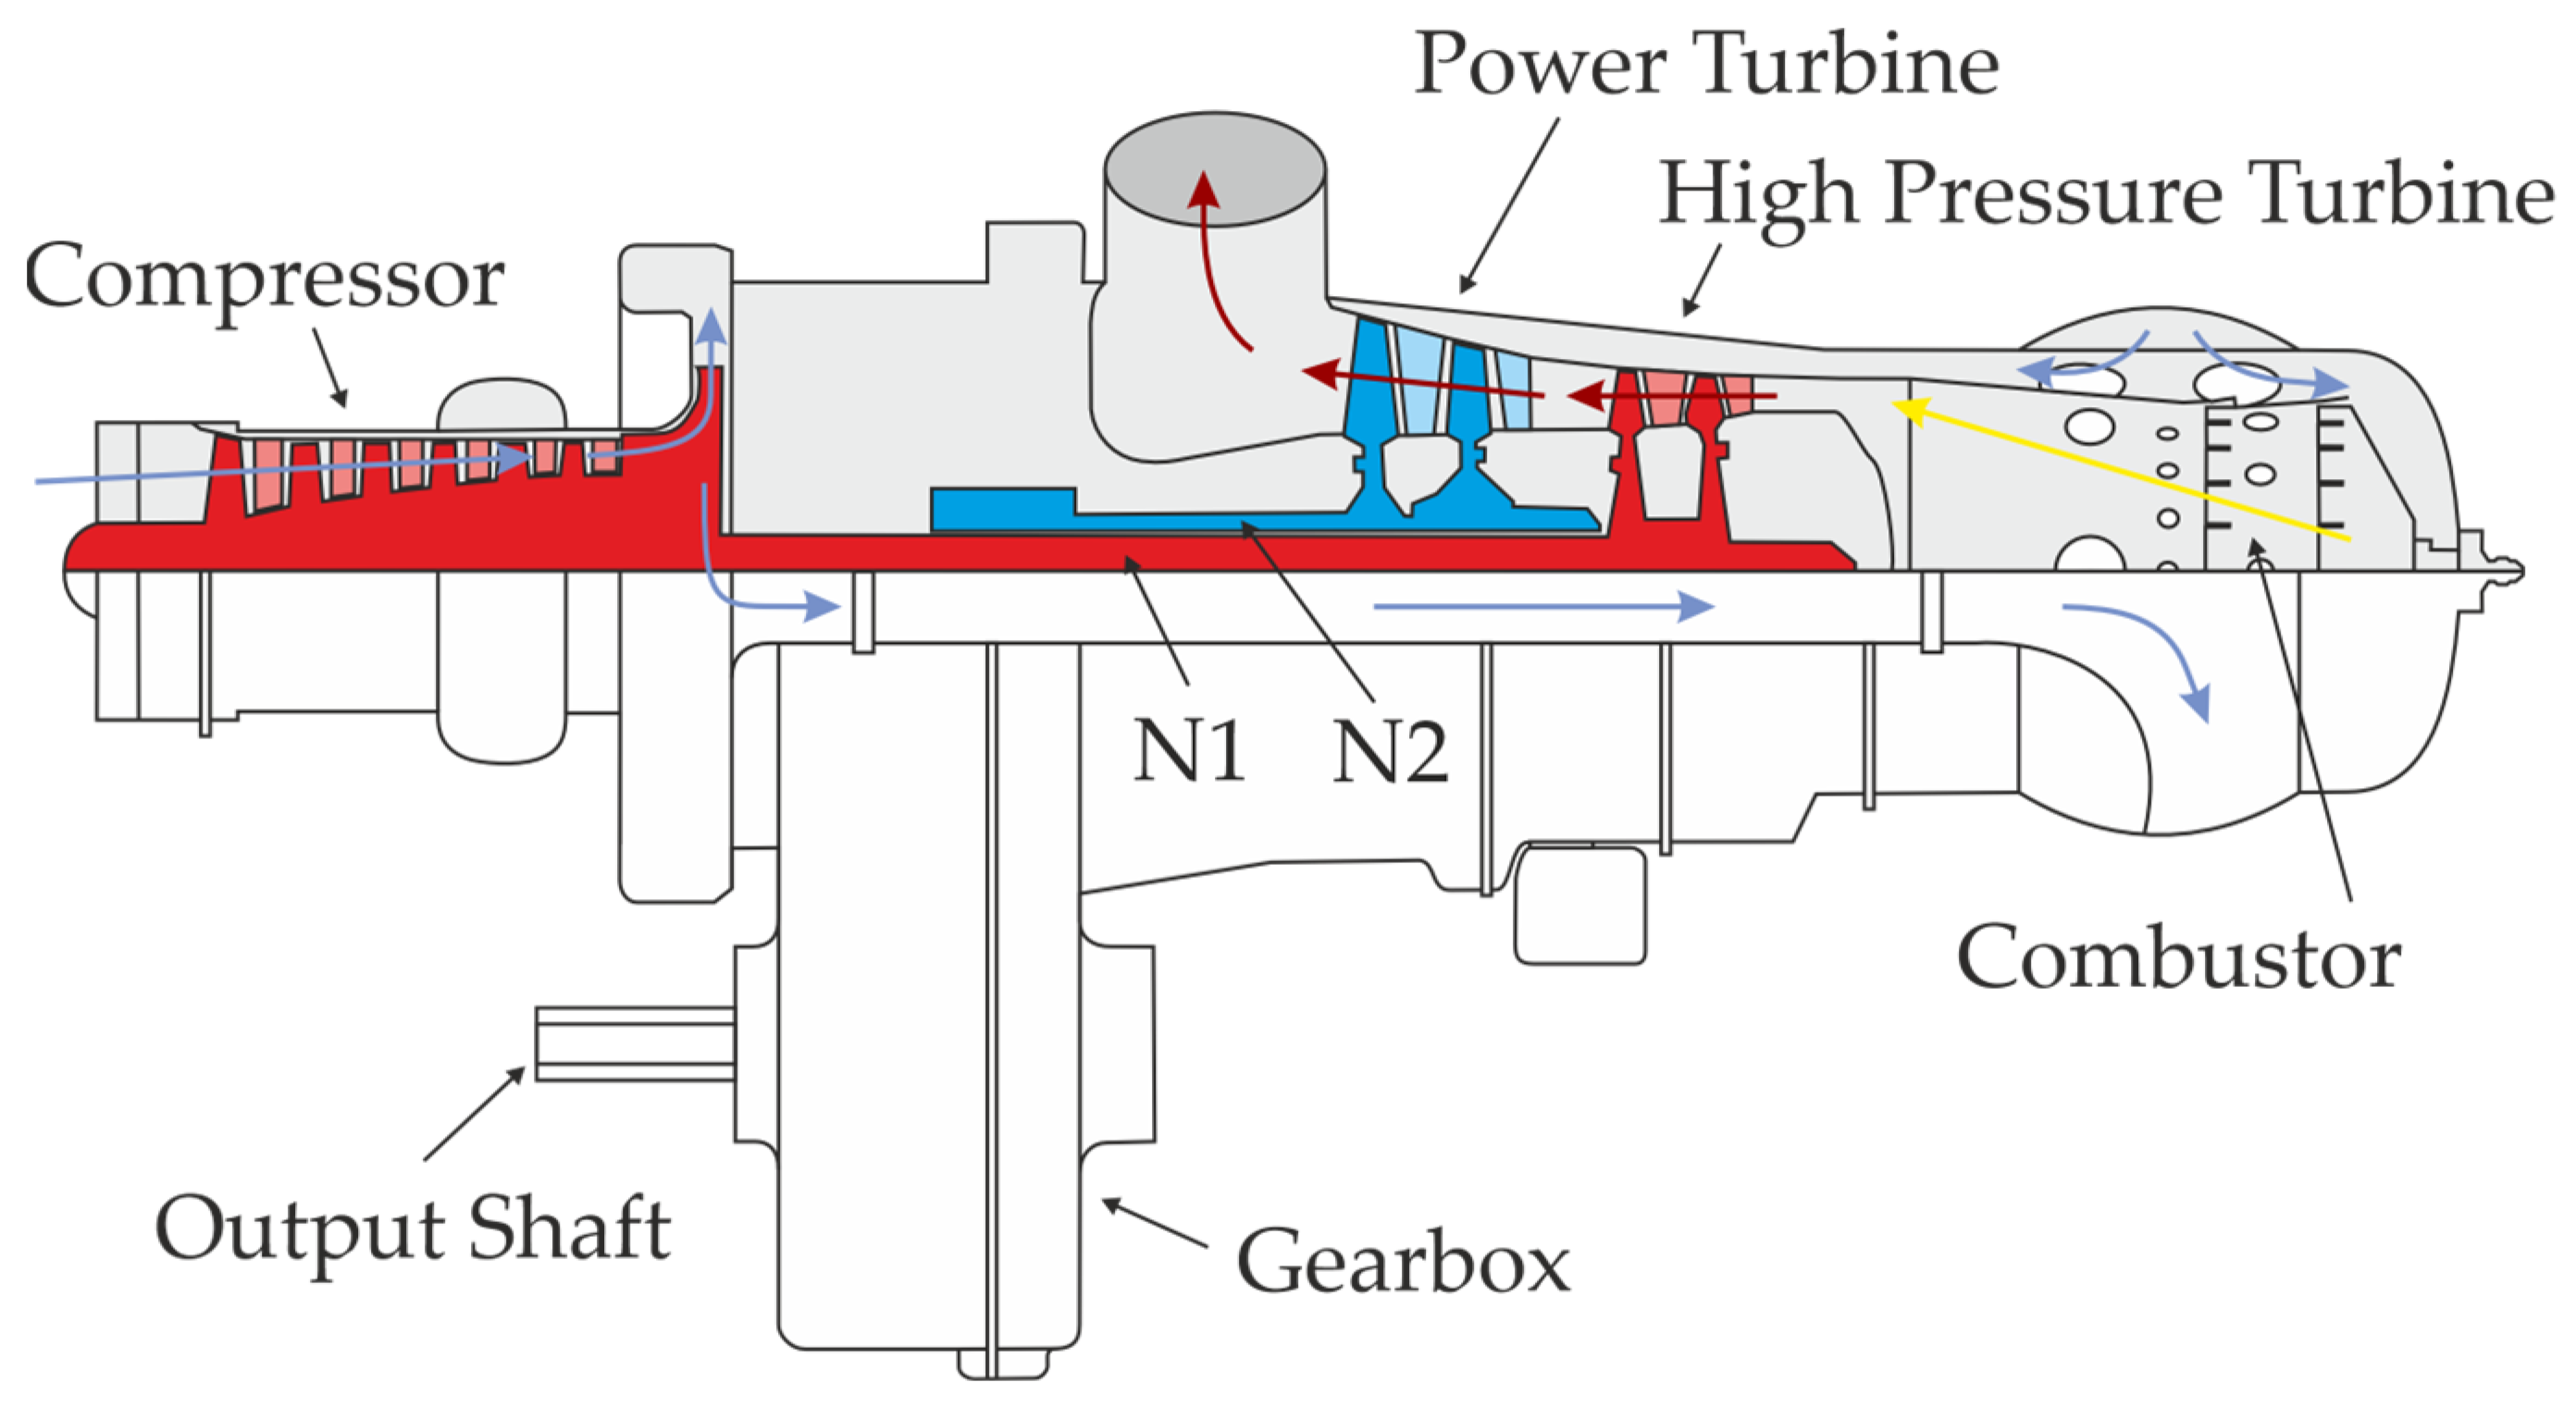
The test rig is based on the commercially available Allison M250-C20B, in the following referred to as M250, which is a widely used turboshaft engine manufactured by the Rolls Royce corporation. It is commonly used in helicopters and small fixed-wing aircrafts [20]. A sectional view of the M250 is shown in Figure 4. It is a two-shaft engine with a gas generator (referred to as N1 from its rotation speed ), indicated in red, and a power turbine shaft (referred to as N2 from its rotation speed ), indicated in blue. The compressor on the N1 shaft consists of six axial stages and one radial stage. The compressed air is guided via two transfer pipes into the combustor, as indicated in the lower half of Figure 4. The combustor has a swirl-stabilized, non-premixed burner with a duplex fuel injector. The combustion products expand first through the two-stage (axial) high pressure gas generator turbine (N1) and then through the two stage (axial) low pressure power turbine section (N2). The mechanical power is transferred from the N2 shaft through a gear box to the output shaft. The output power is rated at 313 kW. The main features of the gas turbine are its compact size, the high power-to-weight ratio as well as its reliable design and easily accessible combustor section. An overview of the key data of the M250 is presented in Table 1.
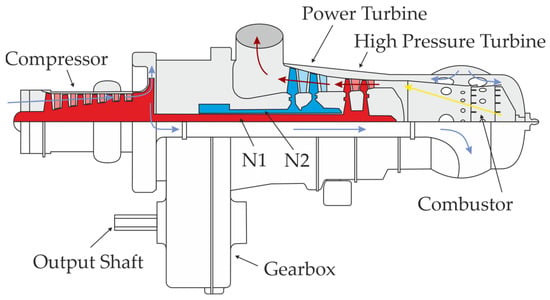
Figure 4.
Schematic diagram of the Allison M250-C20B.

Table 1.
Nominal operating point of the engine Allison M250-C20B.
Fuel flow to the combustor is regulated by a pneumatic–mechanical controller based on the shaft speeds and compressor discharge pressure. It has two levers to operate the turbine. Apart from the 0° or “off” position, the N1 control lever has two distinct set points: 30° to start the engine and stabilize on ground idle conditions and 90° for flight idle with at nominal speed and ready to receive load. The N2 governor lever, which is typically connected to the helicopter collective lever, is used to gradually compensate for changes in output shaft speed depending on the extracted shaft power. The initial position of the lever is set to 50%.
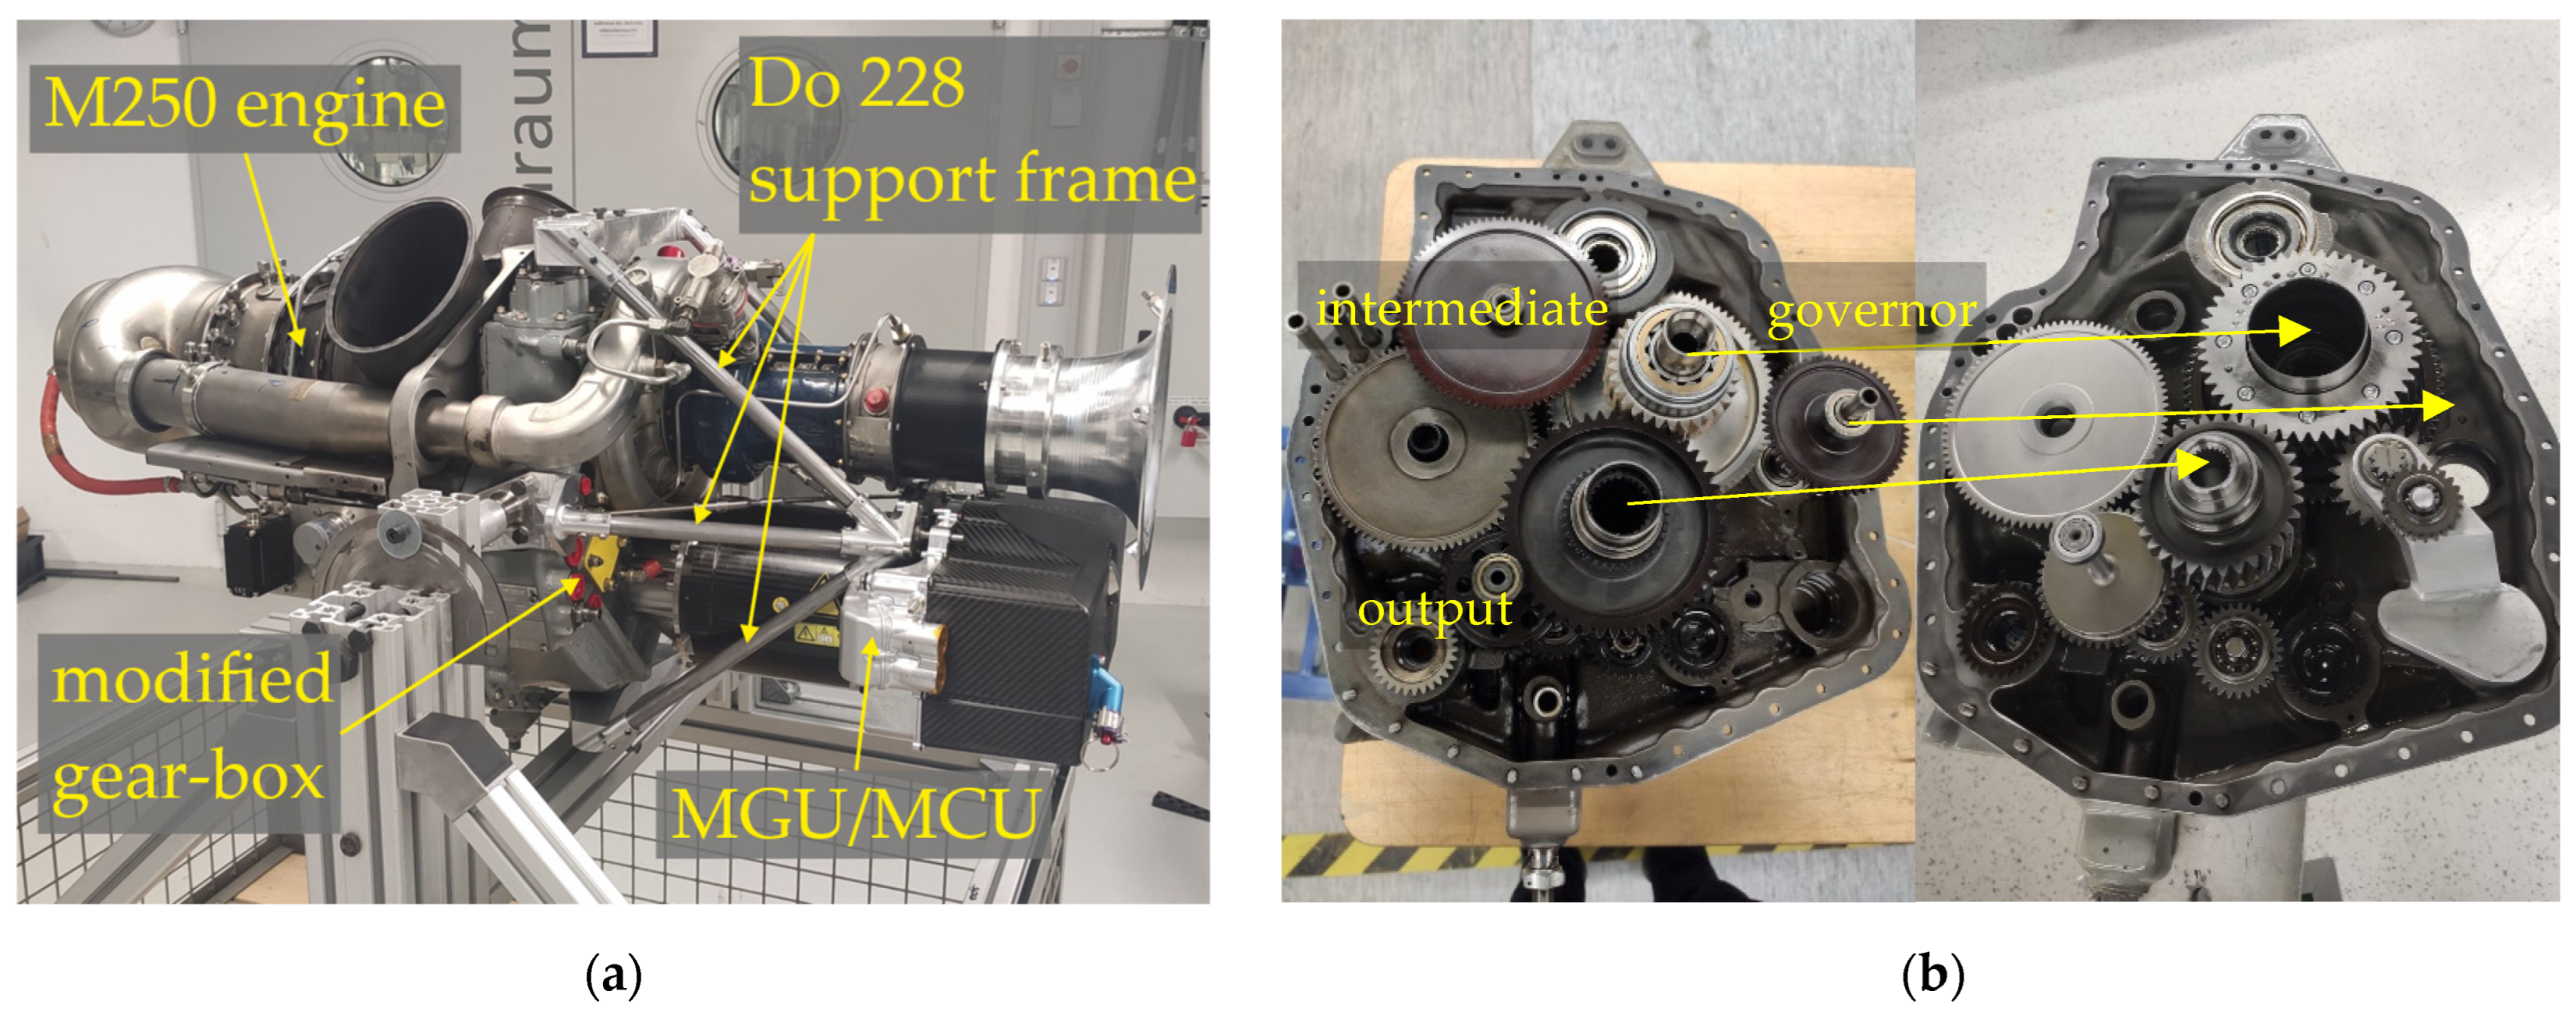
To build up the HeBo test rig from the M250 several modifications have been made to the gas turbine. The main modifications, described in detail, are highlighted in Figure 5.

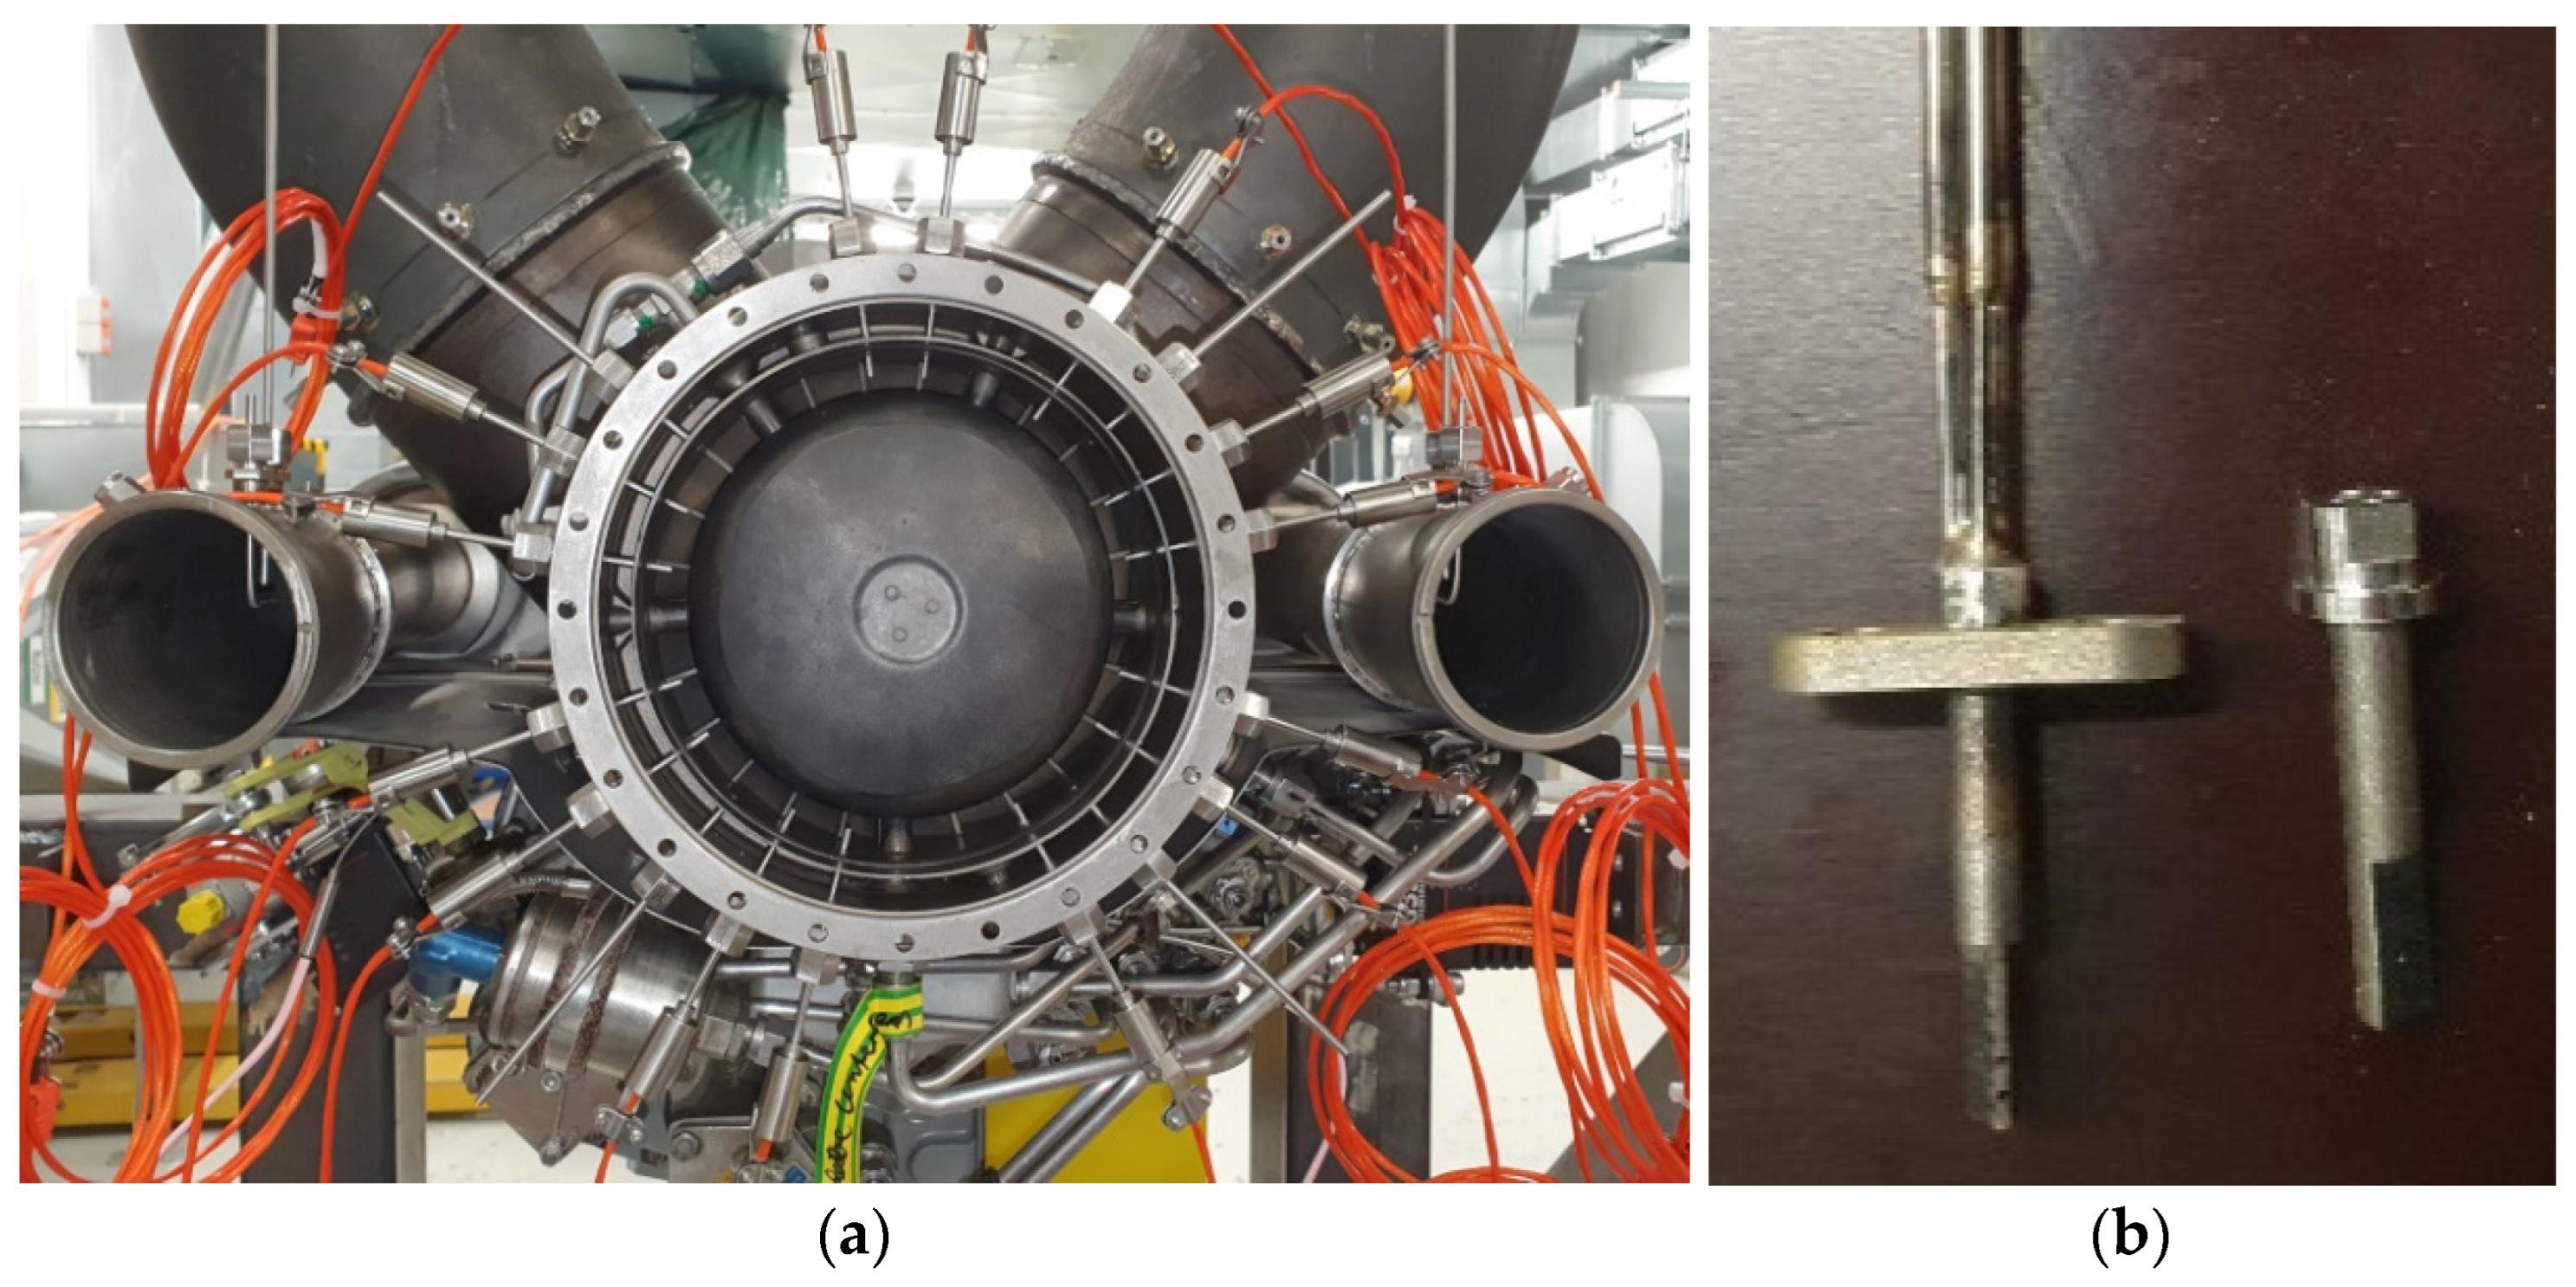
Figure 5.
(a) Modified M250 gas turbine gen-set. (b) Original (left) and modified gearbox (right).
4.1.1. Gear Box Modification
For the integration of a compact generator/motor unit instead of the mechanical rotor coupling, a higher drive shaft speed is required. To also maintain the compact and light-weight features of the gas turbine it was necessary to modify the existing gearbox instead of installing an additional gearbox. To achieve the desired rotating speed, the existing intermediate shaft and the power output shaft are fitted with newly designed gear wheels. With the new gear wheels the number of teeth changes to 33 at the output shaft gear and 47 at the intermediate shaft gear from the original 50 and 30 teeth, respectively. The size inversion of the intermediate gear and the output gear is clearly visible in Figure 5b. To ensure proper and safe operation, the speed governor gear train of the fuel control unit, which is located on the right-hand side of the gear box is conservatively fitted to the new transmission in order to maintain design speed. Originally the governor gear is linked to the output shaft. In the modified gear box, a structure is installed in the seats of the auxiliary drive output, this takes up a new gear train, which now connects the governor gear (not installed in Figure 5b, modified) to the intermediate shaft. The resulting output shaft speed, , of the modified gearbox is 14,280 rpm at the designated, , shaft speed. In consequence the output torque, , is reduced to 219.5 Nm for the same output power.
4.1.2. Integration of the Generator System
For the investigation of hybrid electric concepts, the output shaft is coupled with a motor generator unit (MGU) instead of the typically used water or eddy–current brakes [14]. Its location is shown in Figure 5a below the compressor intake. The combination of gas turbine, generator and rectifier/inverter is called a gen-set. Due to its high power-to-weight ratio and its high efficiency, a permanently excited synchronous machine (PESM) manufactured by Compact Dynamics GmbH (Starnberg, Germany) is chosen. It is designed with a liquid cooled internal rotor and reaches a maximum short-term power, , of 450 kW. The highly integrated system combines the motor generator unit (MGU) and motor control unit (MCU), which includes the inverter and rectifier, in one housing. This achieves an overall system efficiency of 97% at design speed. The maximum continuous power, , is 300 kW and is delivered at a variable DC voltage (600–800 VDC). The unit is capable of operating as a motor as well as a generator, which is a prerequisite to cover all planned hybrid electric configurations. The inverter transforming the generated high frequency alternating current into direct current is an integral part of the MGU/MCU. The MGU is coupled to the gear box of the M250 with a plug shaft. As can be seen in Figure 5a the MGU is suspended in a support frame, which is connected to the M250 mounting points to avoid excessive stress on the flange of the gear box housing. With foresight to a possible flight application, the frame is designed to withstand the standard maneuver shock loads of a Do228 aircraft at 6.7 g as well as crash loads of 9 g. In this configuration the gen-set achieves a remarkable power-to-weight ratio of more than 2.65 kW/kg.
4.2. Laboratory Integration
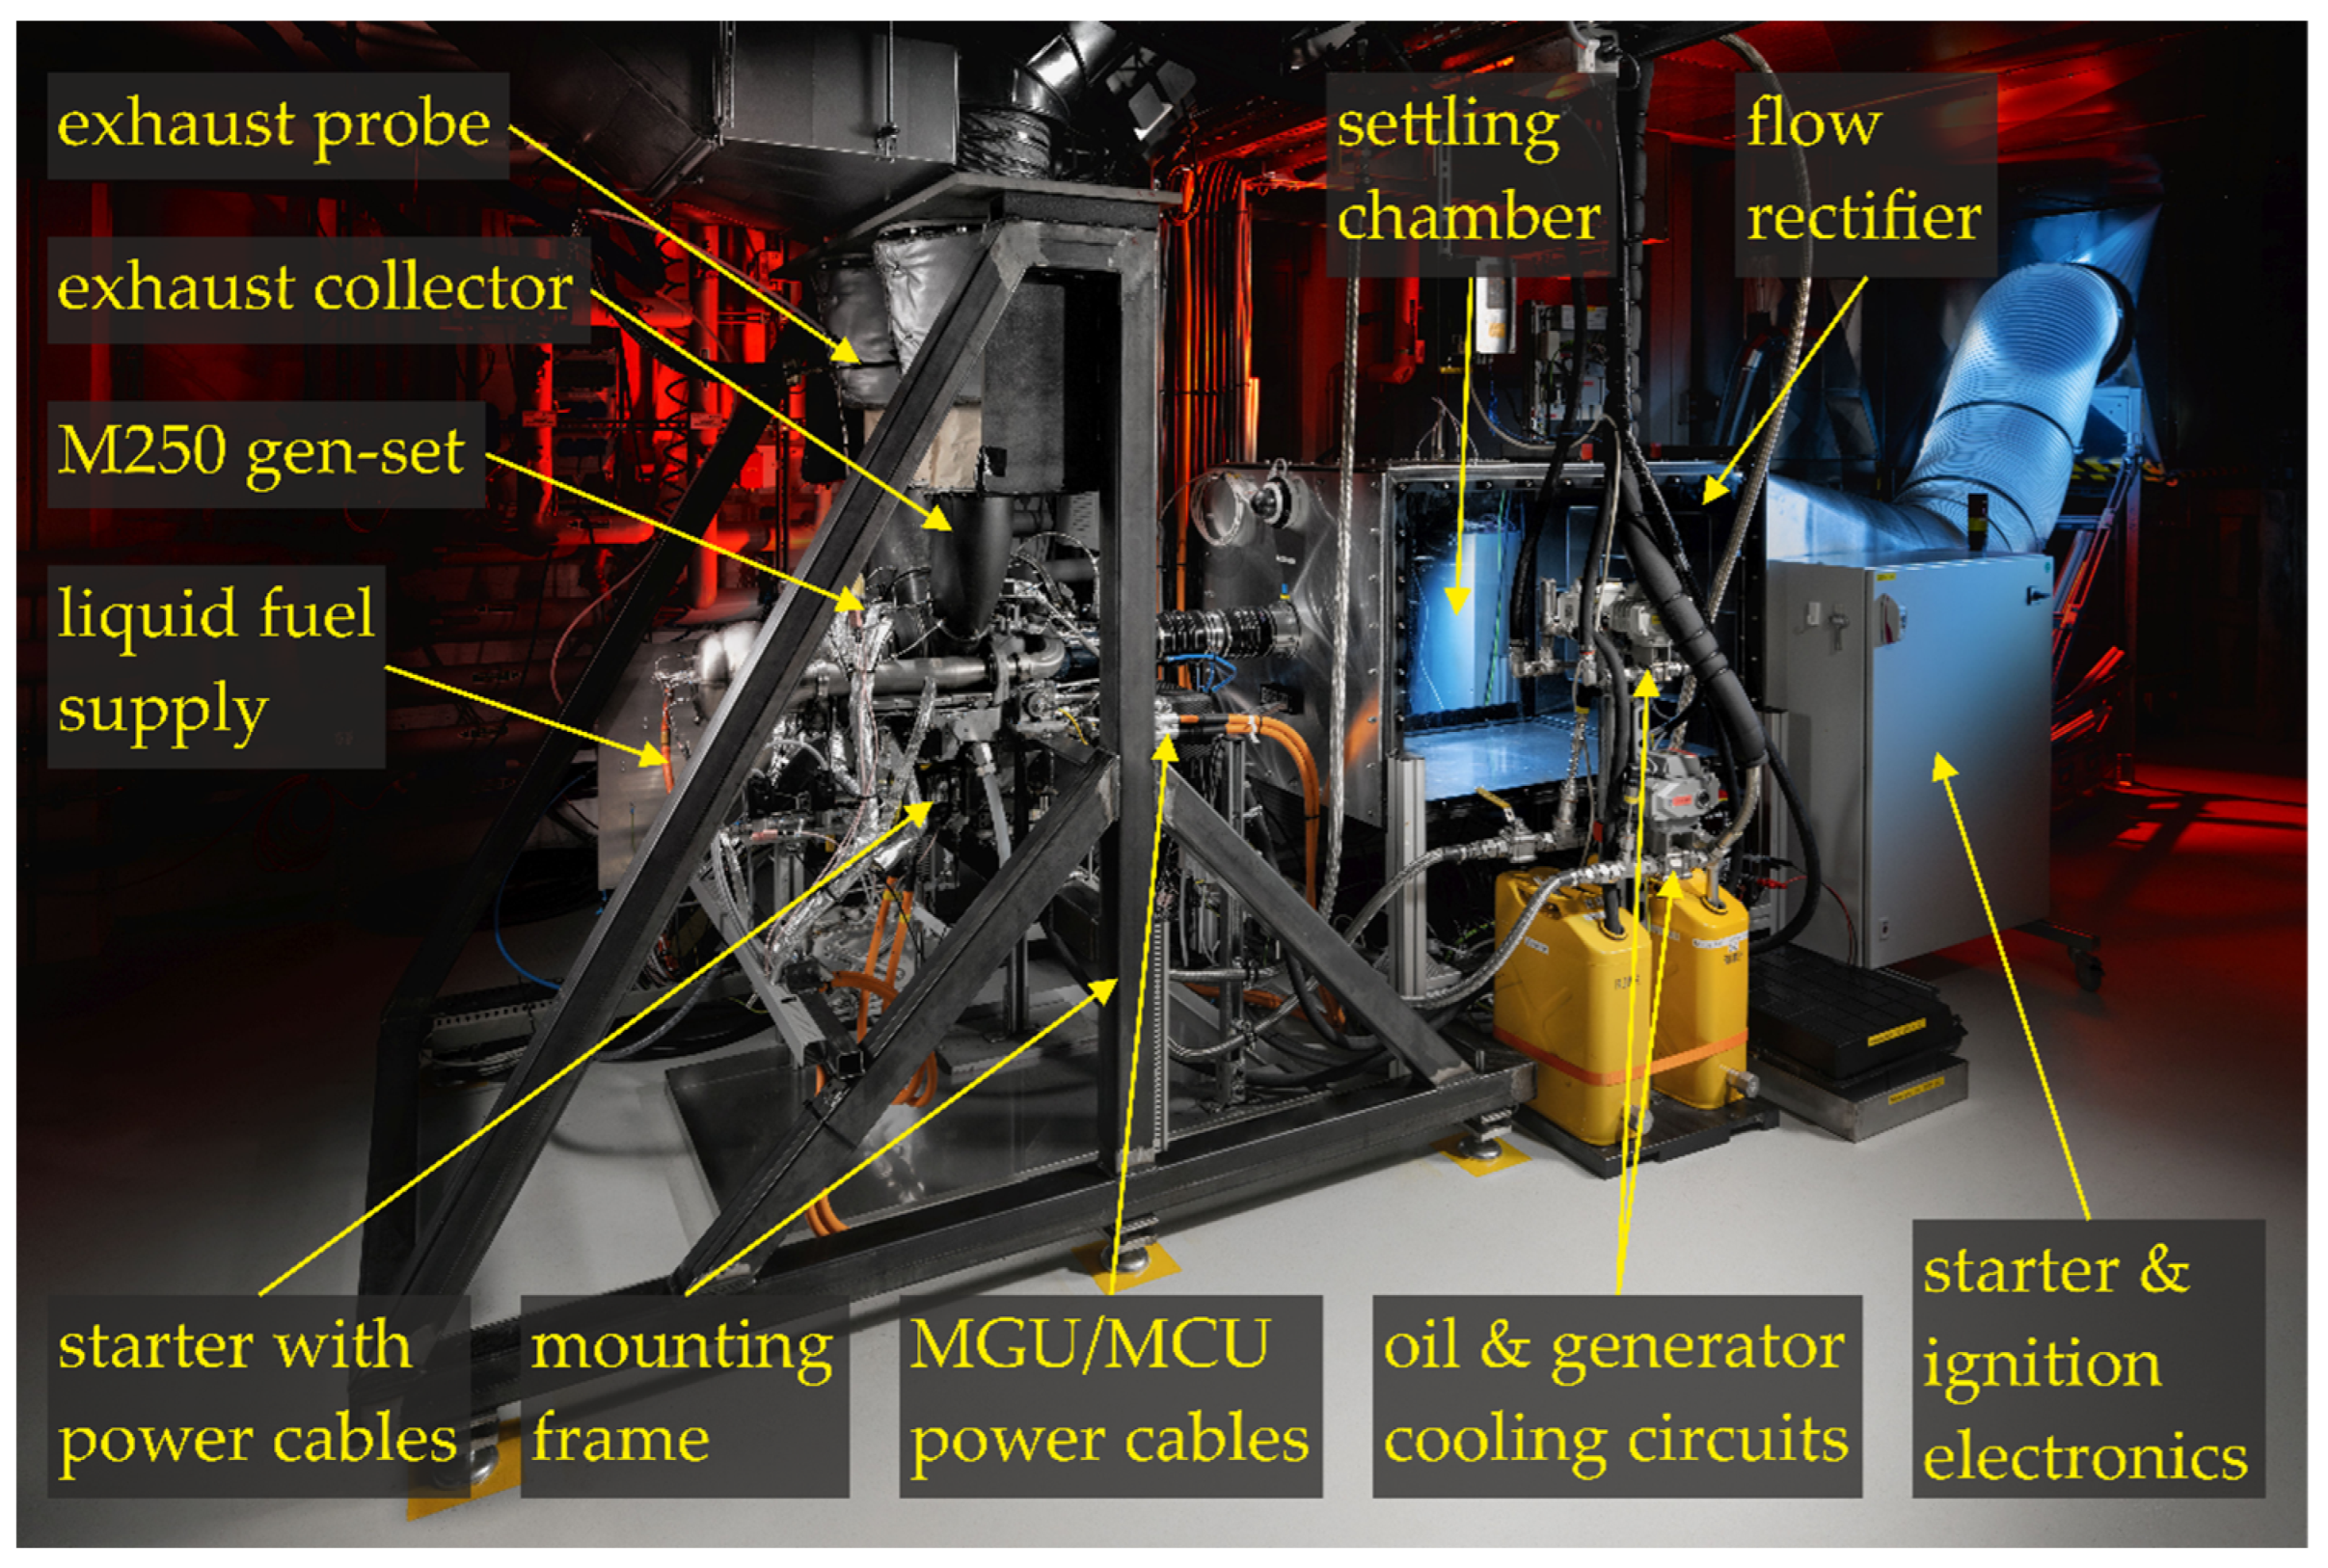
This section describes the necessary interfaces for the installation of the gen-set in the laboratory. In Figure 6 some of the most important components of these interfaces are highlighted. Their function is explained in the following sections.
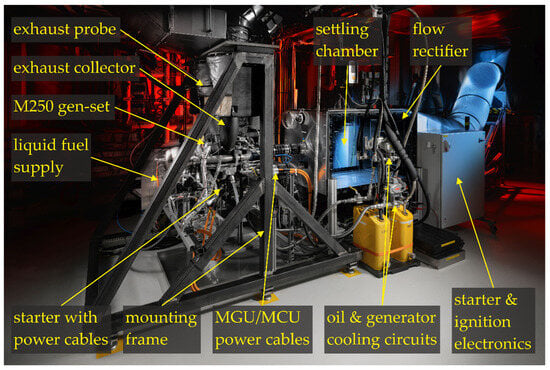
Figure 6.
HeBo test rig.
4.2.1. Air Supply System
The compressor intake air enters the laboratory through a filter box and is guided to the test rig through a 500 mm bellows hose. Upstream of the compressor, the flow is homogenized by a flow rectifier in the form of a diffusor with a 20° opening angle, which then leads into a settling chamber. The flow field in the chamber has been analyzed via CFD to ensure a uniform inflow into the differential pressure flow measurement nozzle, which can be seen directly mounted to the compressor inlet in Figure 5a. The entire settling chamber is then calibrated according to the DAkkS standard for mass flow measurement. For structural decoupling the settling chamber is connected to the compressor intake by two bellows.
4.2.2. Exhaust System
The exhaust system of the gas turbine test rig consists of two uniquely designed 3D printed collectors that are welded to the exhaust ducts of the gas turbine. These connection pieces have been designed to ensure a leakproof connection between the gas turbine and the chimney and to accommodate the mechanical transition from the oval turbine exhausts to the round stack duct. The sealed exhaust system instead of a typical ejector type exhaust is necessary due to the under-pressure created by the laboratory ventilation.
4.2.3. Fuel Supply System
In order to enable the supply of various liquid fuels from a storage facility to the test rig, a fuel system was newly designed and built up. As the main fuel storage tank is located outdoors, approximately 3 m above laboratory level, a second reservoir, located on the laboratory floor, inside a safety cabinet, functions as buffer at atmospheric pressure. The buffer tank is refilled intermittently from the main tank depending on its filling level. At the buffer tank, the original Bo 105 helicopter boost pump is installed to deliver the fuel to the gas turbine fuel system. This setup was chosen in order to ensure conditions at the gas turbine fuel control unit are similar to the original helicopter application.
4.2.4. Electrical Components
As described in Section 3 the test rig will eventually be integrated into a full hybrid electric setup. As the battery emulator is not ready at the commissioning stage of the HeBo test rig, an electric load system consisting of a bi-directional DC power supply unit (EPS Stromversorgung GmbH, Augsburg, Germany, E/PSB 11000-80, 1000 VDC, ±30 kW) and a rented resistor load bank (Crestchic Loadbanks GmbH, Immenhausen, Germany, 664 kW, 700 VDC) is set up. The DC power supply is used to provide a 700 VDC intermediate circuit and, since the power increment of the load bench is limited to 1 kW steps of , it is used to compensate for those steps. The load bank serves to dissipate the majority of the power from the generator as heat. An overall control loop is programmed to distribute the load between the bi-directional power supply and the load bank, which sets a virtual threshold for the power fed to the grid at 15 kW. The current power is calculated from the active torque at the generator and the speed of the output shaft, .
4.2.5. Control and Safety System
In order to operate the M250 gas turbine safely in a laboratory environment, a control and safety system based on Bachmann and Beckhoff PLCs is built up. All necessary input and output variables are processed by the system, e.g., instrumentation sensor signals are acquired and control commands such as load or control-lever actuator set-points are sent. To visualize these signals and operate the test-rig, a graphical HMI is programmed.
To provide machine and personnel safety, selected signals are handled by a dedicated safety system. These signals are the turbine speeds, the turbine inlet temperature sensor signals, oil pressure, vibration and fuel shut-off valve commands. About 40 safety criteria are monitored depending on the operating state of the gas turbine (ignition, start-up, run). As a safety mechanism, two redundant shut-off valves are installed in the fuel line just before the injector to the combustor. If a limit is surpassed, the shut-off valves are closed instantly. The implemented safety limits are chosen conservatively due to the implemented and upcoming system modifications. After the finalization of the commissioning of the test rig, the safety system will be complemented by a fully automated shut down routine to avoid unnecessary hard stops in less critical situations. This routine will ramp down load, maintain the required cool down phase on idle and cut the fuel supply at the gas turbine controller.
The control system also incorporates the acquisition of measurement data, with a standard acquisition rate of 10 Hz. The system also provides a 2 min ring buffer with a 200 Hz sampling rate which is triggered in case of an emergency event in order to provide high speed data one minute before and after the event.
4.3. Instrumentation Setup
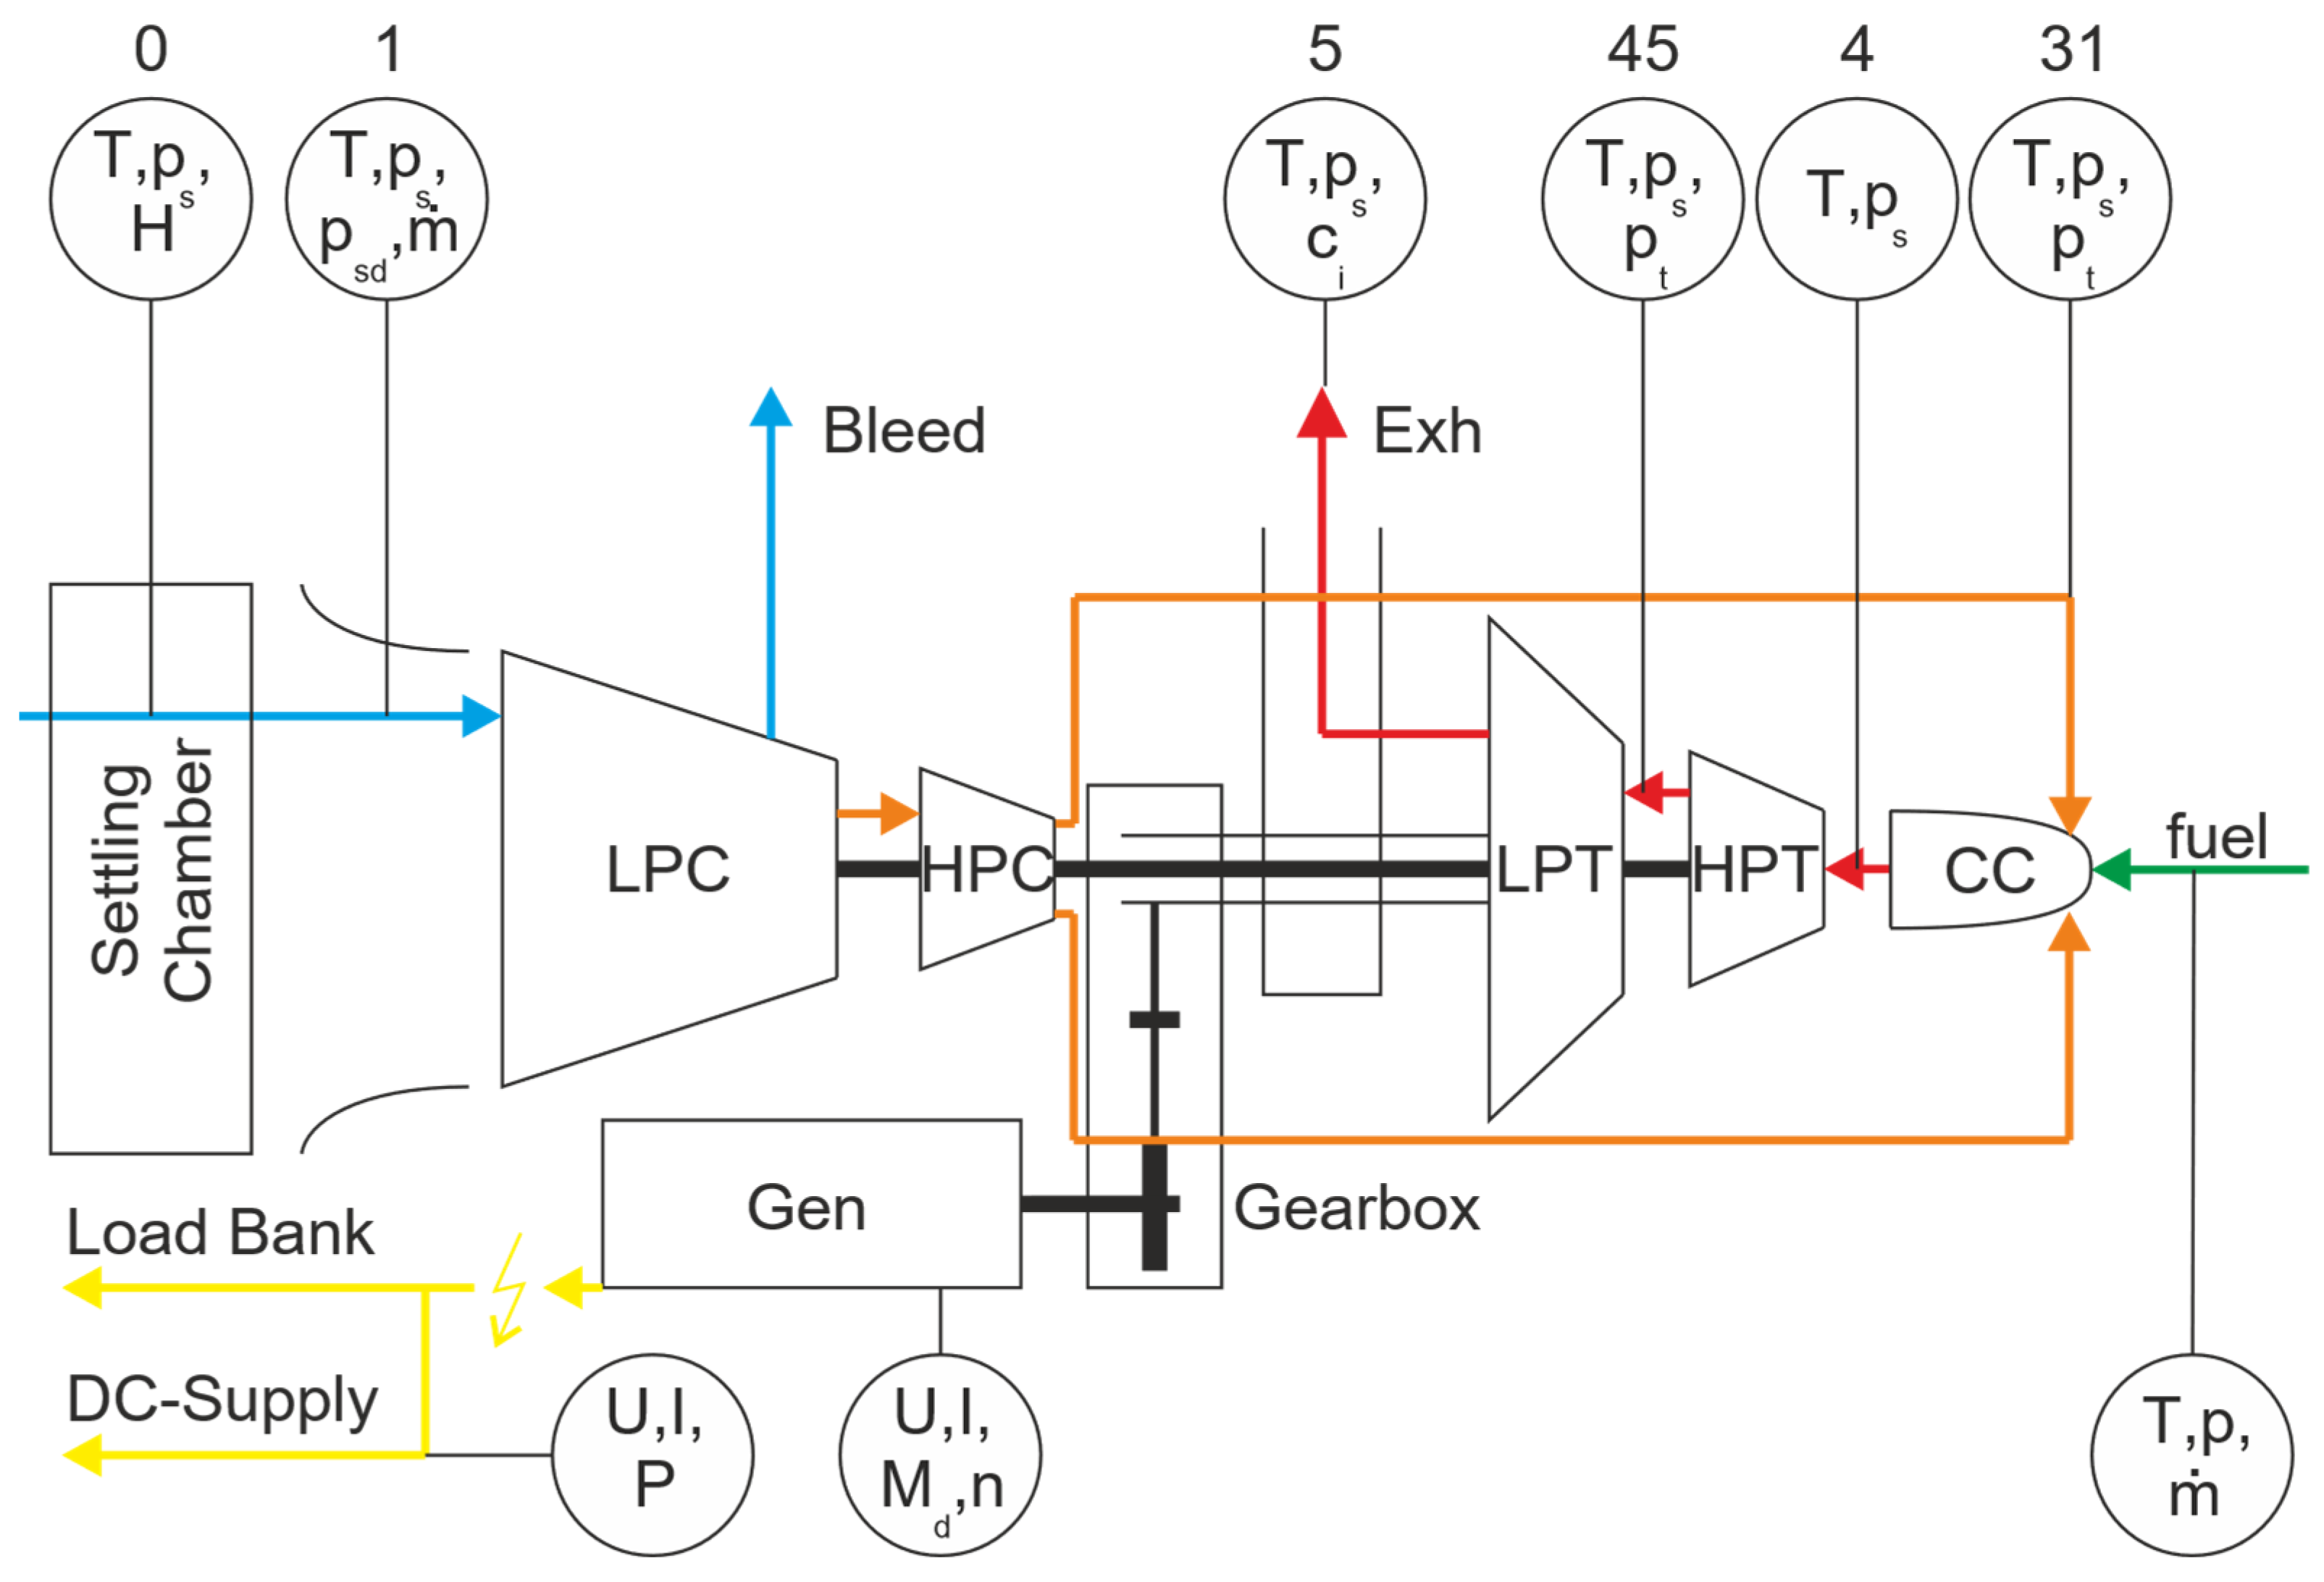
To quantify all relevant thermodynamic process parameters, measurements are taken at adequate positions of each component in the gas turbine. Thus, several modifications are made to equip the gas turbine. Figure 7 gives an overview of the measurement points in the gas turbine. It also introduces the measurement plane denotation corresponding to SAE-AS755 stations [34], that is used to name the measured parameters: ambient (0), compressor inlet (1), compressor outlet/combustion chamber inlet (3), combustor outlet/HP turbine inlet (4), HP turbine outlet/LP turbine inlet (45) and LP turbine outlet/exhaust (5). A detailed description of the instrumentation of each component is given in the following sections. A summary of the installed measurement devices is given in Table 2 at the end of this chapter.

Figure 7.
Instrumentation M250.
Table 2.
Overview: Sensors used in the test rig.
4.3.1. Compressor Instrumentation
The instrumentation of the compressor inlet is integrated in the settling chamber. Upstream, in a central position of the settling chamber, the plane 0 instrumentation is installed. It consists of two type N thermocouples (TCs) , the average of two static pressure bores and a relative humidity sensor . The compressor inlet conditions are measured at the differential pressure flow measurement nozzle, consisting of four type N TCs , and the average of four static pressure bores at the circumference of the nozzle. To calculate the inlet mass flow additionally the differential pressure between and is measured. The mass flow measurement is calibrated considering the whole setup of flow rectifier, settling chamber and measuring nozzle. The outlet conditions of the compressor are measured in both transfer tubes to the combustor. To be able to calculate the mass flow to the combustor , while the compressor bleed valve is open, the temperature is determined and the average of 4 static pressure bores as well as the total pressure are measured. This instrumentation setup is partly visible in the transfer tubes in Figure 8. From the Mach Number relations, the flow velocity is calculated and then with the tube cross-section and the continuity equation the mass flow is determined.
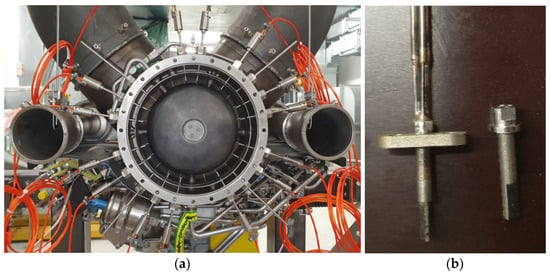
Figure 8.
Turbine instrumentation (a) Plane 4 HP turbine inlet (b) Combi-probe measurement plane 45 between HP and LP turbine.
4.3.2. Combustor Instrumentation
Combustor inlet and outlet conditions are equivalent to compressor outlet and turbine inlet conditions. Additionally, the air temperature around the injector is measured in three locations.
4.3.3. Turbine Instrumentation
To properly characterize the turbine components a precise measurement of the in- and outlet conditions is crucial. Special attention has to be given to the measurement of the HP turbine inlet temperature , which is prone to inhomogeneity from the combustor. Especially for the planned injection of steam to the combustor a precise supervision of the turbine inlet temperature profile is important. For that reason, 14 TCs Type R are installed around the circumference as shown in Figure 8a. To reduce interference, they are positioned in alignment with the leading edges of the inlet guide vanes. The static pressure is measured in four locations. Originally, the average temperature between HP and LP turbine is measured by a TC harness. This is replaced by four 3D-printed combi-probes, shown in Figure 8b, capable of measuring the total temperature as well as total pressure and static pressure . After the LP turbine temperature and static pressure are measured in both exhaust collectors by four TCs and two pressure sensors each.
4.3.4. Peripherals Instrumentation
To characterize the gas turbine the fuel supply is also instrumented with a coriolis mass flow measurement , as well as temperature and pressure measurements. The turbine speeds and are recorded by optical, incremental rotary encoder sensors. Torque, output shaft speed, voltage and current signals are acquired by the generator control unit. Exhaust gas concentrations ci, with i being the respective species NO, NO2, CO, CO2, O2 and H2O, can be measured in both exhaust collectors after the turbine outlet. A custom-made, additively manufactured ten hole probe is used to extract sample gas across the diameter. To avoid deterioration and surface reactions of the sample gas, the probe walls are air cooled. To supervise turbine operation further instrumentation that is worth mentioning is installed. Position actuators and transducers are installed at the controller levers of the M250 fuel control unit. Further, generator, compressor, gearbox and turbine are equipped with vibration sensors. To monitor the gear box modification, thermocouples are used to measure the material temperature in the vicinity of the output shaft bearings. The cooling circuits of lubrication oil and generator cooling liquid are supervised with pressure and temperature probes in feed and return lines.
The presented instrumentation comprises only the most important parameters. The signal- and device-list comprises a total of 180 sensors and actuators.
5. Commissioning and First Characterization of the M250-C20B Gen-Set
The test rig is commissioned and initially operated without cycle modifications in order to characterize the system, verify the integration into the laboratory infrastructure and obtain the dynamic behavior of the system. The measured data will be used to validate existing models of the gas turbine and design the necessary adaptations for future investigations. This chapter summarizes the findings obtained during the commissioning process divided into dynamic behavior and steady state readings.
Due to the operational behavior of the rented load bank which was used during commissioning it was not possible to reach generator loads above 150 kW. Apart from that, the functionality of the modifications to the M250 as well as the built-up subsystems, such as fuel supply, cooling systems and control system are demonstrated. Up to the achieved load set point the gear-box modification and coupling with the generator work very well. No excessive vibrations occur and no excessive signs of wear or particles are found during inspections in the gear-box.
5.1. Dynamic Behavior of the Gas Turbine
5.1.1. Engine Start-Up
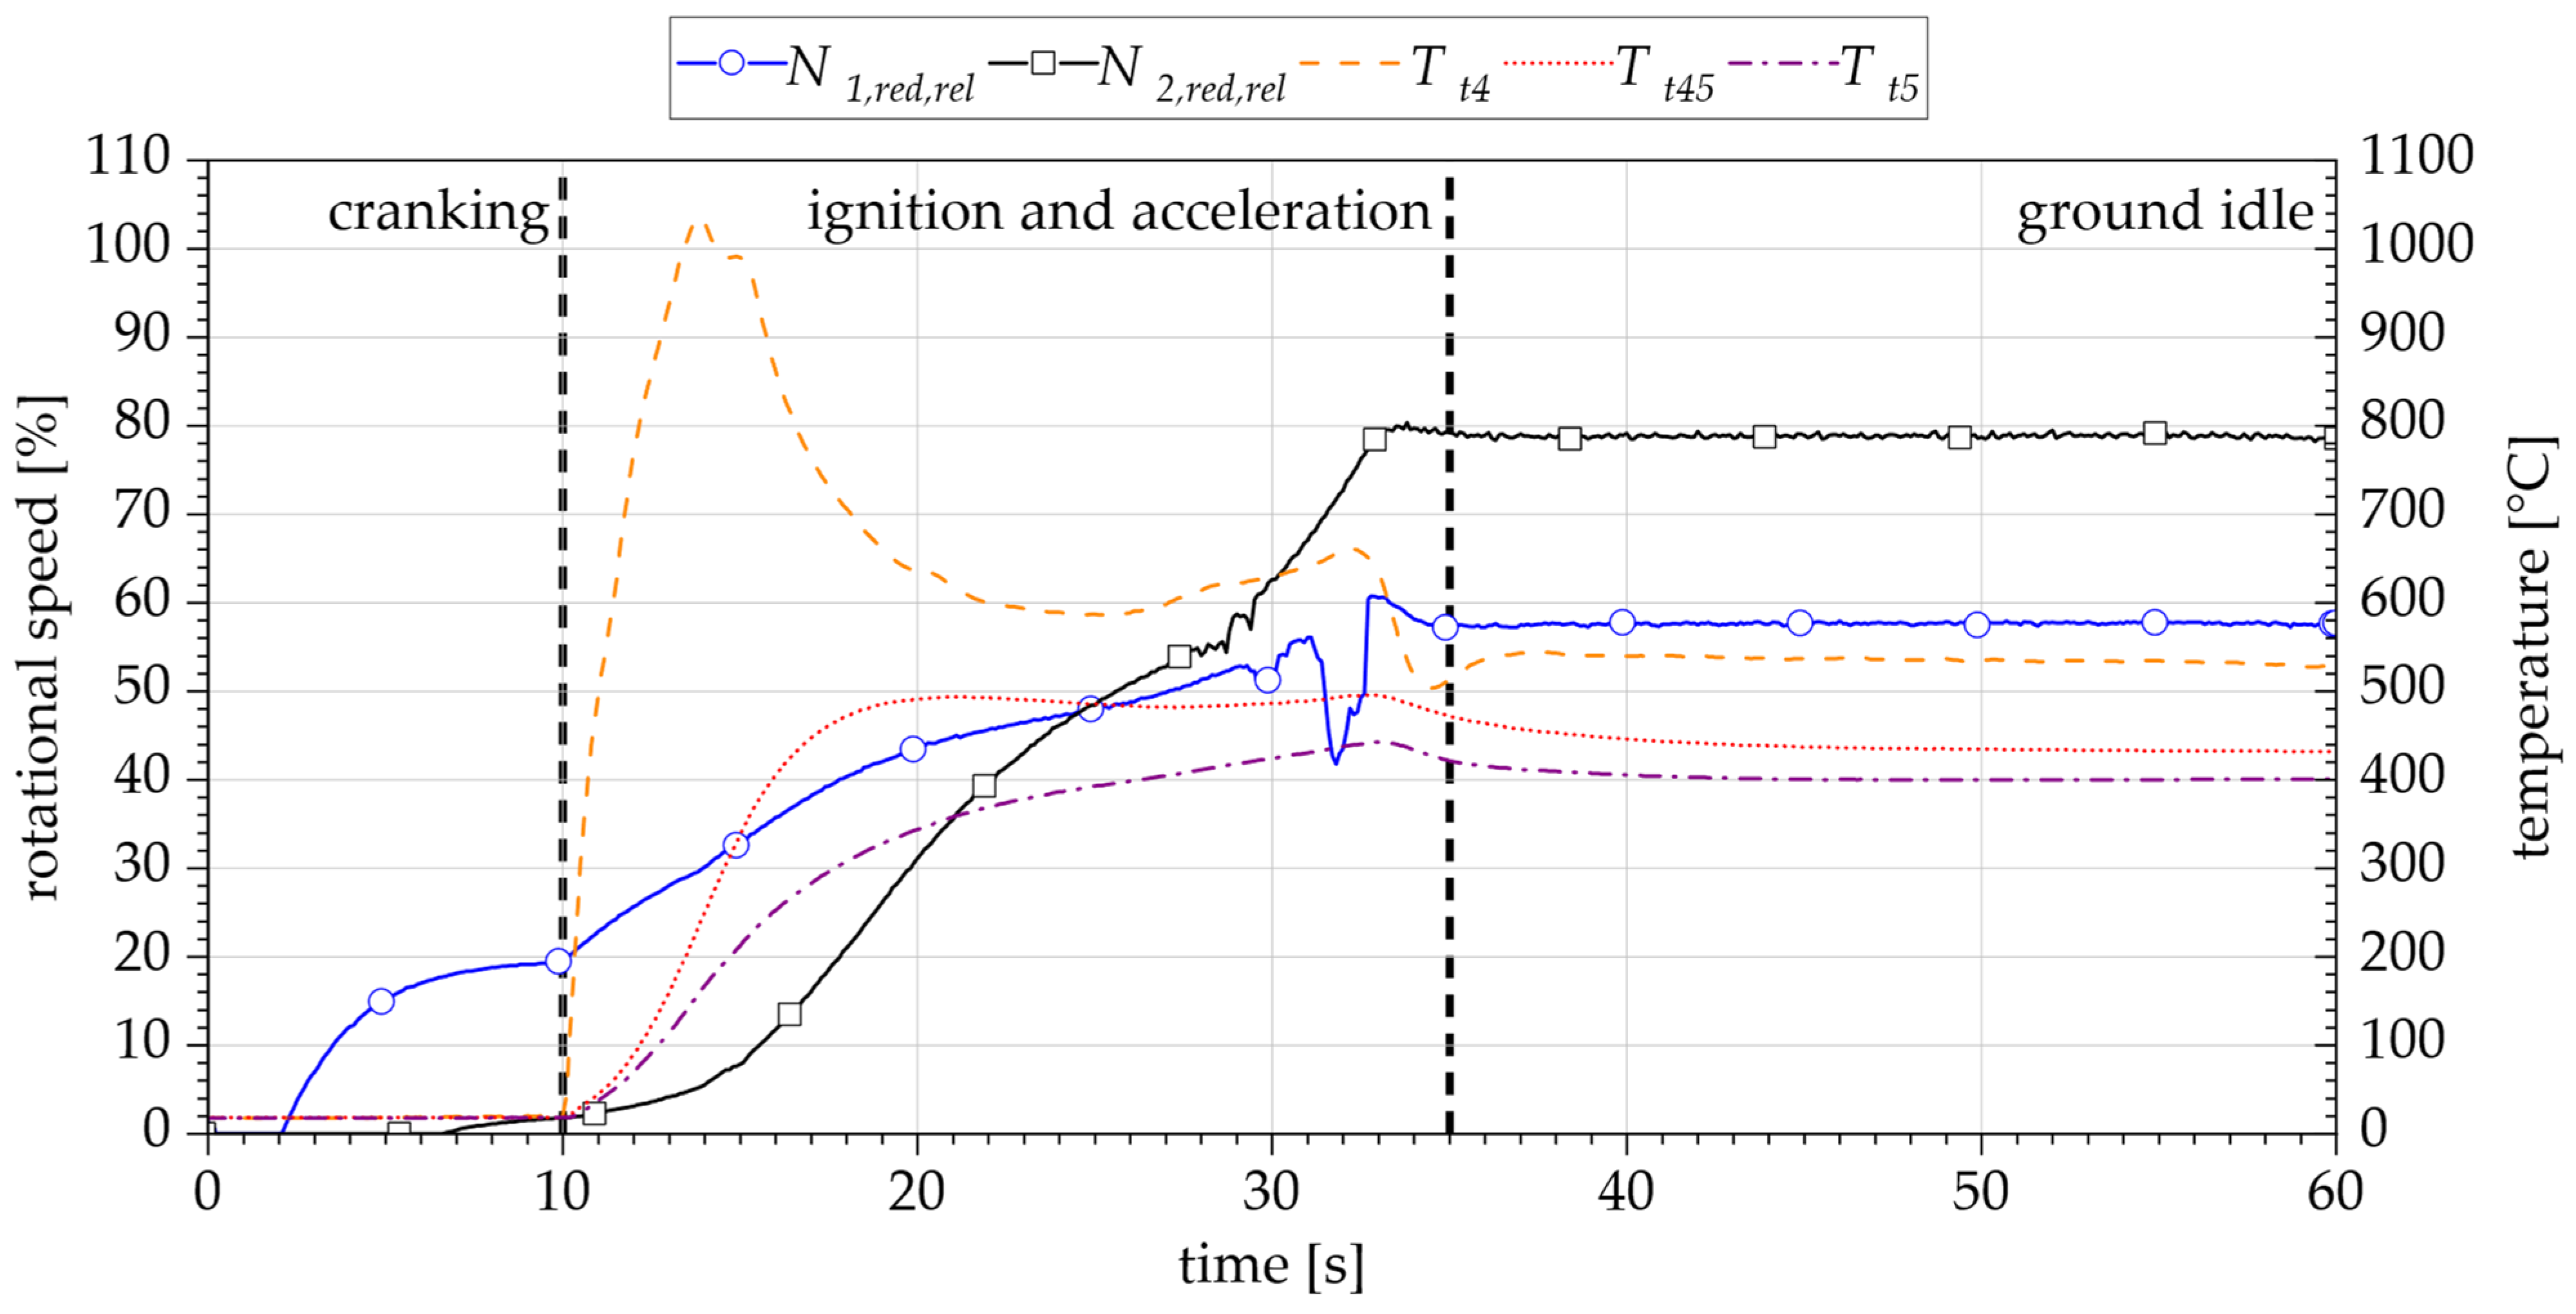
The start-up process of the M250 can be divided into three phases: cranking, ignition and acceleration, ground idle. Figure 9 shows the trends of the rotation speeds N1,red,rel and N2,red,rel (Equation (2)) as well as the HP turbine inlet temperature (TIT) Tt4 and the HP and LP turbine outlet temperatures (TOT) Tt45 and Tt5 throughout the process. It starts with the cranking phase, where the N1-shaft is accelerated by the electric starter motor. In parallel the ignition system is activated. Due to the low inertia of the generator coupled to the power turbine, it can be observed, that the output shaft N2 also starts rotating from aerodynamic coupling. After ignition speed of 15% is reached, the control lever is set from 0° to 30° to activate fuel flow, which leads to the ignition and acceleration phase. When the fuel is ignited the average HP TIT rises to an ignition peak of 1037 °C. The TOT and also start to rise. levels out at an average between 480 °C and 495 °C during the acceleration phase. Both shafts continue to accelerate after ignition. Around 30 s in the process, fluctuations in the speed measurement can be observed. These occur sporadically only during start-up, caused either by mechanical vibrations or electro-magnetic interference and not actual speed fluctuations. The third phase is the self-sustaining phase or ground idle. Once 58% of nominal is reached, the starter motor and ignition system are switched off. Before stabilizes at ground idle speed, slight overswings of temperatures and speeds occur. Since no helicopter rotor or brake with high inertia is connected to the output shaft, reaches its stable value of 79% almost simultaneously.
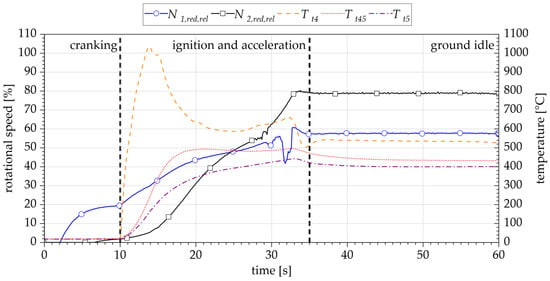
Figure 9.
Startup process for the gas turbine: rotational speed and turbine temperatures.
The next step to prepare the gas turbine to receive load, is to set the N1-lever to the 90° position. Testing of the system showed, that it was necessary to apply an initial amount of load to the MGU to emulate the torque caused by the inertia of rotating rotor blades before switching and then to gradually increase the N2-lever position from 0% to 50% to avoid triggering the over-speed protection. The lack of inertia of the output load leads to a transgression of the design speed when switching to flight idle with standard settings.
5.1.2. Load Fluctuations
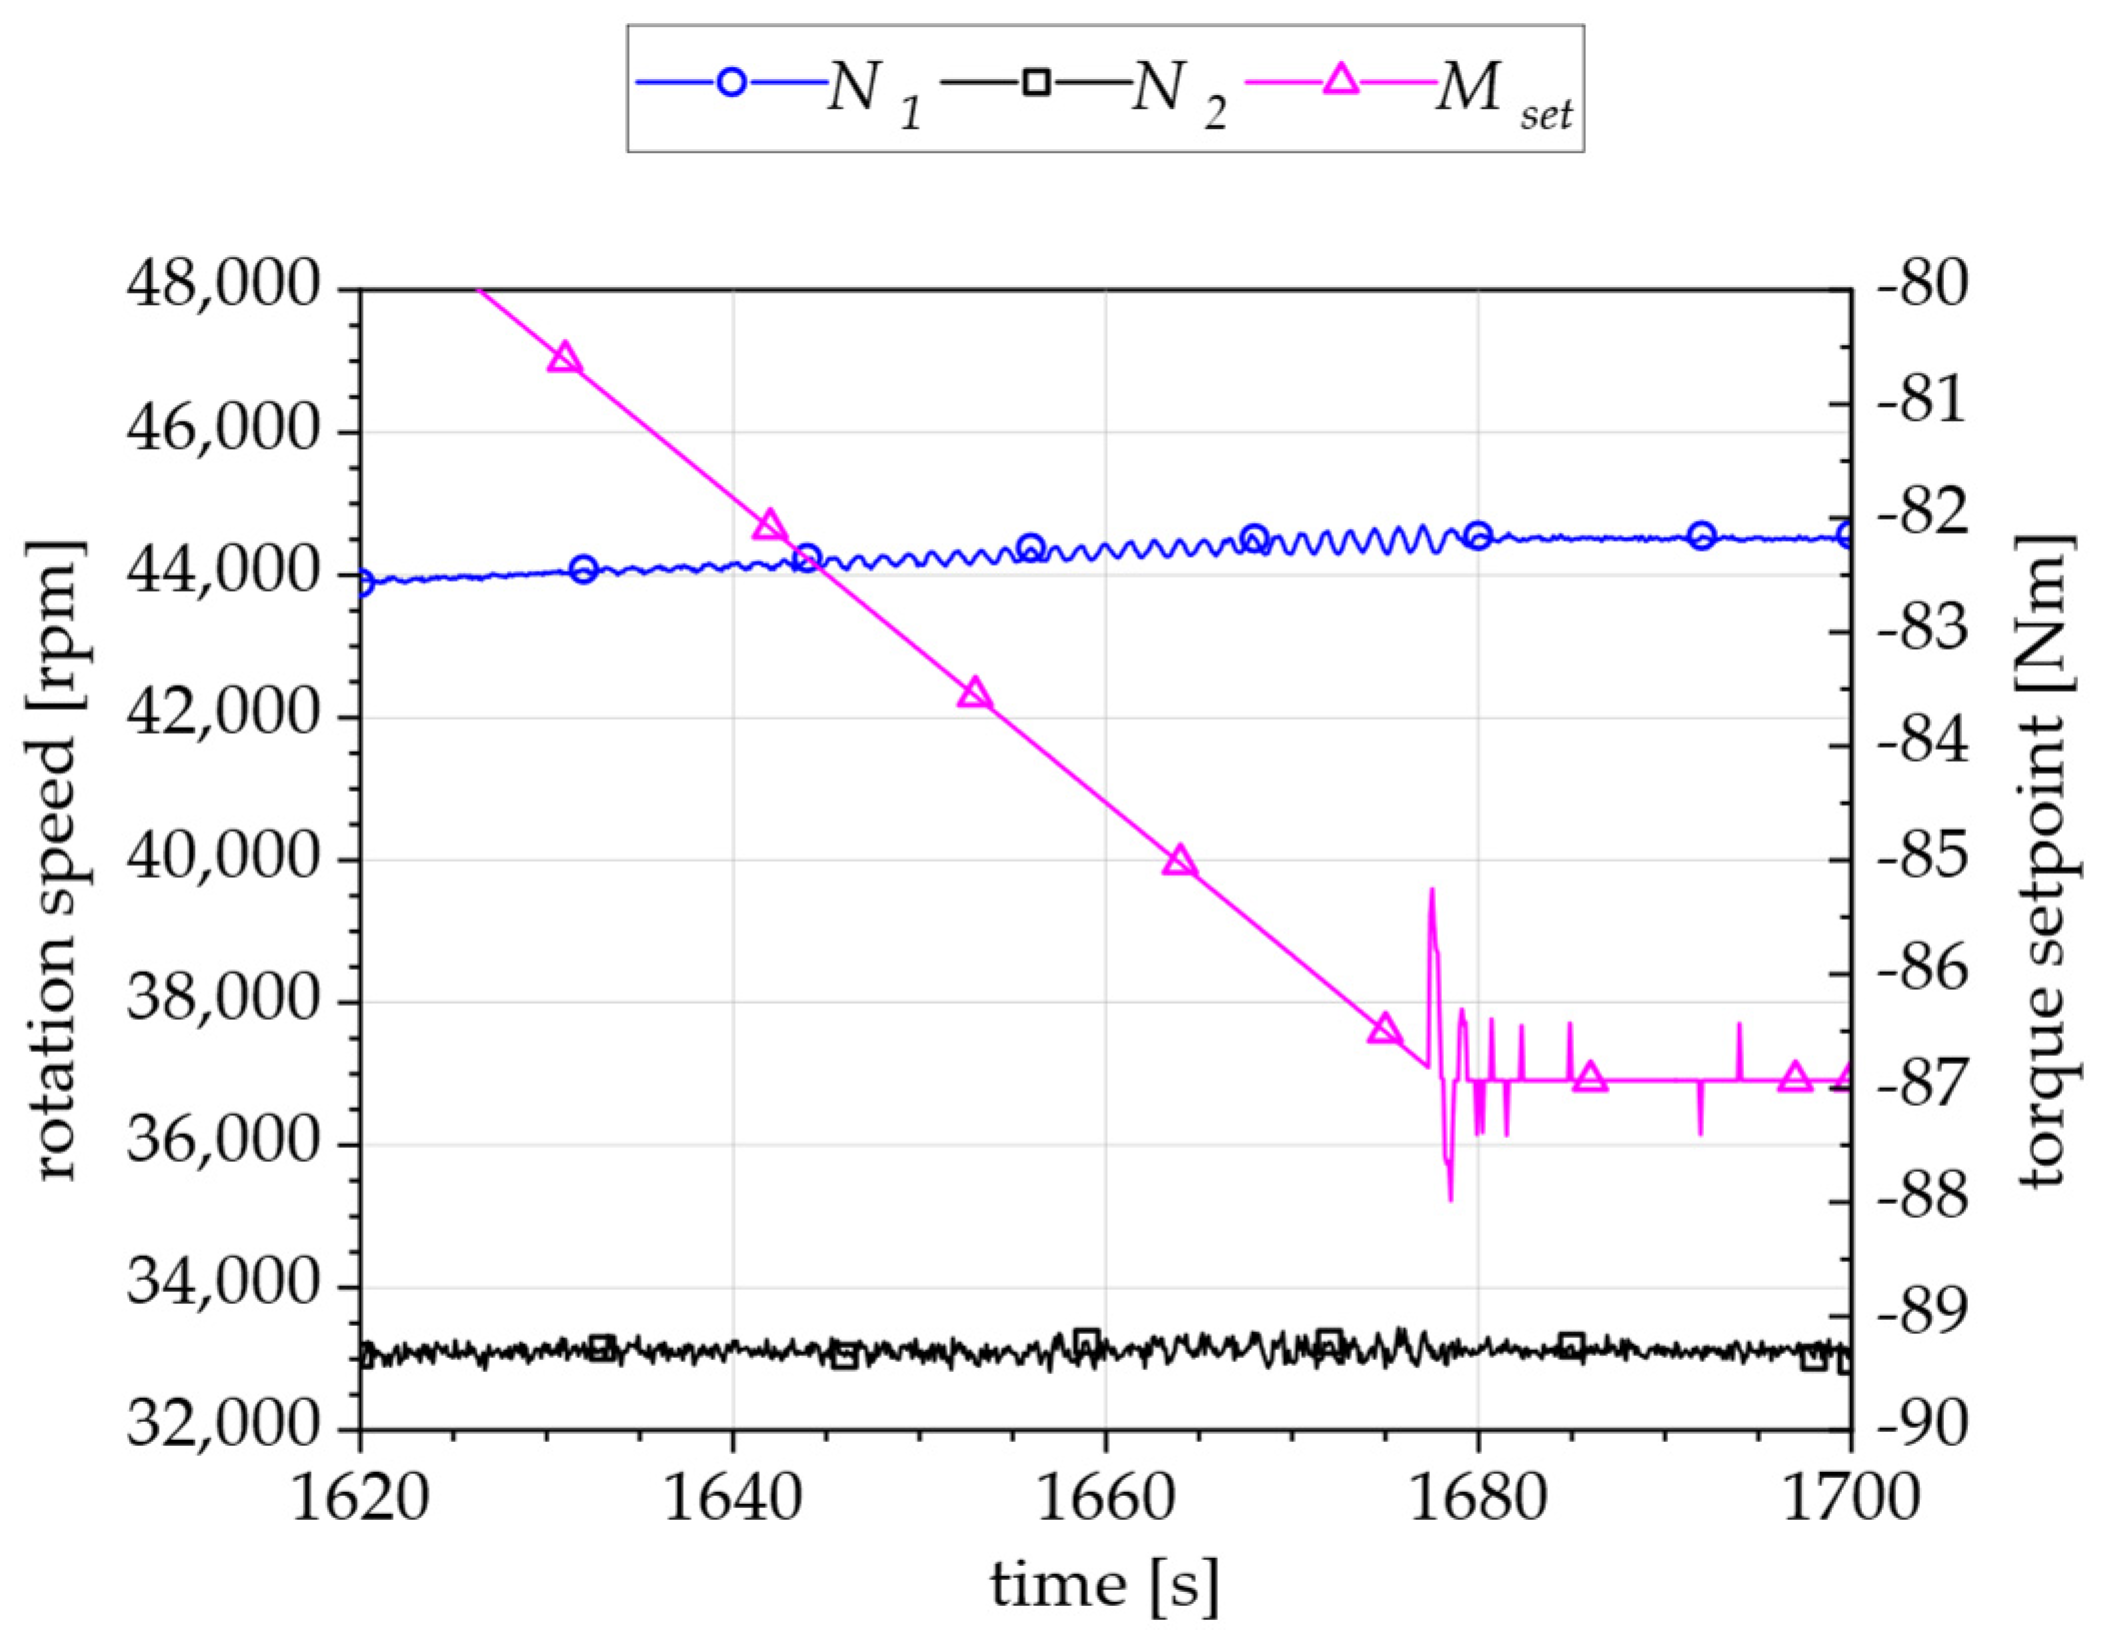
In a helicopter propulsion system, the presence of the rotor leads to a naturally stable operating point due to the rotor’s inertia counteracting any acceleration changes. When the rotor is replaced by a generator that imposes a constant torque, this compensatory effect is potentially compromised. To address this, a virtual inertia, in the style of electrical grid stabilization methods [35], is implemented for the generator. The virtual inertia is modulated based on the rate of change in the speed, thus emulating the original inertia-effect. As shown in Figure 10, at loads above 81 Nm, fluctuations in fuel mass flow, temperatures and consequently in and occur. To counteract this behavior the virtual inertia is activated at . The virtual inertia routine monitors the power turbine shaft speed , which should be constant during normal load operation. When active, it sets a threshold band between 150 rpm/s and 1000 rpm/s for the derivative of the power turbine shaft speed . If either the positive or negative halfwave of a fluctuation falls within this band, a counteracting torque push will be initiated for one control cycle of 5 ms, as can be seen by the torque set point in Figure 10. The level of torque push is calculated according to Equation (1) with the empirically determined scaling factor = 0.45 Nm and is limited to ±3 Nm. The effectiveness of the measure is well visible since the oscillations in and are efficiently damped.
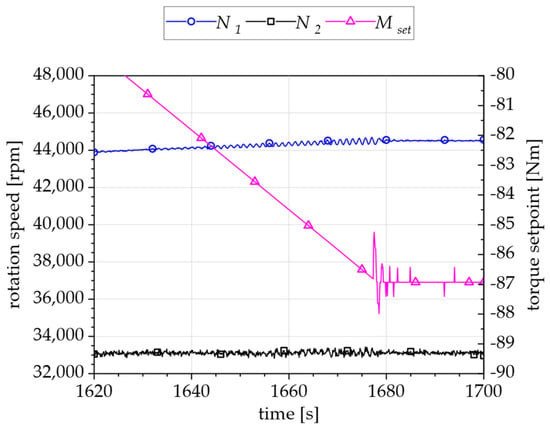
Figure 10.
Controller stabilization with virtual rotor inertia at higher load points.
5.1.3. Load Rejection Event
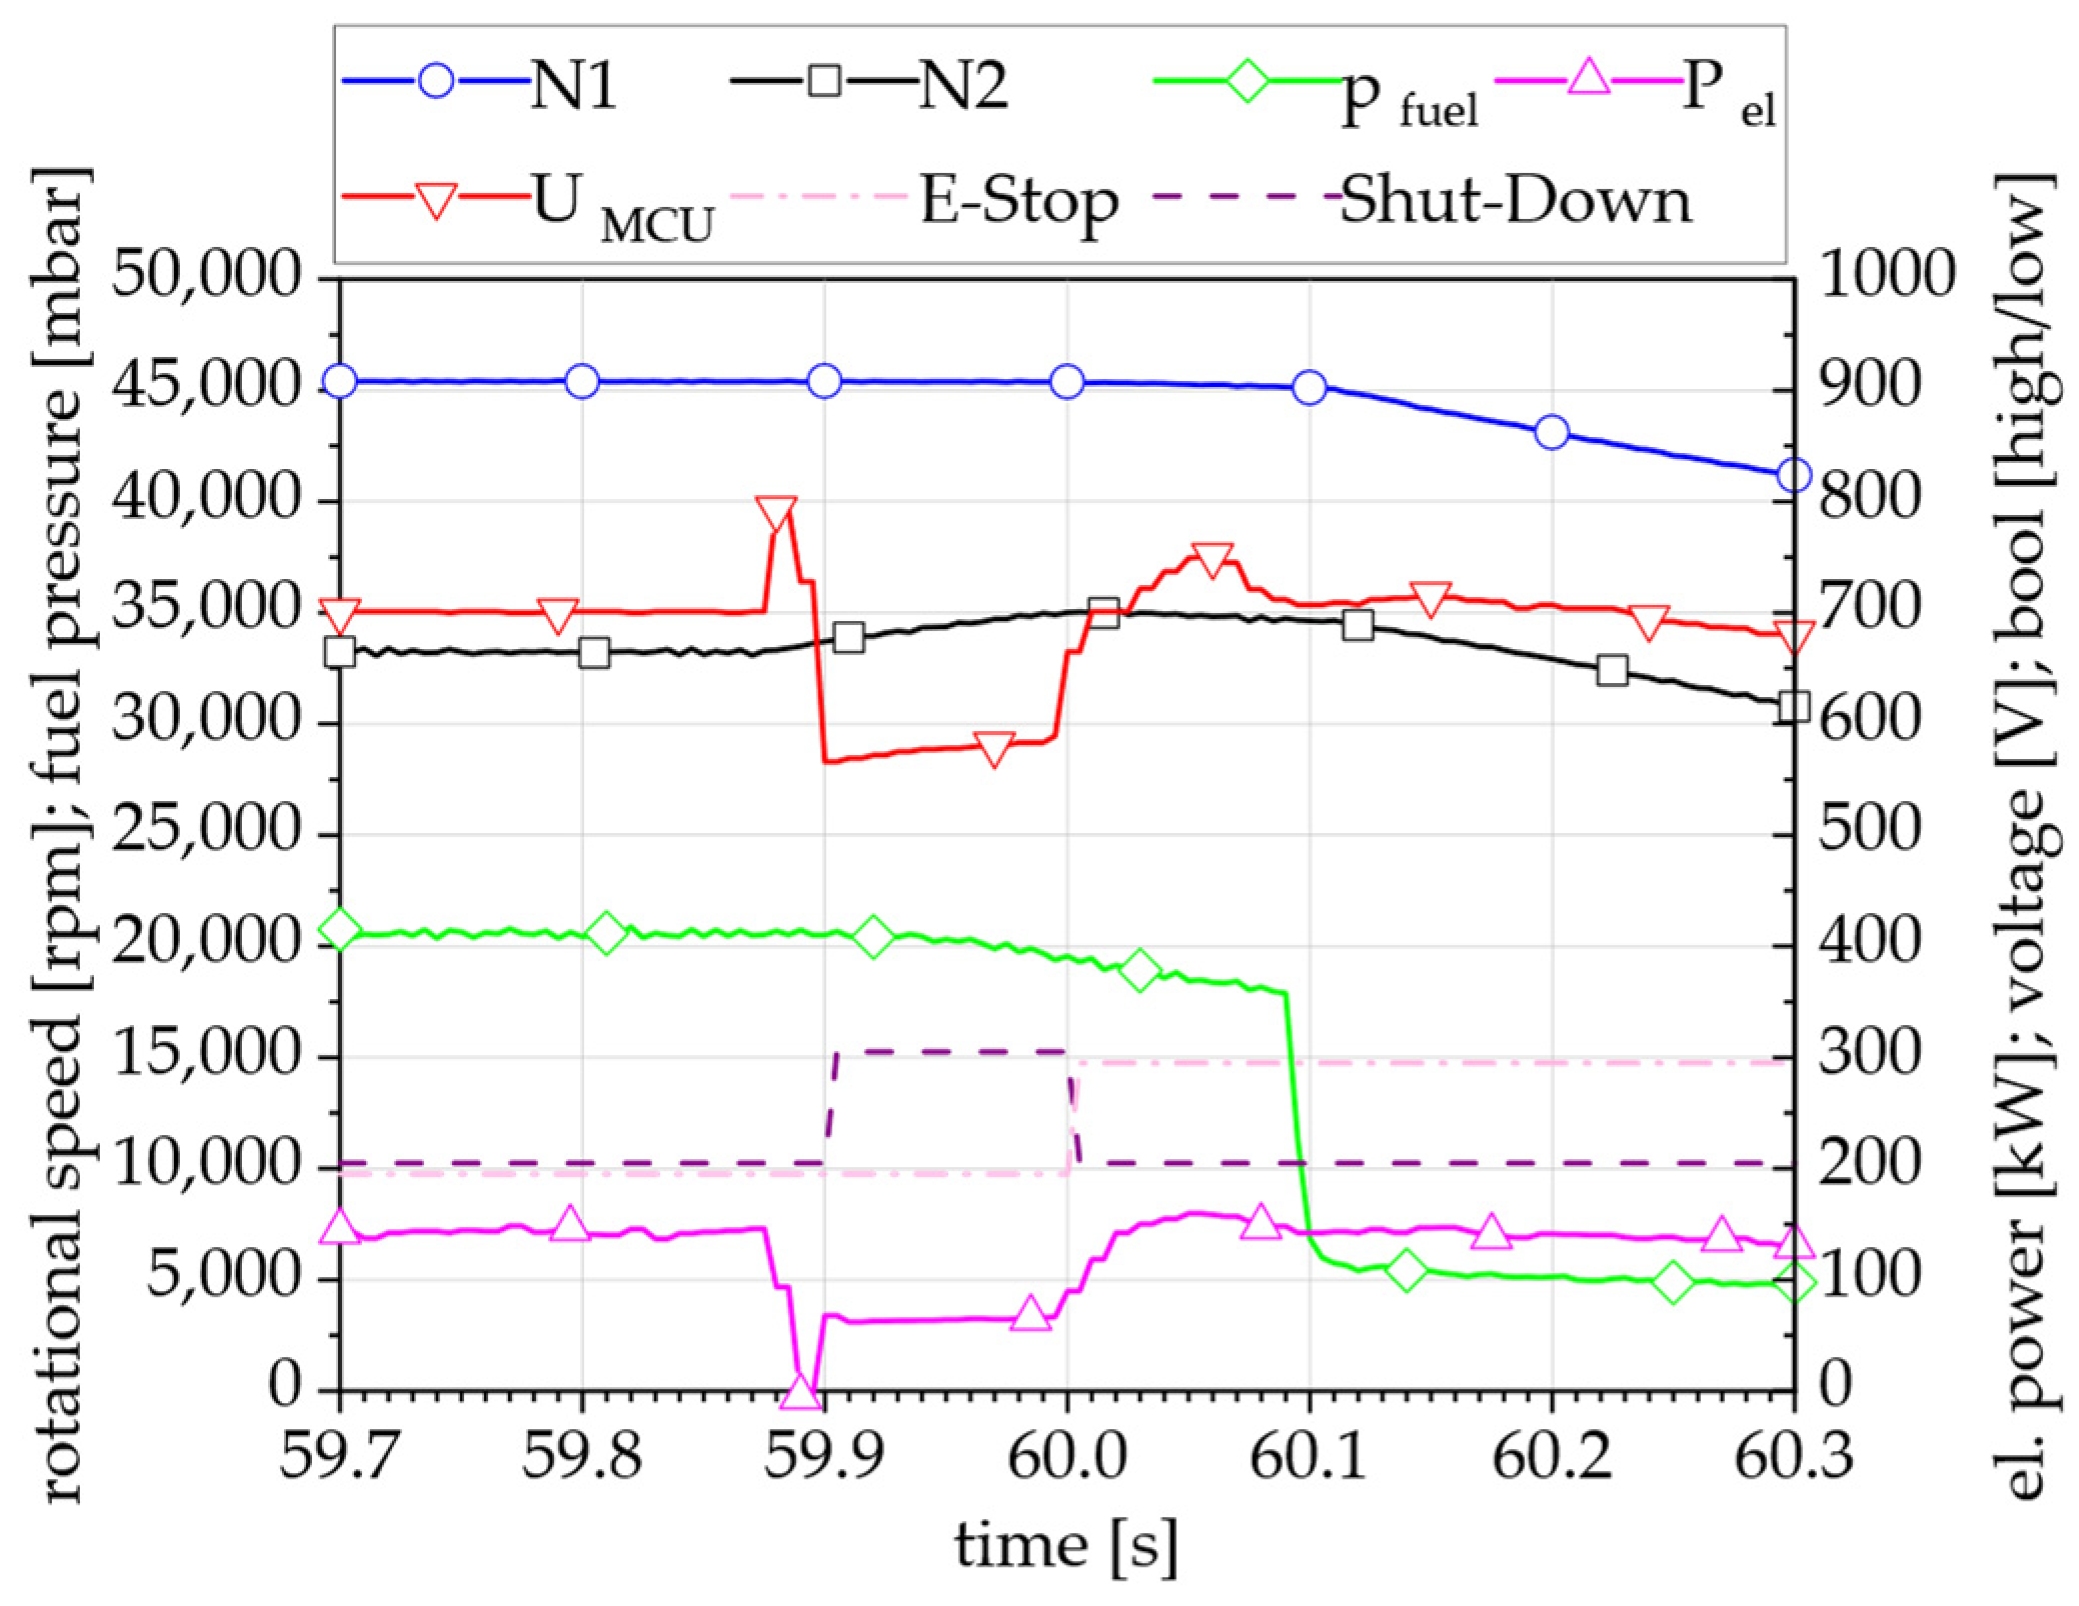
As described in Section 4.2.4 the intermediate DC circuit is generated and stabilized by a bi-directional power supply while a rented resistor load bank is used to dissipate most of the generated electrical power as heat. The load of the load bank is generated by combining a set of resistors of various sizes. Exceeding a load set point of 150 kW a bulk of small resistors is replaced by one big one. The process is shown in Figure 11. During the transition a short interruption of the resistor circuit occurs at 59.85 s, which result is a voltage peak of the DC circuit that exceeds the generator limit and hence a loss of generator torque . This initiates an automated shut-down. After the immediate recovery of the intermediate circuit by the DC power supply an interim of 30 kW are fed to the grid before the full recovery of the load bank resistance. However, the remaining 30 kW and countermeasures of the fuel controller (decrease in at 59.9 s) are not sufficient to prevent exceeding the safety limit, which triggers an emergency stop (E-Stop) at 60.0 s. As can be seen by the fuel pressure drop, it takes 0.1 s to cut the fuel supply after the event is raised.
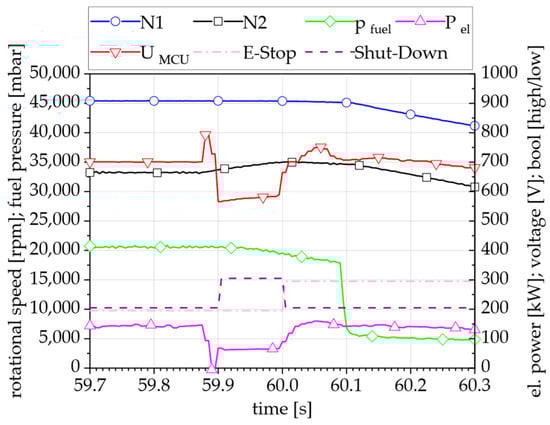
Figure 11.
Load rejection and emergency stop event.
This load rejection is solely a result of the unfavorable switching behavior of the load bank which was rented for the initial commissioning of the M250. As described earlier, in the hybrid electric configuration (Figure 3), the generated power will be continuously fed to the grid by the battery emulator, hence avoiding load interruptions.
5.2. Steady State Characterization of the Gas Turbine
For the steady state characterization, the data are presented as function of relative reduced N1-shaft speed which is calculated according to Equation (2) from the natural shaft speed N1, related to the design shaft speed of 50,970 rpm corrected with the ambient temperature in relation to the reference temperature of 288.15 K. The presented points are taken at design power turbine shaft speed (Table 1).
5.2.1. Power Characteristics
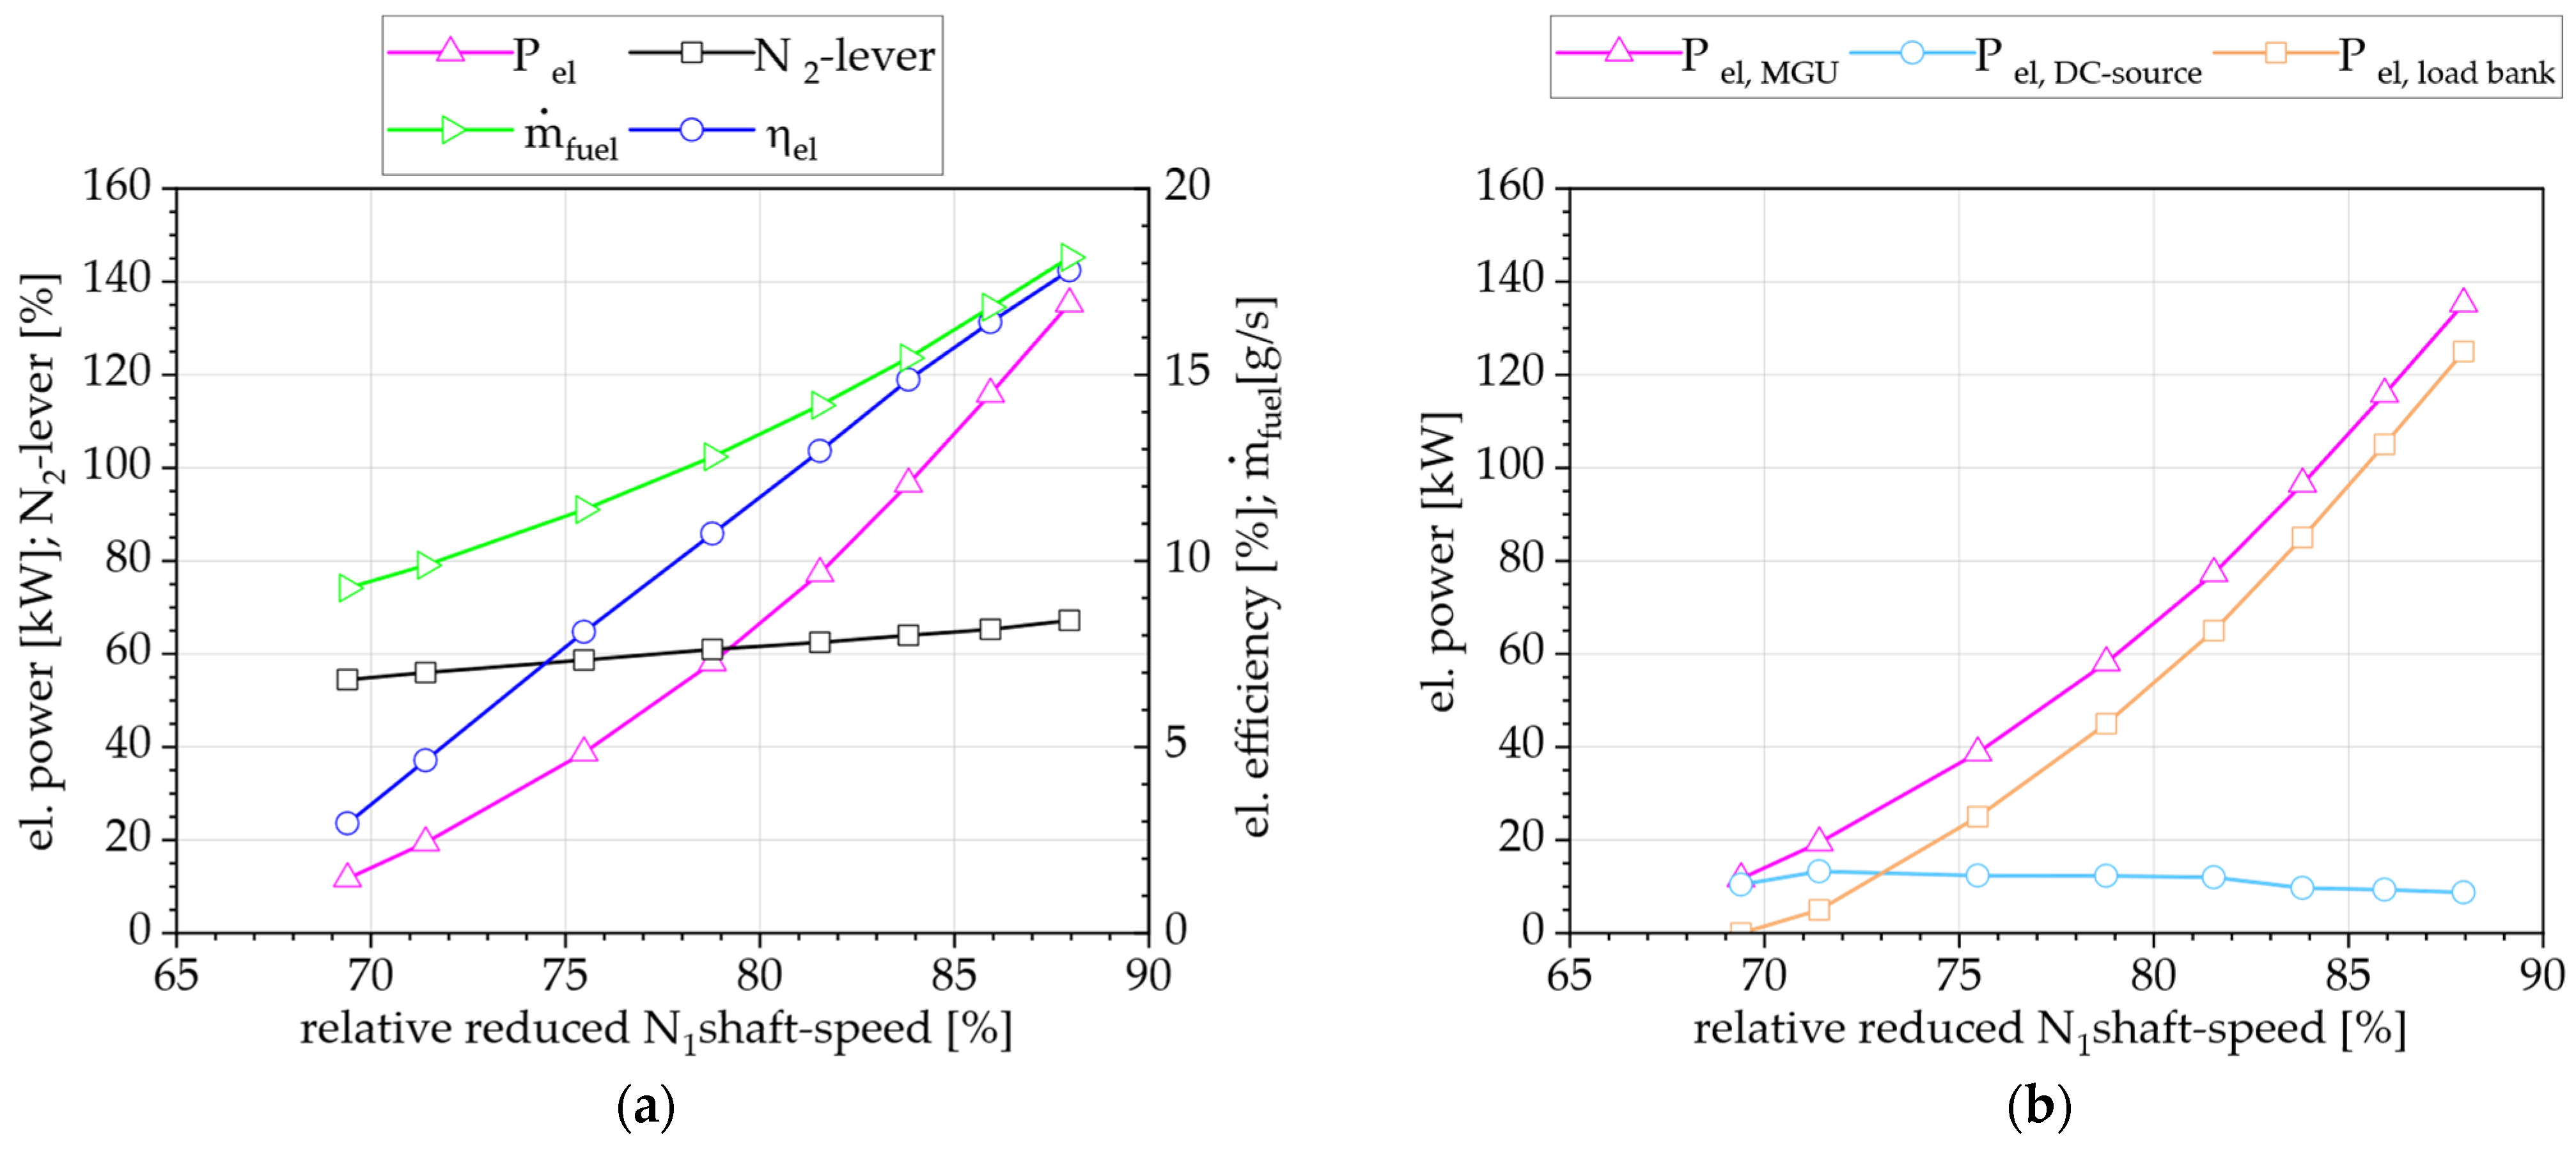
As described in Section 5.1.1 it was necessary to apply an initial load to the MGU before accelerating to nominal output shaft speed. Hence, as shown in Figure 12a the el. power output starts with 12 kW at about 69% N1-shaft speed. The currently highest steady-state load set-point of = 140 kW is reached at = 88%. The measured fuel flow increases from 9.27 g/s at flight idle to 18.15 g/s at 140 kW. Compared to the base line results of the experiments by He [23], the fuel mass flow appears slightly higher. From the electric power and the fuel flow the resulting electrical efficiency can be calculated with the lower heating value. For the used Jet A-1 this is 43.273 MJ/kg. Hence the electrical efficiency is 17.8% at 140 kW. If the trends are extrapolated to 100% , the electric efficiency increases linearly to 27.8% for a peak electric power between 295 kW (2nd order polynomial extrapolation) and 318 kW (3rd order). As mentioned in the introduction of this section, the readings were taken at a constant speed. To compensate for changes depending on shaft load the N2 governor lever is adjusted accordingly between 56% and 67%, which is also displayed in Figure 12a. The generated electric power is distributed between the el. load bank and the DC-source as shown in Figure 12b. From the overall power set-point and a threshold of 15 kW grid export for the DC-source a set-point for the load bank is calculated and adjusted. The offset between the actual resistor load of the load-bank and the overall power output is then compensated by the DC-source . From the power set-point and the design speed a torque set-point for the MGU is calculated. Therefore, if the speed is not adjusted properly an offset between power set-point and power output will arise. The constant speed value is assumed to avoid controller instabilities due to torque set-points fluctuating with speed.
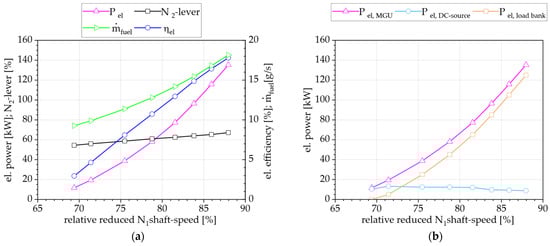
Figure 12.
(a) Power efficiency and control parameters of the M250 (b) Power distribution.
5.2.2. Compressor Characteristics
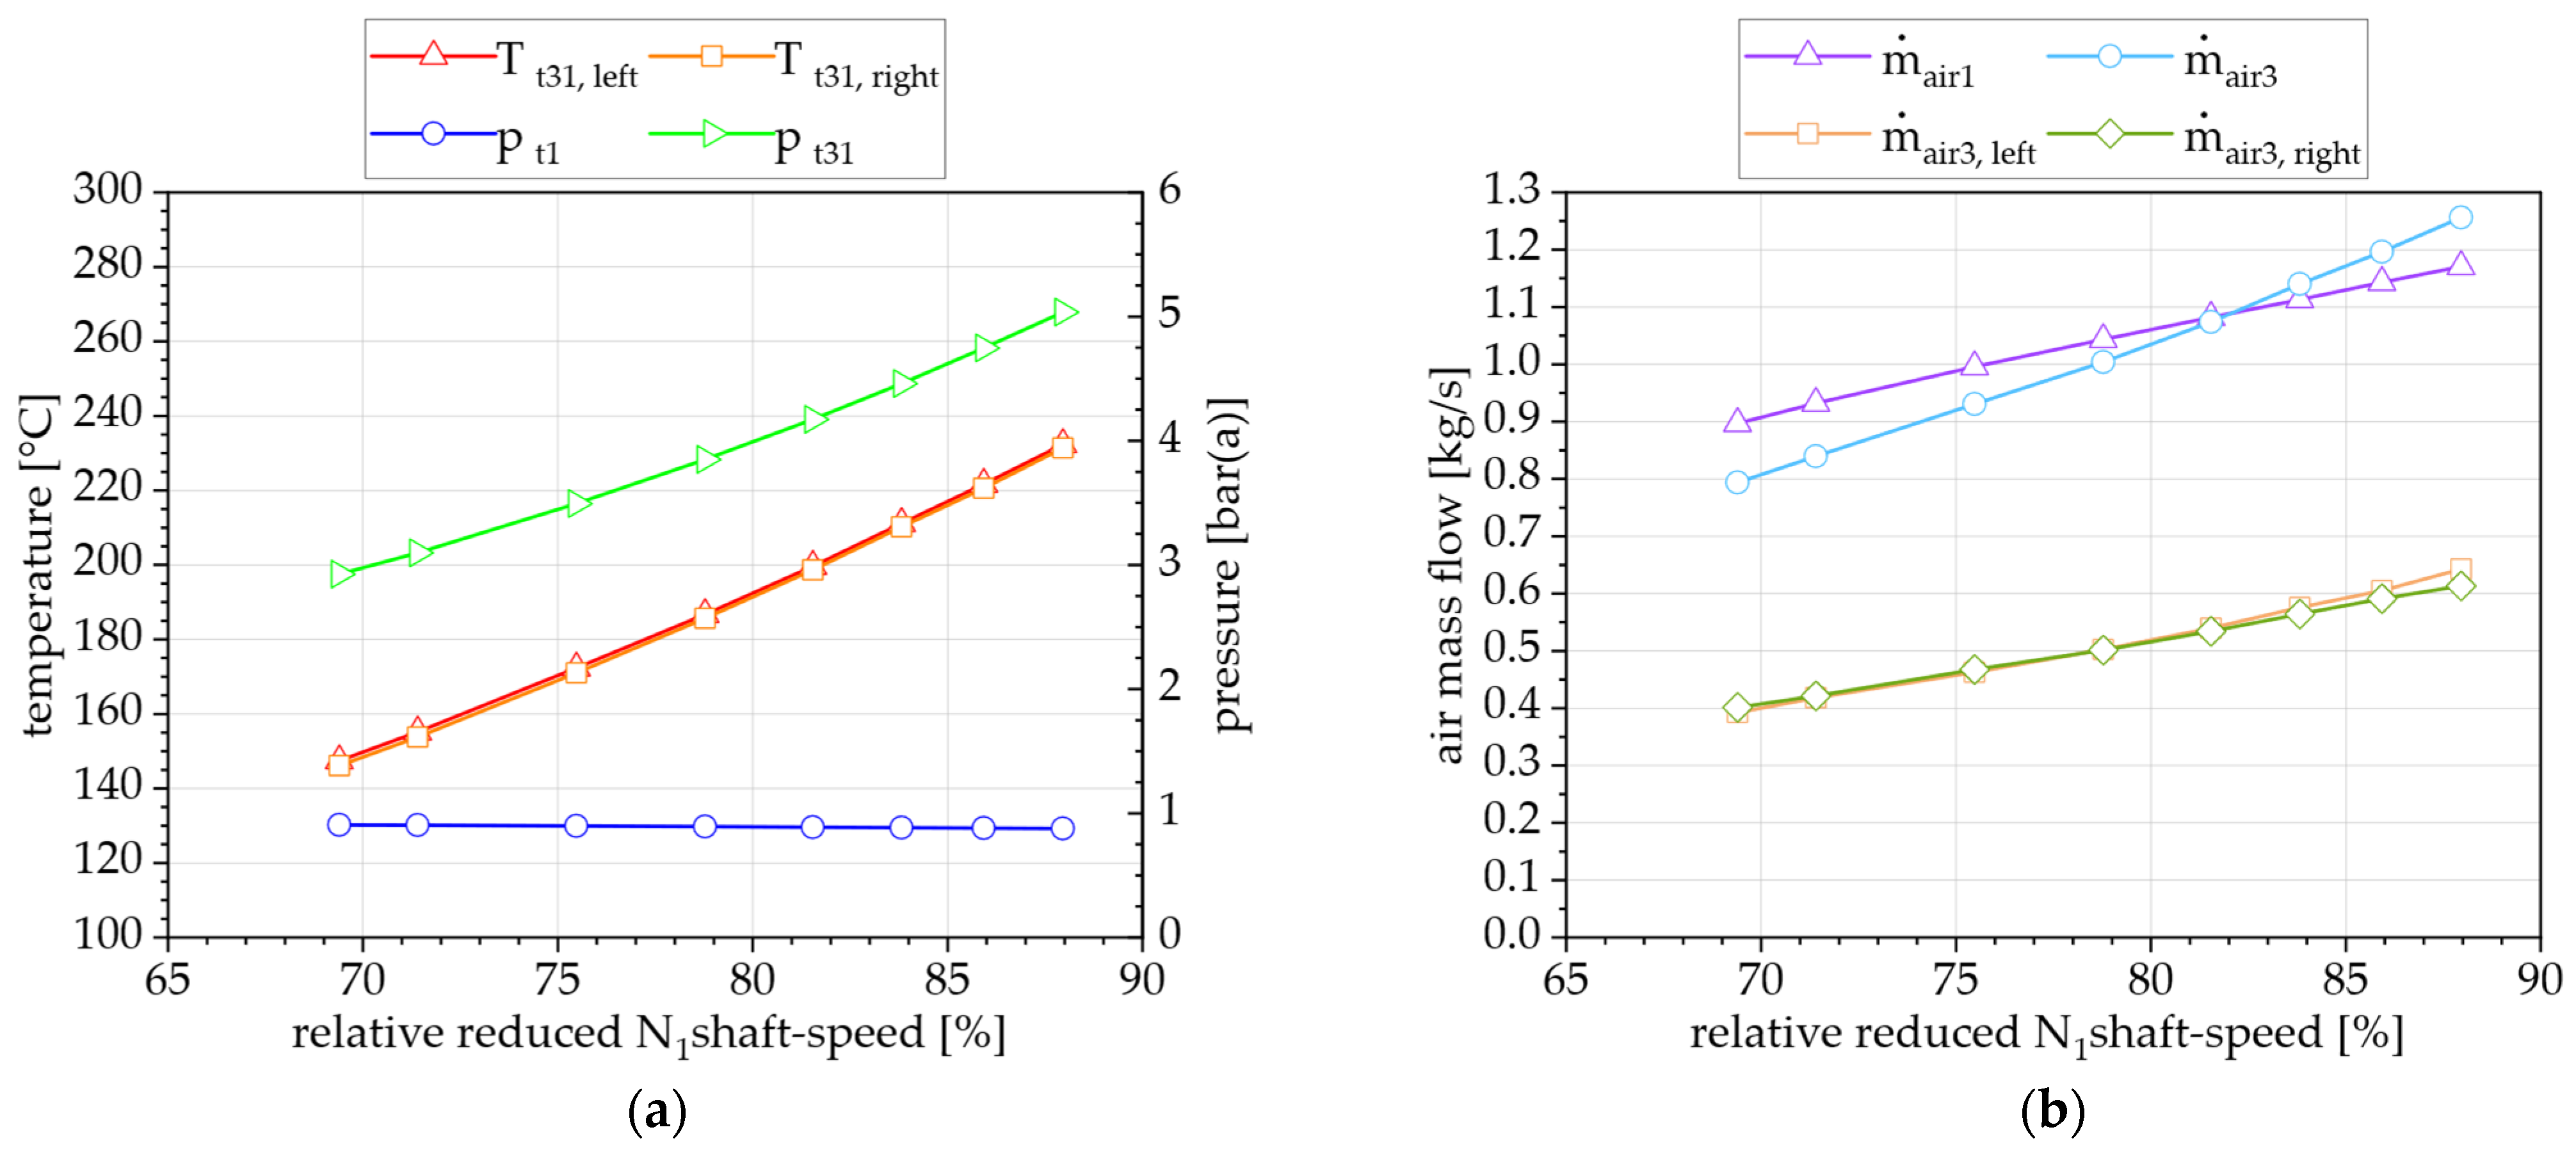
The characteristics of the compressor are described in this section. The compressor inlet temperature is constant around 12 °C and the inlet pressure at 942 mbar. The pressure-increase with is shown in Figure 13a. The measured compressor outlet total pressure is identical for both outlet tubes, hence the average is displayed. From 69% to 88% speed, increases from 2.9 bar(a) to 5.0 bar(a). If extrapolated to design speed, the pressure would increase to just above 7 bar(a). The temperature-rise resulting from the compression is also visible in Figure 13a. Compressor outlet temperature increases from 147 °C to 232 °C, as can be seen the readings on both sides are also identical.
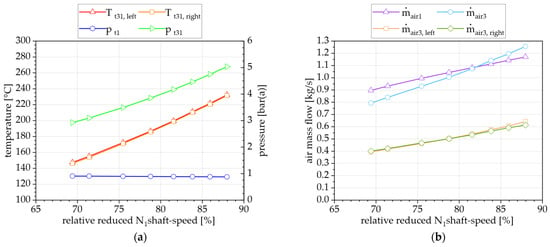
Figure 13.
(a) Temperature and pressure conditions of the compressor (b) Air mass flow measurements.
The compressor features a pressure activated bleed valve at the axial stage five. Therefore, compressor inlet and outlet mass flow are not identical in all operating points. The mass flow determined from the calibrated differential pressure inlet nozzle and the mass flow in the transfer tubes are shown in Figure 13b. As expected, the outlet flow is lower compared to the inlet flow for lower shaft speeds. However, instead of aligning after the closing of the bleed air valve, the trend of the outlet flow rises above the inlet flow. The status of the bleed valve is observed with a camera and the closing point lies around 82% shaft speed, which coincides with the intersection point of the mass flow trends. As a result of the closed bleed valve, a stagnation in mass flow rise would have been expected, however this is not clearly visible in the measurement data. The mass flows in both tubes and show consistent trends, which adds to the plausibility of the readings. A full analysis and calibration of the mass flows can only occur when the full load range is characterized and also an exhaust gas analysis is available to calculate the air mass flow from O2 and CO2 concentrations in the exhaust gas, for reference.
5.2.3. Combustor Characteristics
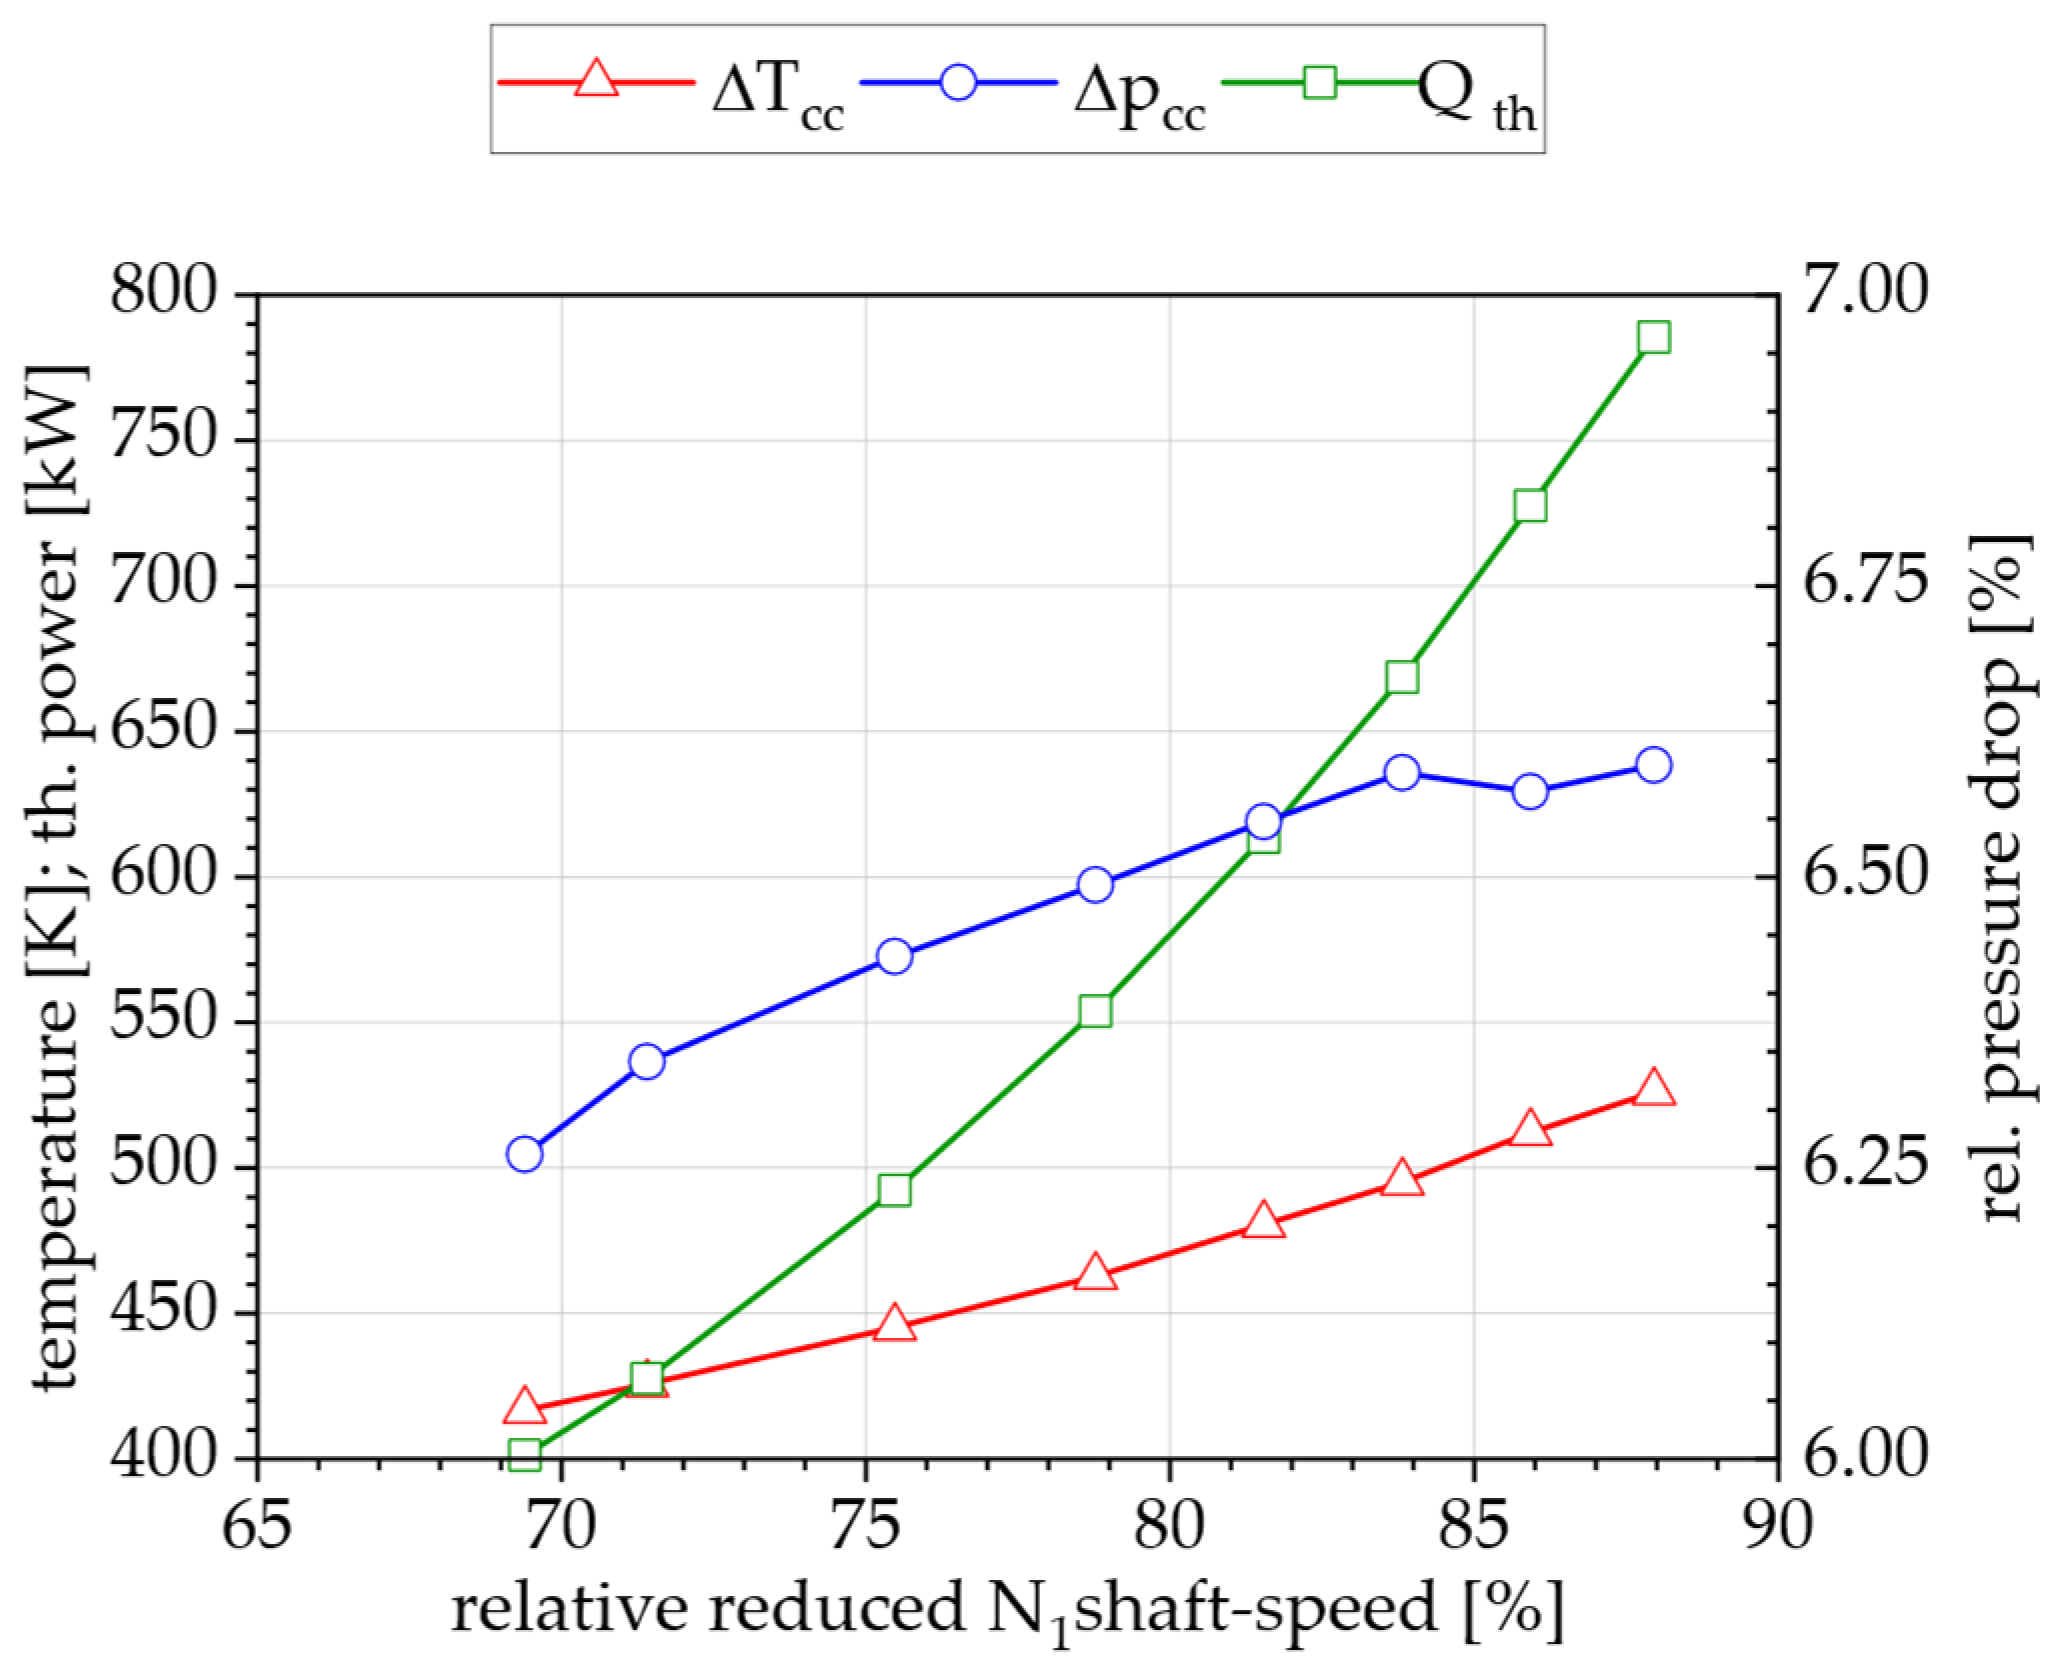
The subsequent component of the compressor is the combustion chamber. The main data of interest are the exhaust gas emissions resulting from the combustion, which are not yet recorded during commissioning. Figure 14 shows the thermal power added in form of fuel. At 12 kW el. output the thermal power of the combustor amounts to 401 kW and increases to 786 kW at 140 kW of el. power output. In the design point this would reach around 1200 kW if extrapolated. The added thermal power leads to a temperature rise between 416 K and 526 K in the examined range. The combustion chamber components and the heat release of the combustion lead to a pressure drop over the combustion chamber. Starting off at 6.25% it only increases slightly to 6.65% in the examined range.
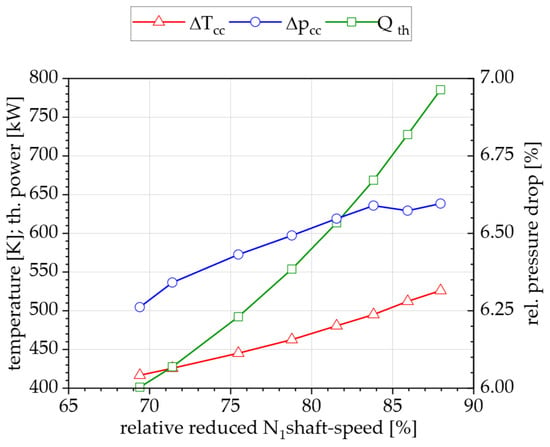
Figure 14.
Temperature and pressure changes in the combustor and added thermal power.
5.2.4. Turbine Characteristics
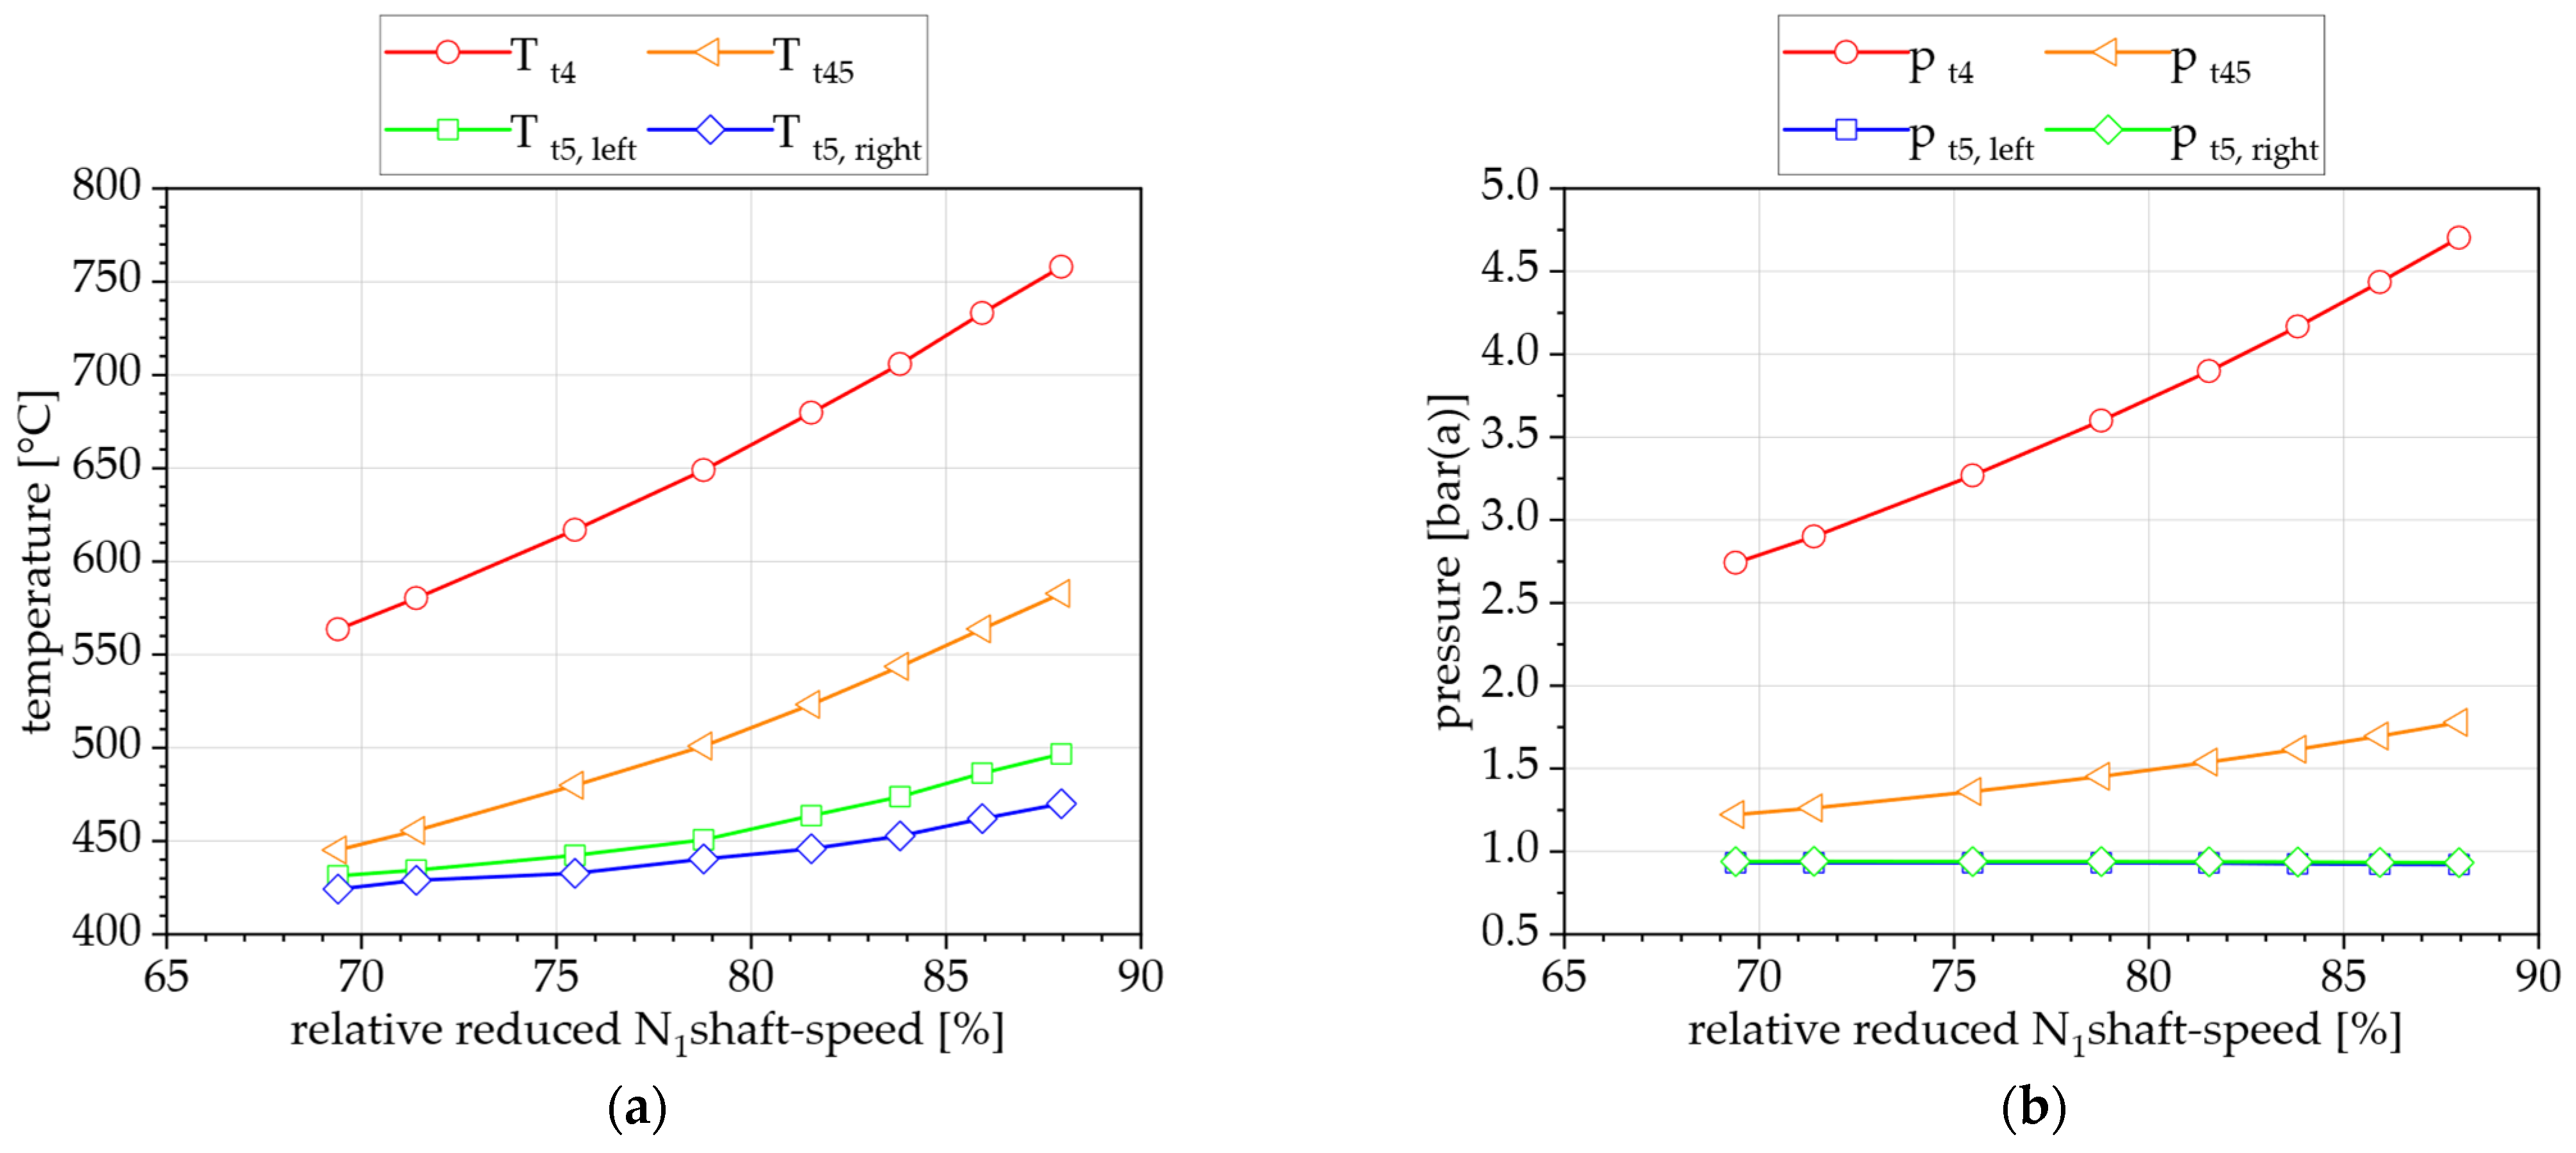
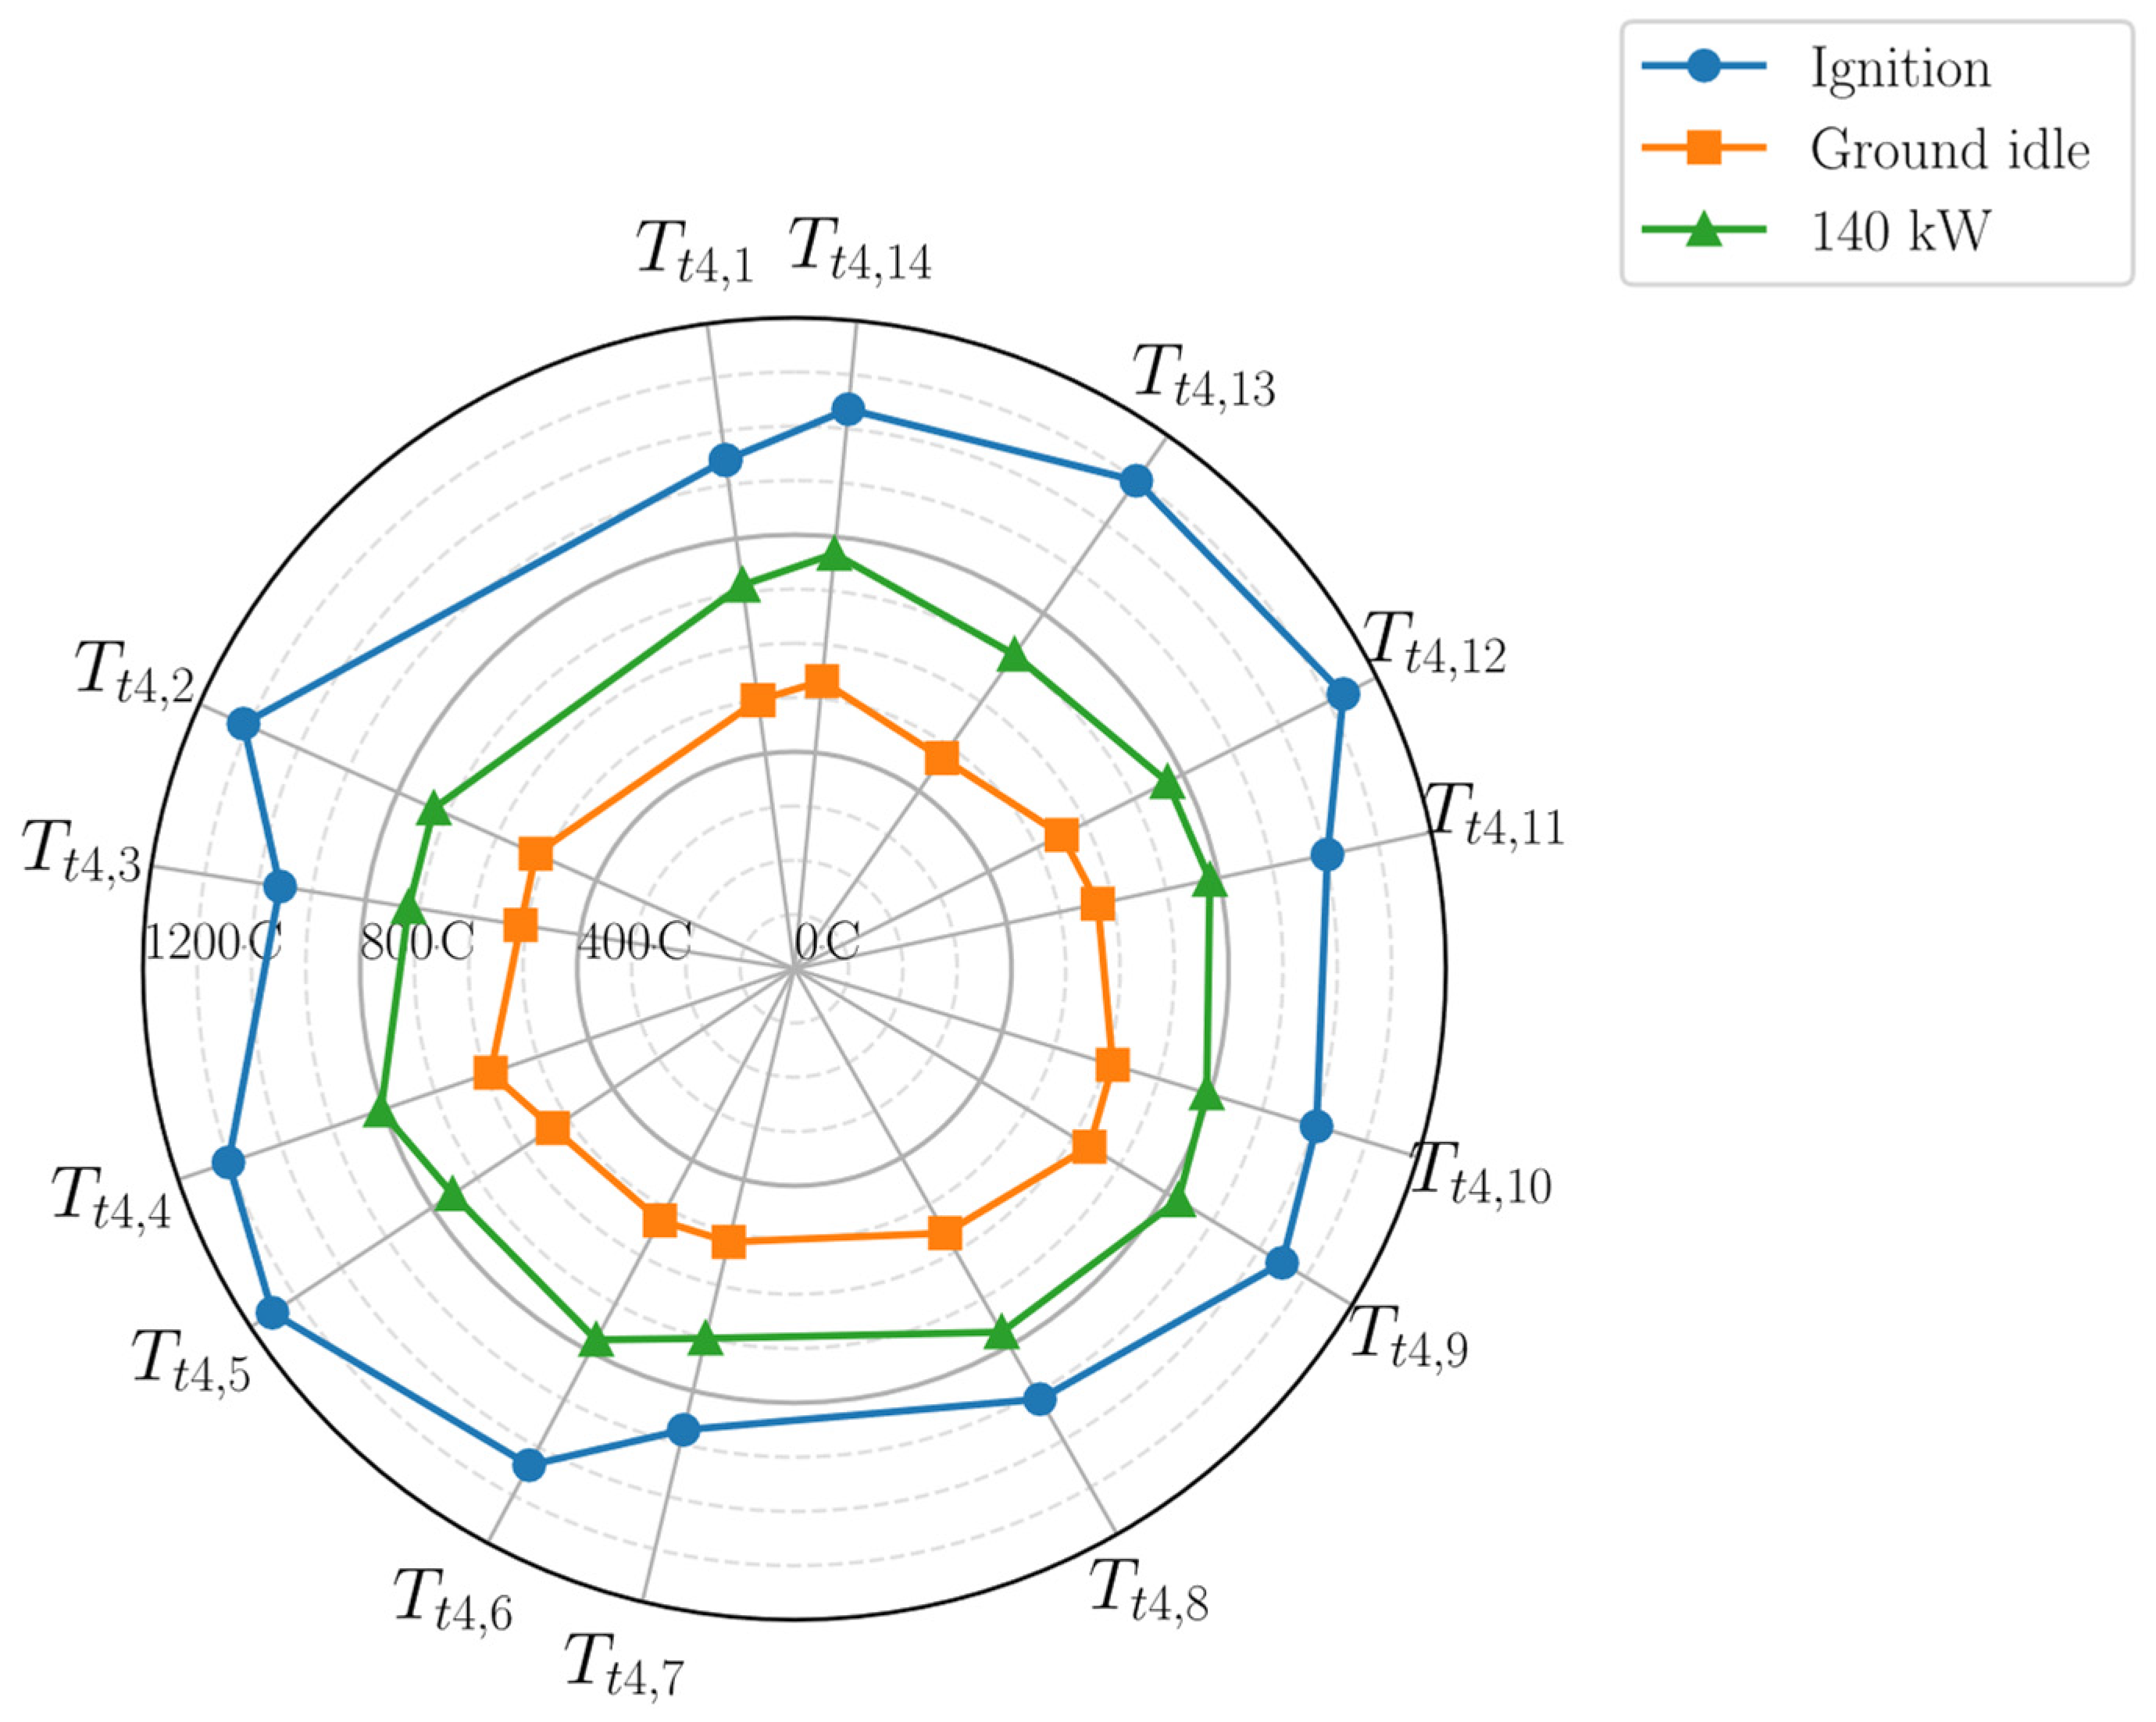
The hot combustion gases are expanded over the two axial turbines. The inlet and outlet temperatures are shown in Figure 15a. The average inlet temperature of the HP turbine increases from 563 °C to 758 °C in the currently tested range. As shown in Figure 8a the HP turbine inlet is instrumented with 14 thermocouples around the circumference. The temperature profiles derived from the single thermocouples are shown in Figure 16 for the ignition peak, the ground idle point and the currently highest load point of 140 kW. It is clearly visible, that the spread of temperatures is quite high, with 122 K difference between lowest and highest reading at 140 kW. The spread further increases for lower loads, but the overall profile shape remains similar. During steady state operation the turbine inlet profile shows the tendency of a hot spot in the lower right section.
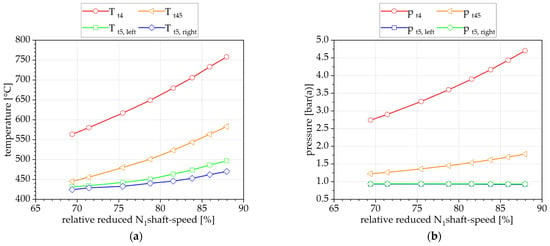
Figure 15.
(a) Temperature and (b) pressure conditions of the turbines.
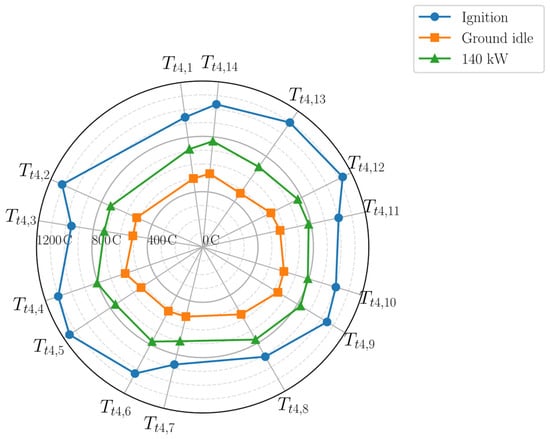
Figure 16.
Turbine inlet temperature profiles derived from measurement locations to .
The average TOT of the HP turbine is shown in Figure 15a. It lies between 445 °C and 583 °C in the investigated load range. The extrapolation points to a value of 730 °C at full load, which would be just below the limit for normal ‘cruise’ load.
The exhaust gas exiting the LP turbine is split between two channels. The currently highest measured average temperature is 496 °C for . It can be seen, that the remaining angular momentum after the turbine leads to the exiting of the hotter gases on the left hand side.
The turbine inlet pressure is reduced compared to the compressor outlet pressure by the pressure loss of the combustor . As can be seen in Figure 15b between 80% and 90% of the turbine inlet pressure is relieved over the high pressure turbine N1. The measured total pressure between the turbine stages increases with from 1.09 bar(a) to 1.78 bar(a). The pressure at the turbine outlet is similar for both exhaust tubes with the left hand side showing about 10 mbar less. The total average pressure decreases with higher in the examined load range from 938 mbar by 12 mbar.
5.2.5. Vibration Characteristics
For acceptance testing the M250 can be equipped with vibration speed sensors at the compressor, turbine and gear-box. These are permanently installed at the HeBo rig. The sensors are located at the top of the M250 along the centerline. The sensor readings are shown in Figure 17. The readings are taken from a full test run, including transient load changes. In general, the vibration velocities are within the manufacturer’s boundaries for M250 acceptance testing. However, a strong increase can be seen between 80% and 85% at the compressor and gear-box. Towards 90% the readings appear to stabilize. At the turbine the amplitude fluctuates between 3 mm/s and 10 mm/s. In future the test rig will be additionally equipped with frequency resolved acceleration sensors in parallel to the vibration speed sensors. This will help to identify the source of the vibrations, in correlation with the number of blades at each compressor and turbine stage or the number of teeth of the gear wheels.
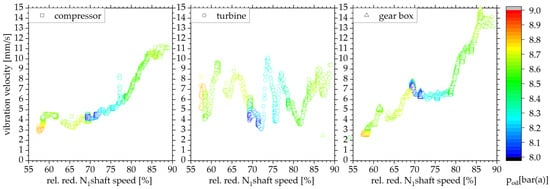
Figure 17.
Vibration velocities at compressor, turbine and gear box.
The vibration amplitude is plotted in Figure 17 in combination with the lube oil pressure . Test runs with different settings of the pressure adjustment screw have shown that the vibration level is affected by the pressure. The oil pressure is generated by a gear pump coupled to the N1 shaft. It can be seen, that starting from lower speeds the oil pressure decreases despite higher shaft speed as a result of the oil reservoir heating up. From flight idle onward the pressure then increases again. This however, is not expected to be the root cause of the increasing vibrations.
6. Conclusions and Outlook
In the presented work the so called HeBo test rig, based on an Allison M250-C20B turboshaft engine, was built up and first commissioned. The test rig currently will serve as ground demonstrator for hybrid-electric propulsion concepts and the novel water enhanced turbofan cycle concept developed by the MTU.
The base setup of the test rig was described in detail. It was shown, how the M250 turboshaft engine is transformed into a gen-set with high electric power density by coupling it with a high performance motor-generator-unit. This enables the integration of the gas turbine in a hybrid electric flight setup. Since aircraft shock loads were considered during the design process, the gen-set would be potentially suited experimental flight tests. The coupling of the generator required the modification of the M250 gear-box to raise the output shaft speed from 6016 rpm to 14,280 rpm. Further, the full instrumentation of the gas turbine cycle components was presented. The detailed instrumentation at combustor in- and outlet are the foundation for upcoming steam injection investigations. It will provide data for gas turbine cycle simulations and allow to characterize the effects of the investigated concepts on the gas turbine. Also, the installation of the test rig into the laboratory infrastructure was described.
The M250 gas turbine was initially commissioned and tested up to an electric power output of 140 kW. Higher loads could not be achieved due to the rented electric load bank which was used to dissipate the generated electric power as heat during initial testing. When changing resistors at this specific load a load-gap resulted in a load rejection of the generator and consequently in an overspeed emergency shut down. Up to this load point the gen-set operates without issues. Compared to the typical application of the M250 in helicopters the generator in this gen-set configuration offers a very low inertia, which affected the operational behavior exhibiting a faster system dynamic. To compensate for this, the routine to accelerate the output shaft to design speed was adapted. Further a virtual inertia was implemented in the control system to compensate for fluctuations of the output shaft speed governor of the original M250 FCU, which proved to be very effective. To get an initial impression of the gen-set behavior a steady state characterization was carried out in 20 kW steps, up to 140 kW. The characteristics of the test rigs electrical performance, as well as the characteristics of the M250 components: compressor, combustor and turbine were described. Due to the gear-box modification also an initial analysis of the vibrational behavior is carried out.
After the conclusion of the commissioning and baseline characterization the test rig will be modified to investigate the aforementioned propulsion concepts. To investigate hybrid electric concepts, the motor/generator unit will be electrically coupled with a DC battery emulator and the output shaft of the gas turbine will further be mechanically coupled with an electric load machine. This will allow to investigate different energy flows and interconnections of hybrid electric configurations. The second novel propulsion concept that will be regarded is the water enhanced turbofan concept, which promises a leap in propulsion efficiency and NOX reduction. Therefore, the original combustor will be modified with a superheated steam injection and part of the “wet” exhaust gas will be extracted into a condensation rig. This rig will cool down the exhaust gas to achieve condensation and then pass the two phase flow through a water recovery unit, which will allow to demonstrate how much of the injected steam can be recovered from the exhaust gas to eventually achieve a closed water/steam cycle.
Author Contributions
Conceptualization, J.R. and S.S.; investigation, O.K., C.K. and A.M.; writing—original draft preparation, O.K., J.R., N.J. and M.A.A.; writing—review and editing, J.Z. and M.H.; supervision, M.A.; project administration, J.Z. All authors have read and agreed to the published version of the manuscript.
Funding
The research work of MTU Aero Engines and DLR associated with this publication has been supported by the German Federal Ministry for Economic Affairs and Energy under grant number 20T1720. The funding of the work through the 3rd call of the Federal Aviation Research Program V (LuFo V-3), grant project title “VerVal”, is gratefully acknowledged. The authors are responsible for the content of this publication.
Data Availability Statement
The original contributions presented in the study are included in the article, further inquiries can be directed to the corresponding author.
Conflicts of Interest
Authors Janos Römgens and Simon Schuldt were employed by the company MTU Aero Engines AG. The remaining authors declare that the re-search was conducted in the absence of any commercial or financial relationships that could be construed as a potential conflict of interest.
References
- Schneider, M.; Dickhoff, J.; Kusterer, K.; Visser, W.; Stumpf, E.; Hofmann, J.P.; Bohn, D. Development of a Gas Turbine Concept for Electric Power Generation in a Commercial Hybrid Electric Aircraft. In Proceedings of the ASME Turbo Expo: Turbomachinery Technical Conference and Exposition 2019; The American Society of Mechanical Engineers: New York, NY, USA, 2019; ISBN 978-0-7918-5854-7. [Google Scholar]
- Stefanizzi, M.; Capurso, T.; Filomeno, G.; Torresi, M.; Pascazio, G. Recent Combustion Strategies in Gas Turbines for Propulsion and Power Generation toward a Zero-Emissions Future: Fuels, Burners, and Combustion Techniques. Energies 2021, 14, 6694. [Google Scholar] [CrossRef]
- Airbus. ZEROe: Towards the World’s First Hydrogen-Powered Commercial Aircraft. Available online: https://www.airbus.com/en/innovation/low-carbon-aviation/hydrogen/zeroe#concepts (accessed on 1 March 2024).
- H2FLY, GmbH. Breaking the Hydrogen Barrier. Available online: https://www.h2fly.de/ (accessed on 1 March 2024).
- ZeroAvia, Inc. Truly Clean Aviation: Hydrogen-Electric Engines for Zero-Emission Flight. Available online: https://zeroavia.com/ (accessed on 1 March 2024).
- Kadyk, T.; Winnefeld, C.; Hanke-Rauschenbach, R.; Krewer, U. Analysis and Design of Fuel Cell Systems for Aviation. Energies 2018, 11, 375. [Google Scholar] [CrossRef]
- Silberhorn, D.; Dahlmann, K.; Görtz, A.; Linke, F.; Zanger, J.; Rauch, B.; Methling, T.; Janzer, C.; Hartmann, J. Climate Impact Reduction Potentials of Synthetic Kerosene and Green Hydrogen Powered Mid-Range Aircraft Concepts. Appl. Sci. 2022, 12, 5950. [Google Scholar] [CrossRef]
- Zong, J.; Zhu, B.; Hou, Z.; Yang, X.; Zhai, J. Evaluation and Comparison of Hybrid Wing VTOL UAV with Four Different Electric Propulsion Systems. Aerospace 2021, 8, 256. [Google Scholar] [CrossRef]
- Finger, D.F.; Braun, C.; Bil, C. Case Studies in Initial Sizing for Hybrid-Electric General Aviation Aircraft. In IEEE Electric Aircraft Technologies Symposium (EATS), Cincinnati, OH, USA; IEEE: Piscataway, NJ, USA, 2018; ISBN 9781624105722. [Google Scholar]
- Rings, R.; Ludowicy, J.; Finger, D.F.; Braun, C. Sizing Studies of Light Aircraft with Parallel Hybrid Propulsion Systems; Deutsche Gesellschaft für Luft-und Raumfahrt-Lilienthal-Oberth eV: Bonn, Germany, 2018. [Google Scholar] [CrossRef]
- Pouzolz, R.; Schmitz, O.; Klingels, H. Evaluation of the Climate Impact Reduction Potential of the Water-Enhanced Turbofan (WET) Concept. Aerospace 2021, 8, 59. [Google Scholar] [CrossRef]
- Kaiser, S.; Schmitz, O.; Ziegler, P.; Klingels, H. The Water-Enhanced Turbofan as Enabler for Climate-Neutral Aviation. Appl. Sci. 2022, 12, 12431. [Google Scholar] [CrossRef]
- Wehrspohn, J.; Rahn, A.; Papantoni, V.; Silberhorn, D.; Burschyk, T.; Schröder, M.; Linke, F.; Dahlmann, K.; Kühlen, M.; Wicke, K.; et al. A Detailed and Comparative Economic Analysis of Hybrid-Electric Aircraft Concepts Considering Environmental Assessment Factors. In Proceedings of the AIAA AVIATION 2022 Forum, Chicago, IL, USA/Virtual, 27 June–1 July 2022; American Institute of Aeronautics and Astronautics: Reston, VA, USA, 2022; p. 3882, ISBN 978-1-62410-635-4. [Google Scholar]
- Preiß, A. Eintrittsstörungen bei Fluggasturbinen unter Besonderer Berücksichtigung Instationärer Gaszusammensetzungen. Ph.D. Thesis, Technische Universität München, Munich, Germany, 2001. [Google Scholar]
- Hönle, J.; Barth, A.; Erhard, W.; Kau, H.-P. Engine Quick Start in Case of Emergency—A Requirement for Saving Fuel by Means of Engine Shutdown. In Proceedings of the 38th European Rotorcraft Forum, Amsterdam, The Netherlands, 4–7 September 2012. [Google Scholar]
- Rohkamp, M.; Rabl, A.; Gündling, B.; Saraji-Bozorgzad, M.R.; Mull, C.; Bendl, J.; Neukirchen, C.; Helcig, C.; Adam, T.; Gümmer, V.; et al. Detailed Gaseous and Particulate Emissions of an Allison 250-C20B Turboshaft Engine: GT2023-101273. In Proceedings of the ASME Turbo Expo: Turbomachinery Technical Conference and Exposition, Boston, MA, USA, 26–30 June 2023; The American Society of Mechanical Engineers: New York, NY, USA, 2023. [Google Scholar]
- He, B. A Theoretical and Experimental Analysis of Post-compression Water Injection in a Rolls-Royce M250 Gas Turbine Engine; USNA-TSPR-435; Defense Technical Information Center: Fort Belvoir, VA, USA, 2015. [Google Scholar]
- Polsinelli, S. Waste Heat Recovery Carbon Dioxide Heat Exchanger for Gas Turbine Engines. Master’s Thesis, Naval Postgraduate School, Monterey, CA, USA, 2018. [Google Scholar]
- Buck, C. Waste Heat Recovery System For a Gas Turbine Engine and Carbon Dioxide Compression Simulation. Master’s Thesis, Naval Postgraduate School, Monterey, CA, USA, December 2018. [Google Scholar]
- De Paepe, W.; Sayad, P.; Bram, S.; Klingmann, J.; Contino, F. Experimental Investigation of the Effect of Steam Dilution on the Combustion of Methane for Humidified Micro Gas Turbine Applications. Combust. Sci. Technol. 2016, 188, 1199–1219. [Google Scholar] [CrossRef]
- DePaepe, W.; Carrero, M.; Bram, S.; Contino, F. T100 Micro Gas Turbine Converted to Full Humid Air Operation—A Thermodynamic Performance Analysis. In Proceedings of the ASME Turbo Expo: Turbine Technical Conference and Exposition, Montreal, QC, Canada, 15–19 June 2015; ASME: New York, NY, USA, 2015. ISBN 978-0-7918-5662-8. [Google Scholar]
- Dyson, R.W. NASA Electric Aircraft Testbed (NEAT) Single-Aisle Transport Air Vehicle Hybrid Electric Tail-Cone Thruster Powertrain Configuration and Test Results. In Proceedings of the IEEE Electric Aircraft Technologies Symposium (EATS), Cincinnati, OH, USA, 12–14 July 2018; IEEE: Piscataway, NJ, USA, 2018. ISBN 9781624105722. [Google Scholar]
- Marcellan, A.; Henke, M.; Schuldt, S. A Numerical Investigation of the Water-Enhanced Turbofan Laboratory-Scale Ground Demonstrator. In AIAA SCITECH 2022 Forum, San Diego, CA & Virtual; Mathews, G.C., Gomez, M., Schwartz, C., Son, S.F., Eds.; American Institute of Aeronautics and Astronautics: Reston, VA, USA, 2022; ISBN 978-1-62410-631-6. [Google Scholar]
- Jonsson, M.; Yan, J. Humidified gas turbines—A review of proposed and implemented cycles. Energy 2005, 30, 1013–1078. [Google Scholar] [CrossRef]
- Lupandin, V.V.; Romanov, V.I.; Krivutsa, V.A.; Lupandin, V.V. Design, Development and Testing of a Gas Turbine Steam Injection and Water Recovery System. In Proceedings of the ASME Turbo Expo 2001: Power for Land, Sea, and Air, New Orleans, LA, USA, 4–7 June 2001; American Society of Mechanical Engineers: New York, NY, USA, 2001. ISBN 978-0-7918-7852-1. [Google Scholar]
- Utamura, M.; Takehara, I.; Karasawa, H. MAT, a novel, open cycle gas turbine for power augmentation. Energy Convers. Manag. 1998, 39, 1631–1642. [Google Scholar] [CrossRef]
- Bathie, W.W. Fundamentals of Gas Turbines, 2nd ed.; Wiley: New York, NY, USA, 1996; ISBN 0471311227. [Google Scholar]
- Schmitz, O.; Klingels, H.; Kufner, P. Aero Engine Concepts Beyond 2030: Part 1—The Steam Injecting and Recovering Aero Engine. J. Eng. Gas Turbines Power 2021, 143, 021001. [Google Scholar] [CrossRef]
- Schmitz, O.; Kaiser, S.; Klingels, H.; Kufner, P.; Obermüller, M.; Henke, M.; Zanger, J.; Grimm, F.; Schuldt, S.; Marcellan, A.; et al. Aero Engine Concepts Beyond 2030: Part 3—Experimental Demonstration of Technological Feasibility. J. Eng. Gas Turbines Power 2021, 143, 021003. [Google Scholar] [CrossRef]
- Rendón, M.A.; Sánchez, R.C.D.; Gallo, M.J.; Anzai, A.H. Aircraft Hybrid-Electric Propulsion: Development Trends, Challenges and Opportunities. J. Control. Autom. Electr. Syst. 2021, 32, 1244–1268. [Google Scholar] [CrossRef]
- Frederick, Z.J.; Hallock, T.J.; Ozoroski, T.A.; Chapman, J.W.; Kuhnle, C.A.; Frederic, P.C. Design Exploration of a Mild Hybrid Electrified Aircraft Propulsion Concept. In Proceedings of the AIAA AVIATION 2023 Forum, San Diego, CA, USA/Online, 12–16 June 2023; American Institute of Aeronautics and Astronautics: Reston, VA, USA, 2023. ISBN 978-1-62410-704-7. [Google Scholar]
- Zaporozhets, O.; Isaienko, V.; Synylo, K. Trends on current and forecasted aircraft hybrid electric architectures and their impact on environment. Energy 2020, 211, 118814. [Google Scholar] [CrossRef] [PubMed]
- Bradley, M.K.; Droney, C.K. Subsonic Ultra Green Aircraft Research: Phase II–Volume II–Hybrid Electric Design Exploration; NASA CR-218704; NASA: Washington, CA, USA, 2015.
- SAE AS755F; Aircraft Propulsion System Performance Station Designation. SAE International: Warrendale, PA, USA, 2014.
- Tamrakar, U.; Shrestha, D.; Maharjan, M.; Bhattarai, B.P.; Hansen, T.M.; Tonkoski, R. Virtual Inertia: Current Trends and Future Directions. Appl. Sci. 2017, 7, 654. [Google Scholar] [CrossRef]

Disclaimer/Publisher’s Note: The statements, opinions and data contained in all publications are solely those of the individual author(s) and contributor(s) and not of MDPI and/or the editor(s). MDPI and/or the editor(s) disclaim responsibility for any injury to people or property resulting from any ideas, methods, instructions or products referred to in the content. |
© 2024 by the authors. Licensee MDPI, Basel, Switzerland. This article is an open access article distributed under the terms and conditions of the Creative Commons Attribution (CC BY) license (https://creativecommons.org/licenses/by/4.0/).