Article

Inter-Satellite Link Prediction with Supervised Learning: An Application in Polar Orbits

i2CAT Foundation, Gran Capità, 2, 4, Distrito de Les Corts, 08034 Barcelona, Spain
*
Author to whom correspondence should be addressed.
Aerospace 2024, 11(7), 551; https://doi.org/10.3390/aerospace11070551
Submission received: 20 May 2024 / Revised: 26 June 2024 / Accepted: 2 July 2024 / Published: 4 July 2024

Abstract

:
Distributed space systems are increasingly valued in the space industry, as they enhance mission performance through collaborative efforts and resource sharing among multiple heterogeneous satellites. Additionally, enabling autonomous and real-time satellite-to-satellite communications through Inter-Satellite Links (ISLs) can further increase the overall performance by allowing cooperation without relying on ground links and extensive coordination efforts among diverse stakeholders. Given the constrained resources available onboard satellites, a crucial element of achieving cost-effective and autonomous cooperation involves minimizing energy wastage resulting from unsuccessful or unnecessary communication. To address this challenge, satellites must anticipate their ISL opportunities or encounters with minimal resource utilization. Building upon prior publications, this work presents further insights into the use of supervised learning to enable satellites to forecast their encounters without relying on orbit propagation. In particular, a more realistic definition of satellite encounters, along with a versatile solution applicable to all polar low-Earth orbit satellites is implemented. Results show that the trained model can anticipate encounters for realistic and unseen data from an available data source with a balance accuracy of around 90% and six times faster when compared with the well-known Simplified General Perturbation 4 orbital model.

1. Introduction

In recent years, there has been a notable shift in the space industry towards the adoption of Distributed Space Systems (DSSs) [1]. Unlike conventional monolithic systems, DSSs comprise multiple satellites that coordinate their activities to enhance overall mission performance in areas such as telecommunications, navigation, and remote sensing. Additionally, the increasing interest in Non-Terrestrial Networks (NTNs), a fundamental concept in sixth-generation (6G) wireless networks, alongside the rising number of launched satellites and constellations, highlights the importance of DSSs based on inter-satellite links (ISLs) [2,3,4]. DSSs can provide optimal cooperation to further increase mission performance and meet strict requirements by enabling satellite-to-satellite communication for the sharing of data and unused resources.
Ensuring optimal cooperation is particularly crucial in resource-constrained scenarios, such as nano-satellite constellations. This entails designing contact plans [5] and exploring optimal communication routes [6] and task allocations [7,8] to maximize network utility and fairness while minimizing latency and energy consumption within ISL systems. The current heterogeneous Low-Earth Orbit (LEO) space, while benefiting from the huge number of orbiting satellites for resource sharing, presents a significant challenge to overcome: unlike specific mesh-like topologies, such as Iridium [9] or Walker Star [10], where satellite links are fixed, heterogeneous satellites have dynamic neighbors and intermittent links due to their varying altitudes and inclinations. This characteristic increases the complexity of cooperation tasks, as optimal communication routes can change significantly over time. To address these challenges, it is essential to anticipate contact opportunities between satellites, also known as close-approach encounters. Traditional methods for anticipating satellite encounters typically employ deterministic and centralized on-ground orbit propagation techniques [5,11]. These methods use an orbital model to propagate the satellite’s initial states encoded in Two-Line Element (TLE) sets. While on-ground solutions excel at producing accurate contact windows, their centralized design renders them impractical for DSSs comprising heterogeneous satellites, as extensive collaboration among diverse stakeholders would be required. Additionally, the scalability of centralized computations is limited by their strong dependence on Earth-based systems and reliance on a single central unit for all data processing, making them unsuitable for mega-constellations.
In response to these challenges, recent studies explore decentralized solutions to grant autonomy to satellites [12]. However, these methods typically rely on orbital propagation, which could impose significant processing costs for satellites with constrained resources. To avoid the need for orbital propagation while maintaining decentralization and autonomy, authors in Ruiz-De-Azua et al. [13] implemented predictive algorithms to learn and construct the satellite contact windows. Nevertheless, some linearizations are employed in the mathematical formulation, making this approach applicable only to specific scenarios where satellites operate at the same altitude in circular and Keplerian orbits. As an alternative solution, Casadesus and Alarcón [14] investigated the use of Graph Neural Networks (GNNs) together with Recurrent Neural Networks (RNNs) as a scalable alternative to model the temporal evolution of large satellite network contacts in an autonomous and cost-efficient manner.
Following previous works [15,16], we present some advances to the proof of concept of using Supervised Learning (SL) to predict encounters between heterogeneous satellites. In particular, the encounter prediction problem is solved for polar LEO, where around 40% of all active satellites are located. Due to the Earth’s rotation, polar LEO satellites pass over all latitudes, entirely covering the Earth’s surface and providing global coverage for remote sensing and Earth observation missions. As in previous works, an encounter is defined as a close approach between two satellites assuming the Simplified General Perturbation 4 (SGP4) orbital model. SGP4 is a well-known orbital model that considers the effect of Earth’s non-sphericity and atmospheric drag [17,18]. However, in contrast to previous publications, these encounters are better defined based on two distance thresholds: an upper-bound threshold beyond which satellites are too far apart to communicate, and a lower-bound threshold below which satellite-to-satellite communication is always feasible. This new definition enables the solution to accommodate a range of user-defined threshold distances, making it suitable for various antenna characteristics.
In particular, this work contributes to the state of the art by (1) offering an alternative solution based on machine learning to forecast encounters between polar LEO satellites; (2) implementing a method to easily generate a synthetic dataset of satellite encounters given a range of orbital elements; (3) providing a trained model that obtains good predictions given any pair of orbital elements in the range of polar LEO for any distance threshold within a predefined range; (4) evaluating the SL model with realistic data from real polar LEO Celestrak satellites; and (5) analyzing the results for two different datasets and three different scenarios, extracting important conclusions.
The remainder of this article is structured as follows. Section 2 defines the problem statement, introducing the structure of the datasets used for training, validation, and testing. Section 3 introduces polar orbits and presents their characteristics using real data from Celestrak [19]. Section 4 details the SL model architecture used to fit the input and output data. Section 5 presents an exhaustive analysis of the model performance on two different datasets—one containing synthetic data and another one with realistic satellite orbits from Celestrak. Finally, Section 6 concludes the paper with a recap of the main discoveries and offers insights for further exploration within this field.

2. Encounter Anticipation Problem

Motivated by the need to coordinate resource-constrained satellites autonomously, this work proposes a cost-efficient solution to solve the encounter anticipation problem without relying on centralized and ground-dependent orbit propagation. Based on our previous works [15,16], we apply SL to infer future encounters between satellite pairs given their initial states. This process involves (1) generation of input and output data, (2) model training, and (3) model evaluation.
In line with previous studies, encounters are defined as the time sequences that define satellite communication opportunities based on a close approach. Specifically, it is assumed that communication can occur if the Euclidean distance between two satellites is below a given threshold and that the directional antenna is equipped with pointing mechanisms. Note that the pointing process is beyond the scope of this study. Additionally, the SGP4 orbital model is utilized to calculate the dynamic distances between satellite pairs, from which the ground-truth encounters are derived. SGP4 is an orbital model for near-Earth objects including the effects of Earth’s shape and atmospheric drag. However, some important changes and improvements are introduced as follows.
On the one hand, the input data encompass all the necessary information to define the encounters between two satellites. This includes not just the initial position of the satellites (specified by six values known as orbital elements) but also their initial drag terms. In total, seven values define the initial state of a satellite. Based on this reasoning, 2000 synthetic polar satellites are generated and divided into two groups—one used for training and the other for validation. In each group, the satellites are combined into pairs to create a 14-feature input vector, ensuring that 85% of the total synthetic samples are allocated for training and 15% for validation. Two additional datasets are created for testing, namely a synthetic test set with information on 200 synthetic satellites and a Celestrak test set with 200 real LEO polar satellites. Note that synthetic satellites are randomly distributed throughout the entire LEO polar space, whereas real satellites from Celestrak tend to cluster in specific regions due to their organization into different constellations. Details about the generation of synthetic input data are presented in Section 3.
On the other hand, the definition of encounter is improved from a simple near/not near decision coming from a single distance threshold to a more complex definition based on two distinct thresholds. Defining a single distance threshold (T) beyond which the ISL becomes unreachable would lead to the unrealistic and hard-defined encounters used in [15,16]. In such scenarios, communication opportunities drastically appear or disappear with a minor change in the satellite-to-satellite distance. Therefore, if different T values need to be considered due to varying antenna characteristics, this approach would require a new training process with different training data, reducing its robustness. Instead, this work proposes an alternative T-independent encounter definition to anticipate the communication opportunities associated with any threshold within a specific range. This improved definition allows for encounter anticipation for different antenna characteristics based on the same trained model.
Figure 1 illustrates the refined encounter definition, depicting the normalized separation distance over a 48-h period between T m i n and T m a x . For a more intuitive interpretation, the time instances where the satellite-to-satellite distance exceeds T m a x are set to 0, indicating no potential encounters, while values of 1 indicate times when the distance falls below T m i n and the communication is possible. Based on [20], T m i n and T m a x are set to 1000 km and 3000 km, respectively. Under this definition, satellites separated by 3000 km or more are considered unable to establish an ISL communication link, whereas those within 1000 km can always exchange data. The wide range between 1000 km and 3000 km aims to accommodate diverse antenna characteristics in heterogeneous environments. Future research could entail a detailed analysis of actual LEO antenna characteristics to define more precise optimal threshold ranges. Notice that the approach proposed in this work remains applicable across various threshold values.
Section 5 reports the model’s performance associated with three different distance thresholds, namely T = 1500 km, T = 2000, and T = 2500 km.
It is important to note that after a few days, the predicted position of a satellite can significantly deviate from its actual position, particularly for those satellites that perform station-keeping maneuvers [21]. Therefore, it is crucial to periodically update the initial satellite state using the latest TLE set. As long as the initial state remains within the range of values used for training, the same SL model can handle these maneuvers without additional training.

3. Polar Orbits

A polar orbit is characterized by a high inclination angle relative to the equator, which makes it pass near the Earth’s geographic poles. These characteristics allow polar-orbiting satellites to provide global coverage, observing different parts of the Earth with each orbital pass. This property makes polar satellites highly useful for Earth observation and remote sensing applied in scientific research, disaster management, and environmental studies (e.g., weather monitoring). For this reason, polar satellites are found at low altitudes and are defined by orbital periods of less than 128 min.
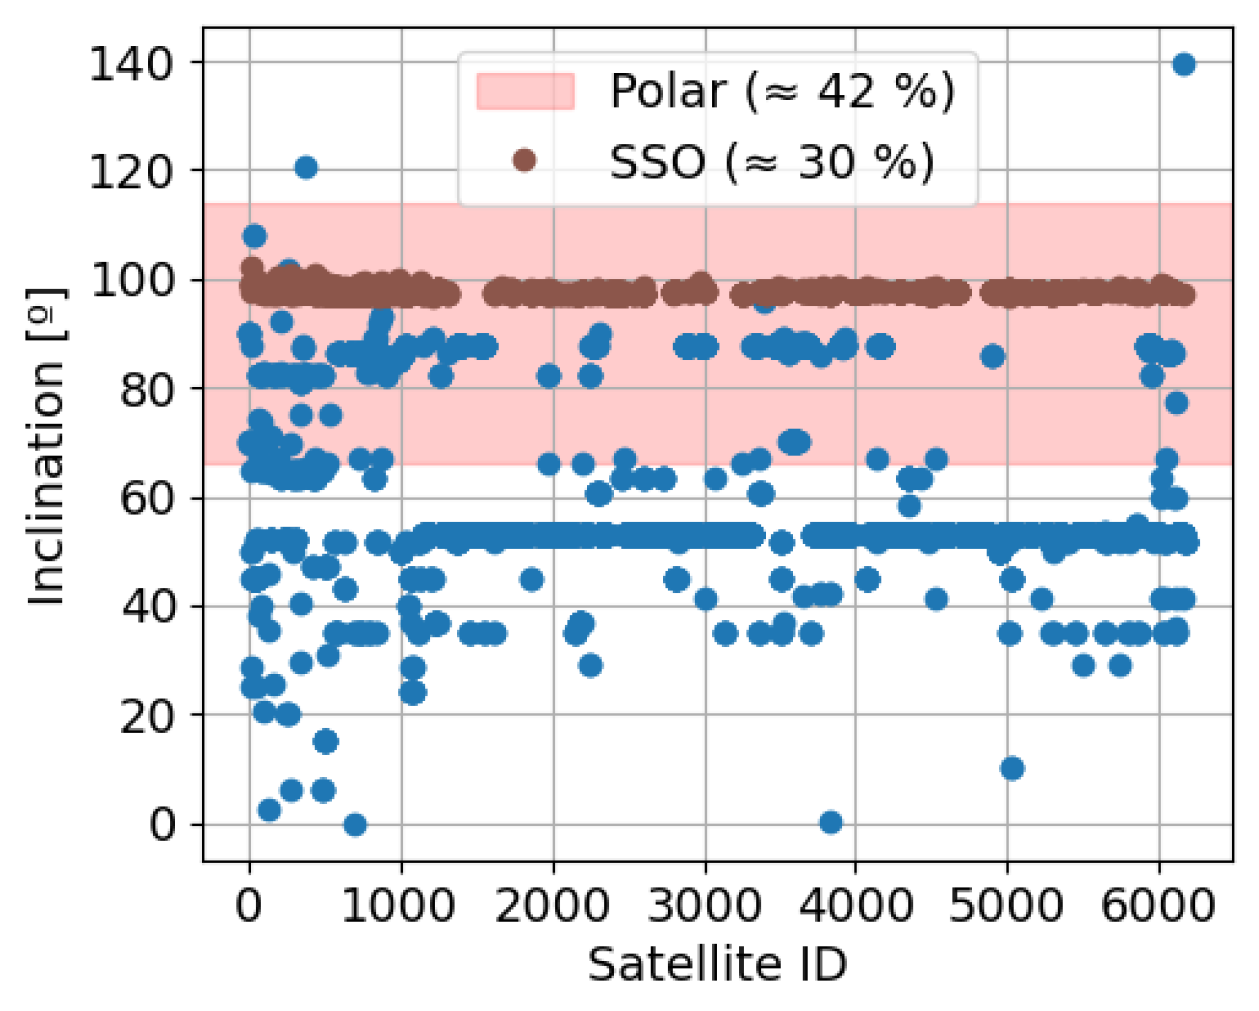
Figure 2 shows the inclination angle for all 6175 active LEO satellites present in Celestrak in February 2023. Satellites in the red region, with an inclination range of 66 to 114 ( 90 ± 24°), are defined as arctic polar satellites and represent approximately 42% of all LEO satellites. Within this range, satellites are commonly located in Sun-synchronous orbits (SSOs), where each successive orbital pass occurs at the same local time under similar lighting conditions. This characteristic allows satellites to retrieve consistent Earth observation data, making them suitable for studies of weather and geophysical phenomena.
To accurately replicate real polar satellites with synthetic data, a detailed analysis of the two-line elements (TLE) information for all 2613 Celestrak LEO polar satellites is displayed in Figure 3. A TLE defines the position of a satellite in a given e p o c h or at a given time with a set of six orbital elements (OEs) that define the orbit shape or eccentricity (e), the size or semi-major axis (a), and three orbit orientation angles (inclination (i), right ascension of the ascending node ( Ω ), and argument of perigee ( ω )), as well as the satellite position along the orbit or mean anomaly (M). Additionally, the TLE models the atmospheric drag force with the B-star term ( B * ), as defined in Equation (1).
B * = ρ 0 C d A 2 m
where ρ 0 is a reference air density, C d is the drag coefficient, A is the frontal area, and m is the satellite’s mass. Notice that B * is not constant, since both A and C d change over time with the satellite’s orientation.
Figure 3a shows the probability distribution of B * , measured in units of the inverse of the Earth’s radius ( R E 1 ). The vast majority of the Celestrak polar satellites exhibit a small positive drag term. However, unexpectedly, approximately 1% of the satellites present a negative B * . Those negative values arise from unmodeled forces that alias the drag term, creating a negative force for orbit compensation. Since SGP4 can deal with negative drag forces, the range from −0.03 to 0.03, containing more than 98% of the cases, has been considered to create synthetic satellites. Similarly, Figure 3b shows the distribution of the semi-major axis. As expected for LEO orbiting satellites (usually found between 160 km and 1600 km above the Earth) the semi-major axis ranges from 6500 km to 8000 km. To delimit the space and avoid outliers, only values from 6700 km to 7500 km are considered for synthetic representation, accounting for more than 99% of the cases. In Earth observation missions, LEO polar orbits are quasi-circular, with low eccentricity values. As shown in Figure 3c, the vast majority of satellites have eccentricities lower than 0.02. Since the inclination is the element that defines polar orbits, the whole range from 66 to 114 is used, and its distribution is presented in Figure 2. The right ascension of the ascending node, the argument of perigee, and the mean anomaly present no restriction associated with LEO polar satellites, and the entire range from 0 to 360 is considered.
Based on these results, Table 1 summarizes the range of OEs and B-star drag terms that characterize around 99% of all active LEO polar satellites. The synthetic satellites used to construct the input dataset were created by combining random values within each range.
Notice that these seven values are all the information that SGP4 requires to propagate an orbit. Therefore, as long as orbit maneuvers are reflected in these parameters, our solution can handle them without needing additional training. However, in extreme cases where a maneuver causes the satellite to move outside the range of orbital elements presented in Table 1, encounter prediction may fail.

4. Supervised Learning Model

To predict encounters between satellite pairs without relying on orbit propagation techniques, we employ an SL approach. This method is applied to learn the relationship between the input data consisting of pairs of satellite initial states and the output data characterizing the communication opportunities over the following two days. Although the training stage may involve significant computational costs depending on the complexity of the architecture and the number of training samples, the SL demonstrates remarkable cost efficiency in the inference part, which takes place after the training process to predict the output associated with new and unseen data. Additionally, post-training optimization techniques can be applied to further reduce the inference time in exchange for a minimal compromise in model performance, which is especially attractive for edge devices and resource-constrained systems. A computational cost analysis is presented in Section 5.4.
Given the high level of performance demonstrated by the fully-connected neural network used in [16], this model architecture is reused but adapted to accommodate the two additional features of the input vector regarding the drag term. Additionally, the incorporation of two extra hidden layers has been shown to result in a notable increase in performance. In that sense, the final architecture comprises 14 neurons for the input layer; 576 neurons for the output layer; and 4 pairs of hidden layers with 32, 64, 128, and 256 neurons, respectively. This configuration entails a total of 279,488 parameters to be learned to minimize the loss function.
All parameters related to the activation function, batch size, and training epochs remain consistent with prior works. However, a weighted loss function is implemented to address the significant imbalance that characterizes the output dataset.

Weighted Loss Function

Given the nature of satellite encounters in sparse constellations, it is expected that communication opportunities will be scarce. Specifically, for a set of 20,000 different satellite pairs, the average time they are within 2000 km of proximity is only 2%. Consequently, the dataset exhibits a significant imbalance between zeros (no encounters) and non-zeros, posing challenges during training. To address this imbalance, Equation (2) presents the weighted loss function (L) used for training. This loss function has proven to work considerably better than other default functions such as mean square error [22], mean absolute error [23], and cross entropy [24].
L = ( A Y t + 1 ) · ( Y t Y p ) 2
where Y t is the true value, Y p is the predicted value, and A is a positive constant.
L represents the squared error between the true value and the predicted value, scaled by a factor greater than one. This scaling ensures that the loss increases proportionally to Y t . In other words, for a given squared error, a higher Y t implies a higher loss. Therefore, more importance is given to higher Y t values, which are rarely found during training. The scalar parameter A is used to adjust the importance given to non-zero values, having a significant impact on the training process. Various values greater than 0 are compared. The best performance is observed with A values lower than one. For datasets with stronger imbalances, higher A values might be necessary.
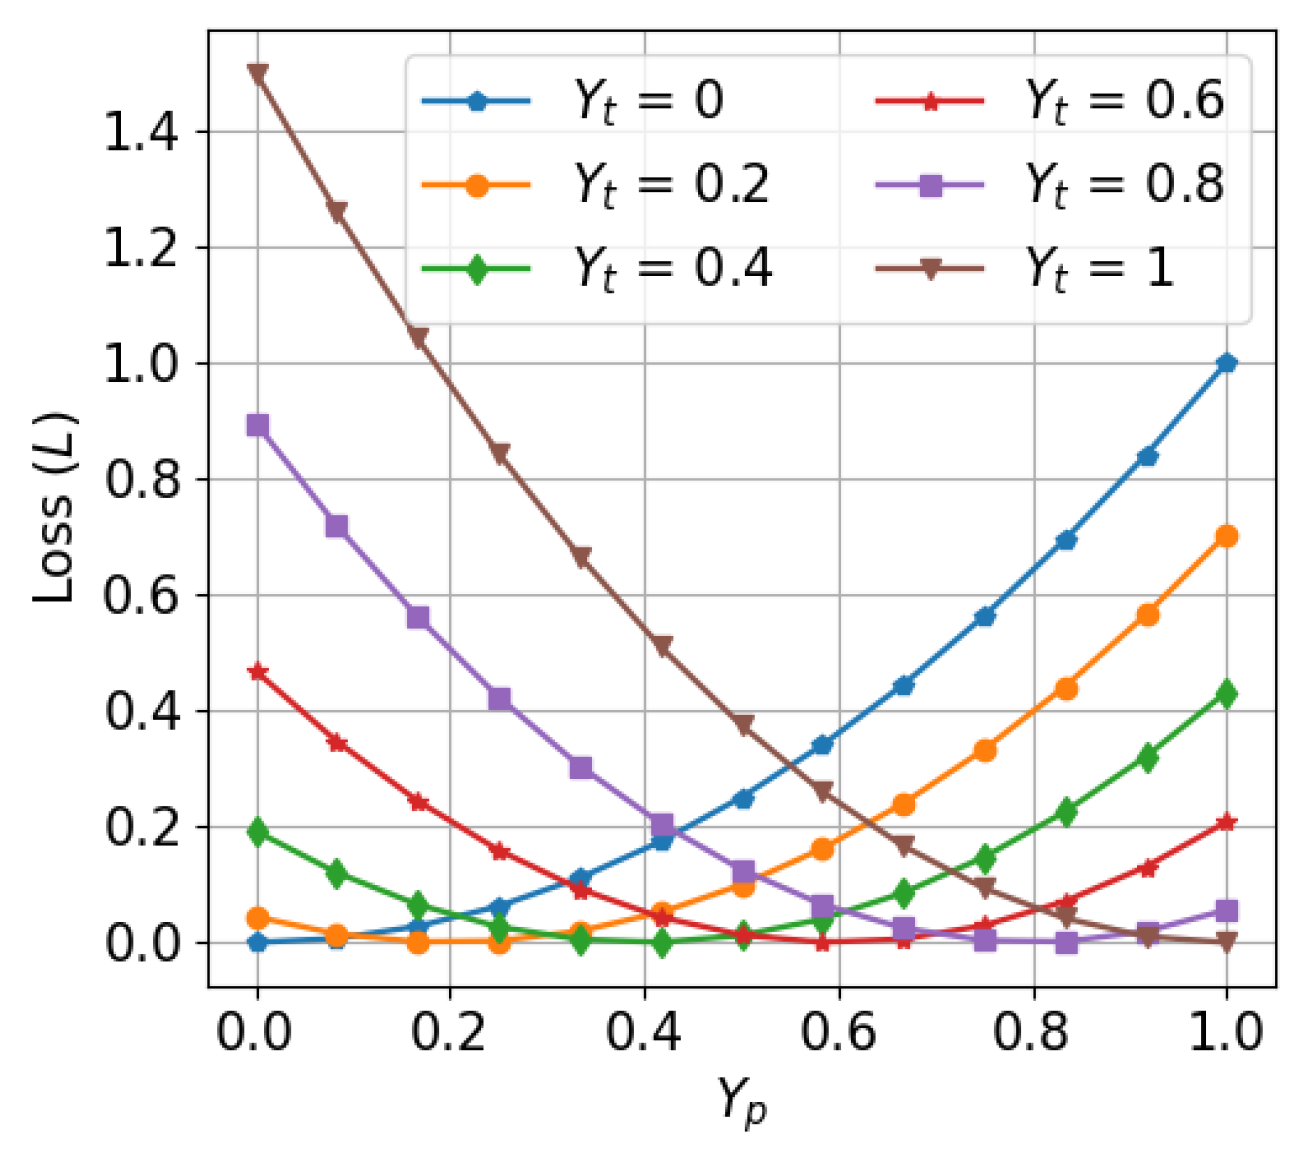
Figure 4 shows the loss function for different true values from 0 to 1 for A = 0.5 . Notice that the minimum loss is always found when Y p = Y t . As Y t increases, the loss for a given square error increases. For instance, for Y t = 0.2 and Y p = 0.8 , the loss is 0.4, while for the same square error with Y t = 0.8 and Y p = 0.2 the loss increases to 0.5. Notice that the highest loss is obtained when the true value is 1 and the prediction is 0.

5. Results

This section presents the performance of the SL model architecture presented in Section 4. First, the model’s performance is assessed by quantifying the error between the ground truth and the model prediction. Then, the ground truth is post-processed with different distance thresholds to obtain different true encounters. Each true encounter is compared with the model prediction, and the effect of the decision threshold is analyzed. Subsequently, a decision threshold is fixed, and the model’s performance is computed for each sample in both synthetic and realistic test sets. Finally, the computational cost of the SL model inference is evaluated and contrasted with the time required for the SGP4 model to compute trajectories and assess encounters.

5.1. Distance Error

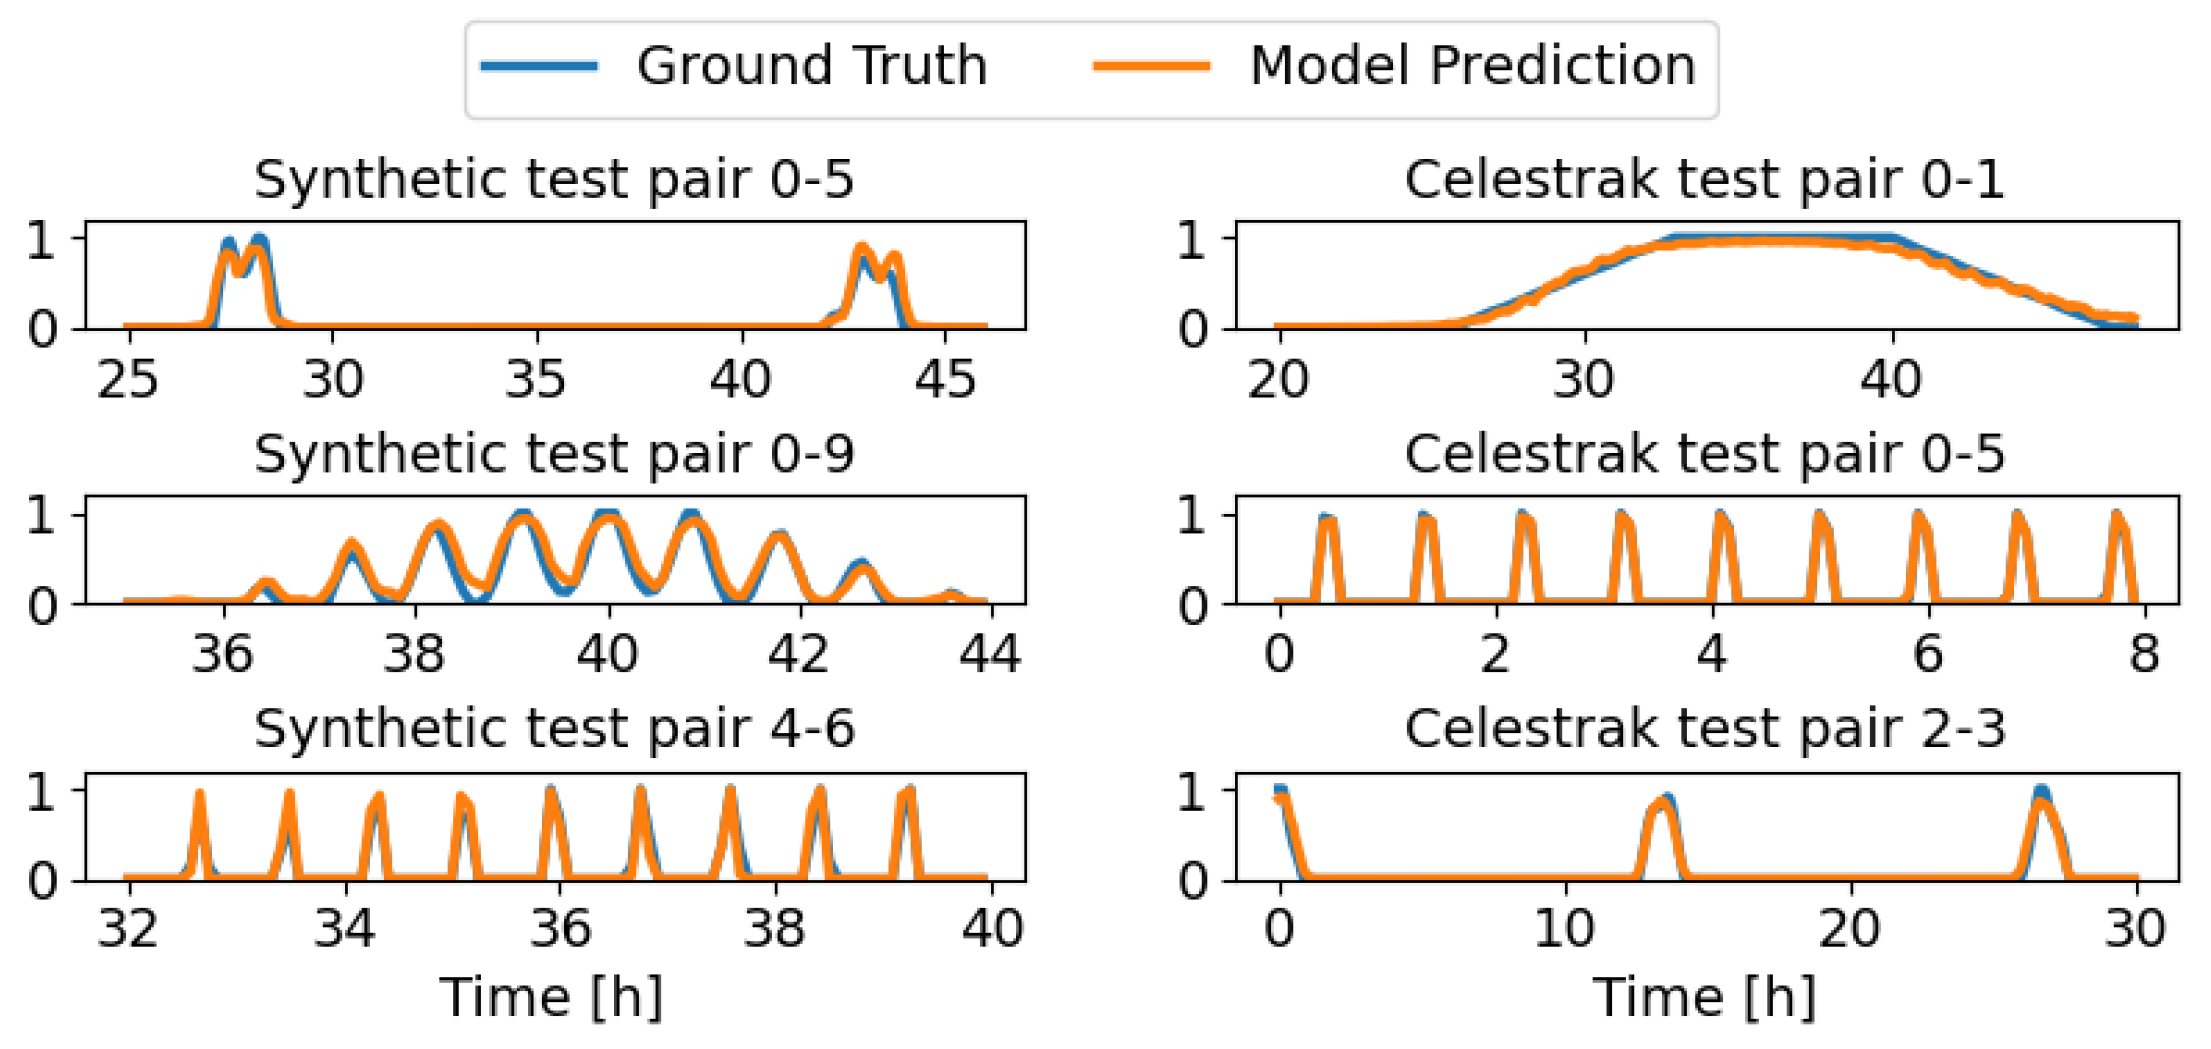
Figure 5 shows the ground truth (in blue) and the model prediction (in orange) for the following six different target satellite pairs: synthetic satellite pairs 0–5, 0–9, and 4–6 and Celestrak satellite pairs 0–1, 0–5, and 2–3. As explained in Section 2, the ground truth represents the time evolution of the normalized satellite-to-satellite distance between 1000 km and 3000 km. Satellite-to-satellite distances higher than 3000 km are denoted with 0, indicating an inability to establish communication, whereas values of 1 reflect distances below 1500 km, symbolizing the potential establishment of an ISL. Encounter values between 0 and 1 can be directly translated to satellite distances between 1000 km and 3000 km, and the decision on when to start ISL communication relies on the stakeholders. From visual inspection, we can say that the model can predict satellite-to-satellite distance with high performance, detecting all the communication opportunities, even when they are really short in duration, as in synthetic pair 4–6 and Celestrak pair 0–5.
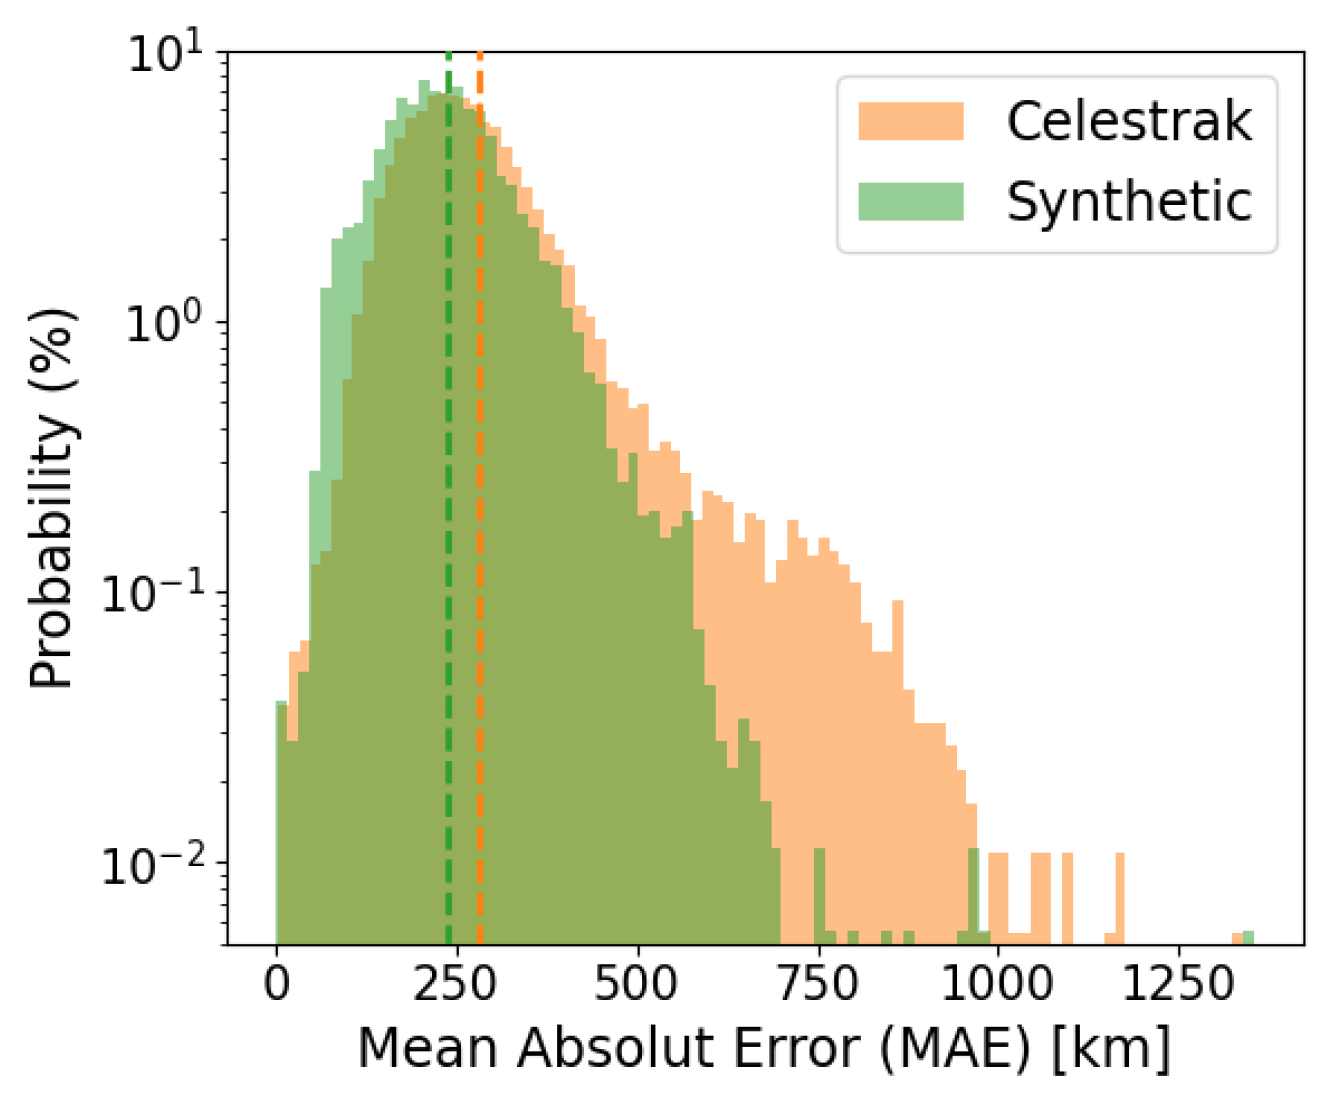
To quantify the error between the ground truth and the model prediction, Figure 6 shows the distribution of the mean absolute error (MAE), considering all satellite pairs in both the synthetic and Celestrak datasets. Note that the error computation only considers the time instances with a ground truth higher than 0 and lower than 1. In cases where the true value is either 0 or 1, the actual distance remains unknown, preventing the calculation of the true distance error. The results show average MAE values of 281 km and 239 km for the synthetic and Celestrak test sets, respectively. Based on these findings, it is evident that the model lacks the level of accuracy necessary to be employed to predict the distance between satellites, particularly in critical applications like collision avoidance.

5.2. Fixed Distance Threshold

The goal of this work is not to predict the satellite-to-satellite distance but to anticipate the encounters between satellite pairs and to compute the performance of this anticipation capability. To do so, the ground truth must be post-processed into a binary signal by defining a distance threshold (T) above which communication is not feasible. This threshold can vary depending on the user preferences and the antenna characteristics, but it must lie between 1000 km and 3000 km. For the following results, three scenarios coming from three different Ts are presented, namely T = 1500 km, T = 2000 km, and T = 2500 km, which correspond to the normalized thresholds of 0.75, 0.5, and 0.25, respectively (see Equation (3)). Notice that these normalized thresholds are the ones used to transform the ground truth into a binary signal.
T n o r m = T T m a x T m i n T m a x
where T m a x and T m i n are set to 3000 km and 1000 km, respectively.
To quantify model performance, the harmonic mean of precision (P) and recall (R), called the F1 score ( F 1 ), is used. In our scenario, P is the probability of estimating a contact inside the real time slot, while R assesses the proportion of successful encounters relative to the total available communication time. In this sense, a precision lower than 1 means that some predicted encounters do not exist, which would be translated into wasted transmission energy. A recall lower than 1 means that some encounters are not detected and some communication opportunities are lost. Equations (4)–(6) present the mathematical formulations of the F 1 , P, and R, respectively.
F 1 = 2 × P × R P + R
P = T P T P + F P
R = T P T P + F N
where T P , F P , and F N stand for true positive, false positive, and false negative, respectively.
It is important to notice that to compute T P , F P , and F N , the model prediction must also be post-processed into a binary signal using a decision threshold. In this sense, all output values lower than the decision threshold are interpreted as 0 or no encounter instances, whereas higher values are set to 1 and interpreted as communication opportunities. Setting an appropriate threshold is important and hardly affects the performance of the model.
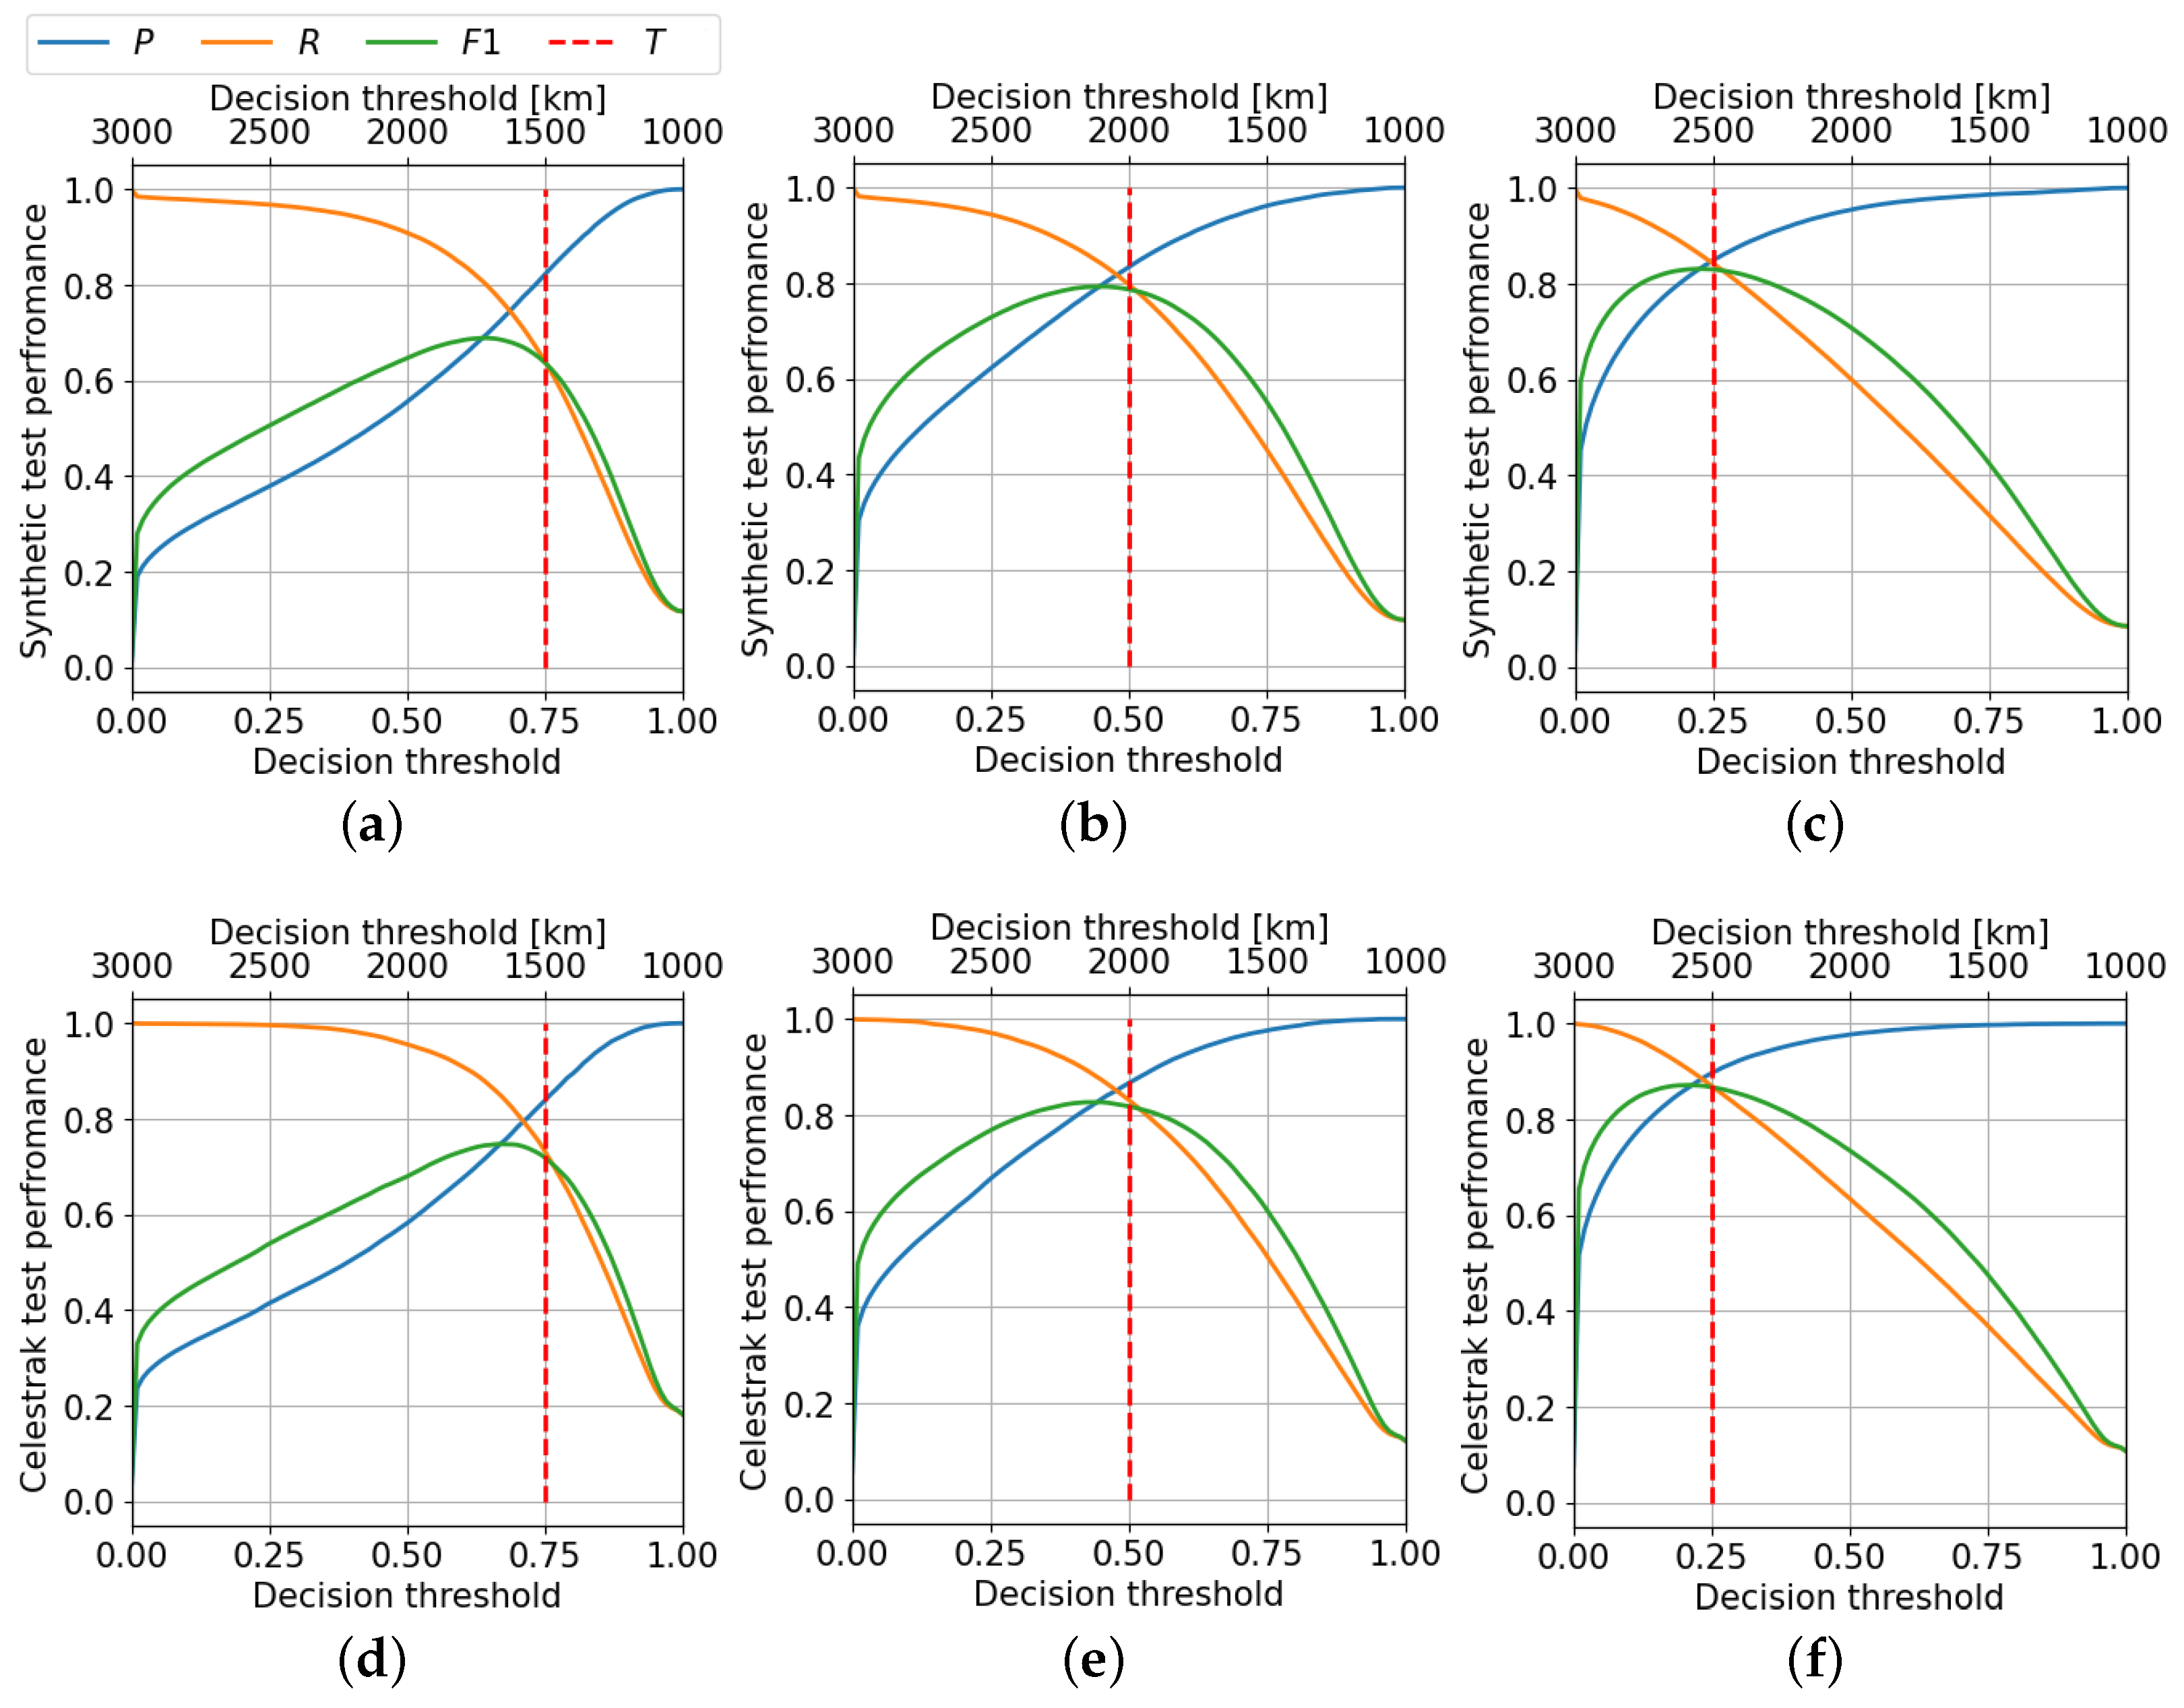
Figure 7 illustrates the influence of the decision threshold on the P, R, and F 1 metrics for both synthetic and realistic datasets. To provide a more intuitive understanding, the decision threshold is also expressed in kilometers through the inverse of Equation (3). Furthermore, each figure presents three different scenarios coming from three different distance thresholds indicated with a dashed vertical red line, namely 1500 km, 2000 km, and 2500 km.
As expected, as the decision threshold rises, the count of detected encounters decreases, resulting in a reduction in F P s and an increase in F N s. According to Equations (5) and (6), the decrease in F P s enhances the P, elevating the likelihood of accurately estimating a contact within the real time slot. However, the increase in F N s negatively affects the R, as it diminishes the proportion of successful encounters. It is worth noting that a similar behavior emerges as a result of increasing the distance threshold (T): the number of true encounters rises as the encounter duration increases, transforming some F P s into T P s but some T N s into F N s. In this case, the positive effect on both F P s and T P s is reflected in a larger area under the P curve, while the increase in F N s is strong enough to observe a decrease in the area under the R curve. However, it can be concluded that the positive effect outweighs the negative one, as evidenced by the increase in the area under the F 1 curve with the distance threshold. Moreover, the imbalance within the ground truth, characterized by significantly more lower values compared to higher ones, presents challenges for the model in accurately predicting encounters associated with higher T values.
Comparing the results obtained with the two distinct datasets, it can be observed that the Celestrak dataset demonstrates superior performance across all scenarios. This behavior comes from the distinct characteristics of each dataset. In the synthetic dataset, satellites are uniformly distributed, whereas real satellites from Celestrak tend to be densely clustered within specific regions and constellations. This non-uniform distribution results in longer satellite encounters and, consequently, a better balance between positive (1) and negative (0) instances. A higher level of dataset balance facilitates prediction.
Additionally, Figure 7 shows that the decision threshold linked to the highest performance hardly depends on the scenario, as it decreases with increasing T. However, selecting the optimal decision threshold does not only depend on T but is also a trade-off between detecting all the communication opportunities (but some F P s ) and detecting only true opportunities (but some F N s). This decision is left to the final user. Nevertheless, an interesting point is found in the intersection between the P and R curves, representing the maximum F1 score. Generally, these curves intersect when the decision threshold aligns with the normalized distance threshold (red dashed line) applied to the ground truth. This indicates the good behavior of the model.
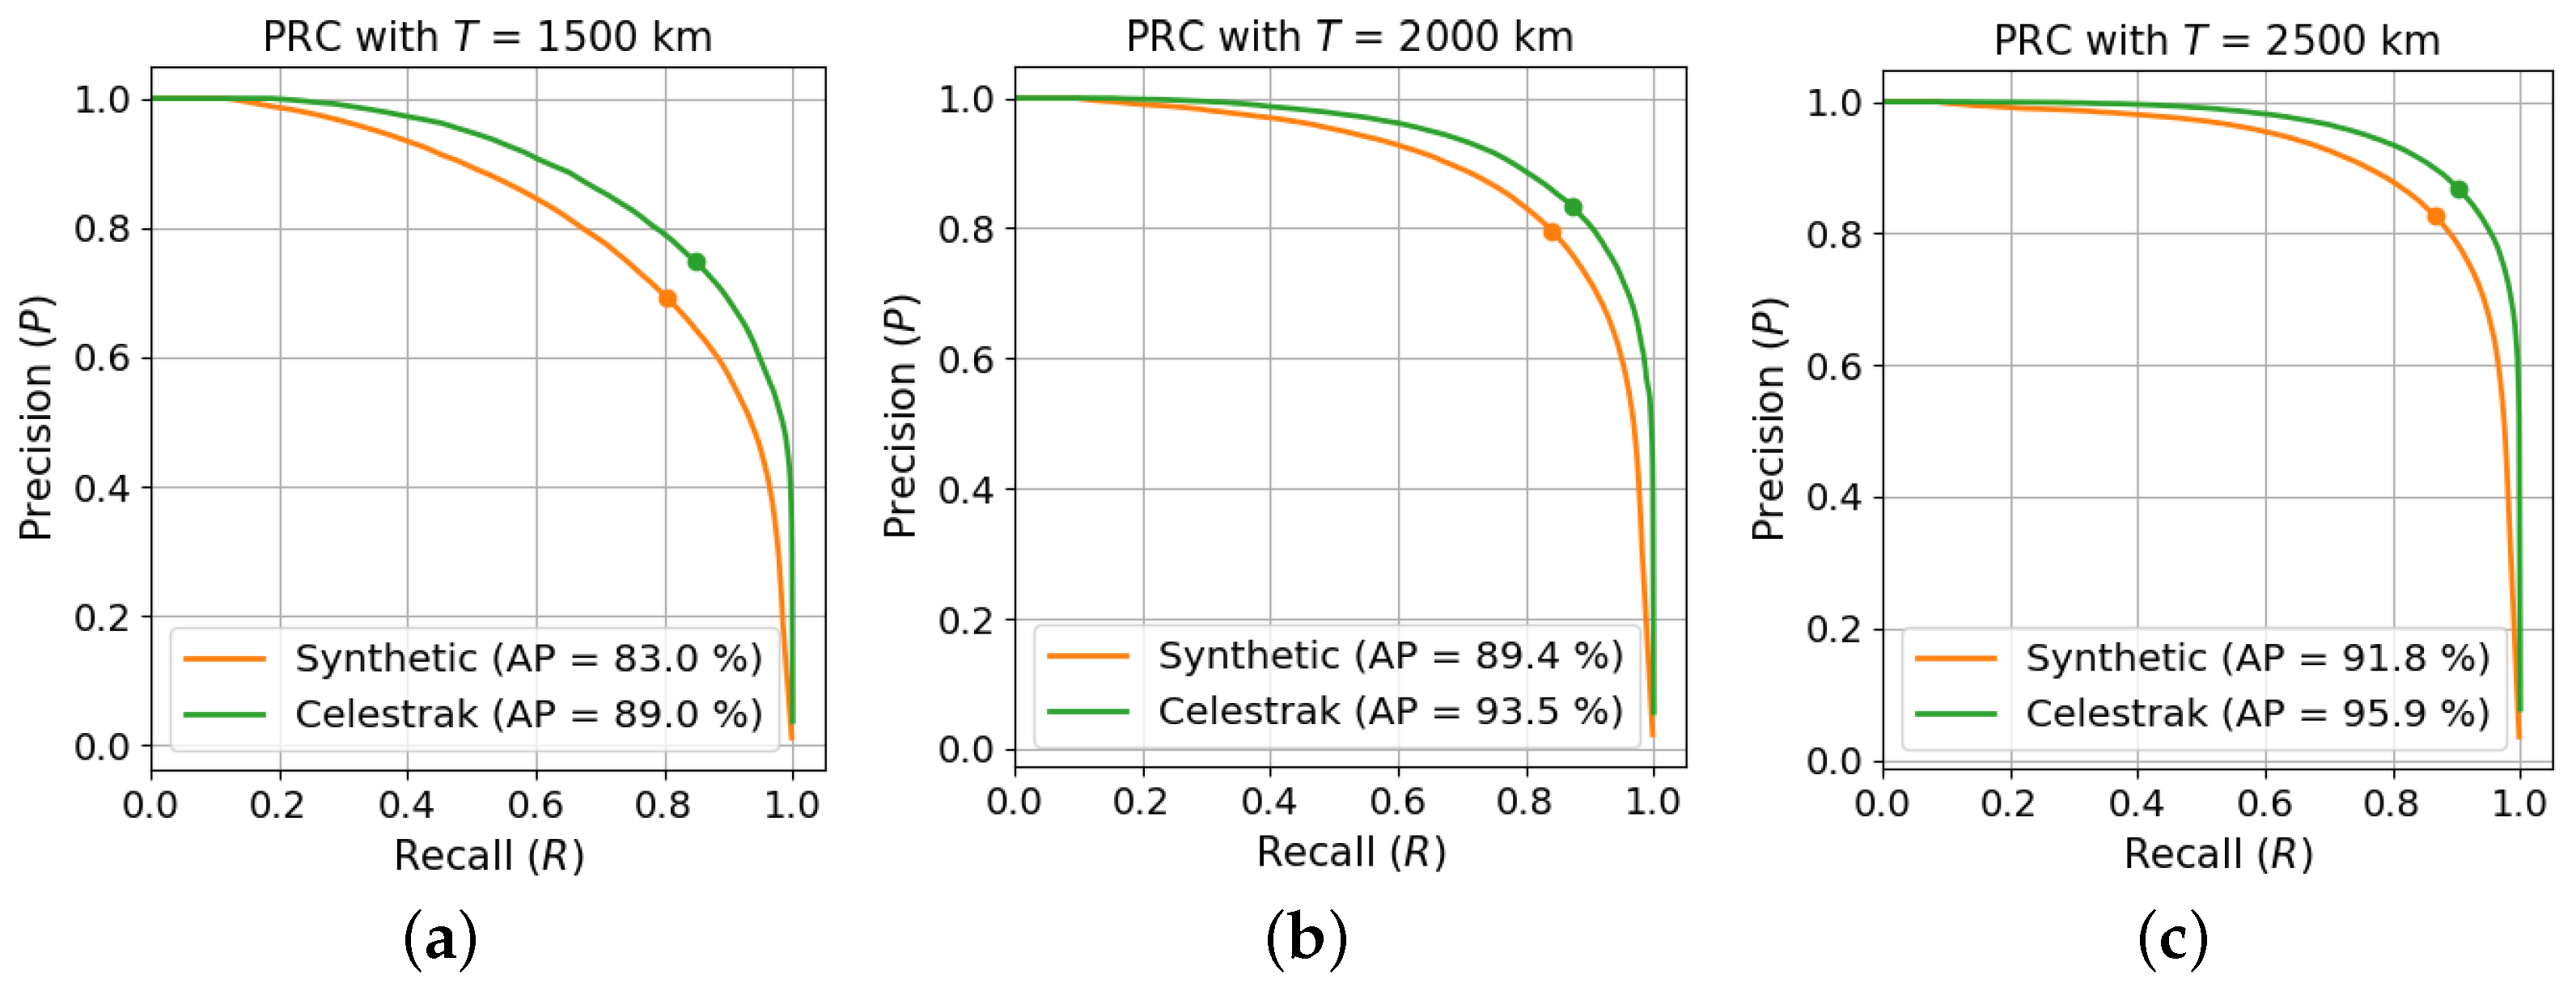
A similar and commonly employed metric for assessing the performance of a binary predictive model without specifying a decision threshold is the average precision (AP), measured as the area under the Precision–Recall Curve (PRC). Figure 8 illustrates the PRC for each scenario and dataset. In line with previous observations, it is noted that the AP of the Celestrak dataset surpasses that of the synthetic dataset by approximately 6% to 4%. These results also highlight the upward trend with the distance threshold, corresponding to an increase in the number of true encounters accompanied by a decrease in F P s and a simultaneous rise in T P s. Figure 8a showcases the most challenging scenario characterized by the highest degree of imbalance in the ground truth with T = 1500 km. It features minimum AP values for the synthetic and Celestrak datasets of 83% and 89%, respectively. Conversely, the scenario with the highest T, as illustrated in Figure 8c, achieves a maximum synthetic AP of nearly 92%, escalating to 96% with the Celestrak dataset.

5.3. Fixed Decision Threshold

The previous results showcase the model’s performance as a function of the decision threshold, i.e., the threshold used to binarize the model prediction. To assess the performance of individual samples in terms of the tangible metrics of F 1 , P, and R, a decision threshold must be established. As mentioned before, this threshold plays a crucial role in the final performance, as it involves a trade-off between detecting all encounters with some false positives and detecting only a subset of true encounters. Previous insights also underscore the strong relationship between the decision threshold and the distance threshold. The following results present the model’s performance when the decision threshold aligns with the normalized distance threshold used to binarize the ground truth, namely T = 1500 km with a decision threshold of 0.75, T = 2000 km with a decision threshold of 0.5, and T = 2500 km with a decision threshold of 0.25.
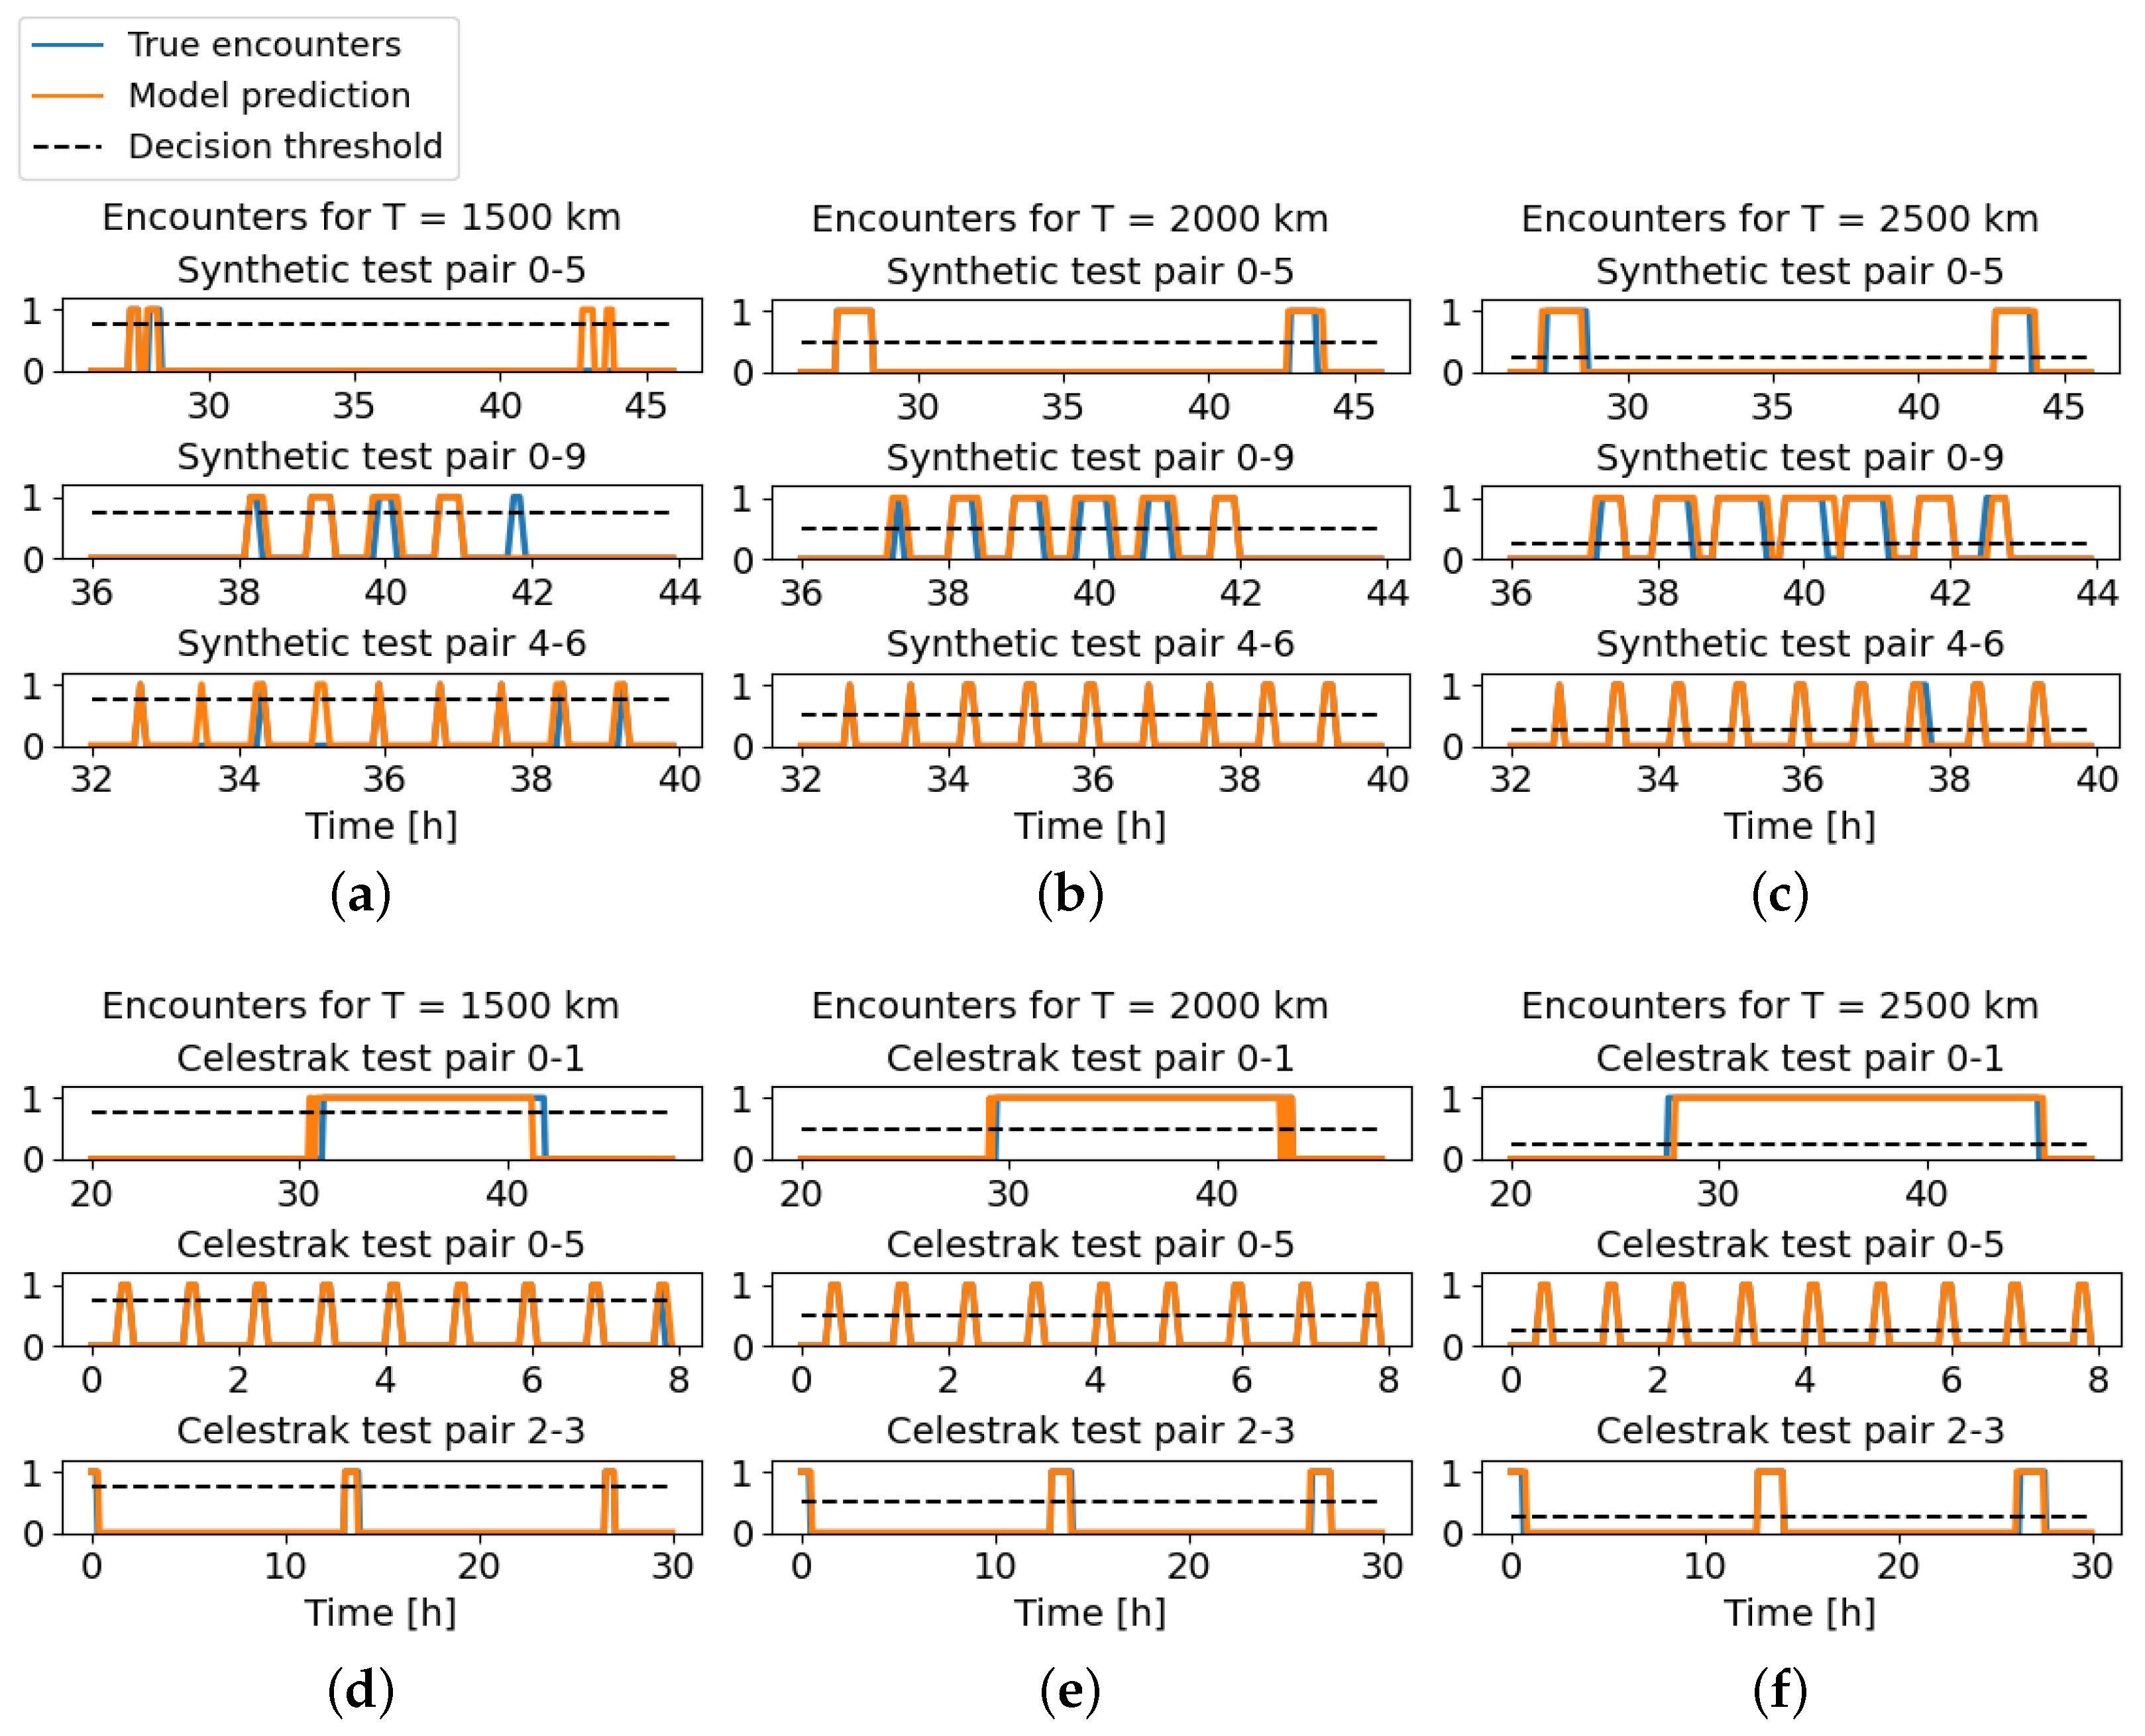
Figure 9 presents a comparative analysis between true and predicted post-processed encounters across three satellite pairs in both synthetic and realistic datasets. Each dataset features three distinct scenarios corresponding to three different T values (to binarize the ground truth) and three different decision thresholds (to binarize the model prediction). As expected, both true and predicted contact durations increase as the thresholds, expressed in kilometers, increase.
The results indicate that the model is able to generalize the encounters for these six unseen samples, even in complex scenarios characterized by intermittent encounters, such as those observed in synthetic pair 4–6 and Celestrak pair 0–5. However, some missed and false communication opportunities can be observed, particularly in synthetic satellite pair 0–9, where the contact around hour 42 shown in Figure 9a is lost, and the contact around hour 40 shown in Figure 9a persists longer than expected. Moreover, in Figure 9d, Celestrak pair 0–1 exhibits a predicted encounter that initiates and concludes several minutes earlier than the true encounter.
To quantify these results, Figure 10 shows, for each scenario, the distribution of F 1 and the Balance Accuracy ( B A ) across all samples in both test datasets. The B A , as defined in Equation (7), is the average of sensitivity and specificity. The sensitivity (or the True-Positive Rate ( T P R )) is the same as the R, while the specificity (or True-Negative Rate ( T N R )) assesses the model’s effectiveness in correctly excluding the negative instances. Notice that specificity is another way of measuring the wasted energy of the prediction, since it accounts for the number of F P s.
B A = T P R + T N R 2 = 1 2 R + T N T N + F P
Note that certain pairs exhibit an F 1 score of zero. Upon closer examination of these critical pairs, it is observed that they are characterized by sporadic encounters (e.g., a single and short communication opportunity throughout the entire duration). In such critical scenarios, obtaining zero T P s is almost inevitable, and a single F P or F N results in an overall F 1 score of zero, thus significantly impacting the average performance across all samples. However, in these critical situations where T P equals zero, B A achieves a maximum value of 0.5 when F P is also zero. For this reason, B A consistently surpasses F 1 and serves as a fairer average metric, providing a more realistic quantification of the mean performance. Furthermore, as observed in the previous results, notable improvements in both F 1 and B A can be observed as the distance threshold increases from 1500 km to 2500 km.
Finally, Table 2 summarizes the results with the mean values for each distance threshold, dataset, and metric. Increasing the distance threshold from 1500 km to 2500 km makes the F1 score improve by around 20%. However, as the encounter duration does not evolve linearly with T, F 1 does not increase linearly, and a major improvement is observed between 1500 km and 2000 km. Similarly, the dissimilarity between B A and F 1 decreases non-linearly with T, reducing from 18% with T = 1500 km to 9% with T = 2500 km. Due to the reduced number of true communication opportunities in the ground truth, the model tends to predict low values; thus, R is usually lower than P. Overall, the model can anticipate two days of communication opportunities with a mean accuracy between 80% and 93%.

5.4. Computational Cost

Prior findings have demonstrated that ML can be used as an alternative to SGP4 to anticipate communication opportunities between satellites. While SGP4 offers precise solutions, our hypothesis suggests that ML can be utilized to trade a degree of accuracy for computational efficiency and battery savings, which are particularly advantageous in resource-constrained systems. In that sense, the proposed SL model solution should anticipate the encounters faster than the state-of-the-art methods based on orbit determination.
Before analyzing the computational cost, TensorFlow Lite (TF Lite) is used to optimize the trained SL model. While TensorFlow (TF) is a framework used mainly to build and train ML models, TF Lite optimizes a trained model mainly through pruning and quantization. These techniques yield a more compact model and enable resource-constrained devices to make predictions much faster and with less memory usage.
Table 3 depicts the performance degradation observed upon implementing a 16-bit floating point quantization of the model’s trained parameters, which reduces the precision of the trained parameters, originally expressed with a 32-bit floating point. As observed, the error produced by this optimization is minimal, except for P, which experiences a loss of nearly 5% in performance for the synthetic dataset with T = 1500 km. However, unexpectedly, a few isolated cases exhibit slightly improved performance after the model optimization process.
To determine the significance of sacrificing this 1% or 2% of performance, Table 4 provides insights into the computational time reduction associated with TF Lite. The computational time is measured as the average duration required for the model to make an inference—specifically, to anticipate the encounters between two satellites given their initial states. The results show a strong decrease in the computational time by three orders of magnitude compared to the default TF model, dropping from around 60 ms to 70 μ s.
To conclude the evaluation of the proposed ML approach, Table 4 also presents the computational time required for the baseline SGP4 to anticipate the encounters. Notice that encounter computation based on SGP4 involves the following three steps: (1) calculation of the satellite positions every 5 min over 2 days, (2) computation of the satellite-to-satellite distances, and (3) evaluation of the encounter times given a distance threshold. The average time required to complete these tasks is around 400 μ s, with the first task accounting for over 90% of the total time. While TF is two orders of magnitude more time-consuming than SGP4, the optimized model with TF Lite exhibits a speed advantage of approximately six times over SGP4, which could reduce the satellite’s battery consumption considerably.
Previous findings demonstrate that ML could be a promising alternative to SGP4 in resource-constrained environments, such as LEO satellite networks. In these settings, where computational resources are limited, ML offers a potential alternative, trading off some accuracy for reduced computational costs.

6. Conclusions

This work presents a supervised machine learning approach for forecasting encounters between heterogeneous polar satellites. The model utilizes 14-dimension synthetic input training data obtained by combining various pairs of orbital elements. The output training data are a set of 48 h time series that describe communication opportunities depending on the satellite-to-satellites distance between 1000 km and 3000 km. Directional antennas with fast pointing mechanisms are assumed. The SGP4 orbital model, which accounts for the most important perturbations in low-Earth orbits, is used to train, validate, and test the SL model based on a fully connected neural network architecture with a weighted loss function. The model performance is evaluated using two different datasets—one containing synthetic polar satellite data and another containing realistic polar satellite data from the Celestrak database. Both the distance threshold and the decision threshold necessary to convert the ground truth and the model prediction into binary signals are thoroughly examined in the Results section.
The outcomes indicate that the proposed machine learning model can effectively predict realistic encounters between polar satellites with a balanced accuracy of around 90% when compared with the ground truth based on SGP4 orbit determination. This performance surpasses that of the synthetic dataset by approximately 5%. The discrepancy can be attributed to the sparse and uniformly distributed nature of synthetic satellites across the range space, leading to sporadic, distance threshold-dependent encounters and, consequently, more challenging prediction. Moreover, computational cost analysis reveals that after optimizing the trained model through parameter quantization, the time required to anticipate encounters using machine learning is six times lower compared to employing state-of-the-art methods based on orbit determination.

Author Contributions

Conceptualization, E.F., J.A.R.-D.-A., F.B., and J.E.; Data curation, E.F.; Formal analysis, E.F.; Funding acquisition, J.A.R.-D.-A., F.B., and J.E.; Investigation, E.F., J.A.R.-D.-A., F.B., and J.E.; Methodology, E.F., J.A.R.-D.-A., F.B., and J.E.; Project administration, J.A.R.-D.-A.; Resources, E.F., J.A.R.-D.-A., F.B., and J.E.; Software, E.F.; Supervision, J.A.R.-D.-A., F.B., and J.E.; Validation, E.F., J.A.R.-D.-A., F.B. and J.E.; Visualization, E.F.; Writing—original draft, E.F.; Writing—review and editing, E.F., J.A.R.-D.-A., F.B., and J.E. All authors have read and agreed to the published version of the manuscript.

Funding

This work was supported and funded by the Spanish Ministry of Economic Affairs and Digital Transformation and the European Union—NextGeneration EU within the framework of the Recovery Plan, Transformation and Resilience (PRTR) (Call UNICO I+D 5G 2021, ref. number TSI-063000-2021-5-6GSatNet-SS) and by the Government of Catalonia within the scope of the NewSpace Strategy for Catalonia.

Institutional Review Board Statement

Not applicable.

Data Availability Statement

The data presented in this study are available upon request from the corresponding author.

Conflicts of Interest

The authors declare no conflicts of interest.

Abbreviations

The following abbreviations are used in this manuscript:
DSSDistributed Space Systems
ISLInter-Satellite Link
LEOLow-Earth Orbit
NTNNon-Terrestrial Network
TLETwo-Line Elements
SLSupervised Learning
SGP4Simplified General Perturbation 4
TDistance threshold
SSOSun-synchronous orbit
OEOrbital Elements
MAEMean Absolute Error
PPrecision
RRecall
F 1 F1 score
T P True Positive
F P False Positive
F N False Negative
B A Balance Accuracy
T N R True Negative Rate
APAverage Precision
PRCPrecision-Recall Cruve

References

  1. Araguz, C. In pursuit of Autonomous Distributed Satellite Systems. Ph.D. Thesis, Polytechnic University of Catalonia, Barcelona, Spain, 2019. [Google Scholar]
  2. Giordani, M.; Zorzi, M. Non-terrestrial networks in the 6G era: Challenges and opportunities. IEEE Netw. 2020, 35, 244–251. [Google Scholar] [CrossRef]
  3. Ben-Larbi, M.K.; Pozo, K.F.; Haylok, T.; Choi, M.; Grzesik, B.; Haas, A.; Krupke, D.; Konstanski, H.; Schaus, V.; Fekete, S.P.; et al. Towards the automated operations of large distributed satellite systems. Part 1: Review and paradigm shifts. Adv. Space Res. 2021, 67, 3598–3619. [Google Scholar] [CrossRef]
  4. Ben-Larbi, M.K.; Pozo, K.F.; Choi, M.; Haylok, T.; Grzesik, B.; Haas, A.; Krupke, D.; Konstanski, H.; Schaus, V.; Fekete, S.P.; et al. Towards the automated operations of large distributed satellite systems. Part 2: Classifications and tools. Adv. Space Res. 2021, 67, 3620–3637. [Google Scholar] [CrossRef]
  5. Fraire, J.A.; Finochietto, J.M. Design challenges in contact plans for disruption-tolerant satellite networks. IEEE Commun. Mag. 2015, 53, 163–169. [Google Scholar] [CrossRef]
  6. de Azúa, J.A.R.; Calveras, A.; Camps, A. Internet of satellites (IoSat): Analysis of network models and routing protocol requirements. IEEE Access 2018, 6, 20390–20411. [Google Scholar] [CrossRef]
  7. Du, B.; Li, S. A new multi-satellite autonomous mission allocation and planning method. Acta Astronaut. 2019, 163, 287–298. [Google Scholar] [CrossRef]
  8. Yao, F.; Li, J.; Chen, Y.; Chu, X.; Zhao, B. Task allocation strategies for cooperative task planning of multi-autonomous satellite constellation. Adv. Space Res. 2019, 63, 1073–1084. [Google Scholar] [CrossRef]
  9. Fossa, C.E.; Raines, R.A.; Gunsch, G.H.; Temple, M.A. An overview of the IRIDIUM (R) low Earth orbit (LEO) satellite system. In Proceedings of the IEEE 1998 National Aerospace and Electronics Conference. NAECON 1998. Celebrating 50 Years (Cat. No. 98CH36185), Dayton, OH, USA, 17 July 1998; IEEE: Piscataway, NJ, USA, 1998; pp. 152–159. [Google Scholar]
  10. Walker, J.G. Satellite constellations. J. Br. Interplanet. Soc. 1984, 37, 559. [Google Scholar]
  11. Fischer, D.; Basin, D.; Eckstein, K.; Engel, T. Predictable mobile routing for spacecraft networks. IEEE Trans. Mob. Comput. 2012, 12, 1174–1187. [Google Scholar] [CrossRef]
  12. Su, W.; Malaer, J.; Cho, O.; Suh, K. Using mobility prediction to enhance network routing in LEO crosslink network. In Proceedings of the International Astronautical Congress (IAC 2019), Washington, DC, USA, 21–25 October 2019. [Google Scholar]
  13. Ruiz-De-Azua, J.A.; Ramírez, V.; Park, H.; AUG, A.C.; Camps, A. Assessment of satellite contacts using predictive algorithms for autonomous satellite networks. IEEE Access 2020, 8, 100732–100748. [Google Scholar] [CrossRef]
  14. Casadesus, G.; Alarcón, E. Toward autonomous cooperation in heterogeneous nanosatellite constellations using dynamic graph neural networks. In Proceedings of the International Astronautical Congress (IAC 2023), Baku, Azerbaijan, 2–6 October 2023. [Google Scholar]
  15. Ferrer, E.; Escrig, J.; Ruiz-de Azua, J.A. Inter-Satellite Link Prediction for Non-Terrestrial Networks Using Supervised Learning. In Proceedings of the 2023 Joint European Conference on Networks and Communications & 6G Summit (EuCNC/6G Summit), Gothenburg, Sweden, 6–9 June 2023; IEEE: Piscataway, NJ, USA, 2023; pp. 258–263. [Google Scholar]
  16. Ferrer, E.; Ruiz-De-Azua, J.A.; Betorz, F.; Escrig, J. Inter-Satellite Link Prediction with Supervised Learning Based on Kepler and SGP4 Orbits. In Artificial Intelligence Research and Development: Proceedings of the 25th International Conference of the Catalan Association for Artificial Intelligence; IOS Press: Amsterdam, The Netherlands, 2023; Volume 375, p. 7. [Google Scholar]
  17. Hoots, F.R.; Roehrich, R.L. Models for Propagation of NORAD Element Sets; Office of Astrodynamics: Colorado Springs, CO, USA, 1988. [Google Scholar]
  18. Vallado, D.; Crawford, P. SGP4 orbit determination. In Proceedings of the AIAA/AAS Astrodynamics Specialist Conference and Exhibit, Honolulu, HI, USA, 18–21 August 200; p. 6770.
  19. Kelso, D.T. Celestrak. 1985. Available online: https://celestrak.org/ (accessed on 16 January 2023).
  20. Ruiz-de Azua, J.A.; Fernandez, L.; Muñoz, J.F.; Badia, M.; Castella, R.; Diez, C.; Aguilella, A.; Briatore, S.; Garzaniti, N.; Calveras, A.; et al. Proof-of-concept of a federated satellite system between two 6-unit CubeSats for distributed earth observation satellite systems. In Proceedings of the IGARSS 2019—2019 IEEE International Geoscience and Remote Sensing Symposium, Yokohama, Japan, 28 July–2 August 2019; IEEE: Piscataway, NJ, USA, 2019; pp. 8871–8874. [Google Scholar]
  21. Vallado, D.A.; Cefola, P.J. Two-line element sets–practice and use. In Proceedings of the 63rd International Astronautical Congress, Naples, Italy, –5 October 2012; pp. 1–14. [Google Scholar]
  22. Wang, Z.; Bovik, A.C. Mean squared error: Love it or leave it? A new look at signal fidelity measures. IEEE Signal Process. Mag. 2009, 26, 98–117. [Google Scholar] [CrossRef]
  23. Chai, T.; Draxler, R.R. Root mean square error (RMSE) or mean absolute error (MAE). Geosci. Model Dev. Discuss. 2014, 7, 1525–1534. [Google Scholar]
  24. Mannor, S.; Peleg, D.; Rubinstein, R. The cross entropy method for classification. In Proceedings of the 22nd International Conference on Machine Learning, Bonn, Germany, 7–11 August 2005; pp. 561–568. [Google Scholar]
Figure 1. Satellite-to-satellite distance, upper and lower bound thresholds ( T m i n , T m a x ), and resulting encounter with 576 features corresponding to 48 h of SGP4 orbit determination with 5 min discretization intervals.
Aerospace 11 00551 g001
Figure 2. Inclination of all 6175 real active low-Earth orbit satellites in Celestrak. The red region contains polar satellites. Sun-synchronous orbiting satellites (in brown) are a specific type of polar satellite.
Aerospace 11 00551 g002
Figure 3. Probability distribution of selected characteristics for all 2613 real polar satellites from Celestrak. (a) Distribution of B-star drag term, with over 98% falling within the range of −0.03 to 0.03. (b) Distribution of semi-major axis, showing that more than 99% of satellites are within the range of 6700 km to 7500 km. (c) Distribution of eccentricity, where over 99% of satellites have values ranging from 0 (circular orbit) to 0.02.
Aerospace 11 00551 g003
Figure 4. Weighted mean square error loss function with A = 0.5.
Aerospace 11 00551 g004
Figure 5. Comparison of ground truth and model predictions (orange) for three distinct satellite pairs across both synthetic and Celestrak test sets.
Aerospace 11 00551 g005
Figure 6. Obtained distribution of MAE depicting the model mean performance in predicting all samples in both synthetic and Celestrak test sets.
Aerospace 11 00551 g006
Figure 7. Precision, recall, and F1-score curves obtained using both synthetic and Celestrak test sets across three different distance thresholds. (a) Synthetic data, T = 1500 km. (b) Synthetic data, T = 2000 km. (c) Synthetic data, T = 2500 km. (d) Celestrak data, T = 1500 km. (e) Celestrak data, T = 2000 km. (f) Celestrak data, T = 2500 km.
Aerospace 11 00551 g007
Figure 8. Precision and recall curves obtained using both synthetic and Celestrak test sets across three different distance thresholds. The average precision, representing the area under the curves, is also indicated. Additionally, points denote the precision and recall values corresponding to the maximum F1 score. (a) T = 1500 km. (b) T = 2000 km. (c) T = 2500 km.
Aerospace 11 00551 g008
Figure 9. True post-processed encounters (in blue) and post-processed model prediction (in orange) across three different distance thresholds. (a) Synthetic data, T = 1500 km, decision threshold of 0.75. (b) Synthetic data, T = 2000 km, decision threshold of 0.5. (c) Synthetic data, T = 2500 km, decision threshold of 0.25. (d) Celestrak data, T = 1500 km, decision threshold of 0.75. (e) Celestrak data, T = 2000 km, decision threshold of 0.5. (f) Celestrak data, T = 2500 km, decision threshold of 0.25.
Aerospace 11 00551 g009
Figure 10. Probability distribution of F 1 and B A for all samples in both synthetic and Celestrak test sets across three different distance thresholds. Vertical dashed lines indicate mean performances. (a) Synthetic data, T = 1500 km, decision threshold of 0.75. (b) Synthetic data, T = 2000 km, decision threshold of 0.5. (c) Synthetic data, T = 2500 km, decision threshold of 0.25. (d) Celestrak data, T = 1500 km, decision threshold of 0.75. (e) Celestrak data, T = 2000 km, decision threshold of 0.5. (f) Celestrak data, T = 2500 km, decision threshold of 0.25.
Aerospace 11 00551 g010
Table 1. Range of values for orbital elements and drag term used to generate synthetic polar satellites.
Value B * [ R E 1 ]a [km]e [-]i [°] Ω [°] ω [°]M [°]
From−0.036700066000
To0.0379000.02114360360360
Table 2. Mean performance for each scenario and dataset.
T = 1500 kmT = 2000 kmT = 2500 km
TestSTestCTestSTestCTestSTestC
B A [%]81.886.389.691.291.893.1
F 1 [%]63.671.878.781.883.086.7
P [%]82.383.883.586.784.989.7
R [%]63.873.279.683.184.287.0
A P [%]83.089.089.493.591.895.9
Table 3. Comparison of the previous mean performance metrics obtained with TensorFlow versus the new results with TensorFlow Lite ( B A , F 1 , P , R , and A P ).
T = 1500 kmT = 2000 kmT = 2500 km
TestSTestCTestSTestCTestSTestC
B A B A −0.3%0.0%0.5%0.3%1.1%0.9%
F 1 F 1 1.1%1.0%1.9%1.2%1.8%1.5%
P P 4.9%3.1%3.1%2.1%1.1%1.1%
R R −0.8%−0.3%0.9%0.5%2.1%1.6%
A P A P 2.8%1.8%2.2%1.4%1.6%1.1%
Table 4. Computational cost obtained with GPU NVIDIA RTX A4000 with 32 GB RAM.
TFTF LiteSGP4
Time [ μ s]≈60,000≈70≈420
Disclaimer/Publisher’s Note: The statements, opinions and data contained in all publications are solely those of the individual author(s) and contributor(s) and not of MDPI and/or the editor(s). MDPI and/or the editor(s) disclaim responsibility for any injury to people or property resulting from any ideas, methods, instructions or products referred to in the content.