Abstract
Twist angle errors along the blade radial direction are uncertain and affected by cutting force, tool wear, and other factors. In this paper, the measured twist angle errors of 13 sections of 72 rotor blades were innovatively analyzed to obtain the rational statistical distribution. It is surprisingly found that the under-deflection systematic deviation of twist angle errors shows a gradually increasing W-shaped distribution along the radial direction, while the scatter is nearly linear. Logically, the statistical model is established based on the linear correlation of the scatter by regression analysis to reduce variable dimension from 13 to 1. The influence of the radial non-uniform twist angle errors’ uncertainty on the aerodynamic performance of the three-dimensional compressor rotor is efficiently quantified combining the non-intrusive polynomial chaos method. The results show that the mean values of mass flow rate, total pressure ratio, and isentropic efficiency at the typical operating conditions are lower than the nominal values due to the systematic deviation, indicating that the under-deflection twist angle errors lead to the decrease in compressor thrust. The compressor’s stable operating range is more sensitive to the scatter of twist angle errors, which is up to an order of magnitude greater than that of the total pressure ratio and isentropic efficiency, indicating the compressor’s safe and stable operation risk increases. Additionally, the flow field at the tip region is significantly affected by twist angle errors, especially at the shock wave position of the near-stall condition.
1. Introduction
The performance of compressor blades significantly affects the efficiency and stability of aero engines. However, during the blade manufacturing process, various factors such as cutting force, residual stress, and tool wear [1,2,3,4,5] inevitably result in blade twist angle errors. The presence of twist angle errors deforms the stagger angles of each blade section. Consequently, it deviates the manufactured blades from their intended design specifications, potentially impacting the parameters related to blade aerodynamic performance, such as incidence, mass flow rate, and aerodynamic load. Hence, it is imperative to consider the impact of twist angle errors on blade aerodynamic performance, which is the primary motivation of the current work.
Interest in twist angle errors emerged during the early years of the 21st century, and the focus of attention was on which aerodynamic performance was sensitive to twist angle errors. For example, Lange et al. [6,7] employed the Monte Carlo (MC) method to analyze the uncertainty quantification (UQ) of the machining errors’ influence on compressor blades and found that relative flow angle was more sensitive to twist angle error than others. The research results from Reitz et al. [8] showed that the UQ analysis demonstrated that the sensitivity of stage load coefficient to twist angle error was greater than to other machining errors. Therefore, researchers are paying more and more attention to the influence of twist angle errors’ uncertainty. Zheng et al. [9] assumed that twist angle errors at the root, middle, and tip of compressor rotor blades fit the standard normal distribution N(0, 1) and found that the aerodynamic performance was most sensitive to twist angle errors at the tip after UQ analysis. Chu et al. [10,11] believed that twist angle errors fit the Gaussian distribution N(0, 0.1667) and twisted blades as a whole. It was found that the aerodynamic performance of the compressor also approximately fitted the Gaussian distribution. It is worth noting that the statistical distribution of machining errors is particularly important for assessing the uncertainty of compressor aerodynamic performance. Cai et al. [12] changed the statistical distribution of the profile error from N(0, 0.01) to N(0, 0.05) and found that the scatter of the cascade aerodynamic performance varied significantly. Wang [13] and Ma [14] et al. characterized the leading-edge radius errors by using different Gaussian distributions and the result of UQ analysis revealed that the mean value, scatter, and even histogram of the aerodynamic performance of the cascade were different. Therefore, if the uncertainty research is based on the assumed twist angle errors’ distribution, it will directly affect the accuracy of the UQ results. It is necessary to analyze the statistical distribution from the measured data and use it as the UQ input. Additionally, the geometric model was simplified in most of the twist angle error investigations, such as focusing on airfoil [13,14,15], only twisting the typical section (root, middle, or tip) of the blade [9], or twisting the whole blade [16,17], while the actual twist angle errors change non-uniformly along the radial direction of the blade. In addition to the lack of measured data, the purpose of the above research is undoubtedly to mitigate the “dimension disaster” problem and reduce the cost of UQ. So, it is urgent to find a method to characterize the radial non-uniformity of twist angle errors and realize the efficient UQ.
In contrast to previous work, our investigation obtains a reasonable statistical distribution of twist angle errors based on the measured data at different radial blade sections, firstly. Then, combining statistical and regression analysis, the UQ “dimension disaster” problem of the radial non-uniform twist angle errors’ influence is mitigated. Finally, the influence of the measured twist angle error uncertainty on the aerodynamic performance of the compressor three-dimensional rotor is analyzed, especially aiming at the safe and stable operation of the compressor, further providing a reference for the fine machining of compressor blades.
2. Twist Angle Error Definition and Statistical Modeling
2.1. Definition of Twist Angle Error
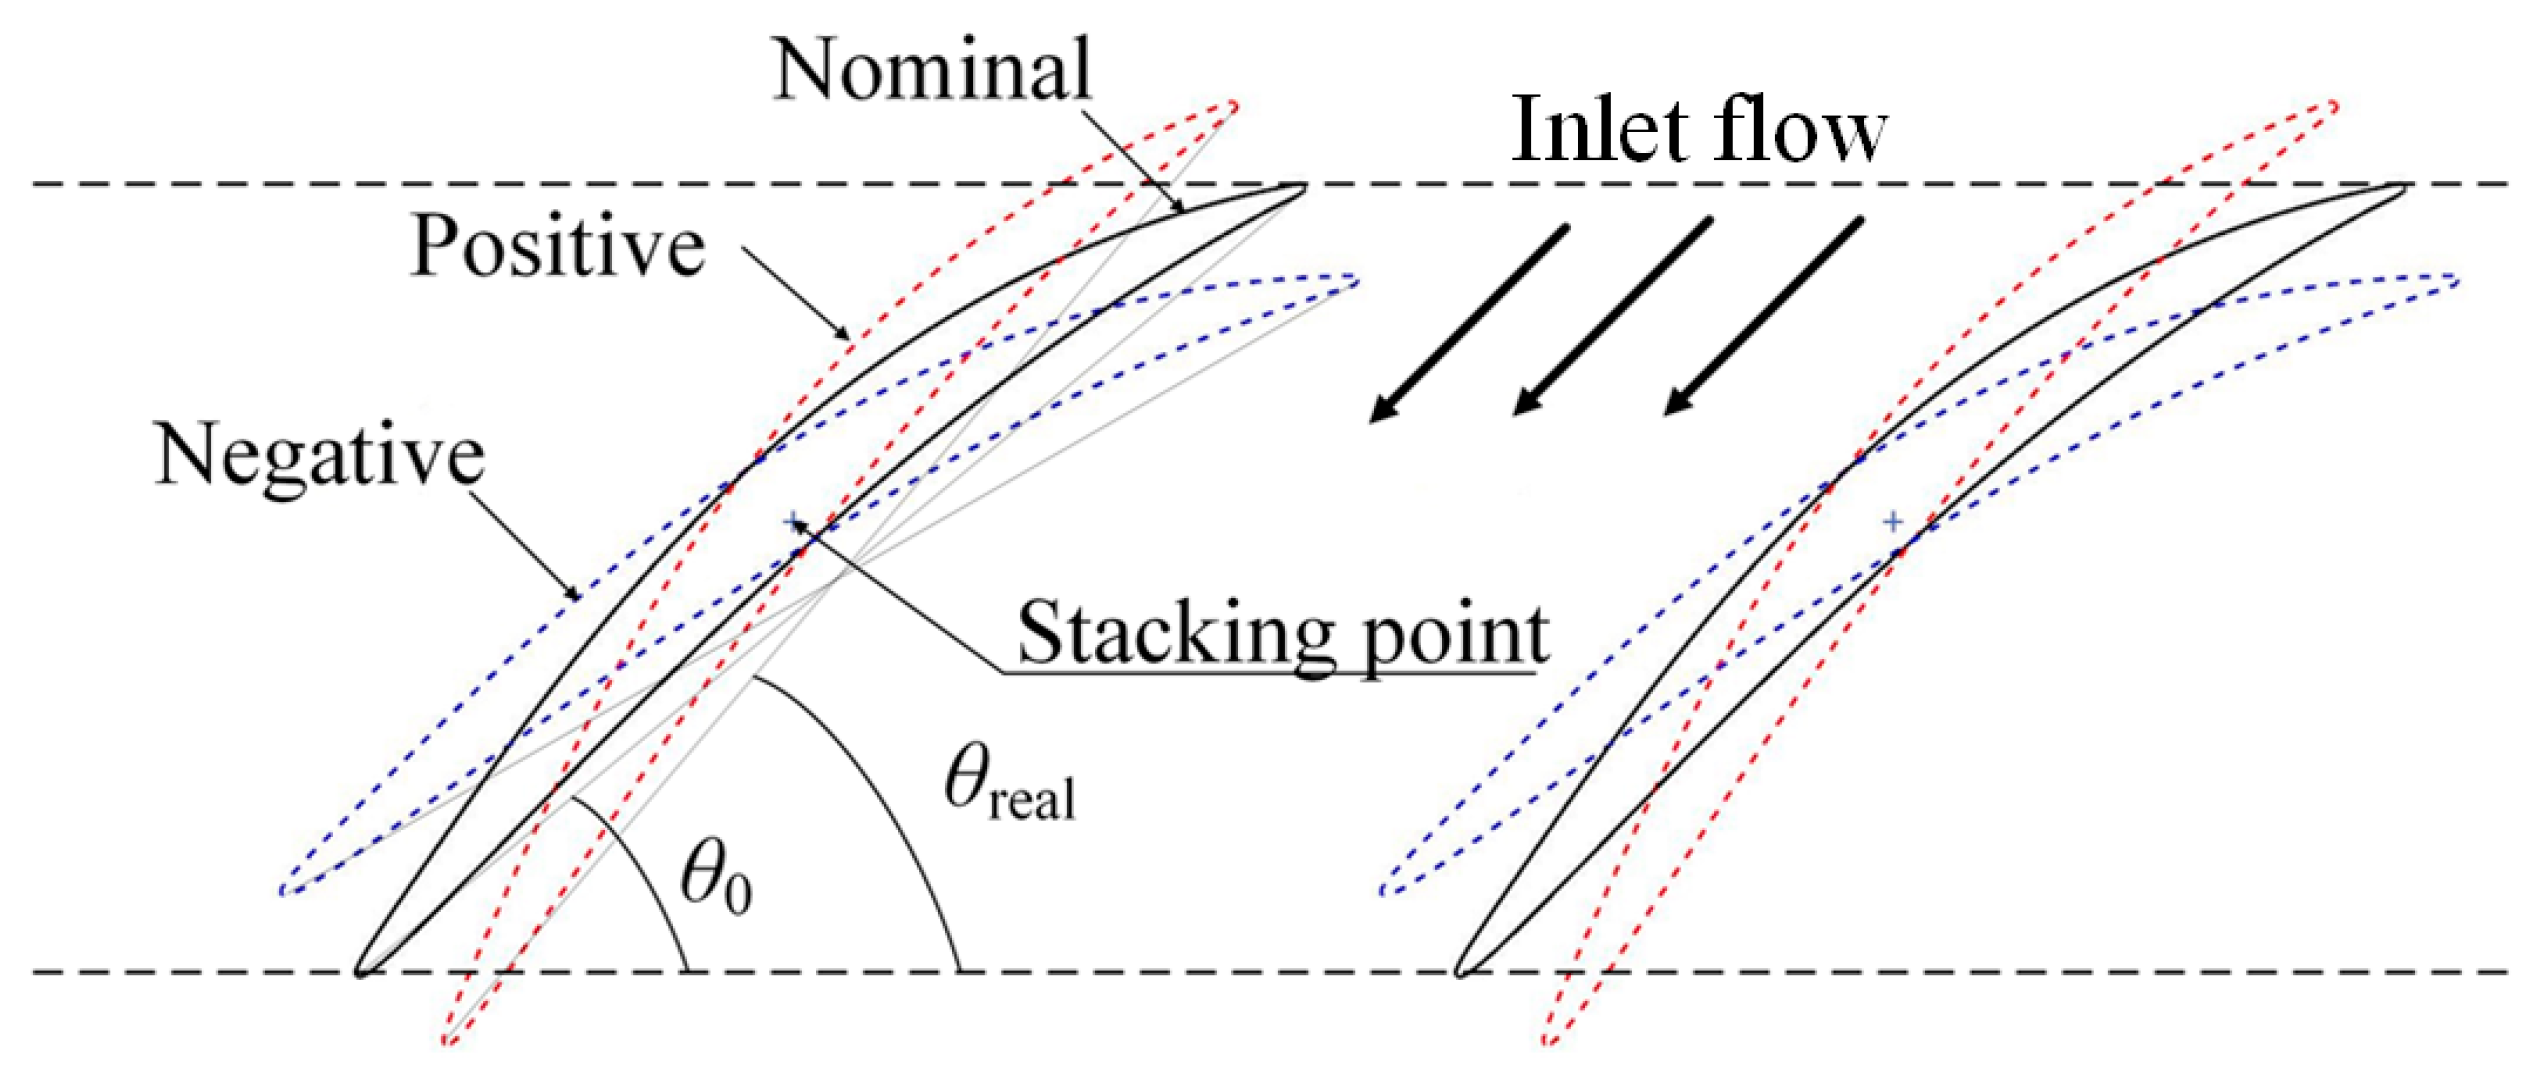
Twist angle error is a type of position error in blade machining quality inspection. Due to the compressor blade’s characteristics of poor rigidity and thin walls, it is sensitive to various machining force factors. As a result, the radial section inevitably twists around the stacking center, typically the center of mass, as illustrated in Figure 1. The deviation from the nominal stagger angles results in the formation of twist angle errors, as described by Equation (1). Depending on the twist direction of the blade profile, the error is categorized as “over-deflection” (positive) and “under-deflection” (negative) types.
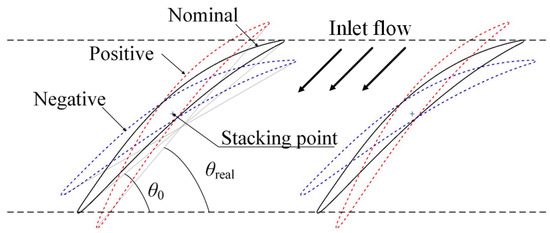
Figure 1.
Diagram of twist angle error.
2.2. Statistical Modeling of Radial Twist Angle Error Samples
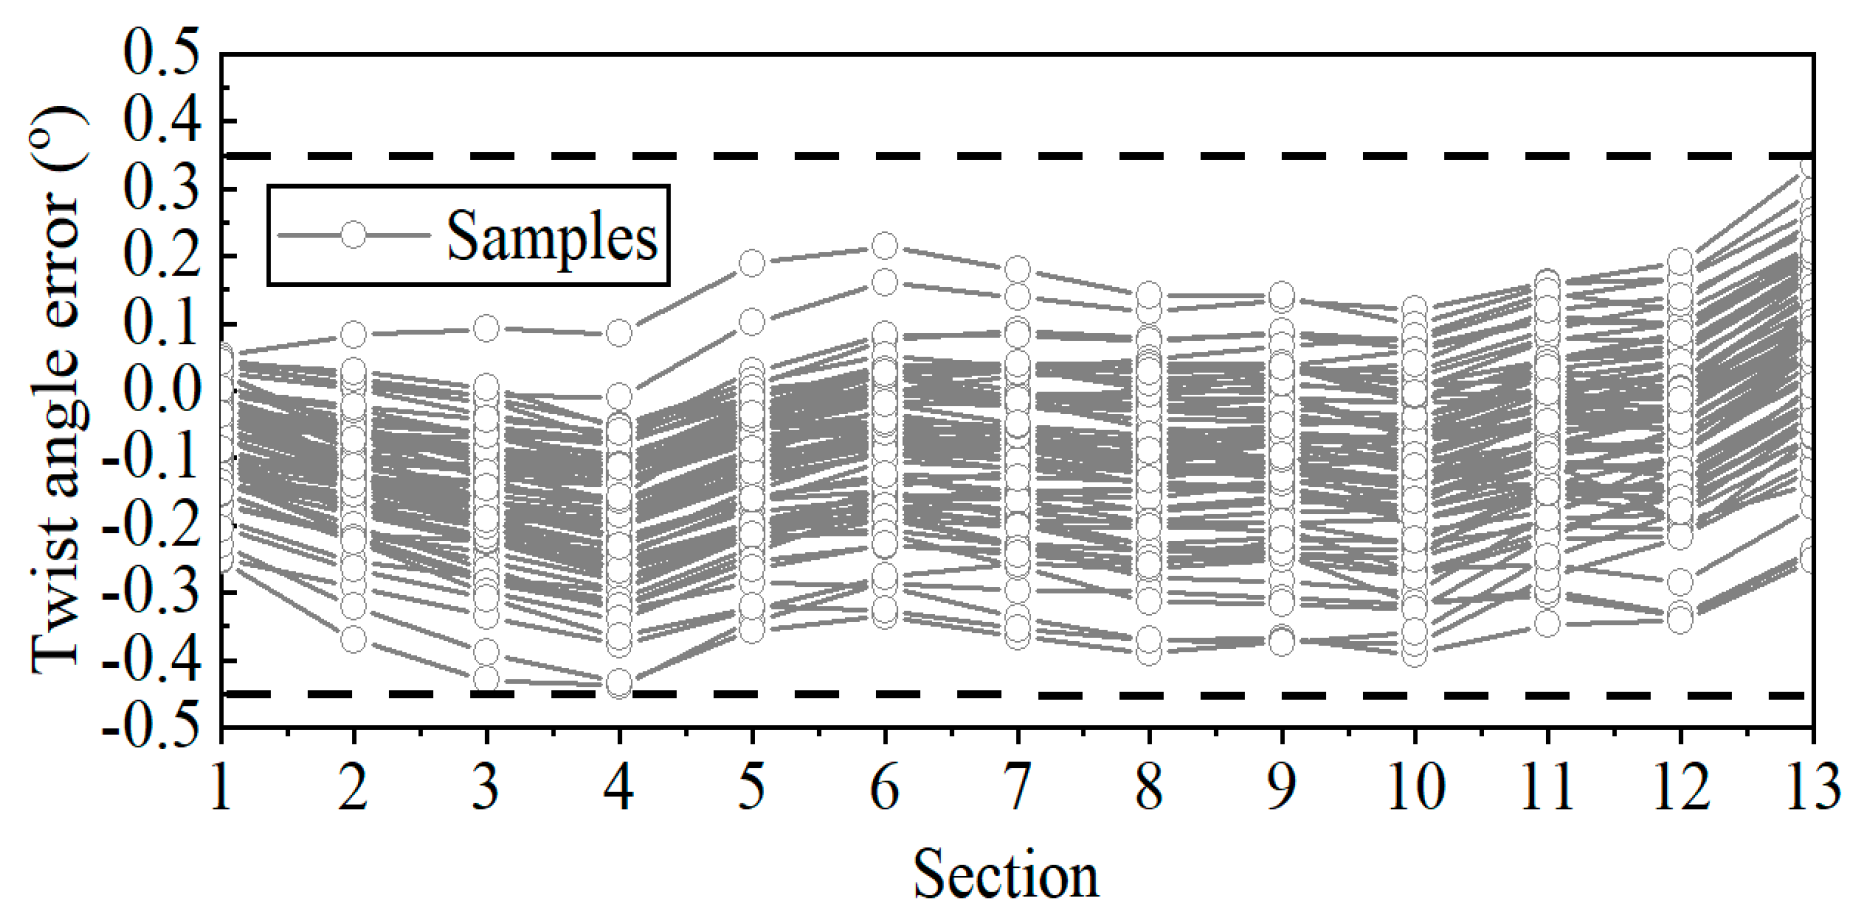
To ensure the rationality of twist angle errors’ statistical distribution, we detected the profile coordinate of 13 equidistant sections of 72 rotor blades which belong to the same engine type. During the measurement, a high-precision three-dimensional space detection equipment, the coordinate measuring machine [15], was used and the parametric analysis of the blade profile was carried out to obtain the real twist angles. Then, twist angle errors were computed by comparing them to the nominal twist angle and we performed statistical analysis and regression analysis on this basis. The twist angle error samples are shown in Figure 2. It is evident that, despite the use of the same machining technology, the twist angle errors among the 72 blades present a “band-like” random shape. Moreover, the band width of the twist angle errors near the blade tip is larger than that near the root. All the errors fall within the range of [−0.45°, 0.35°], complying with the tolerance range [−0.5°, 0.5°] introduced in Reference [10].
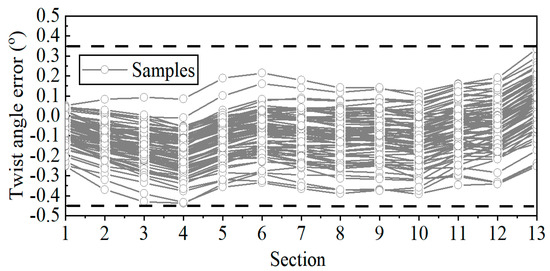
Figure 2.
Twist angle error of 72 samples.
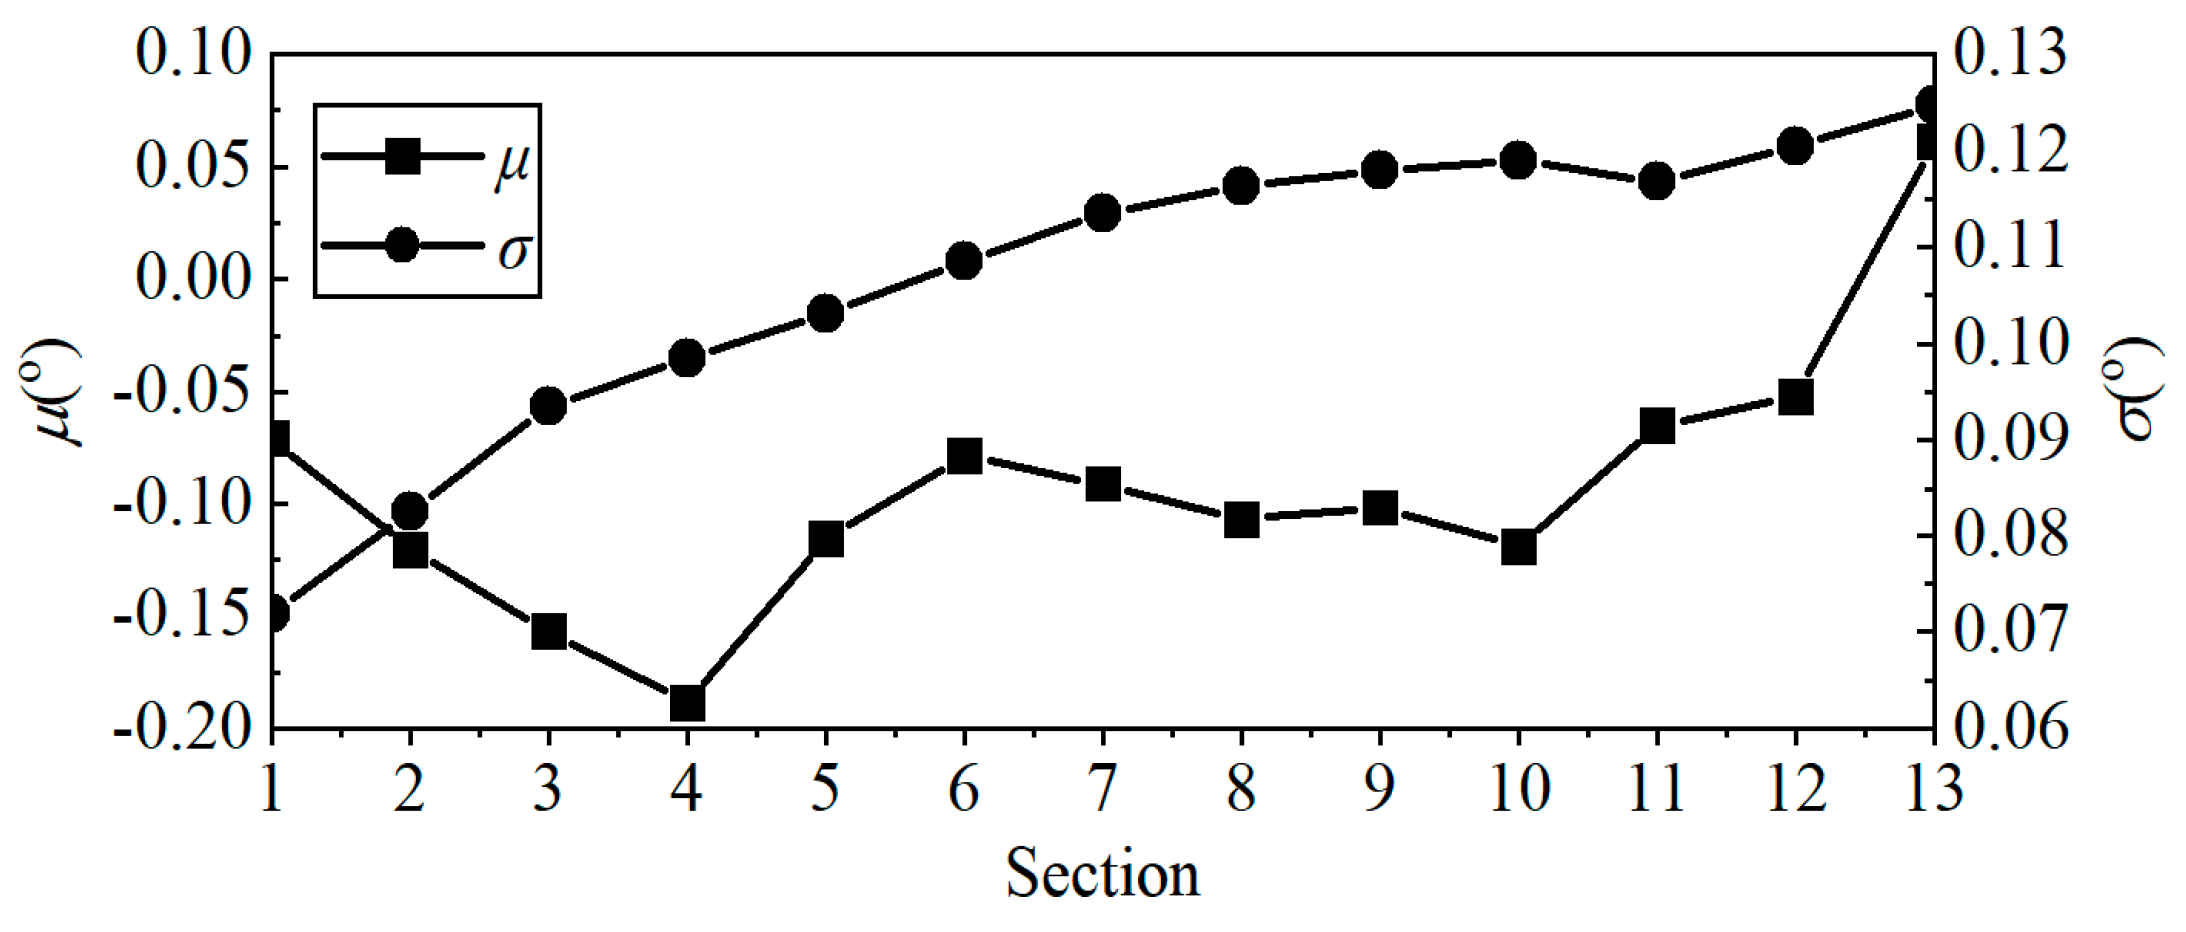
Mean (Equation (2)) and standard deviation (Equation (3)) are two variables that show the statistical characteristics of twist angle errors, representing the systematic deviation and scatter, respectively, shown in Figure 3. It is evident that the mean value is nonzero. With the exception of the section near the tip, the systematic deviation presents an under-deflection trend throughout the blade, indicating that the actual stagger angles in each section of the constrained blade are smaller than the nominal values. Notably, due to the complexity of the forces during machining, the systematic deviation exhibits a gradually increasing “W-shaped” distribution instead of a linear increase trend. In addition, the standard deviation increases nearly linearly along the radial direction, indicating that the scatter of the section near the tip is larger than that of the section near the root. This trend aligns with widening the error band along the radial direction in Figure 2.
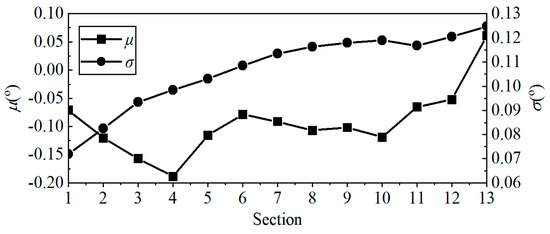
Figure 3.
Statistical analysis of twist angle error samples.
As the input to UQ analysis, the establishment of a rational statistical distribution is necessary. It is assumed that the twist angle error of each radial section fits the Gaussian distribution. Subsequently, we conduct the Kolmogorov–Smirnov (K-S) hypothesis test, and the test statistic Dn,i is shown in Table 1. It suggests that the random distribution of twist angle errors is consistent with the Gaussian distribution since Dn,i is less than the critical value Dn,0.05 = 0.16 [18], which is characterized as Δθi~N(μi, σi).

Table 1.
K-S hypothesis test statistic.
In these equations, subscripts i and k denote the section and sample number, respectively, with a total number of 72 samples (n = 72). Additionally, μ and σ represent the mean and standard deviation, respectively.
If the twist angle errors of the 13 sections are regarded as 13 random variables and the non-intrusive polynomial chaos (NIPC) UQ method is applied, the three-dimensional flow field (4+1)13 samples are solved (fourth-order NIPC) [19], whose computational cost is expensive. To address the above issue, combined with the phenomenon of “the near-linear scatter of radial twist angle errors”, the regression analysis is applied to obtain the scatter linear model, defined by Equation (4). It is worth noting that hi represents the relative blade height (absolute blade height H) of the measured sections, whose range is 0.10~0.98. Combined with Equation (4), the uncertainty statistical model of twist angle errors is expressed as Equation (5), which reduces the random variable dimension and the computed samples to 1 and (4+1)1, respectively.
Herein, b = 0.052 and δ0 = 0.078. With the relative blade height hi of the radial section, according to the linear model, the twist angle error scatter δi can be obtained.
3. Uncertainty Quantification Method
3.1. Non-Intrusive Polynomial Chaos Quantification Method
As compared to deterministic computation, UQ will lead to increased computational cost. Apparently, it is essential to effectively balance computational efficiency in UQ while ensuring computational accuracy. Therefore, in this paper, we utilize a self-developed NIPC quantification method [19,20,21] to investigate the influence of twist angle error in three-dimensional rotor blades on their aerodynamic performance. This method employs a series of random orthogonal polynomials ψj(x) and deterministic coefficient aj to model the random system output Y, as defined by Equation (6).
For Gaussian distribution, Hermite polynomials are employed in the orthogonal polynomials ψj(x), with Q representing the number of polynomials. According to Equation (4), due to the linear scatter model of the twist angle errors, the random variable dimension of the uncertainty statistical model m in the uncertainty statistical model is equal to 1. The NIPC method offers a significant reduction in computational cost compared with the MC method. Prior research [19] have shown that when the NIPC order is set to 4 (s = 4), the computational accuracy is comparable to that of the MC method. In addition, the deterministic coefficient aj is defined by the following:
where <,> denotes the inner product and represents the twist angle error at the integral node, as defined in Equation (9).
Herein, xq and wq are the Hermite integral node and weight corresponding to standard Gaussian distribution N(0, 1), respectively [19].
Four parameters collectively portray the influence of twist angle error uncertainty on the rotor performance, we will describe them in detail below. According to Equations (10) and (11), we can determine the mean and standard deviation of the aerodynamic performance parameters (total pressure ratio π*, isentropic efficiency η*, stability margin SM, mass flow rate ma, etc.) while considering the influence of the uncertainty stemming from the twist angle error in the three-dimensional rotor blade.
Furthermore, by comparing the performance mean value of blades with twist angle errors and the nominal value, the variation can be obtained by Equation (12). At the same time, the dimensionless parameter Su is introduced to characterize the performance’s sensitivity to twist angle errors, which is defined by Equation (13).
3.2. Geometric Model Establishment
The geometric dimensions and performance parameters of Rotor37 are representative of the transonic rotor and it has a substantial amount of publicly available experimental data [22]. That is why Rotor37 is chosen for our research. The main parameters of Rotor37 are presented in Table 2.
Table 2.
Main parameters of Rotor37.
The steps to establish the geometric model with twist angle errors are as follows:
- (1)
- Divide the Rotor37 blade into 13 equidistant sections along the blade height (refer to the measured sections in Part 2.2) and find the stacking center of each radial section;
- (2)
- According to Equation (9), construct the integral nodes of the twist angle error and twist each radial section around the stacking center according to the corresponding integral node;
- (3)
- Restack the twisted sections to establish the Rotor37 blade geometric model with twist angle errors.
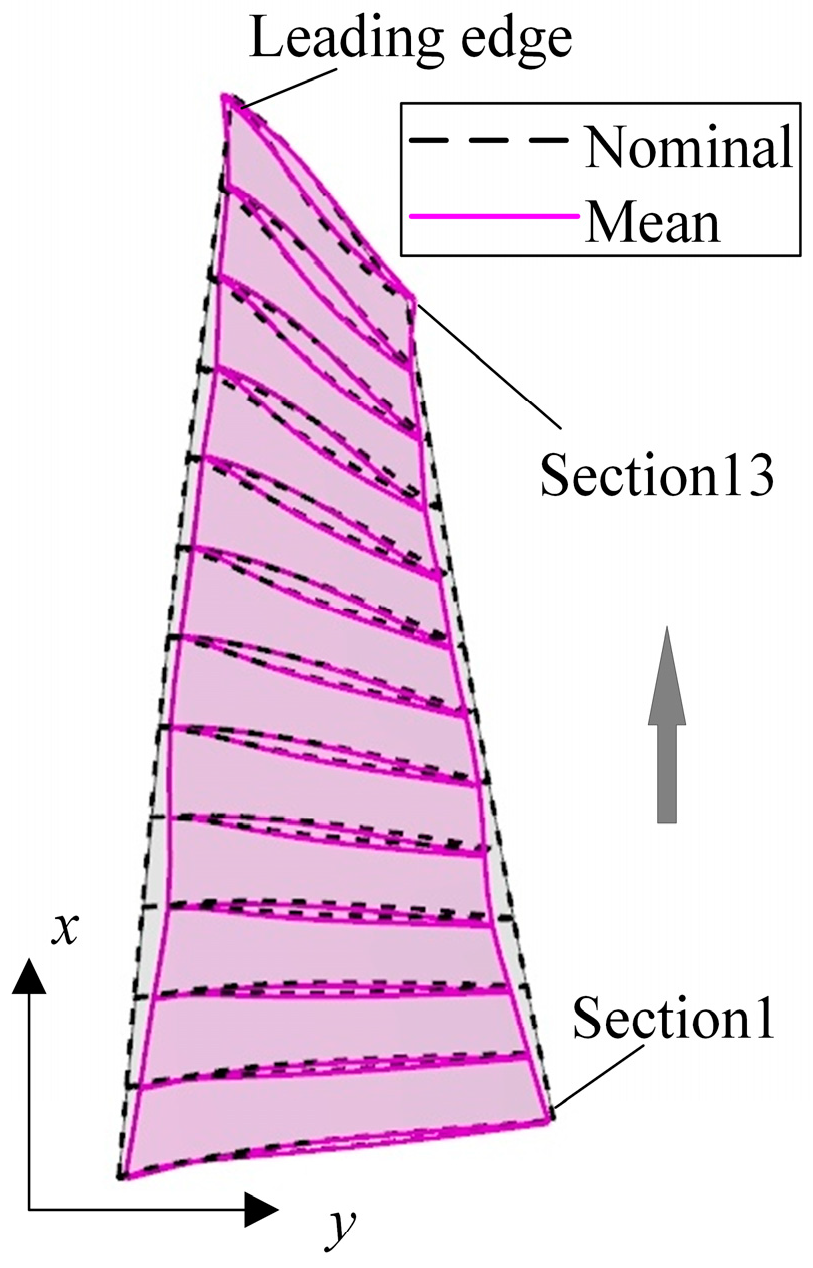
The geometric diagram of the nominal blade (nominal) and the blade with a systematic deviation of twist angle errors (mean) is illustrated in Figure 4.
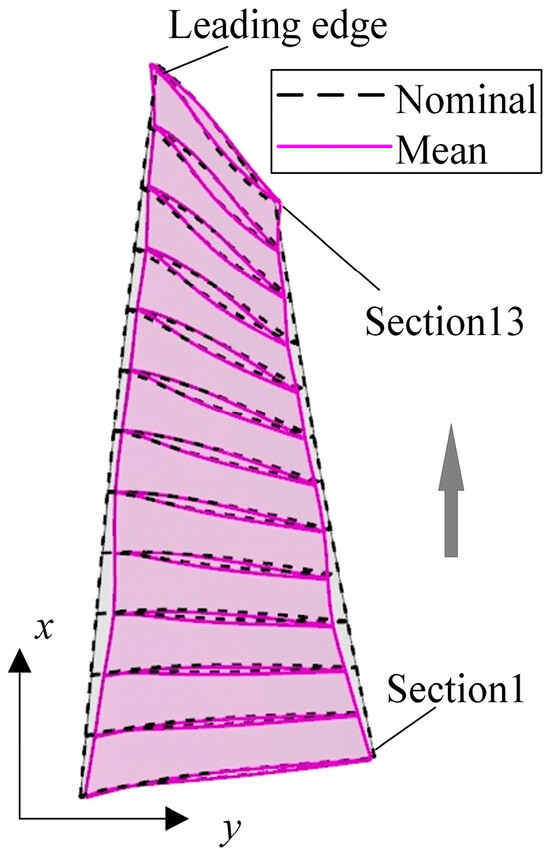
Figure 4.
Geometric diagram of the nominal Rotor37 blade and the blade with twist angle errors.
3.3. Numerical Simulation Method
The commercial software of NUMECA is used for CFD (computational fluid dynamics) numerical simulation. The Reynolds-averaged Navier–Stokes equations are solved based on the Spalart–Allmaras (S-A) turbulence model [23,24], which is rational for the three-dimensional flow field numerical simulation of transonic compressors. And the central scheme is used as the numerical scheme, whose spatial order of accuracy is second. Moreover, the inlet conditions include standard atmospheric conditions and axial intake, and the inlet flow rate of the compressor is varied by varying the outlet average static pressure. For a more precise determination at the near-stall condition, a dichotomy approach [25] is used to iteratively adjust the outlet static pressure until the difference between the stall and near-stall conditions is reduced to less than 50 Pa.
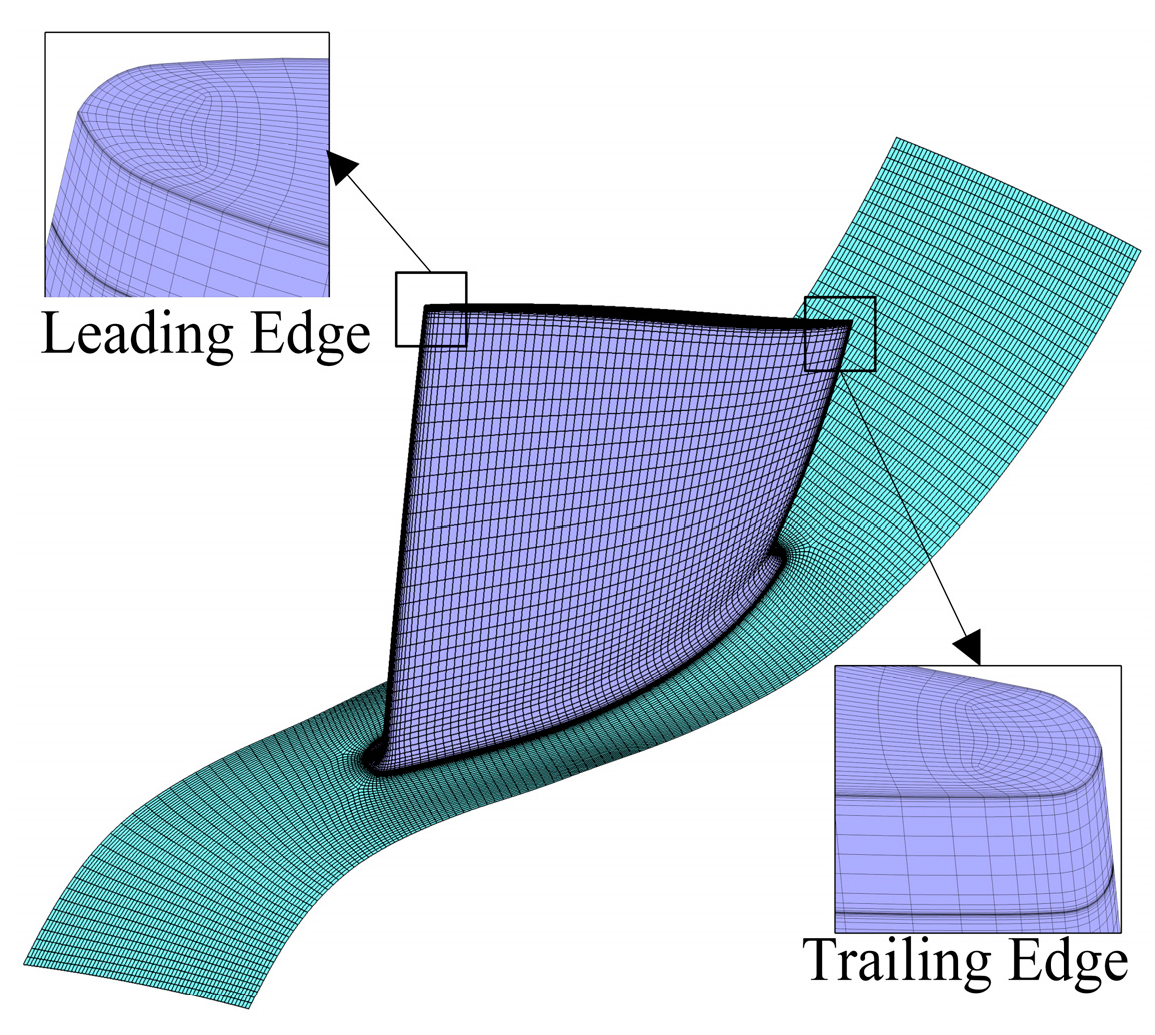
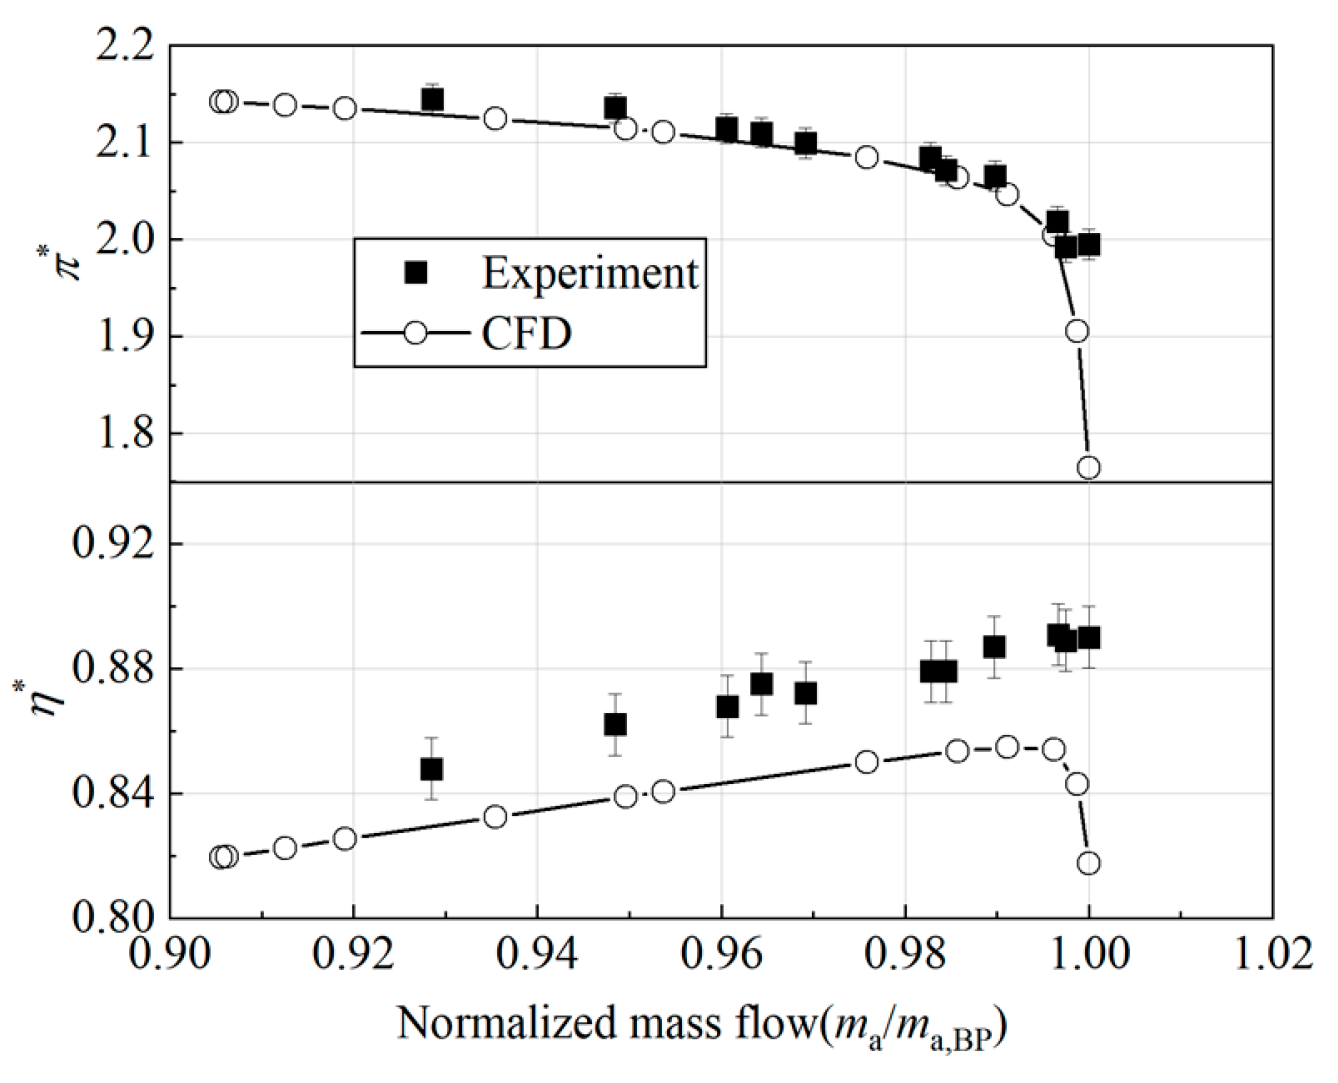
A structured grid (Figure 5) is used to discretize the computational domain. The first grid height near the solid wall is set as 10−6 m, and the near-wall y+ value is no more than 3, which satisfies the requirement of the S-A model. The total grid number is about 960,000, which is consistent with the research in Reference [26]. The grid independence and numerical calculation method of CFD have been previously verified in earlier research [26], and the comparison of results between the numerical calculation and experiment are shown in Figure 6.

Figure 5.
Grid meshing.
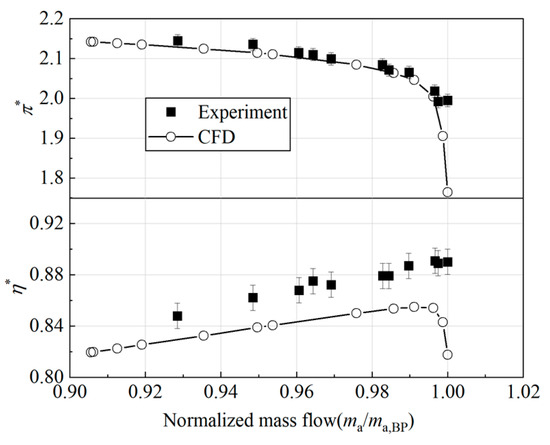
Figure 6.
Comparison of numerical calculation and experimental results.
Three typical operating conditions are studied, including near-stall operating point (NSP), peak efficiency operating point (PEP), and blockage operating point (BP). It is worth noting that the stability margin SM and operating flow range ma,range are defined by Equations (14) and (15), respectively. Both of them are used to characterize the variation in the compressor’s stable operating range.
4. Uncertainty Influence of Radial Twist Angle Error
4.1. Total Aerodynamic Performance Parameters
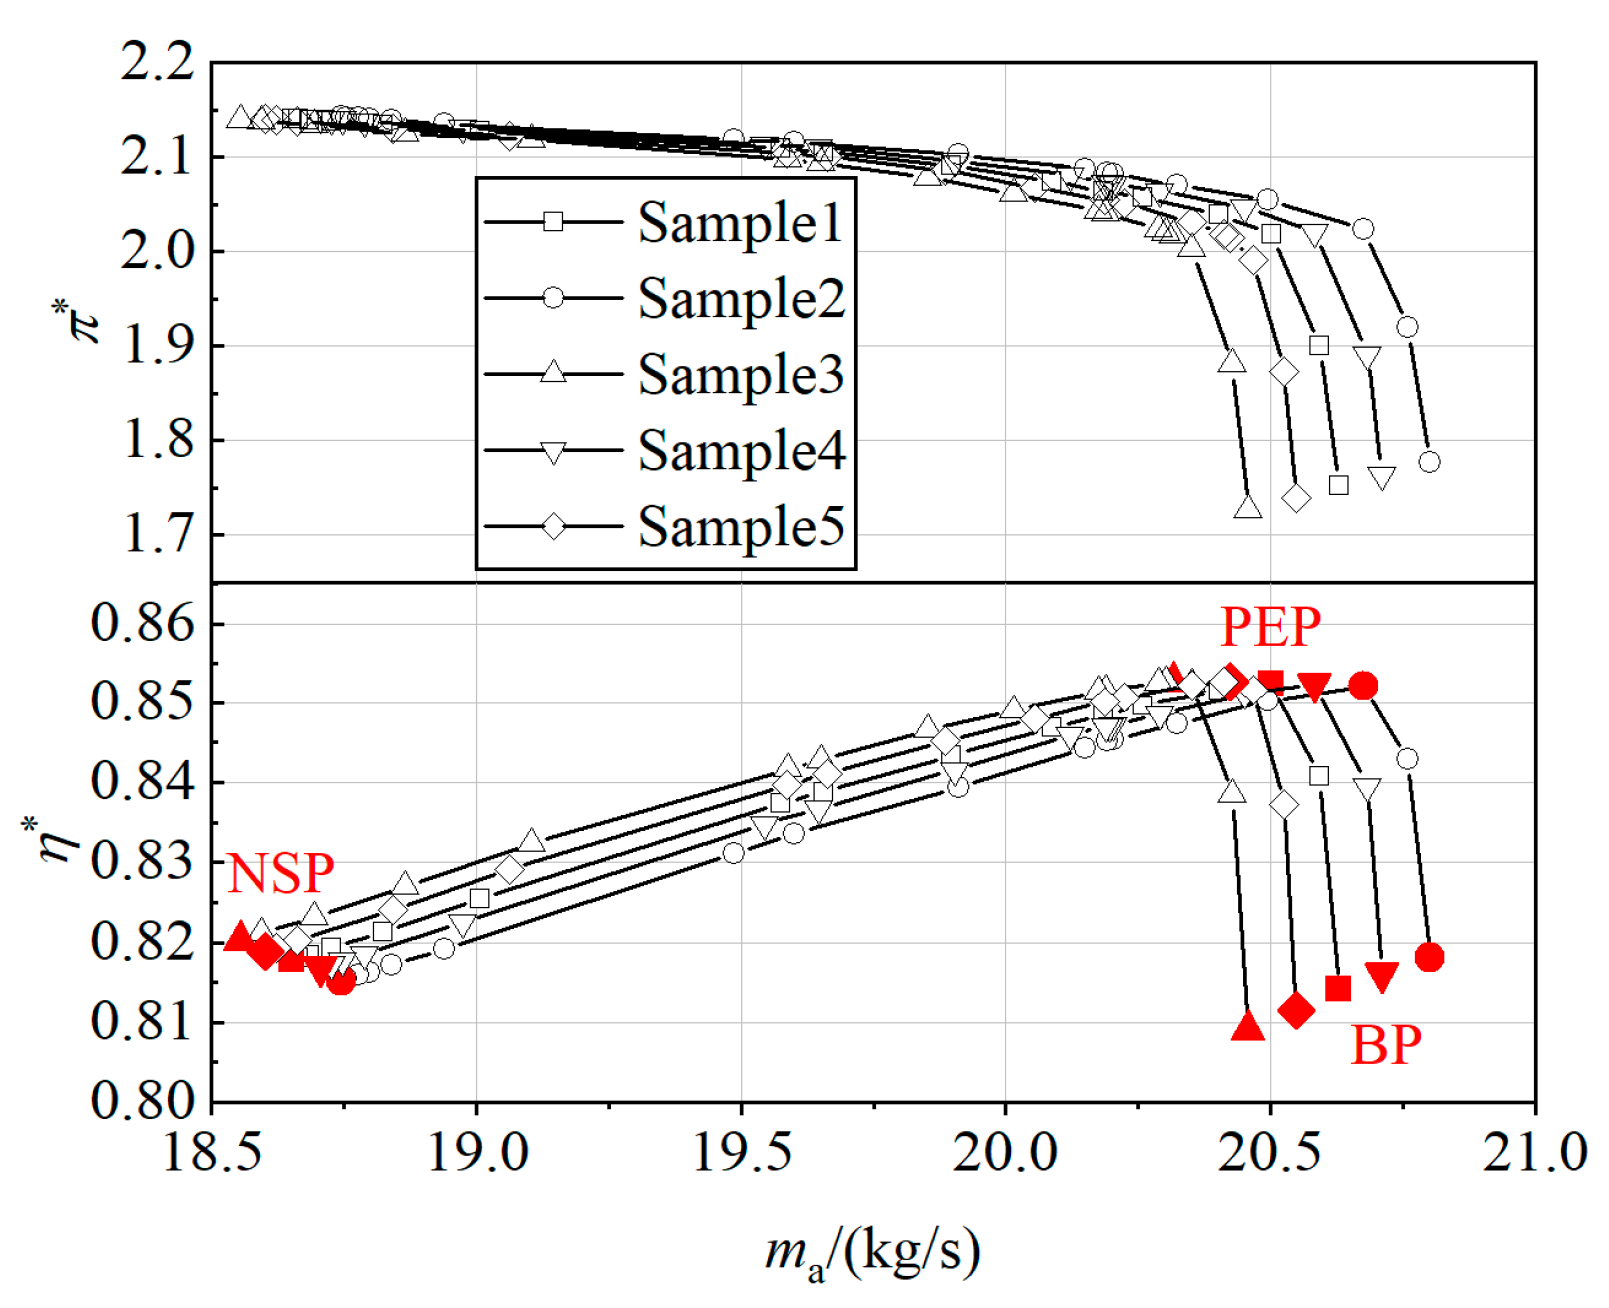
Rotor37 characteristic curves with twist angle errors at the integral nodes are illustrated in Figure 7. It is evident that the mass flow rate, total pressure ratio, and isentropic efficiency at the typical conditions (NSP, PEP, and BP) exhibit fluctuations, and the compressor characteristic curves shift as a whole, influenced by twist angle errors.
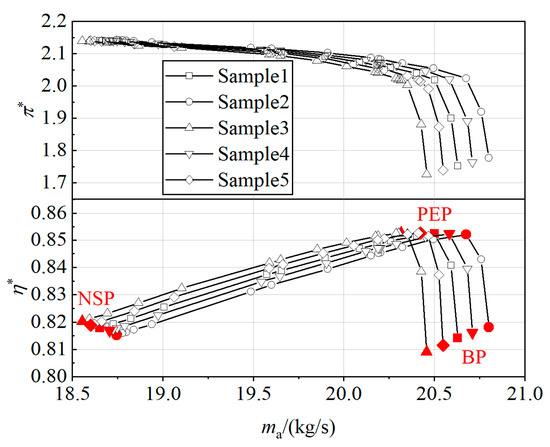
Figure 7.
Rotor37 characteristic curves with twist angle errors at the integration node.
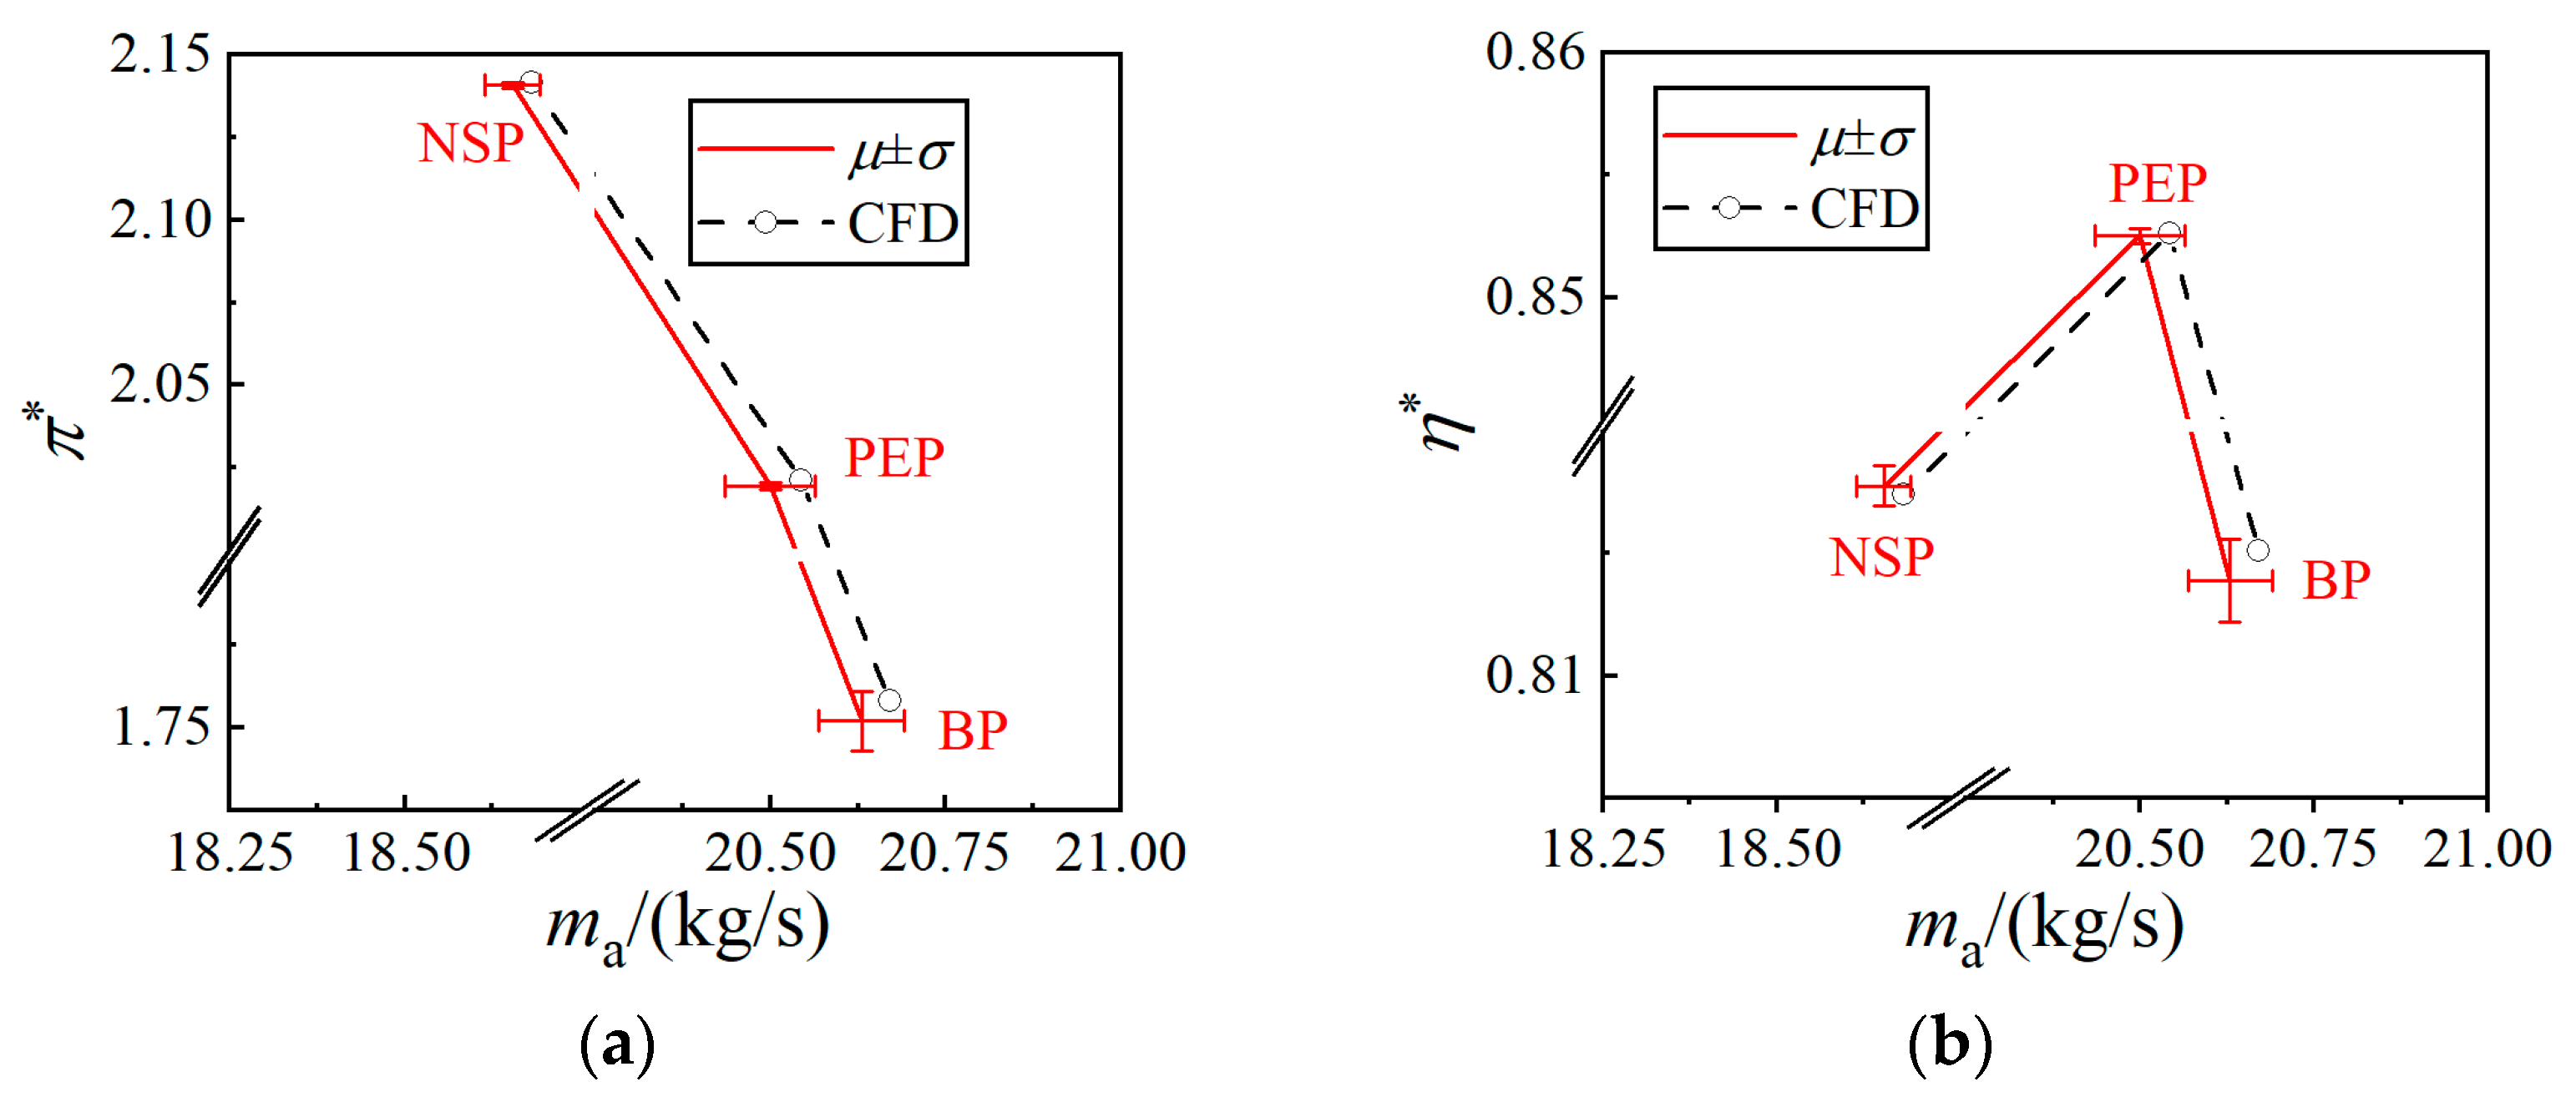
The mean and standard deviation of aerodynamic performance parameters at the typical conditions are calculated according to Equations (10) and (11), as shown in Figure 8. It can be found that under the influence of twist angle errors, the mean mass flow rate at each condition moves to the left compared with the nominal value. Concerning the standard deviation, the mass flow rate at PEP is most significantly affected by twist angle errors, resulting in a wider fluctuation range.
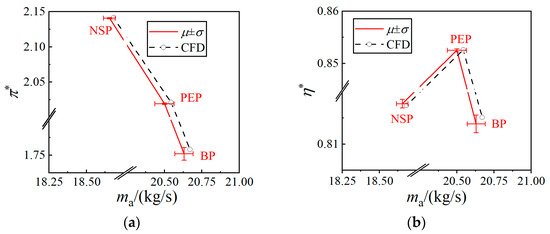
Figure 8.
Mean plus standard deviation of aerodynamic performance parameters at the typical conditions (μ ± σ). (a) Total pressure ratio; (b) Isentropic efficiency.
Considering performance parameters, the mean values of the total pressure ratio and isentropic efficiency are almost lower than the nominal values, with the NSP and PEP exhibiting the smallest standard deviations for these two performance parameters, respectively. Conversely, the maximum standard deviation occurs at BP, indicating a reduction in the aerodynamic performance robustness due to the influence of twist angle errors.
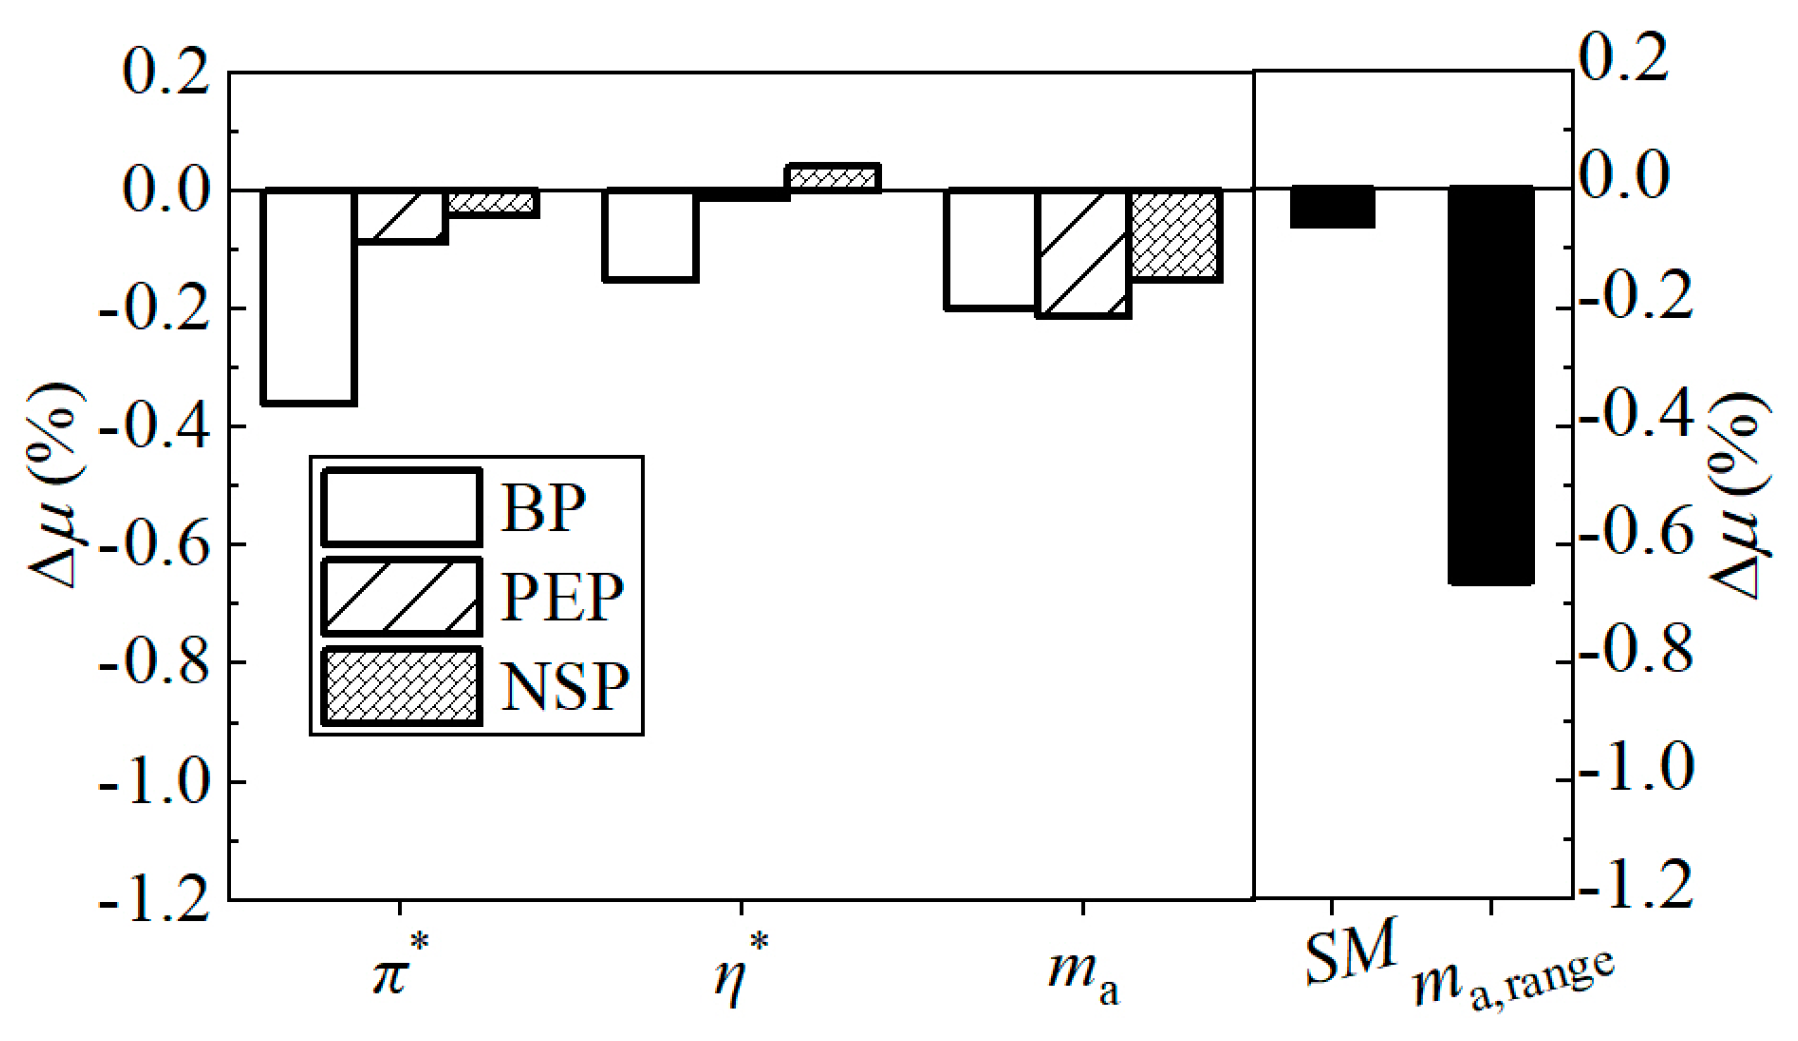
To provide a detailed influence of the radial systematic deviation of twist angle errors, the variation Δμ is calculated according to Equation (12), presented in Figure 9. As shown in Figure 9, due to the under-deflection systematic deviation of the compressor blades along the radial direction, the mean mass flow rate of the machined compressor at the typical conditions is reduced by about 0.2%. This results in an overall leftward shift in the compressor characteristic curve, as depicted in Figure 8. In addition, the mean values of the total pressure ratio and isentropic efficiency are lower than the nominal values, which indicates that the under-deflection systematic deviation of twist angle errors results in a reduction in engine thrust. When considering specific operating conditions, it becomes evident that the twist angle error has the most significant influence on the performance at BP, leading to a decrease in the total pressure ratio of approximately 0.36%. From a perspective focused on performance parameters, we can observe that the influence of the under-deflection systematic deviation on the total pressure ratio is greater than that of isentropic efficiency.
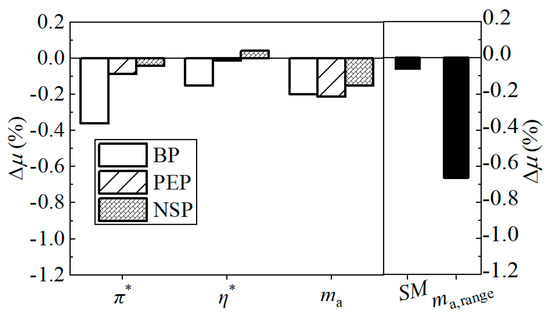
Figure 9.
Variation in the mean value relative to the nominal value (Δμ).
Additionally, as depicted in Figure 9, the mean value of the compressor stability margin is slightly smaller than the nominal value. This is primarily a consequence of the declining trends observed in the mass flow rate and total pressure ratio at NSP and PEP. Moreover, due to the larger reduction in the mean mass flow rate at BP compared with that at NSP, the mean value of the operating flow range (as defined in Equation (15)) experiences a significant decrease when compared with the nominal value.
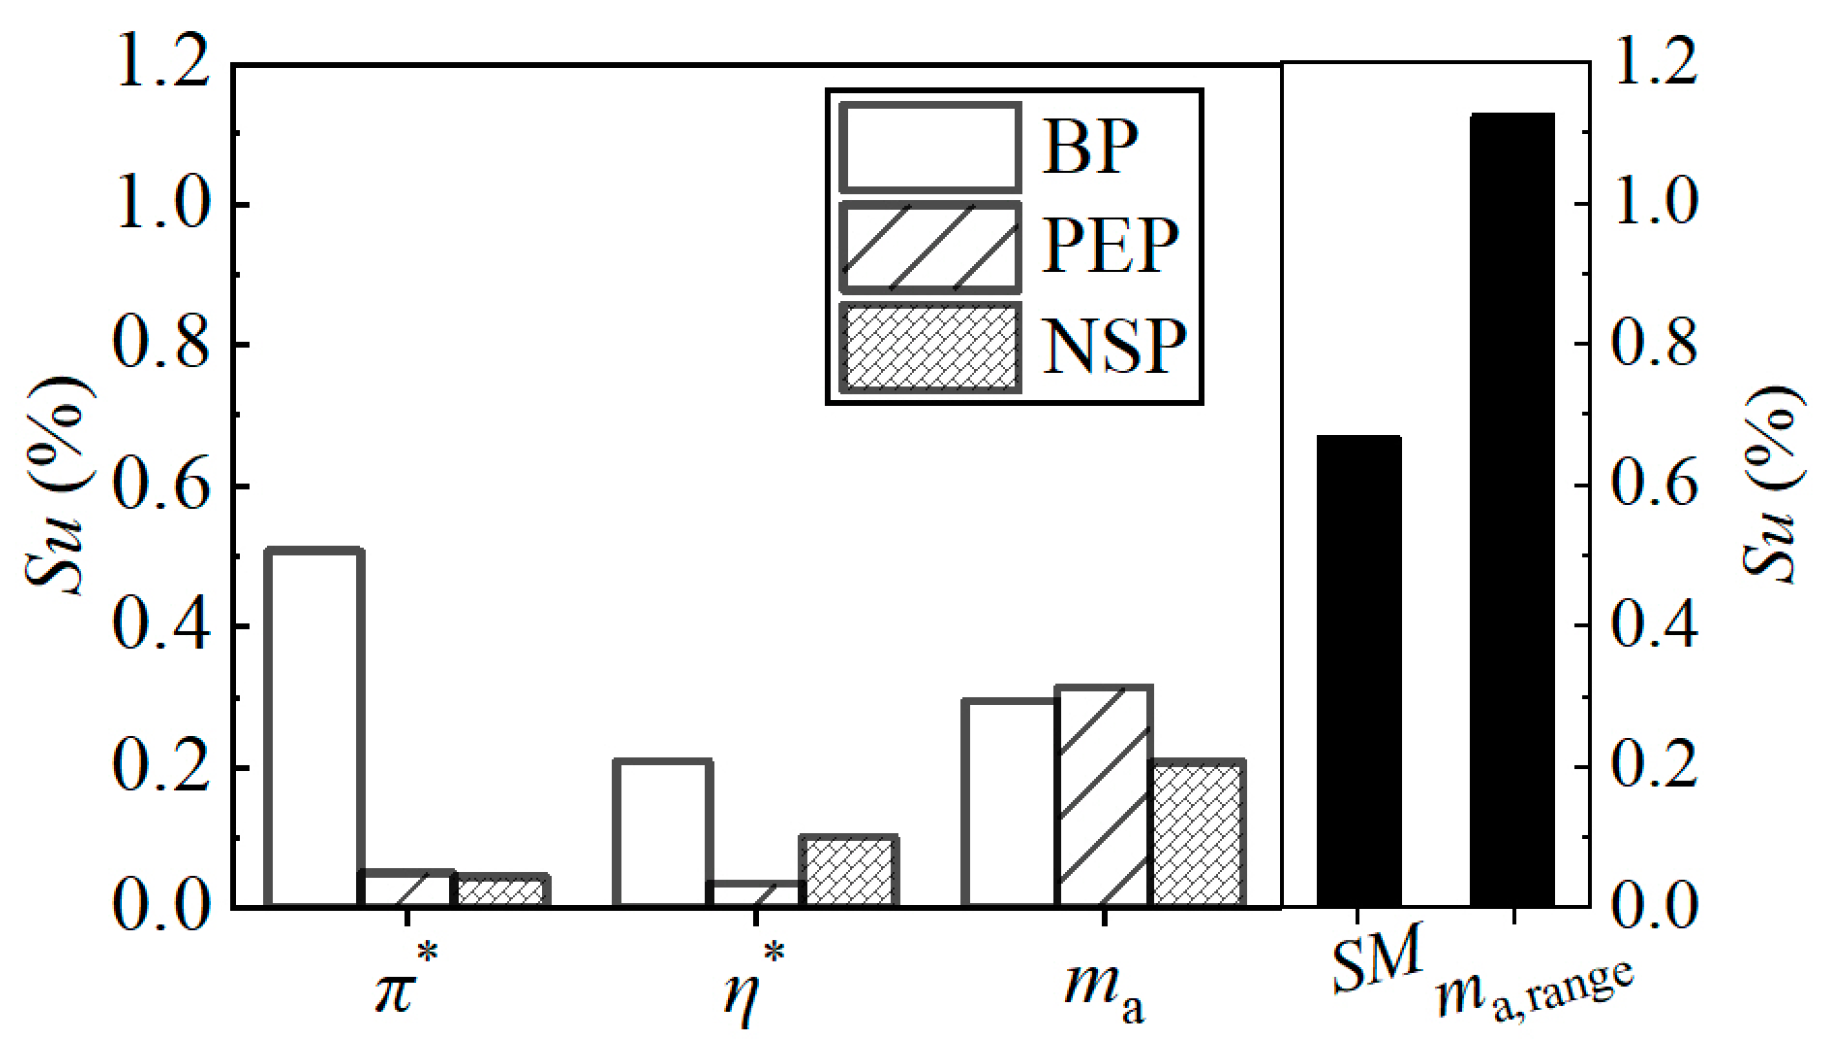
The sensitivity Su of Rotor37’s aerodynamic performance parameters is calculated according to Equation (13). The results are given in Figure 10. Figure 10 indicates that the BP displays the highest sensitivity among the three typical conditions, suggesting a weak robustness in aerodynamic performance in response to twist angle errors. Therefore, the compressor should be avoided from operating at this condition. Additionally, the mass flow rate is more sensitive than other performance parameters at NSP and PEP. Moreover, as depicted in Figure 10, when concerning the combined influence of the mass flow rate and total pressure ratio, the stability margin and operating flow range of the compressor are more sensitive than the other parameters, and the sensitivity is greater up to an order of magnitude. Consequently, the influence of twist angle errors on the safe and stable operation of the compressor should be acknowledged.
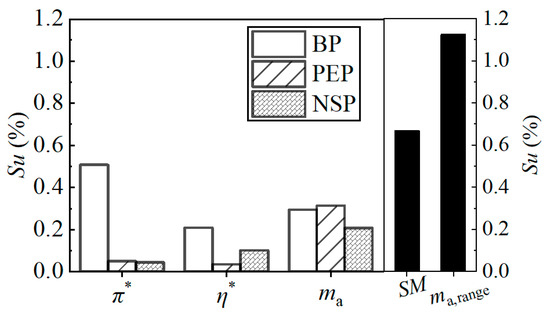
Figure 10.
Sensitivity (Su).
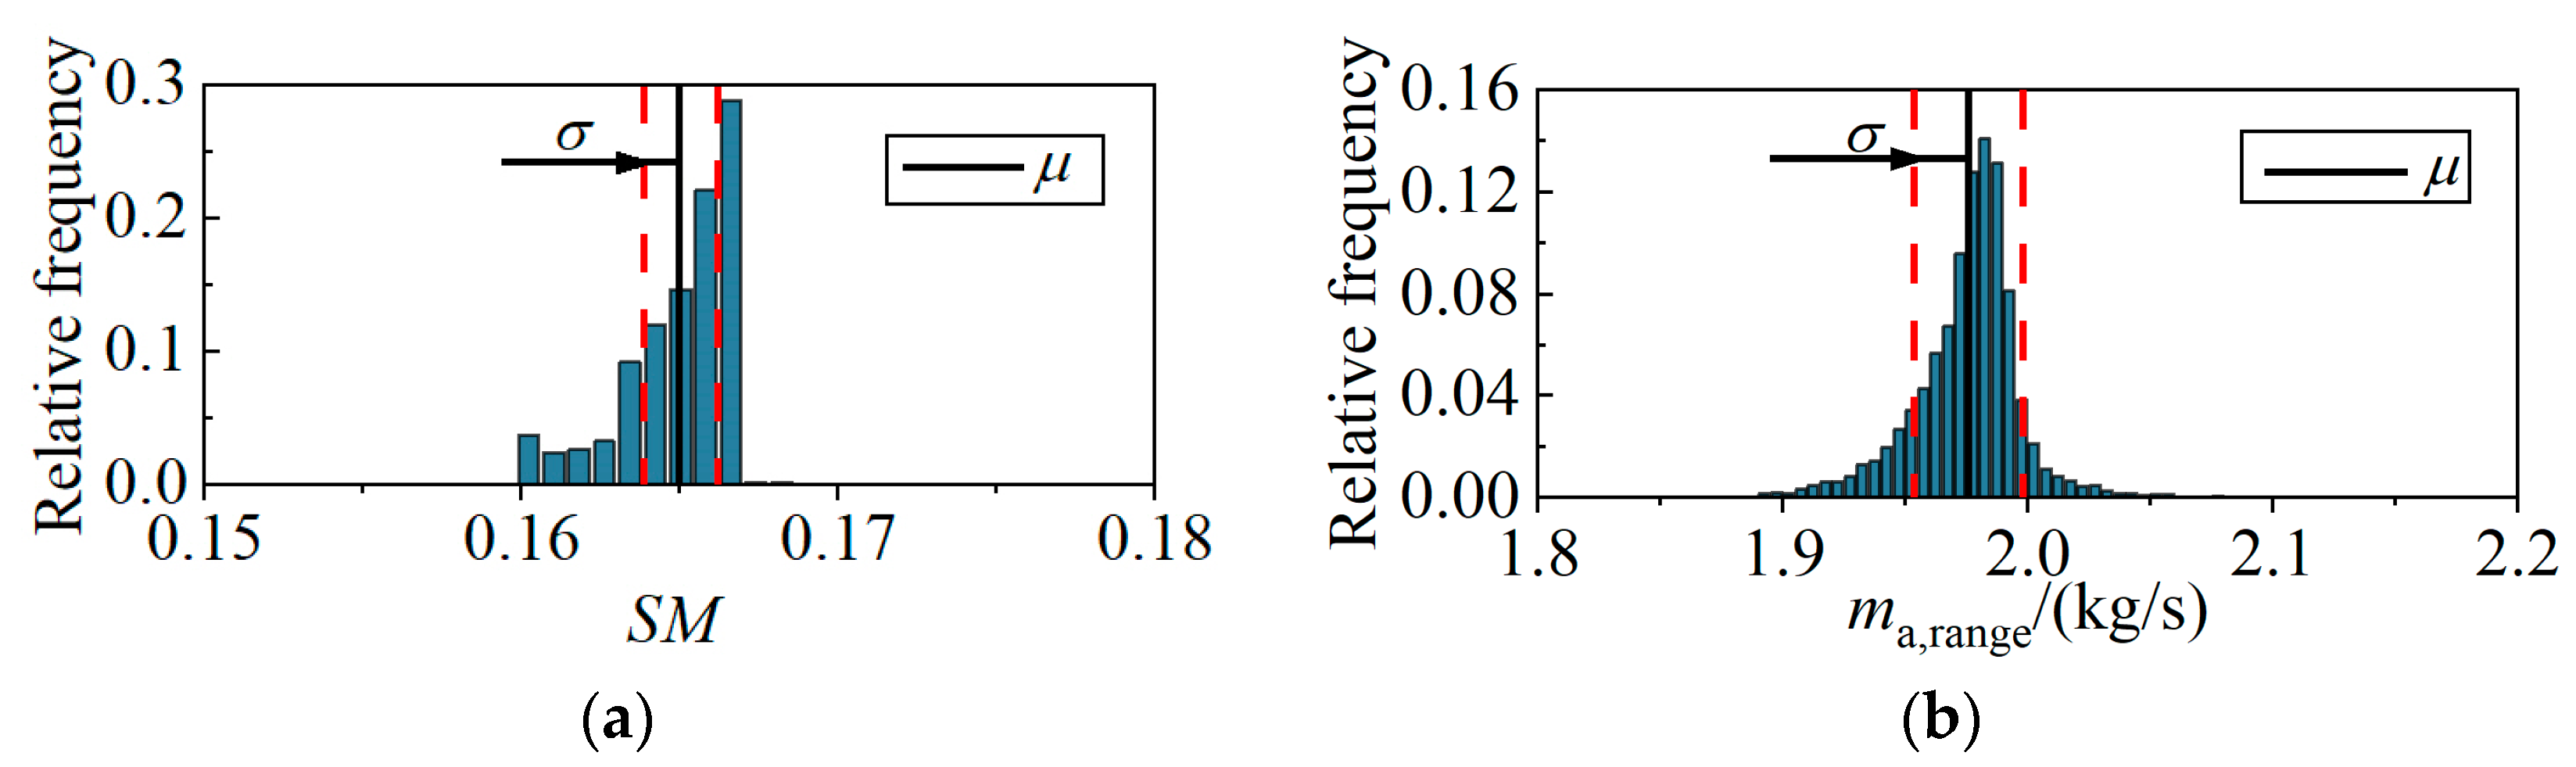
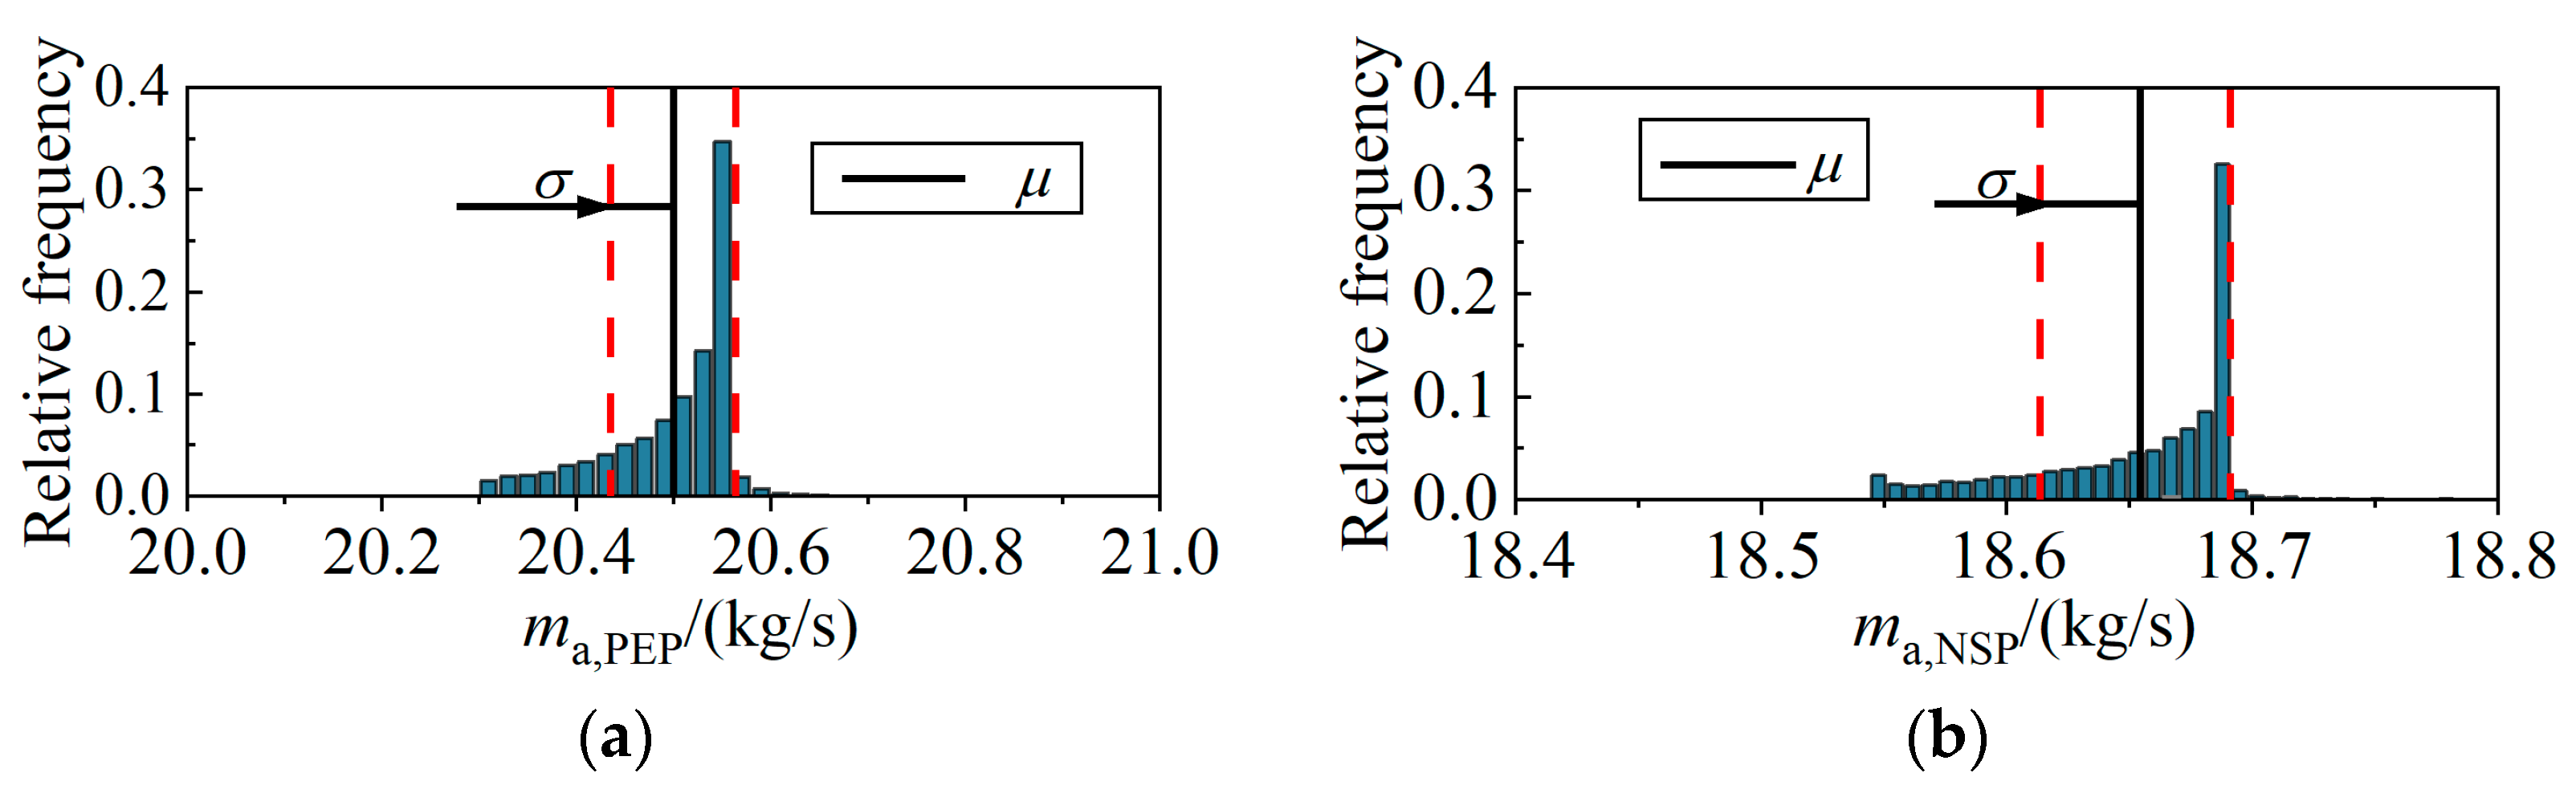
Based on the analysis above, it is evident that the stable operating range of the compressor is more sensitive to the radial twist angle errors, and the mass flow rate at NSP and PEP is also more sensitive than the total pressure ratio and isentropic efficiency. Therefore, according to Equation (6), the MC of Nall = 10,000 samples is performed to obtain the frequency histogram of the above parameters to visually display the output distribution of the system. As shown in Figure 11 and Figure 12, unlike the symmetrical Gaussian distribution of the system input, the frequency of each parameter shows a “peak” and “asymmetric” shape.

Figure 11.
Frequency histogram of stable operating range. (a) SM; (b) ma,range.
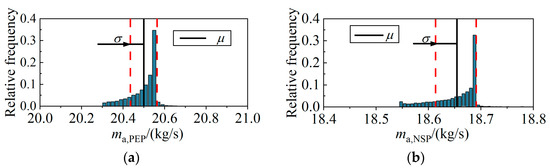
Figure 12.
Frequency histogram of mass flow rate. (a) PEP; (b) NSP.
Furthermore, it can be observed from Figure 11 and Figure 12 that there are more samples in the range on the left side of μ–σ, indicating that there are more samples on the left side deviating a greater extent from the mean value on the left side. Additionally, the mean value is smaller than the nominal, indicating that when the compressor is operating, due to the uncertainty of the radial twist angle errors, the stability margin, operating flow range, and mass flow rate are more likely to be lower than the nominal value, thereby increasing risk in safe and stable operation.
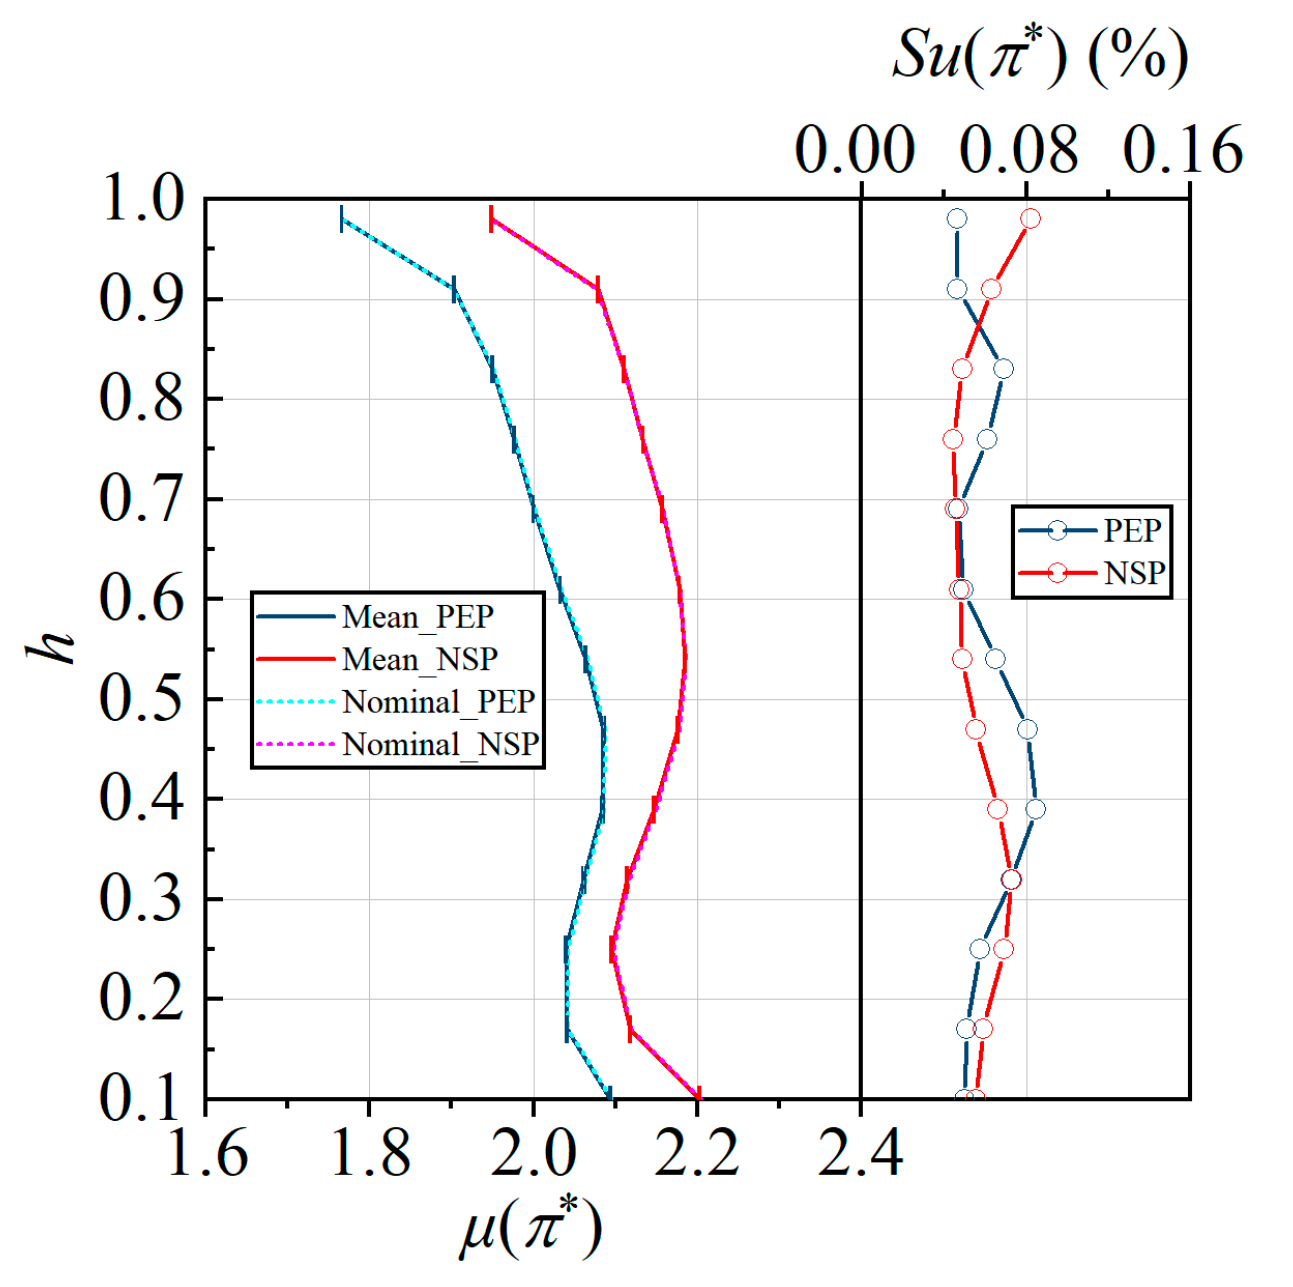
4.2. Distribution of Aerodynamic Performance Along the Radial Direction
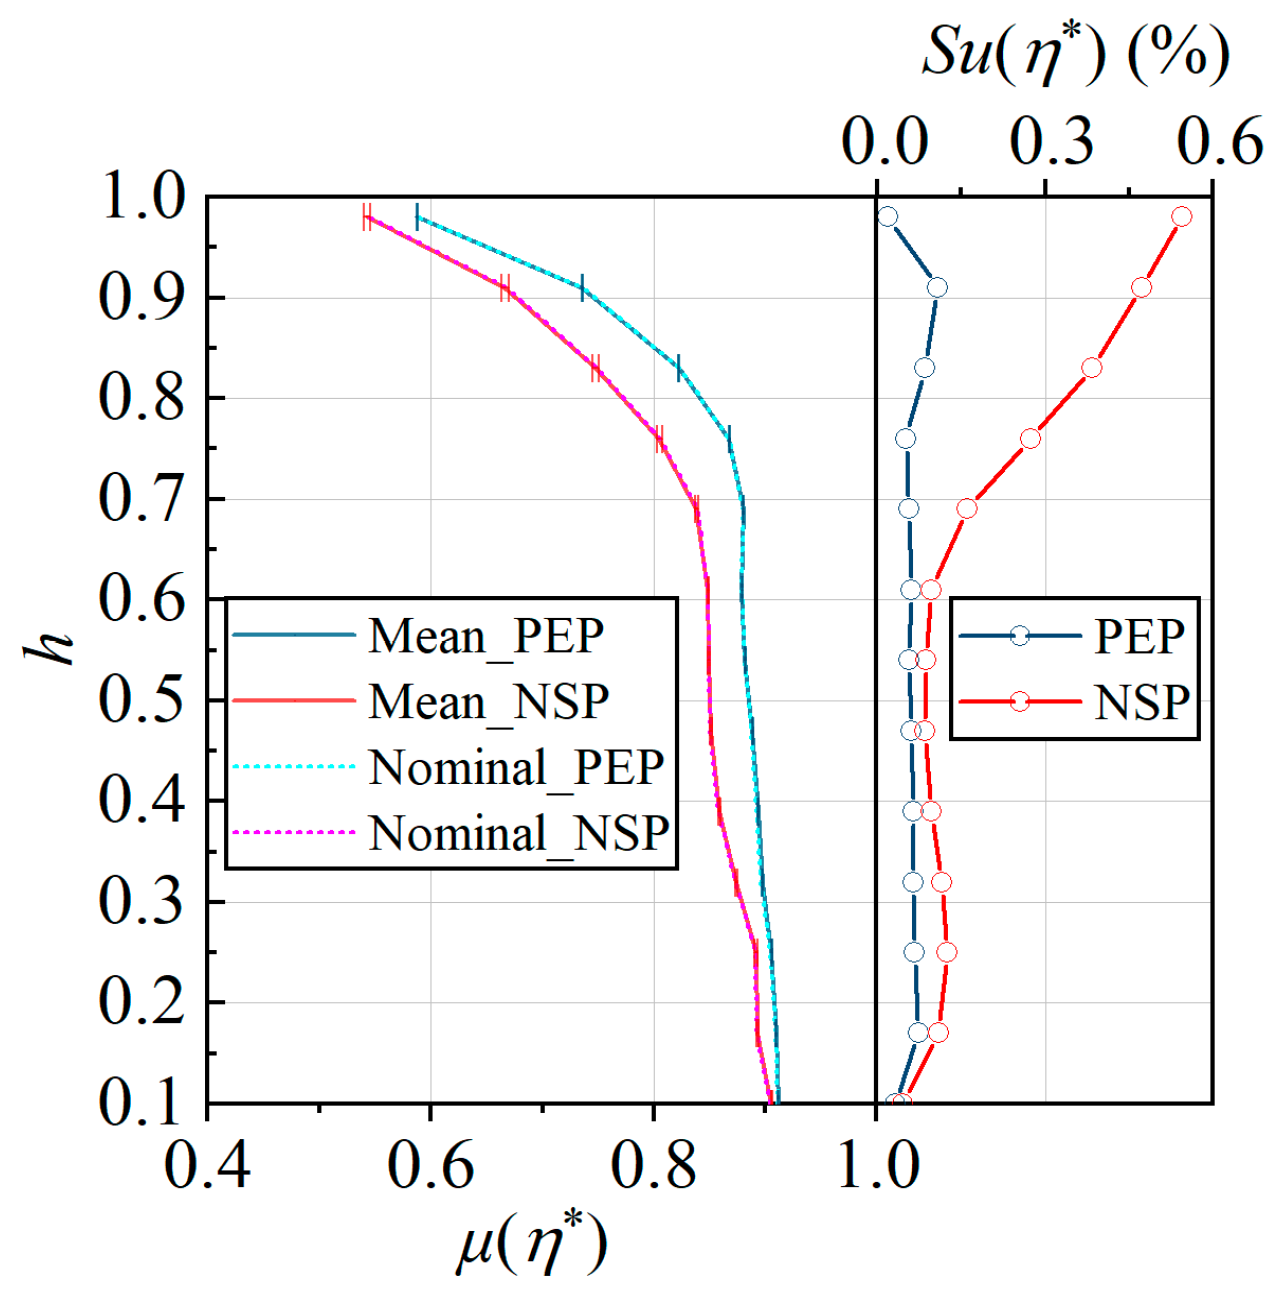
Concerning the influence of the radial twist angle error uncertainty, it is imperative to examine the radial sensitivity of the compressor aerodynamic parameters. Figure 13 and Figure 14 depict the statistical profile of the radial distribution of the total pressure ratio and isentropic efficiency at NSP and PEP, respectively. It can be seen that the mean values of the total pressure ratio and isentropic efficiency at different conditions exhibit consistent trends along the radial direction and closely align with the nominal value distribution. Furthermore, Figure 13 reveals significant fluctuations in the sensitivity of the total pressure ratio at PEP along the radial direction, while the sensitivity near the blade root and tip at NSP is larger than that in the middle region. In Figure 14, the isentropic efficiency sensitivity at PEP tends to approach zero, indicating greater robustness. Meanwhile, in the upper region of the blade at NSP, the sensitivity increases nearly linearly.
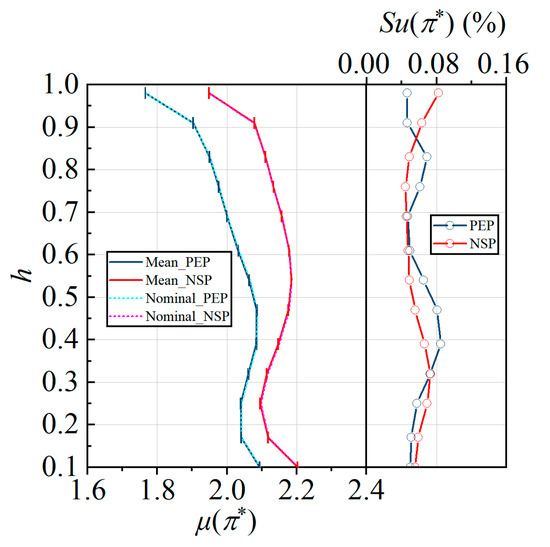
Figure 13.
Statistical profile of total pressure ratio distribution along the radial direction (left: μ ± σ; right: Su).
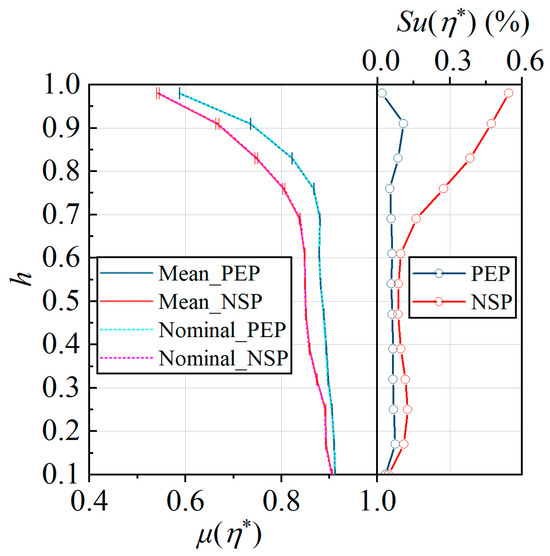
Figure 14.
Statistical profile of isentropic efficiency distribution along the radial direction (left: μ ± σ; right: Su).
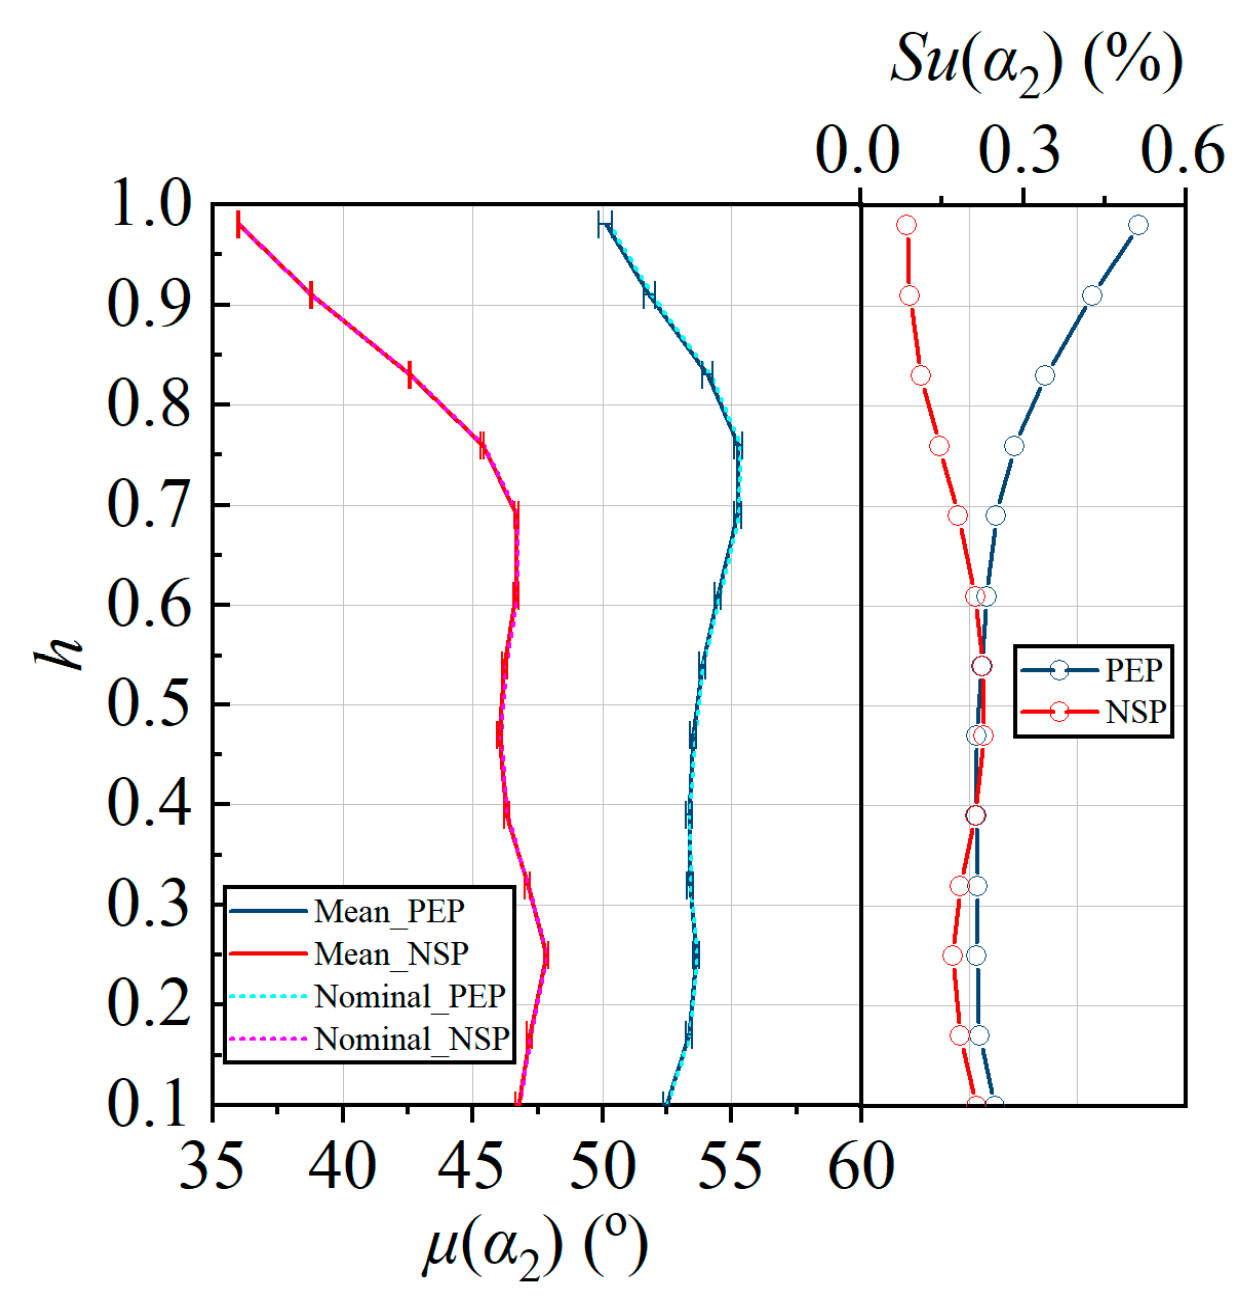
To investigate the impact of the radial twist angle error uncertainty on the performance of the rear stator, we analyze the statistical profile of the outlet airflow angle α2 along the radial direction, defined by Equation (16) as follows:
where v2z,i and v2y,i represent the component of the outlet absolute velocity in the z and y directions at Section i after the circumferential average. The statistical profile along the radial direction is also obtained according to Equations (10)–(13).
As shown in Figure 15, the mean value of the outlet airflow angle at different operating conditions has the same distribution trend along the radial direction, and it also coincides with the nominal value distribution. Meanwhile, the sensitivity of α2 at PEP is greater than that at NSP. Moreover, for NSP, the sensitivity of the outlet airflow angle of the upper blade region increases nearly linearly, where the outlet airflow angle robustness is weak. This may increase the uncertainty in the inlet conditions of the rear stator within this region, potentially affecting its performance.
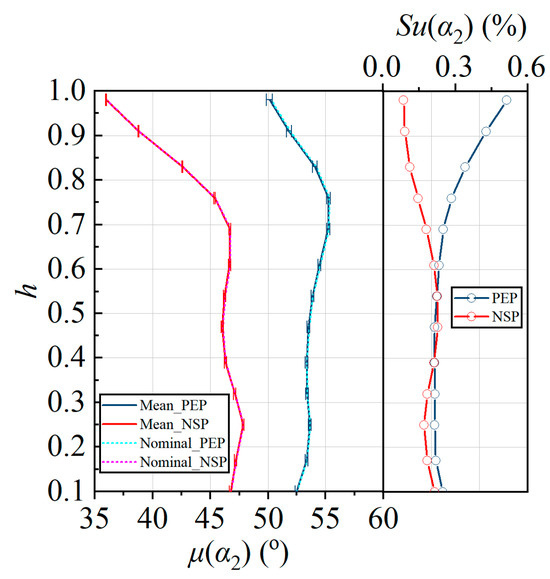
Figure 15.
Statistical profile of outlet airflow angle at the outlet distribution along the radial direction (left: μ ± σ; right: Su).
Overall, the aerodynamic parameters near the blade corner region, especially the blade tip, are more sensitive to the twist angle error uncertainty than the other regions, which is worthy of attention.
4.3. Flow Field Distribution of Different Blade Height Sections
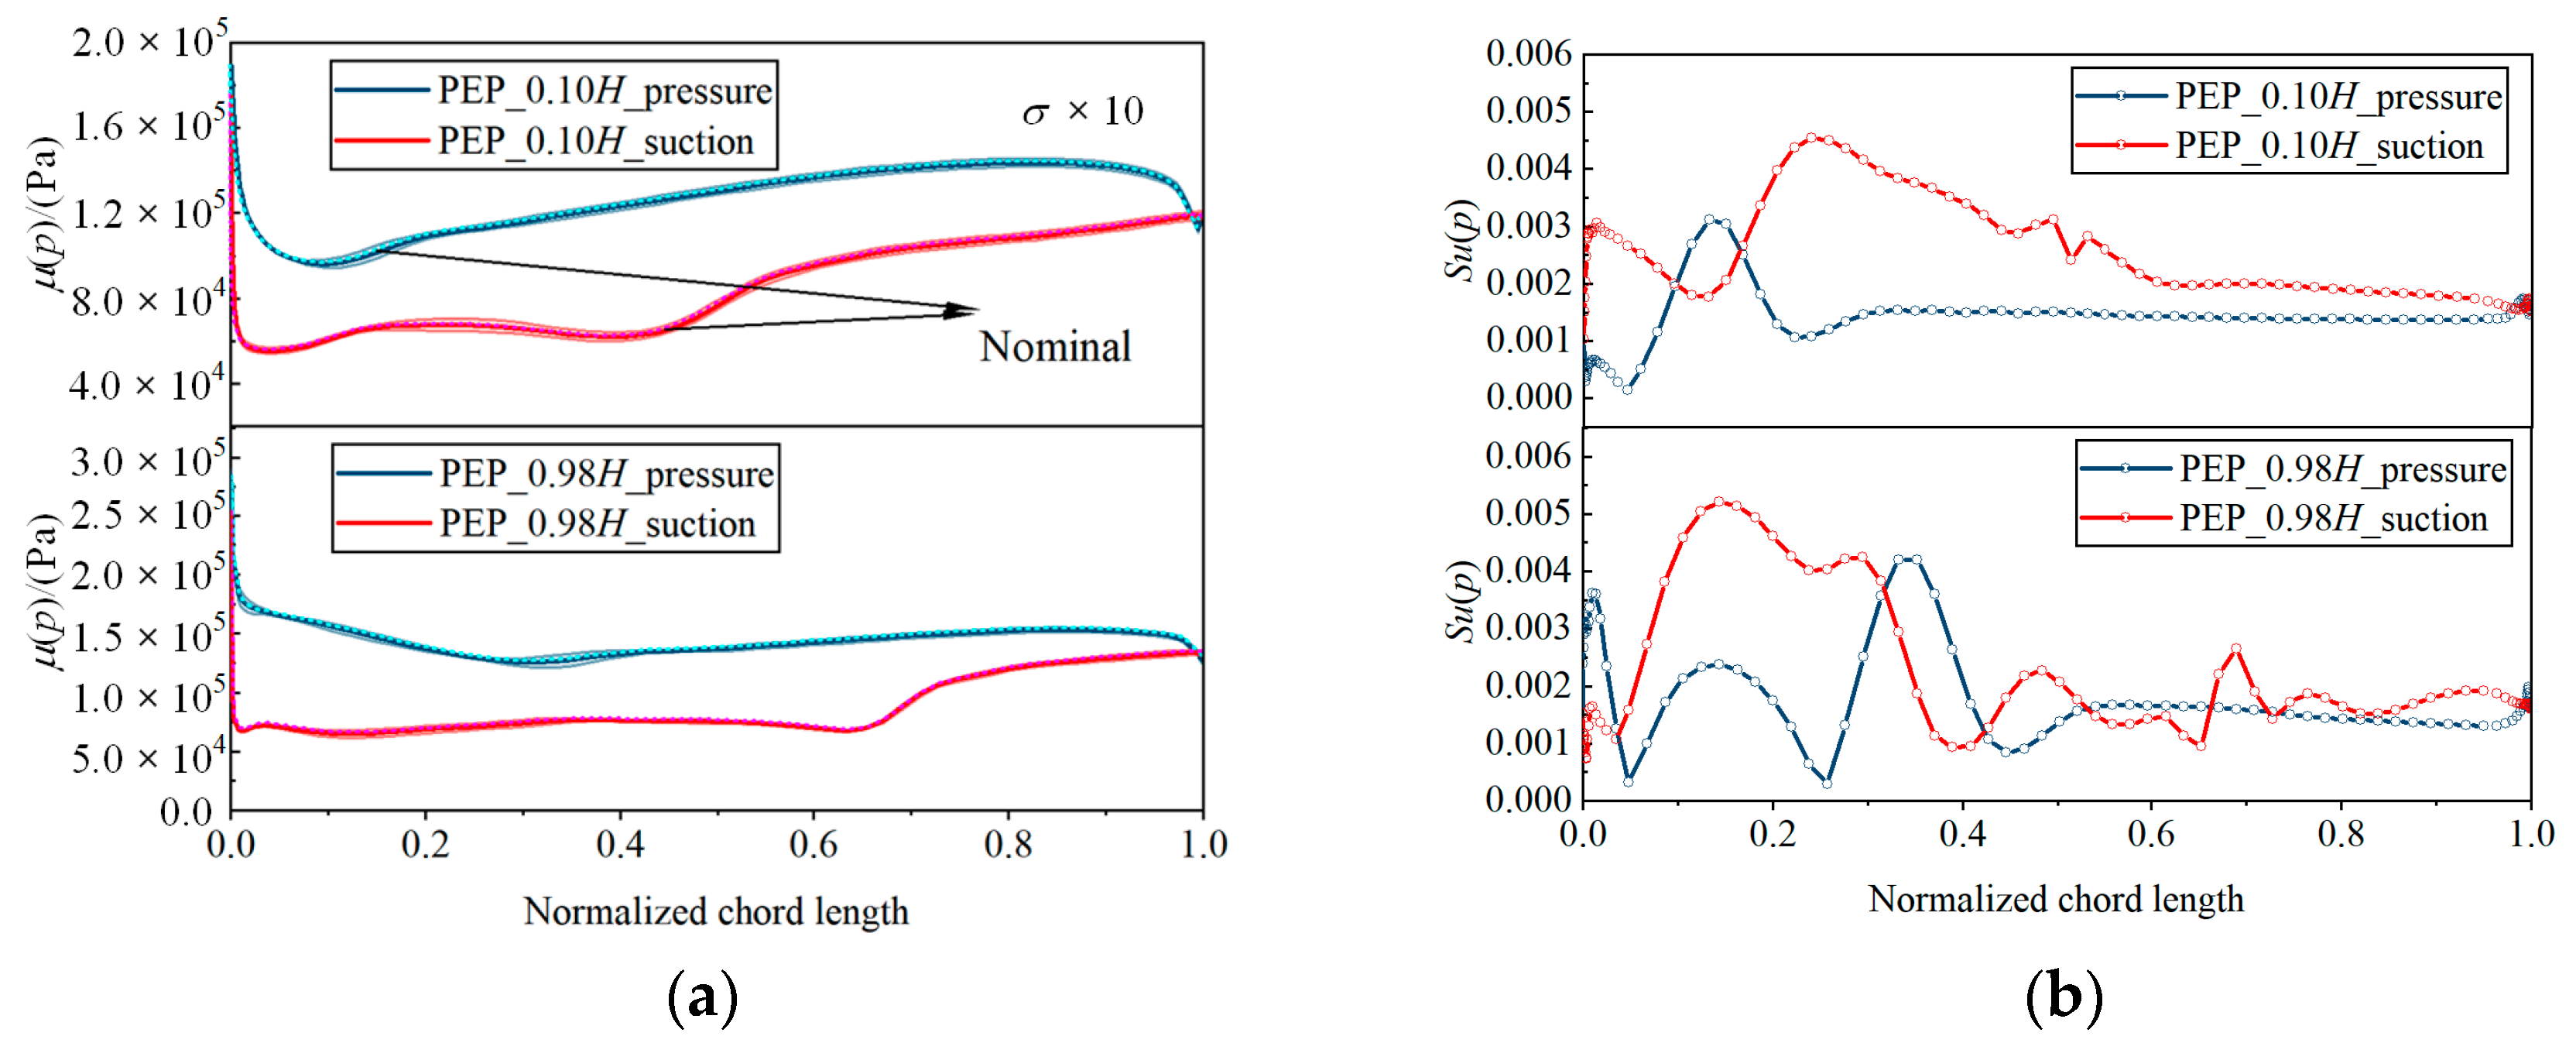
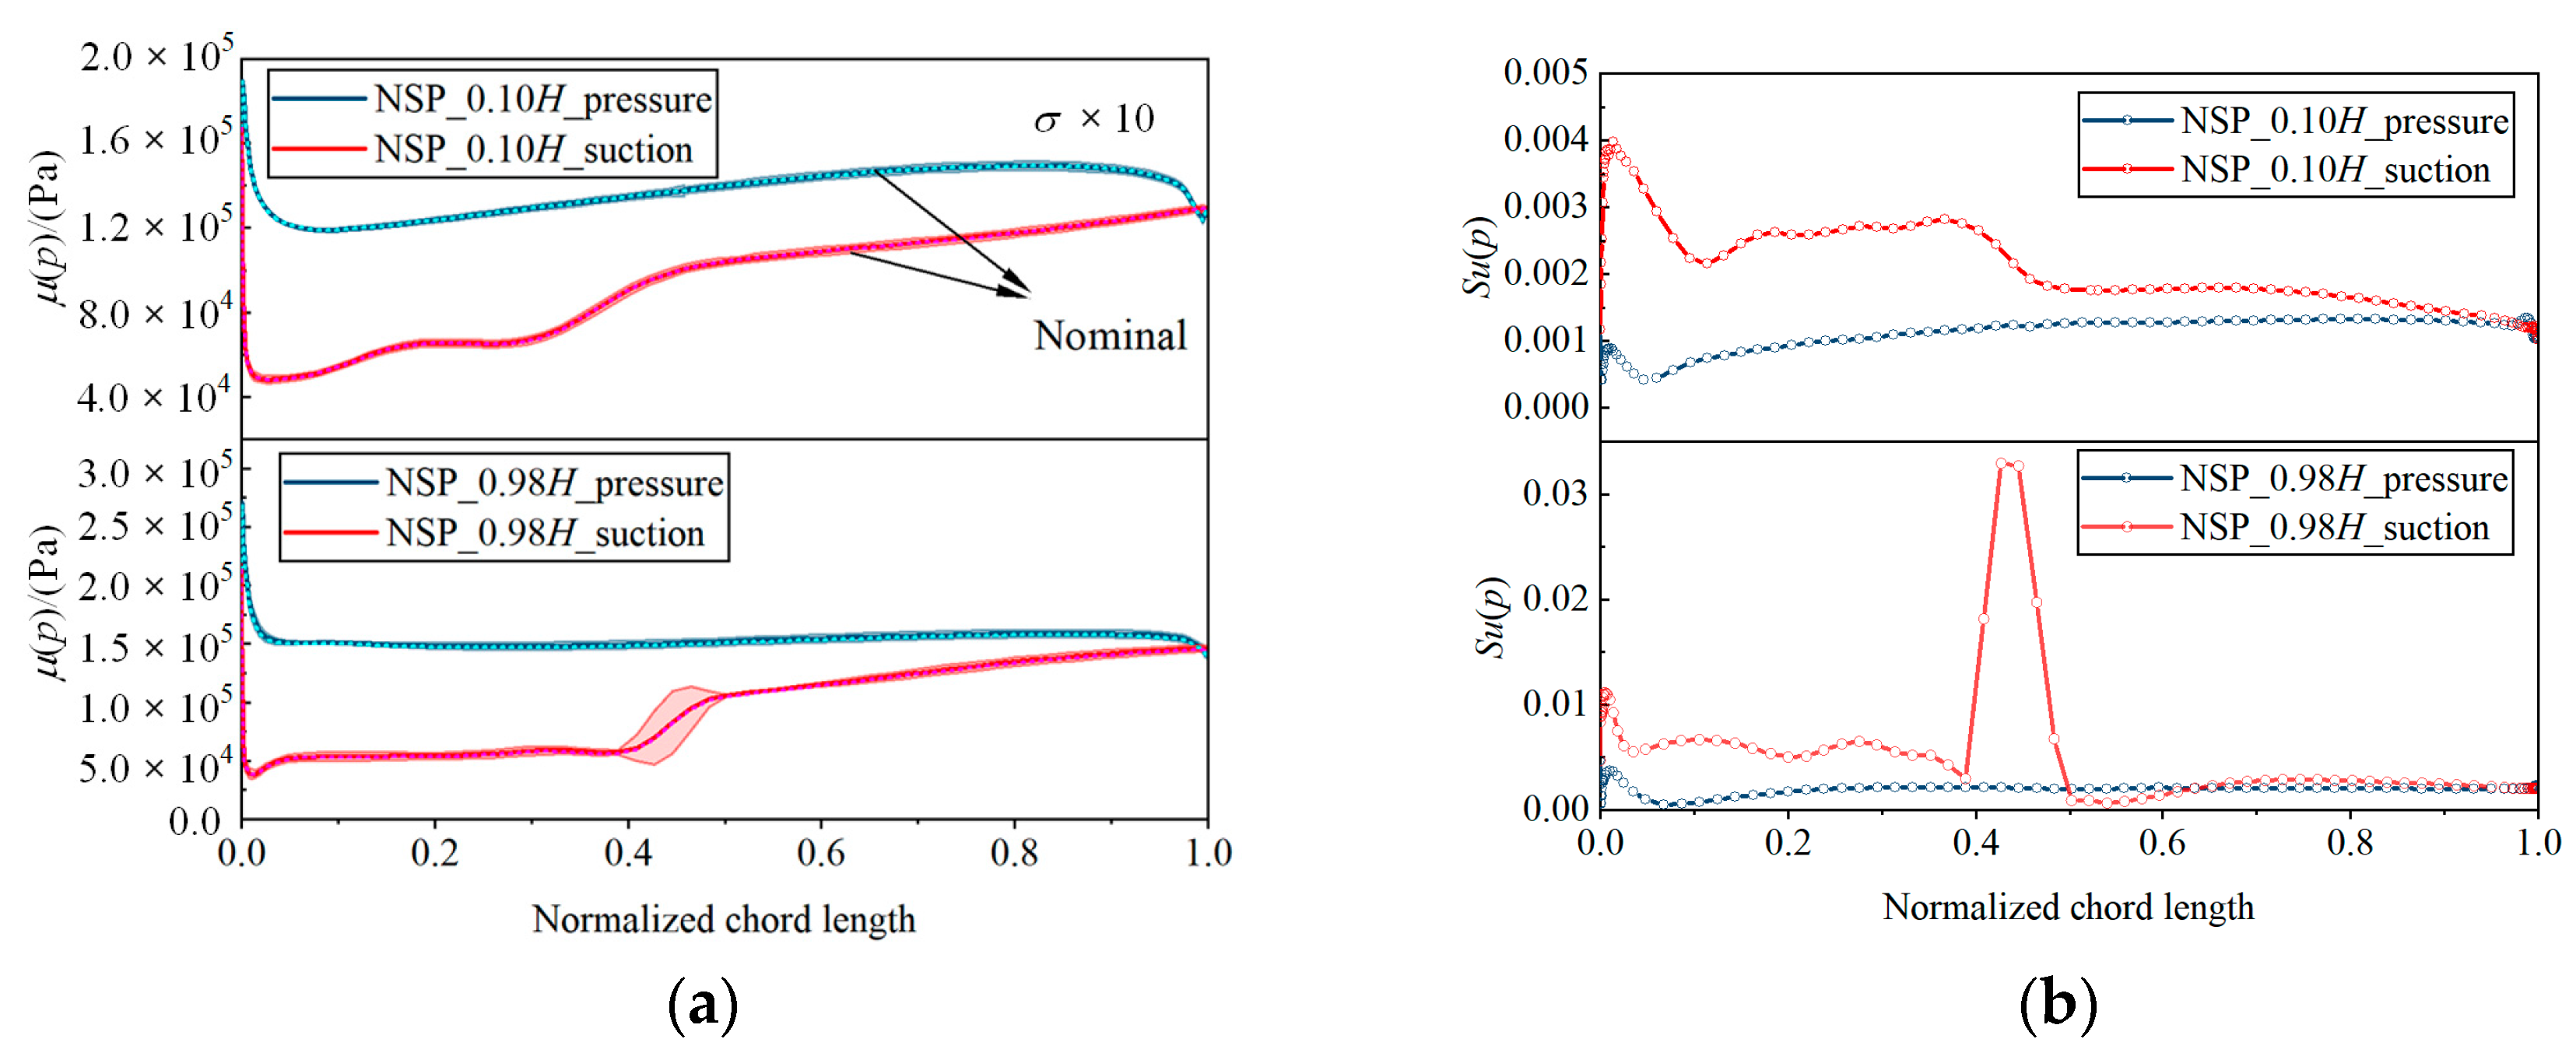
The statistical profile of the static pressure distributions along the chord length of Section 1 (0.10H) and Section 13 (0.98H) at NSP and PEP are depicted in Figure 16 and Figure 17, respectively. with deviations magnified by a factor of 10. From Figure 16a, at PEP, the load of Section 13 is greater than that of Section 1, which decreases significantly after the shock wave occurs. Along the radial direction, the position of the shock wave on the suction surface “moves backward”, and the overall characteristic of shock wave position on the error blades is equivalent to the nominal distribution. It can be observed from Figure 16b that the sensitivity of the static pressure on the suction surface is greater than that on the pressure surface at PEP, with the region from 0 to 0.4 C (C denotes chord length) being more sensitive than other regions. Comparing the static pressure sensitivity of the two sections, it is found that the fluctuation of the section near the tip is more significant, and the maximum value of the section near the tip is larger than that of the section near the root. Additionally, it can be observed from Figure 17b that the static pressure at NSP is more sensitive compared with that at PEP. Meanwhile, the static pressure sensitivity of the shock wave position on the suction surface of the section near the tip is larger, which is nearly an order of magnitude different from that of the blade section near the root. In summary, the flow field of the shock wave in the section near the tip at NSP is significantly affected by twist angle errors.
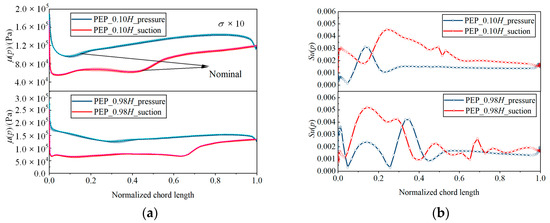
Figure 16.
Statistical profile of static pressure distribution along chord length in different radial sections at PEP. (a) Mean plus 10 times standard deviation (μ ± σ × 10); (b) sensitivity (Su).
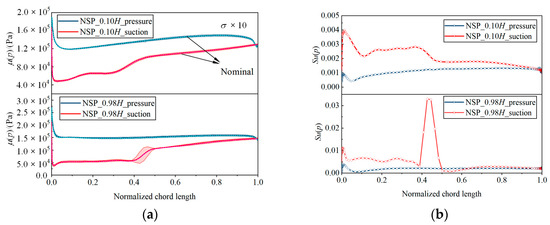
Figure 17.
Statistical profile of static pressure distribution along chord length in different radial sections at NSP. (a) Mean plus 10 times standard deviation (μ ± σ × 10); (b) sensitivity (Su).
5. Conclusions
In this paper, the measured twist angle errors of 13 radial sections of the same type 72 rotor blades were innovatively analyzed and its statistical model was established. The rationality problem of twist angle errors’ statistical distribution has been solved. Moreover, the “dimension disaster” problem has been mitigated by linear regression fitting to reduce the variable dimension. Then, the NIPC method is applied to quantify the influence of the blade radial twist angle error uncertainty on the aerodynamic performance of the compressor’s three-dimensional rotor. The primary conclusions are as follows:
(1) The statistical analysis of the measured radial twist angle errors reveals a gradually increasing W-shaped systematic deviation distribution, primarily of the under-deflection type. The scatter distribution exhibits linearity along the radial direction to reduce the variable from 13 to 1, facilitating uncertainty quantification analysis based on the linear correlation.
(2) Given the under-deflection systematic deviation, the mean values of mass flow, total pressure ratio, and isentropic efficiency at the typical operating conditions are consistently lower than the nominal values, resulting in a reduction in engine thrust. Additionally, the mean value of the operating flow range is the most reduced by about 0.7% compared with the nominal value.
(3) The stability margin and operating range of the compressor exhibit greater sensitivity to twist angle errors’ scatter compared to variations in total pressure ratio and isentropic efficiency, and the sensitivity is greater up to an order of magnitude. The aerodynamic performance of most of the blades with twist angle errors is lower than the nominal value, so the risk of safe and stable operation of the compressor will increase.
(4) The outlet flow angle of the blade upper region at the near-stall condition demonstrates a greater sensitivity to twist angle errors compared with that of the other regions, and the sensitivity exhibits a near-linear increasing trend. Moreover, it is found that the flow field of the shock wave position in the section near the tip at the near-stall condition is significantly affected by twist angle errors while observing the static pressure distribution of different sections.
Author Contributions
Conceptualization, L.G.; validation, Y.D.; formal analysis, Y.D.; investigation, Y.D.; writing—original draft preparation, Y.D.; writing—review and editing, R.L., L.G., Y.H. and H.Y.; supervision, R.L., L.G., Y.H. and H.Y.; funding acquisition, R.L. and L.G. All authors have read and agreed to the published version of the manuscript.
Funding
The authors would like to express appreciation for the support of the National Natural Science Foundation of China under the Grant No. U2241249 and the National Natural Science Foundation of China under the Grant No. 51790512.
Data Availability Statement
The data presented in this study are available on request from the corresponding author.
Conflicts of Interest
Author Yuyang Hao was employed by the company AECC Sichuan Gas Turbine Establishment. The remaining authors declare that the research was conducted in the absence of any commercial or financial relationships that could be construed as a potential conflict of interest.
Glossary
| Nomenclature | |
| a | coefficients of NIPC |
| C | chord length/(mm) |
| h | relative blade height |
| H | blade height/mm |
| i | the number of section |
| j | the term index of NIPC |
| k | the number of sample |
| m | the total uncertain variables number |
| ma | mass flow rate/(kg/s) |
| ma,range | operating flow range/(kg/s) |
| n | the total sample number |
| q | the number of the integral node |
| Q | the term number of NIPC |
| s | order of NIPC |
| Su | sensitivity |
| SM | stability margin |
| v2 | outlet absolute velocity/(m/s) |
| w | weight of polynomial basic function |
| x | integral node of polynomial basic function |
| Y | output of a system |
| Abbreviations | |
| BP | blockage operating point |
| CFD | computational fluid dynamics |
| K-S | Kolmogorov–Smirnov |
| MC | Monte Carlo |
| NIPC | Non-intrusive polynomial chaos |
| NSP | near-stall operating point |
| PEP | peak efficiency operating point |
| S-A | Spalart–Allmaras |
| UQ | uncertainty quantification |
| Greek Symbols | |
| α2 | outflow airflow angle/(°) |
| δ | standard deviation(fitting) |
| Δθ | twist angle error/(°) |
| Δθ | twist angle error at the integral node/(°) |
| η* | isentropic efficiency |
| π* | total pressure ratio |
| μ | mean value |
| θ | stagger angle/(°) |
| σ | standard deviation(real) |
| ψ | polynomial basic function |
| Subscripts | |
| nominal | nominal blade |
| re | relative |
| real | real blade |
| y | y coordinate |
| z | z coordinate |
References
- Zhu, W.; Wang, Z.; Yamazaki, K. Machine tool component error extraction and error compensation by incorporating statistical analysis. Int. J. Mach. Tools Manuf. 2010, 50, 798–806. [Google Scholar] [CrossRef]
- Xu, L.; He, G.H.; Cai, Z.H.; Jia, D.K.; Wang, Z.B. Research on the High-Efficiency and Energy-Saving Cutting of the Aero Engine Fan Blades. Adv. Mater. Res. 2010, 154–155, 273–277. [Google Scholar] [CrossRef]
- Bolotov, M.A.; Pechenin, V.A.; Ruzanov, N.V. Uncertainties in measuring the compressor-blade profile in a gas-turbine engine. Russ. Eng. Res. 2016, 36, 1058–1065. [Google Scholar] [CrossRef]
- Liu, C.; Li, Y.; Shen, W. A real time machining error compensation method based on dynamic features for cutting force induced elastic deformation in flank milling. Mach. Sci. Technol. 2018, 22, 766–786. [Google Scholar] [CrossRef]
- Hou, Y.; Zhang, D.; Mei, J.; Zhang, Y.; Luo, M. Geometric modelling of thin-walled blade based on compensation method of machining error and design intent. J. Manuf. Process. 2019, 44, 327–336. [Google Scholar] [CrossRef]
- Lange, A.; Vogeler, K.; Gu¨mmer, V.; Schrapp, H.; Clemen, C. Introduction of a Parameter Based Compressor Blade Model for Considering Measured Geometry Uncertainties in Numerical Simulation. In Proceedings of the ASME Turbo Expo 2009: Power for Land, Sea, and Air, Orlando, FL, USA, 8–12 June 2009; pp. 1113–1123. [Google Scholar]
- Lange, A.; Voigt, M.; Vogeler, K.; Schrapp, H.; Johann, E.; Gümmer, V. Probabilistic CFD Simulation of a High-Pressure Compressor Stage Taking Manufacturing Variability Into Account. In Proceedings of the ASME Turbo Expo 2010: Power for Land, Sea, and Air, Glasgow, UK, 14–18 June 2010; pp. 617–628. [Google Scholar]
- Reitz, G.; Schlange, S.; Friedrichs, J. Design of experiments and numerical simulation of deteriorated high pressure compressor airfoils. In Proceedings of the ASME Turbo Expo 2016: Turbomachinery Technical Conference and Exposition 2016, Seoul, Republic of Korea, 13–17 June 2016. [Google Scholar]
- Zheng, S. Impact of Manufacturing Tolerance of Compressor Blade on Aerodynamic Performance. Master’s Thesis, Shanghai Jiao Tong University, Shanghai, China, 2019. (In Chinese). [Google Scholar]
- Li, Y.; Chu, W.; Ji, T. Uncertainty research of effect of blade stagger angle deviation on the performance of rotor. J. Xi’an Jiaotong Univ. 2023, 57, 49–59. (In Chinese) [Google Scholar]
- Chu, W.; He, X.; Yang, J.; Liu, K. Effects of blade single and coupling errors on axial flow compressor performance. J. Aerosp. Power 2024, 39, 20220941. (In Chinese) [Google Scholar]
- Cai, Y.; Gao, L.; Ma, C.; Zheng, T. Uncertainty quantification on compressor blade considering manufacturing error based on NIPC method. J. Eng. Thermophys. 2017, 38, 490–497. (In Chinese) [Google Scholar]
- Wang, H.; Gao, L.; Yang, G.; Huang, P.; Tang, K. Influence of manufacturing uncertainty of blunt leading edge on aerodynamic performance of compressor blade. J. Aerosp. Power 2024, 39, 176–186. (In Chinese) [Google Scholar]
- Ma, C.; Gao, L.; Wang, H.; Li, R.; Wu, B. Influence of leading edge with real manufacturing error on aerodynamic performance of high subsonic compressor cascades. Chin. J. Aeronaut. 2021, 34, 220–232. [Google Scholar] [CrossRef]
- Gao, L.; Cai, Y.; Zeng, R.; Tian, L. Effect of blade machining error on compressor cascade aerodynamic performance. J. Propuls. Technol. 2017, 38, 525–531. (In Chinese) [Google Scholar]
- Cao, C.; Li, B.; Zhai, Z.; Qiu, Y. Influence of blade profile and twist angle difference on compressor aerodynamic performance. Sci. Technol. Eng. 2019, 19, 292–298. (In Chinese) [Google Scholar]
- Suriyanarayanan, V.; Rendu, Q.; Vahdati, M.; Salles, L. Effect of Manufacturing Tolerance in Flow Past a Compressor Blade. J. Turbomach. 2021, 144, 041005. [Google Scholar] [CrossRef]
- Shi, M.; Xu, W.; Qin, C.; Xu, Y. Mathematical Statistics; Science Press: Beijing, China, 2015; p. 303. (In Chinese) [Google Scholar]
- Cai, Y. Investigation on the Aerodynamic Performance of Compressor Blade Considering Machining Error and Robust Design of Airfoil. Master’s Thesis, Northwestern Polytechnical University, Xi’an, China, 2017. (In Chinese). [Google Scholar]
- Gao, L.; Ma, C.; Cai, Y. A Robust Blade Design Method based on Non-Intrusive Polynomial Chaos Considering Profile Error. J. Therm. Sci. 2019, 28, 875–885. [Google Scholar] [CrossRef]
- Gao, L.; Ma, C.; Cai, M.; Li, R.; Wang, H.; Yang, G. Influence of uncertain inflow conditions on a subsonic compressor cascade based on wind tunnel experiment. Proc. Inst. Mech. Eng. Part C J. Mech. Eng. Sci. 2022, 236, 8285–8299. [Google Scholar] [CrossRef]
- Reid, L.; Moore, R.D. Design and Overall Performance of Four Highly Loaded, High-Speed Inlet Stages for an Advanced High-Pressure-Ratio Core Compressor. U.S. Patent NASA-TP-1337, 1 October 1978. [Google Scholar]
- Ge, J.; Liu, Y.; Lu, L. Effects of casing temperature boundary condition on performance a transonic rotor. J. Propuls. Technol. 2018, 39, 1486–1493. (In Chinese) [Google Scholar]
- Liu, J.; Zhou, Z. Study of improving surge margin for a supersonic compressor stage. J. Propuls. Technol. 2019, 40, 1780–1791. (In Chinese) [Google Scholar]
- Gao, L.; Li, X.; Feng, X.; Liu, B. The effect of tip clearance on the performance of contra-rotating compressor. In Proceedings of the ASME Turbo Expo 2012: Turbine Technical Conference and Exposition 2012, Copenhagen, Denmark, 11–15 June 2012; pp. 197–206. [Google Scholar]
- Dan, Y.; Wang, H.; Gao, L.; Huang, P.; Tang, K. Effects of twist angle error on transonic compressor blades performance. J. Propuls. Technol. 2023, 44, 89–96. (In Chinese) [Google Scholar]
Disclaimer/Publisher’s Note: The statements, opinions and data contained in all publications are solely those of the individual author(s) and contributor(s) and not of MDPI and/or the editor(s). MDPI and/or the editor(s) disclaim responsibility for any injury to people or property resulting from any ideas, methods, instructions or products referred to in the content. |
© 2024 by the authors. Licensee MDPI, Basel, Switzerland. This article is an open access article distributed under the terms and conditions of the Creative Commons Attribution (CC BY) license (https://creativecommons.org/licenses/by/4.0/).