
Influence of Herringbone Grooves Inspired by Bird Feathers on Aerodynamics of Compressor Cascade under Different Reynolds Number Conditions

Abstract
:1. Introduction
2. Methodology
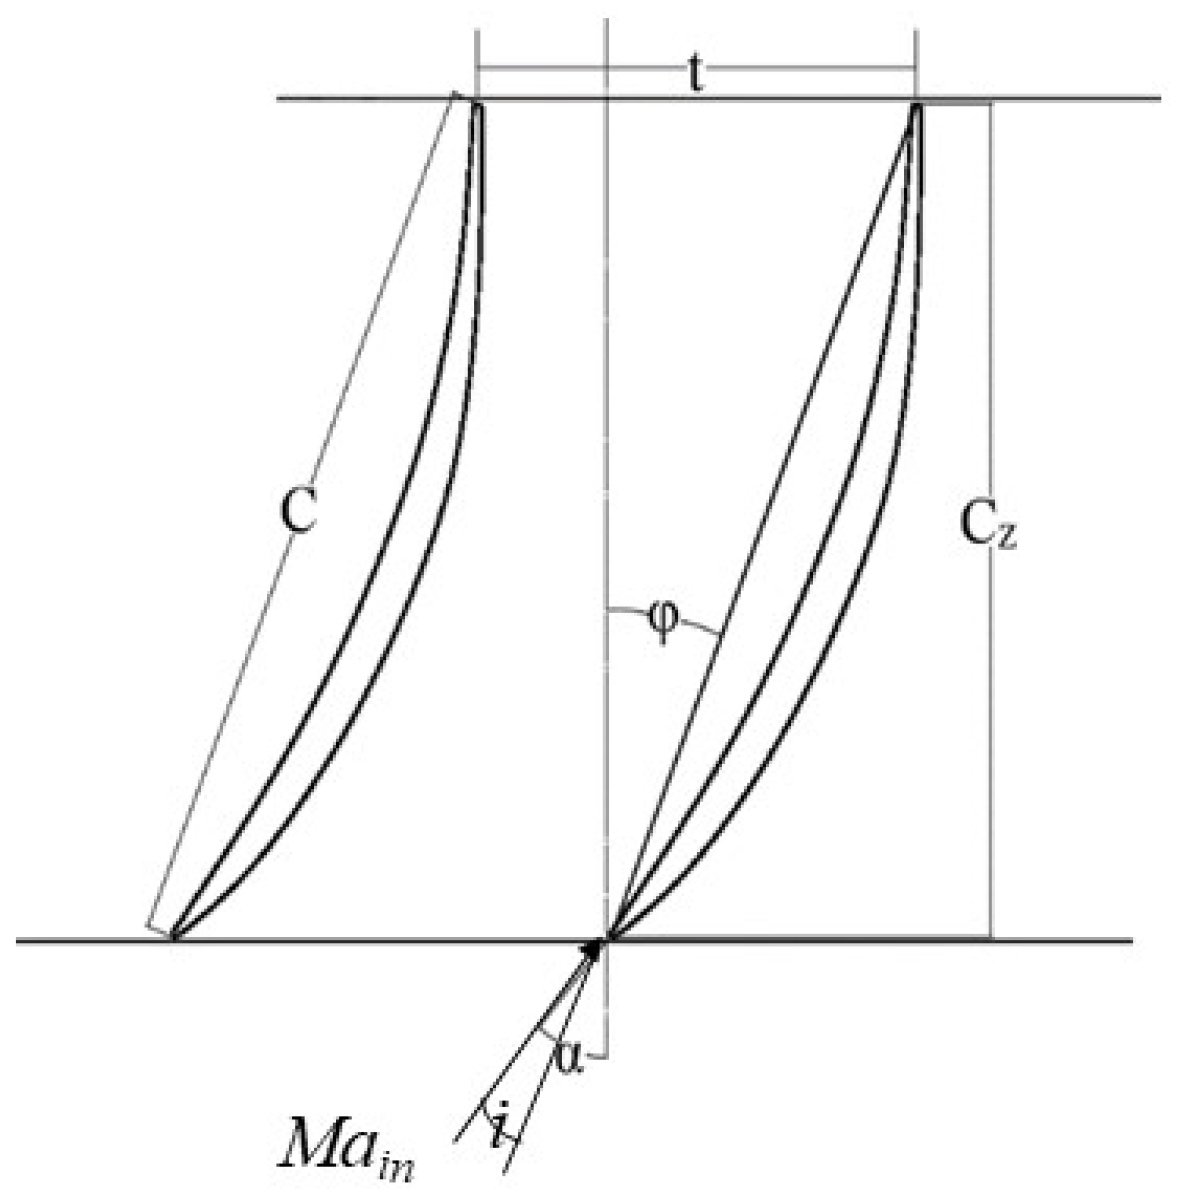
2.1. Research Object
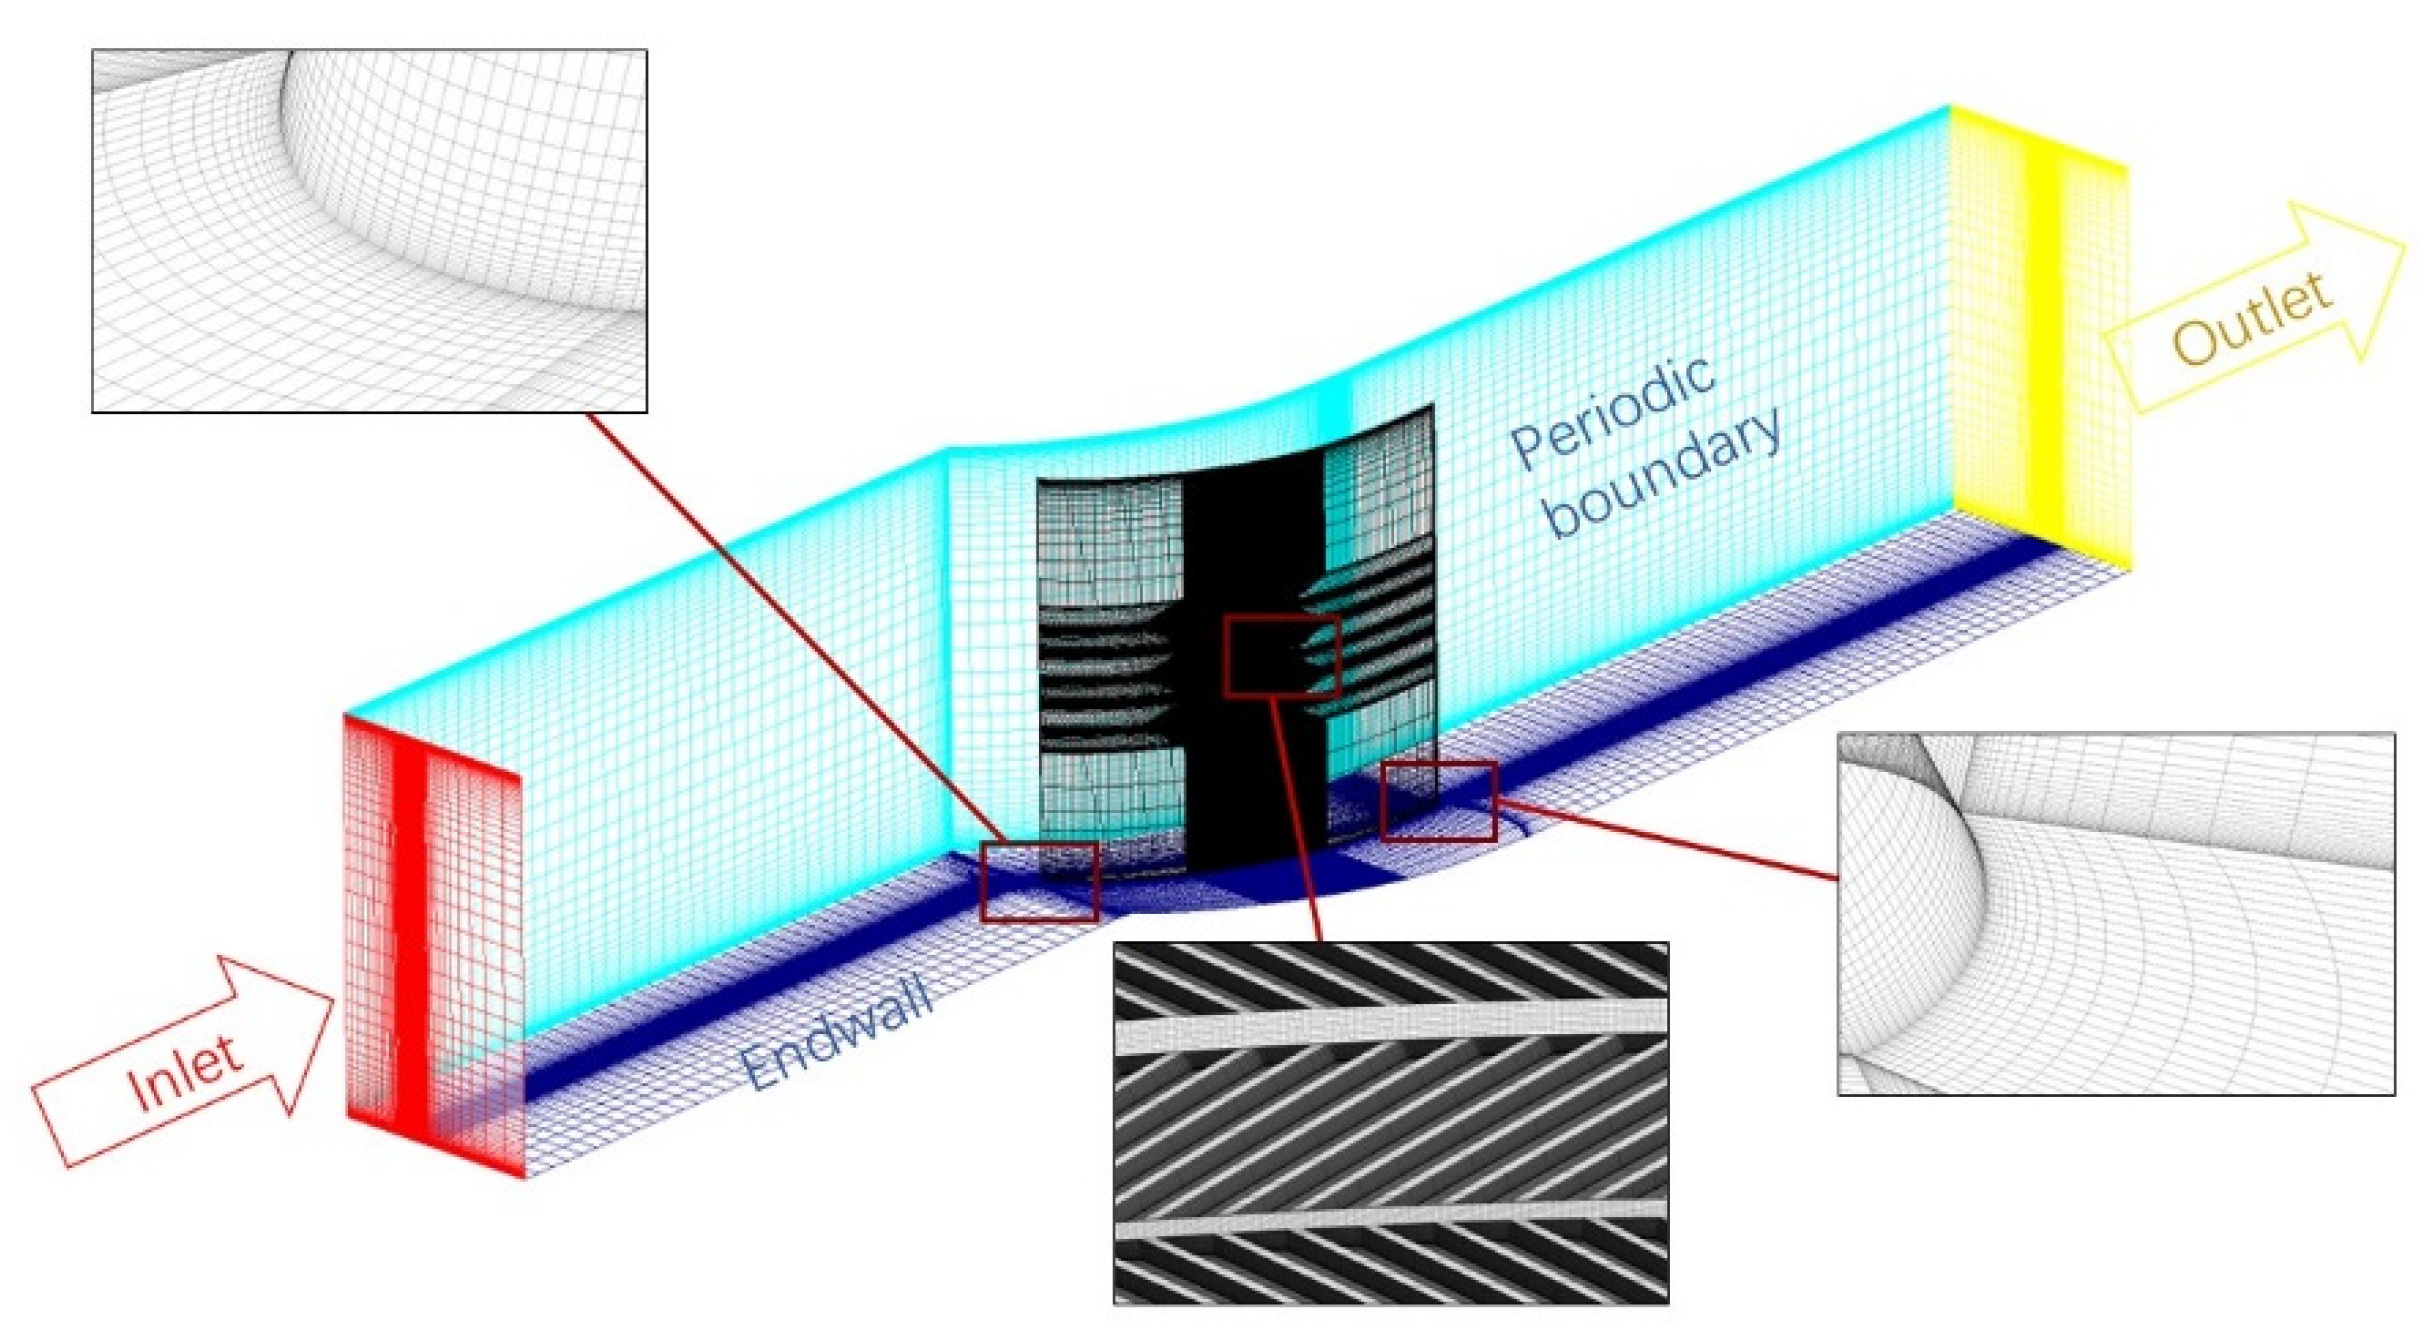
2.2. Numerical Method
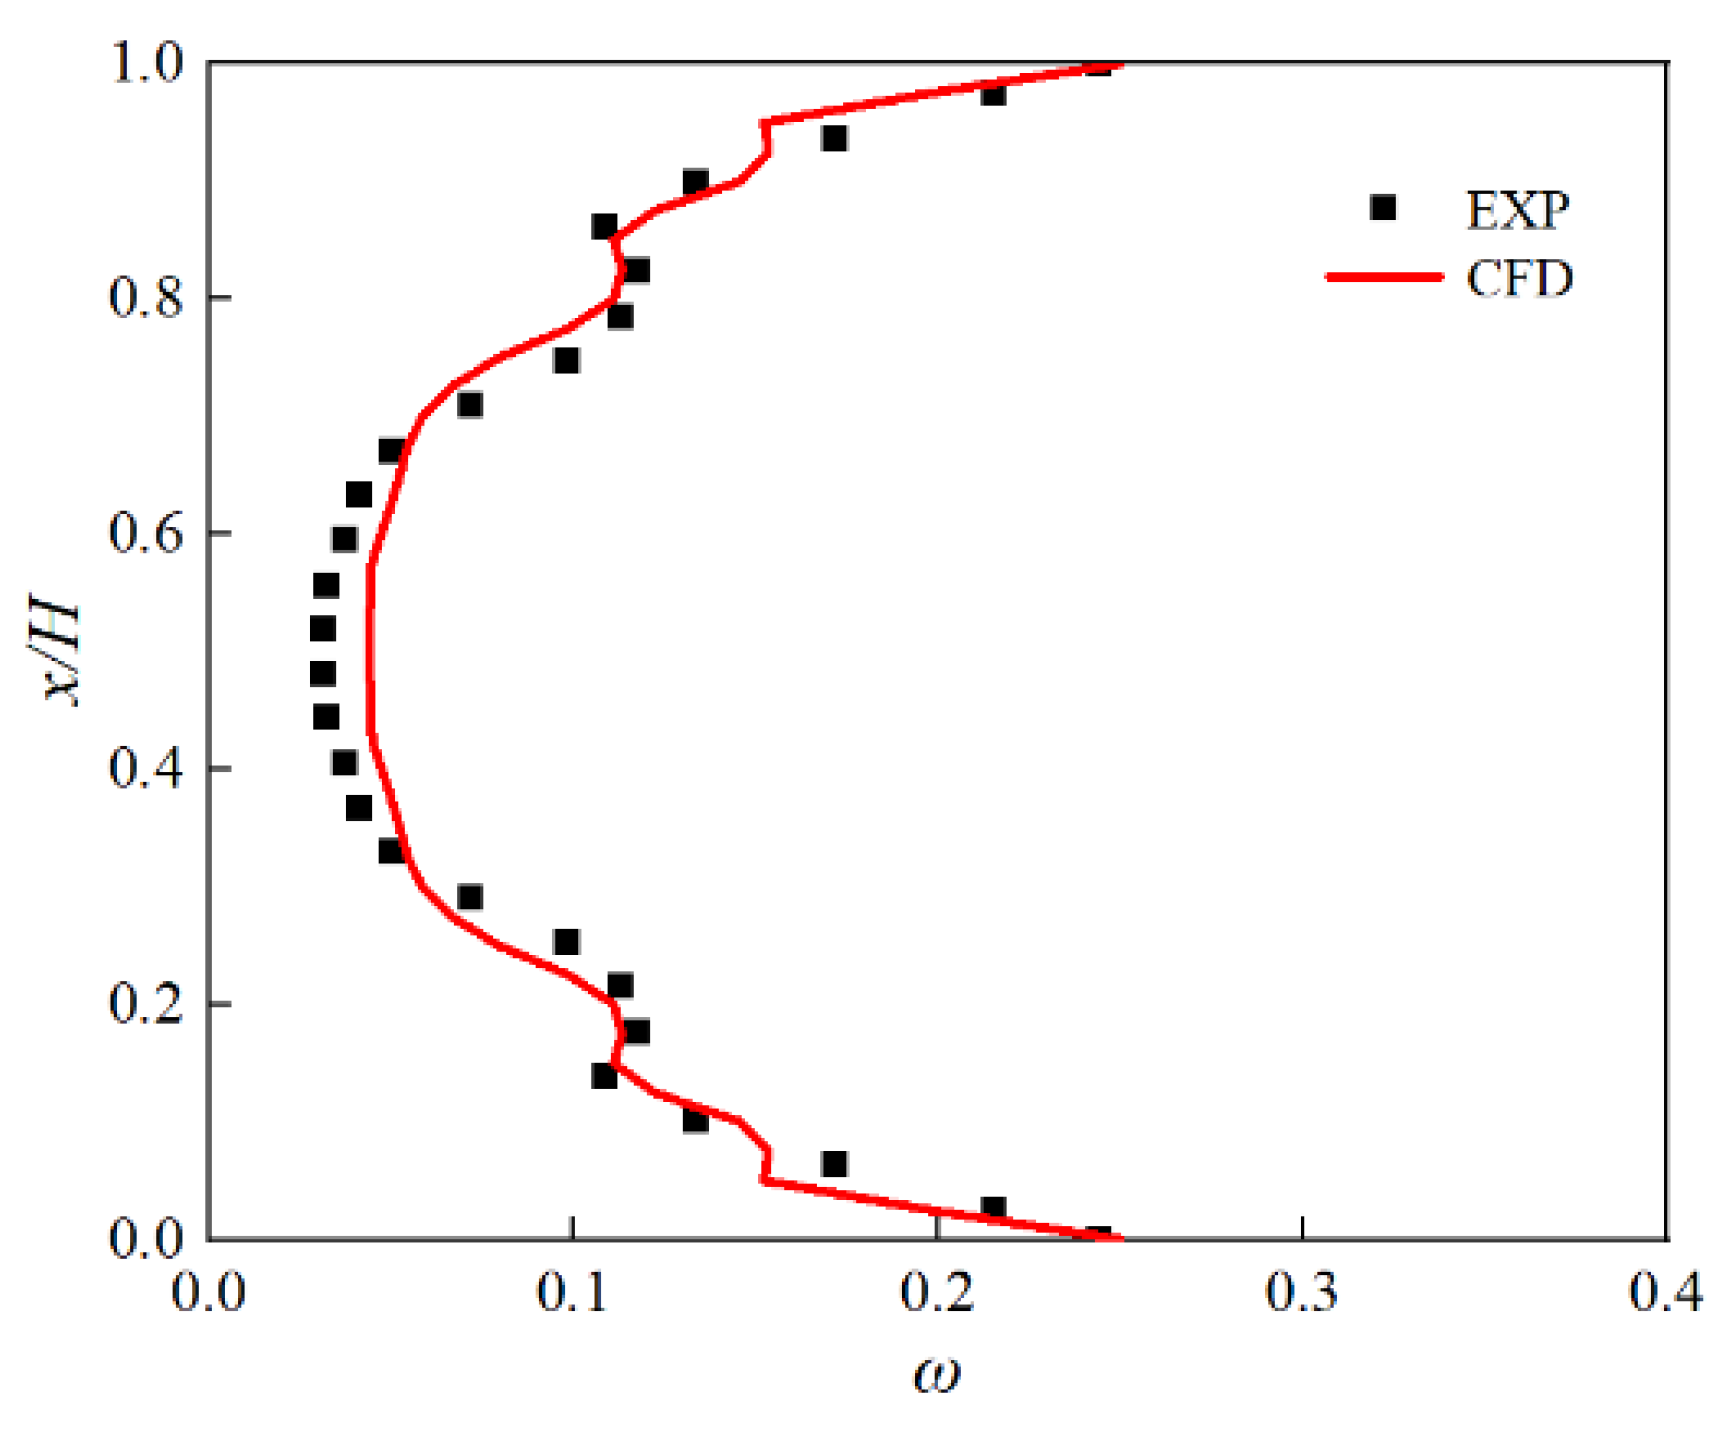
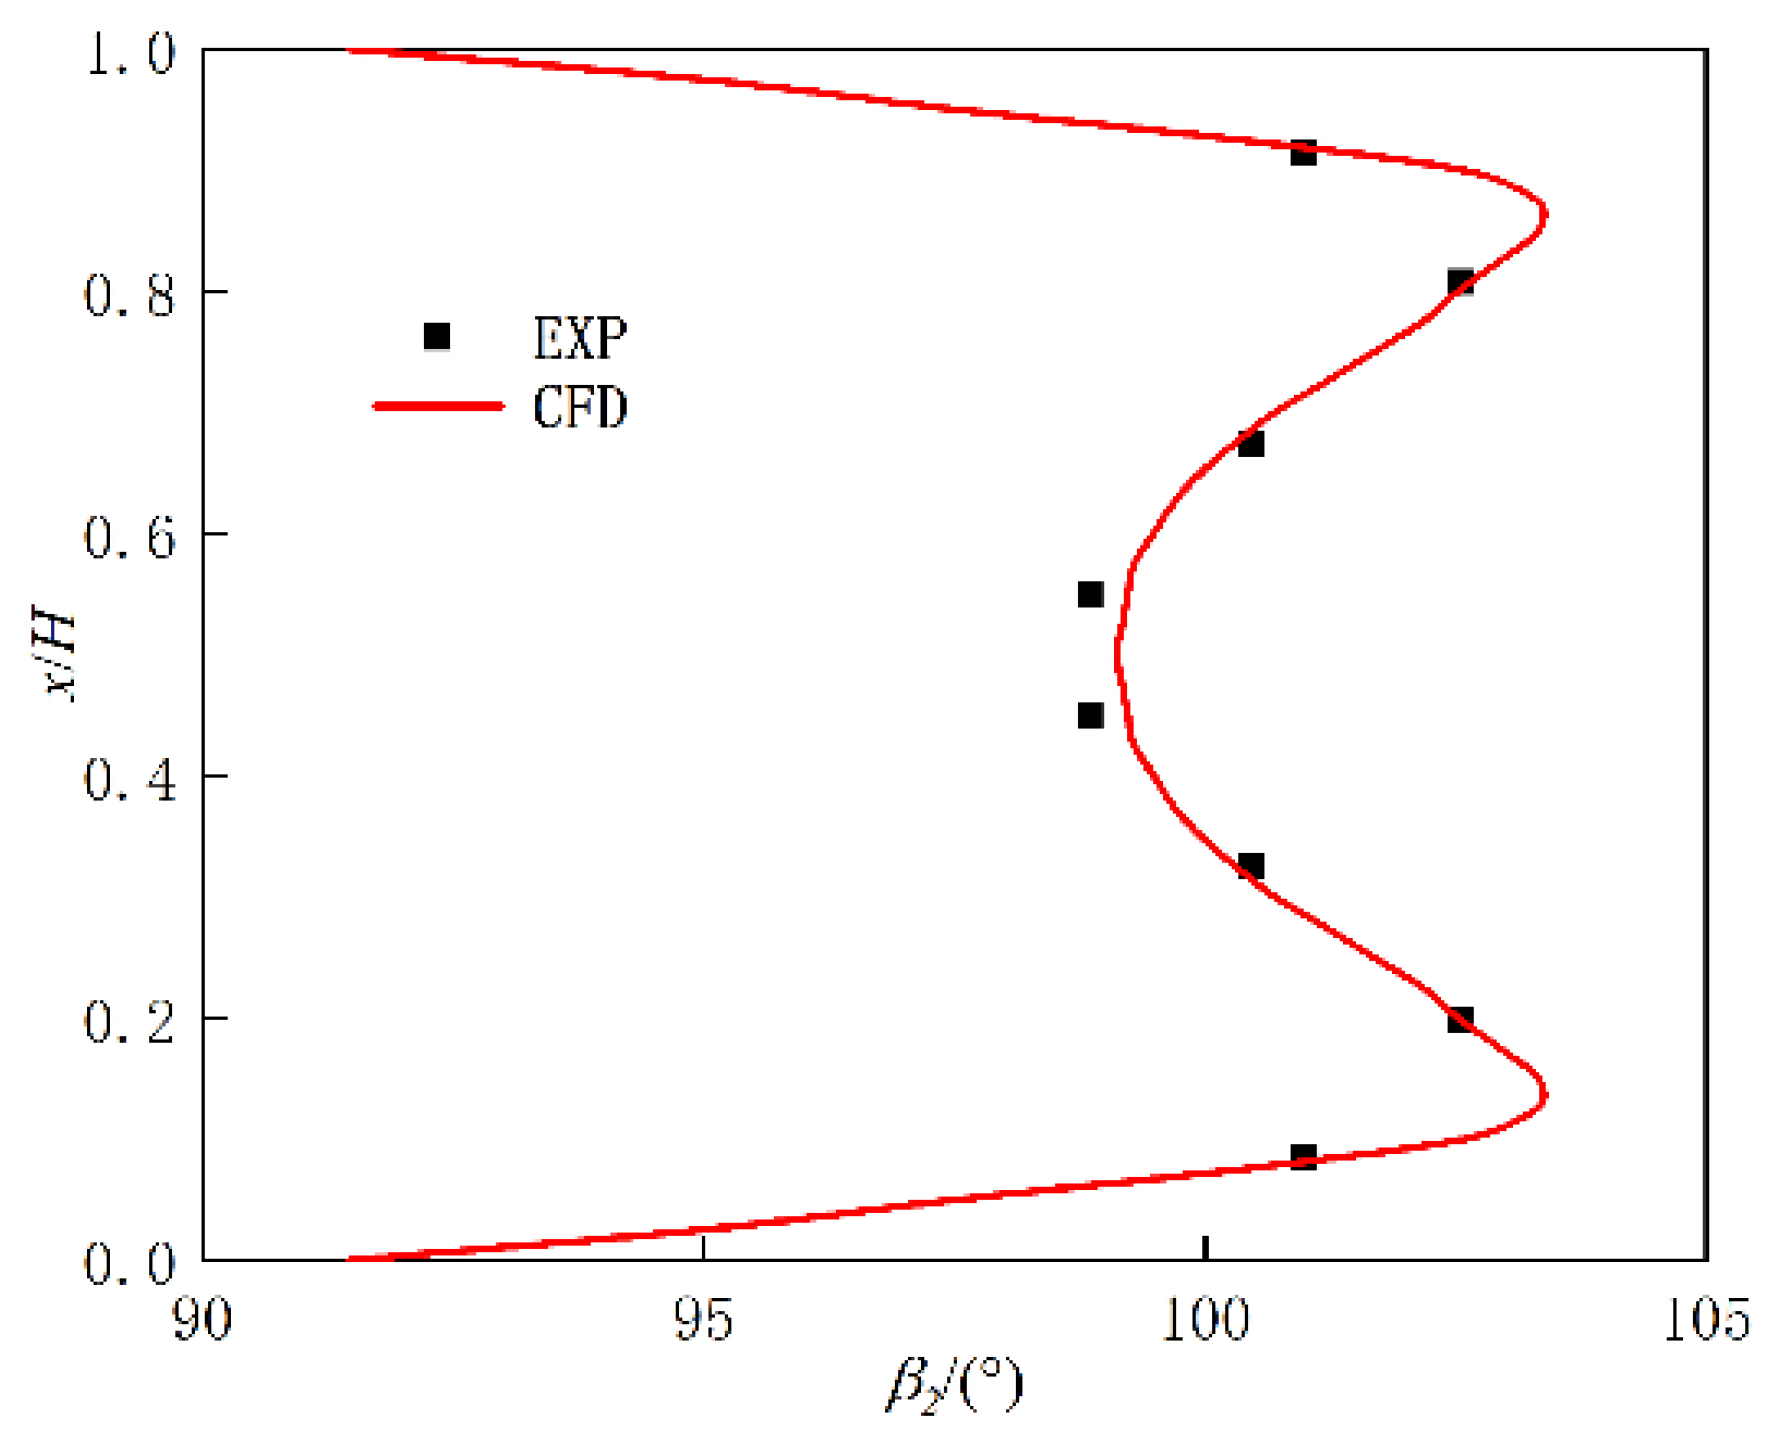
2.3. Numerical Reliability Verification
3. Results and Discussion
3.1. Effect of Herringbone Grooves on Blade Performance at a High-Reynolds-Number Condition (Re = 5.6 × 10⁵)
3.2. Effect of Herringbone Grooves on Blade Performance at a Low-Reynolds-Number Condition (Re = 1.3 × 10⁵)
3.3. Determining the Optimal Depth of Herringbone Grooves at Different Re Conditions
4. Conclusions
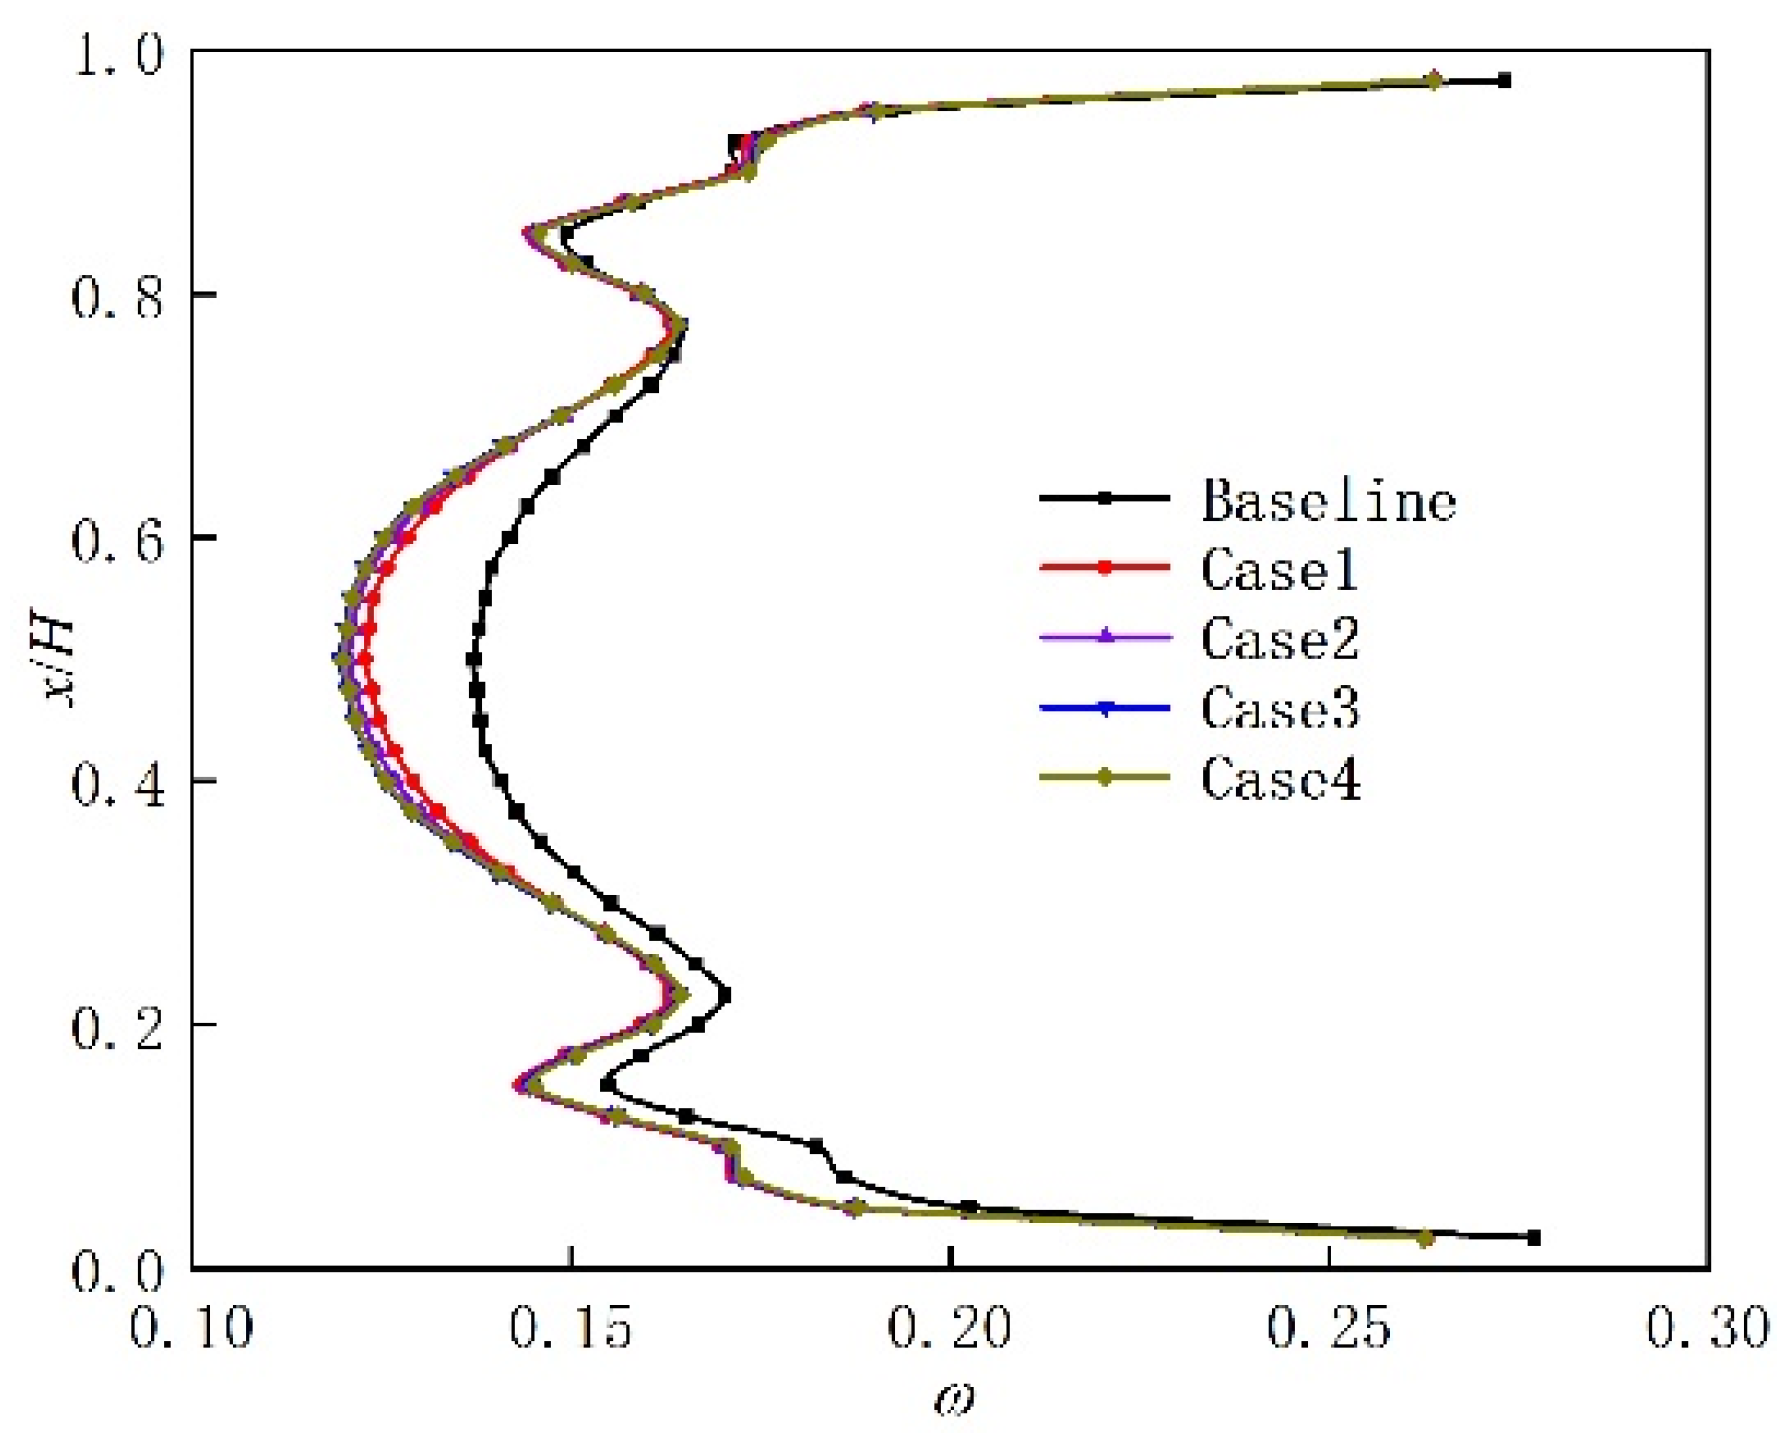
- At a high-Reynolds-number condition (Re = 5.6 × 10⁵), the sawtooth-shaped wake induced by the herringbone groove increases the turbulent mixing loss near the suction surface, deteriorating blade performance. With increasing herringbone-groove depth, the extent of blade performance degradation becomes more pronounced;
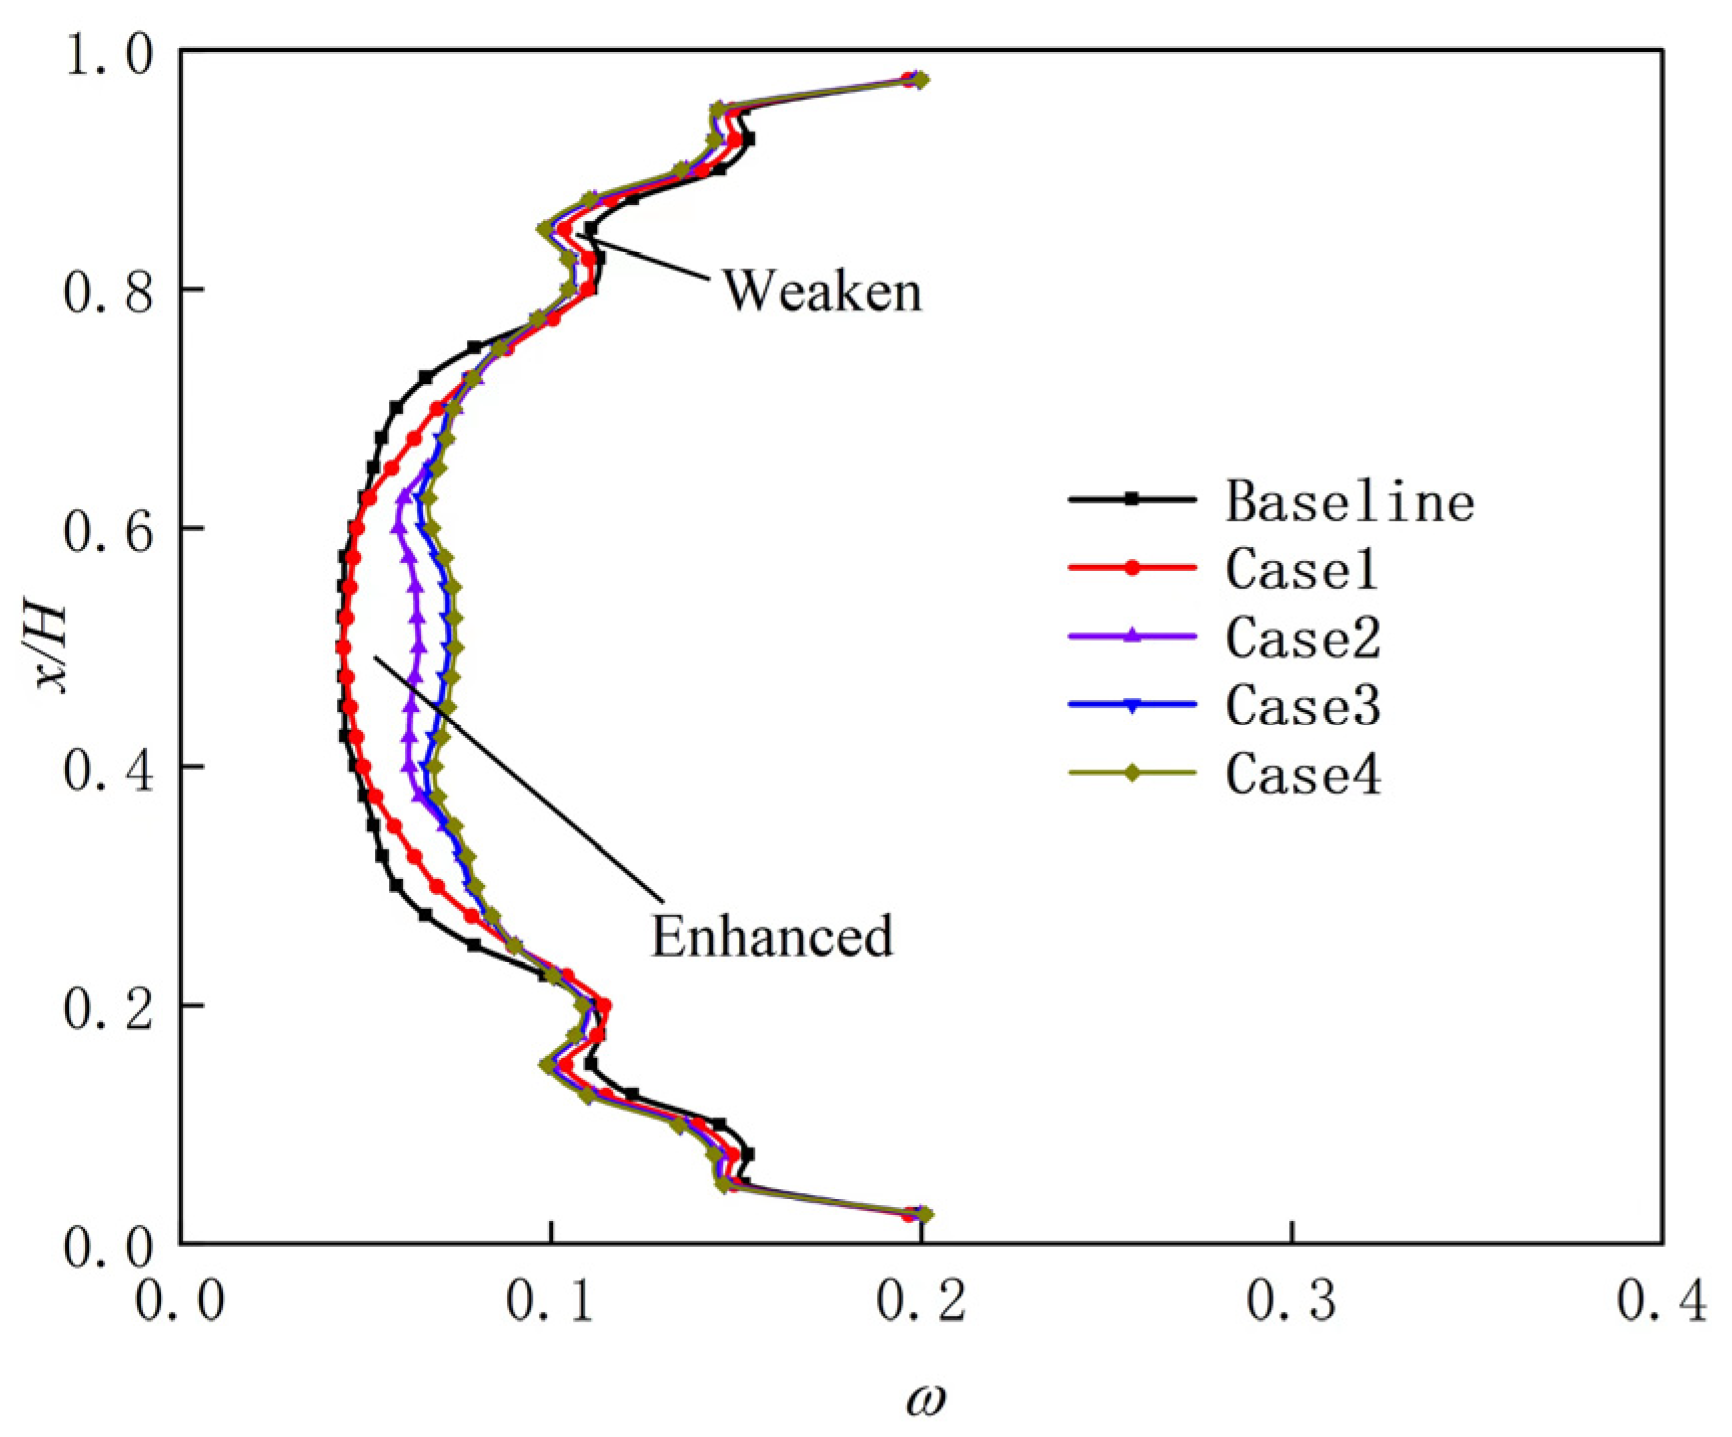
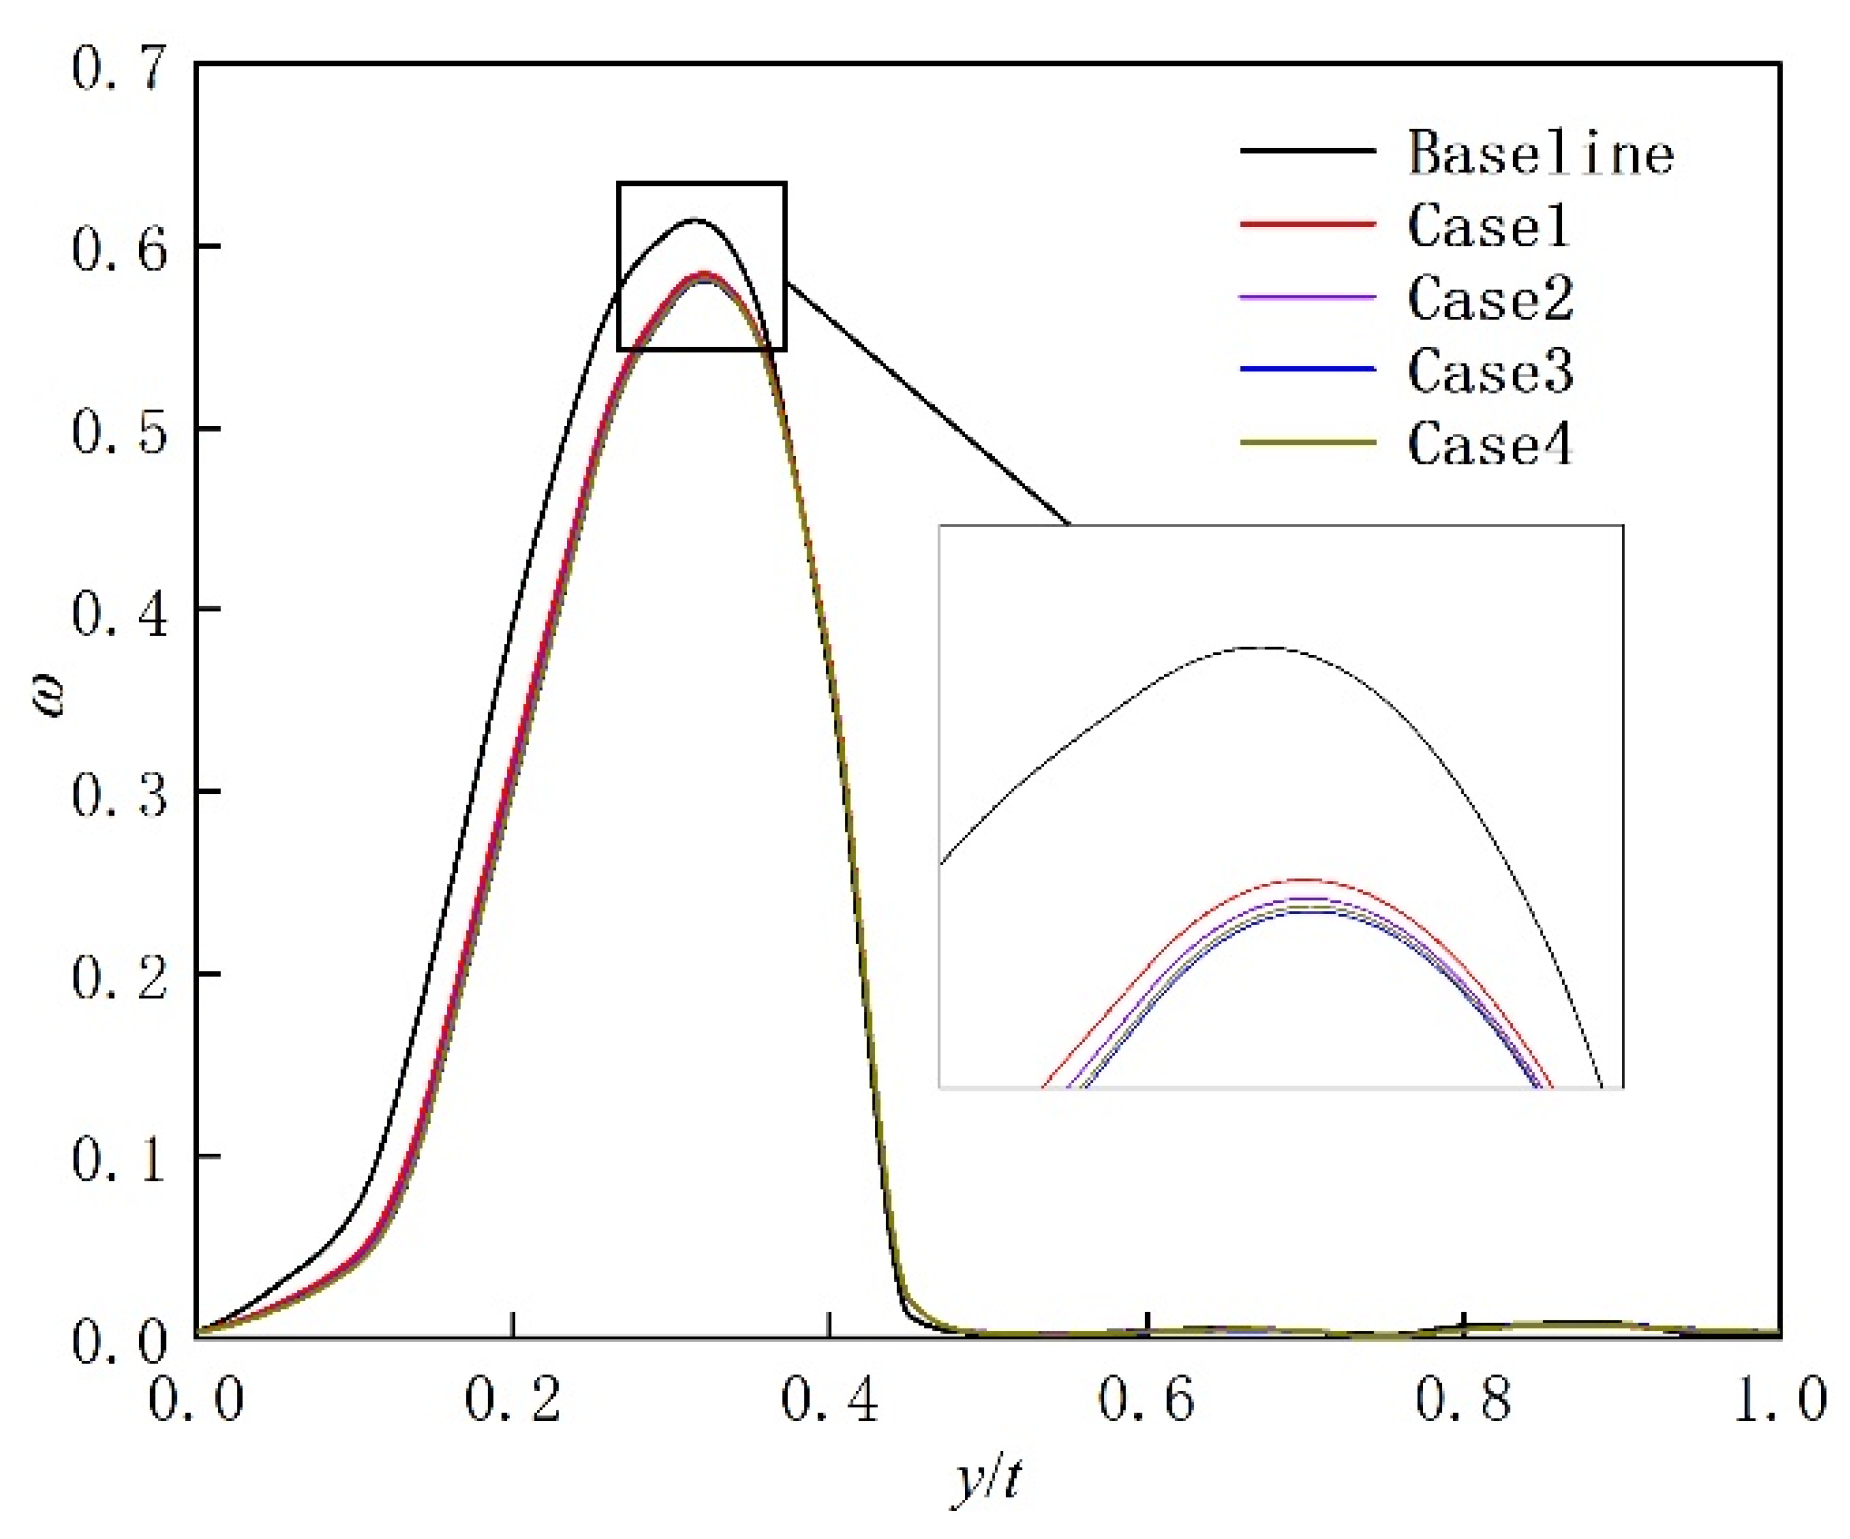
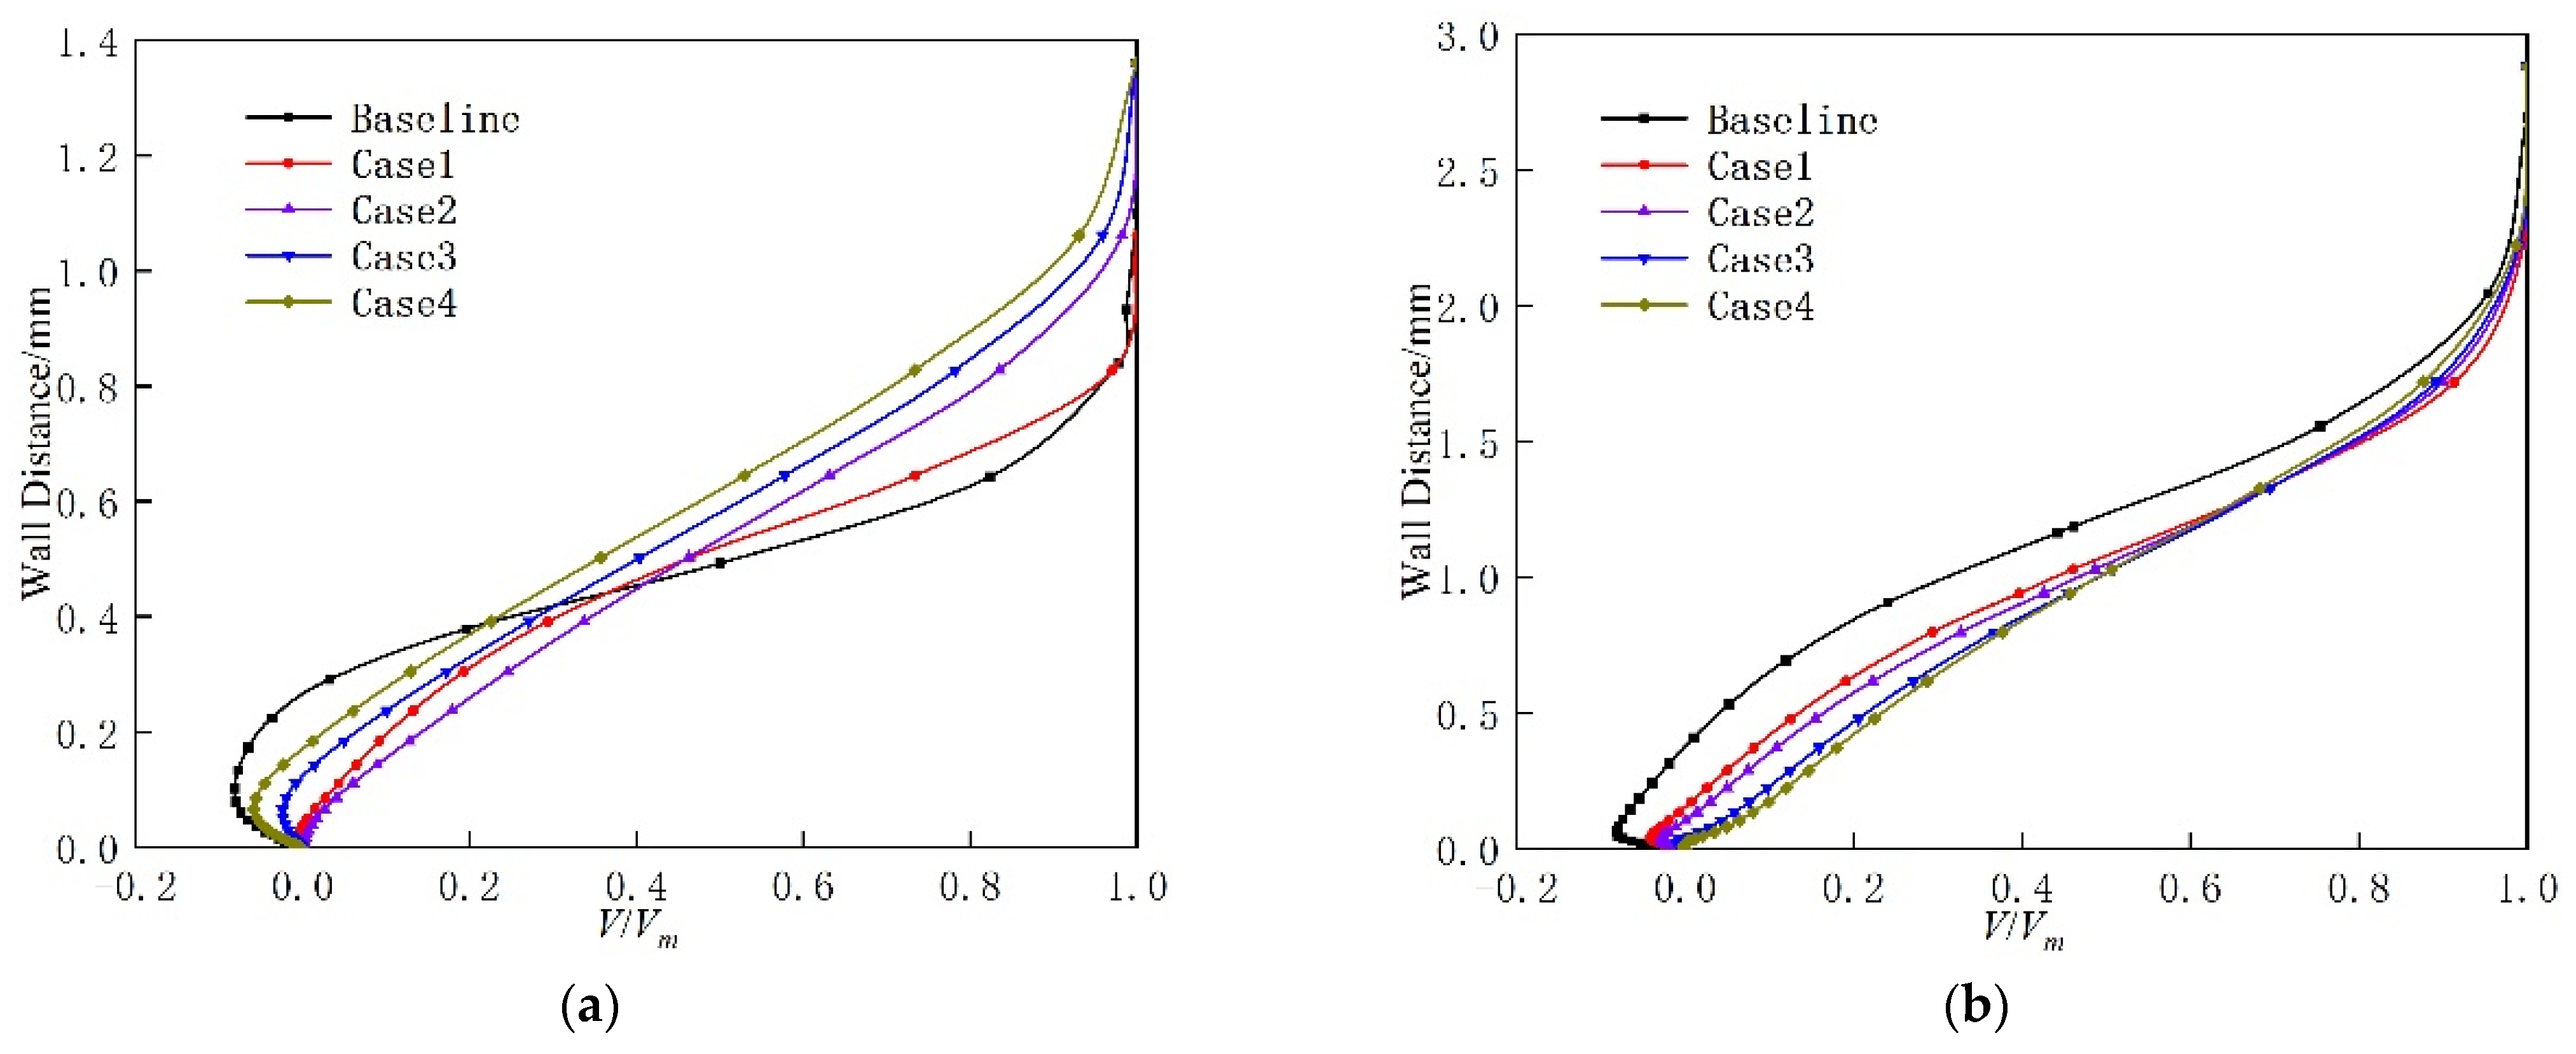
- At a low-Reynolds-number condition (Re = 1.3 × 10⁵), the herringbone groove produces a more uniform near-wall velocity distribution, effectively suppressing laminar separation on the blade’s suction surface. An optimal herringbone-groove depth exists, resulting in an 8.33% reduction in profile loss and a 0.55% improvement in static pressure ratio;
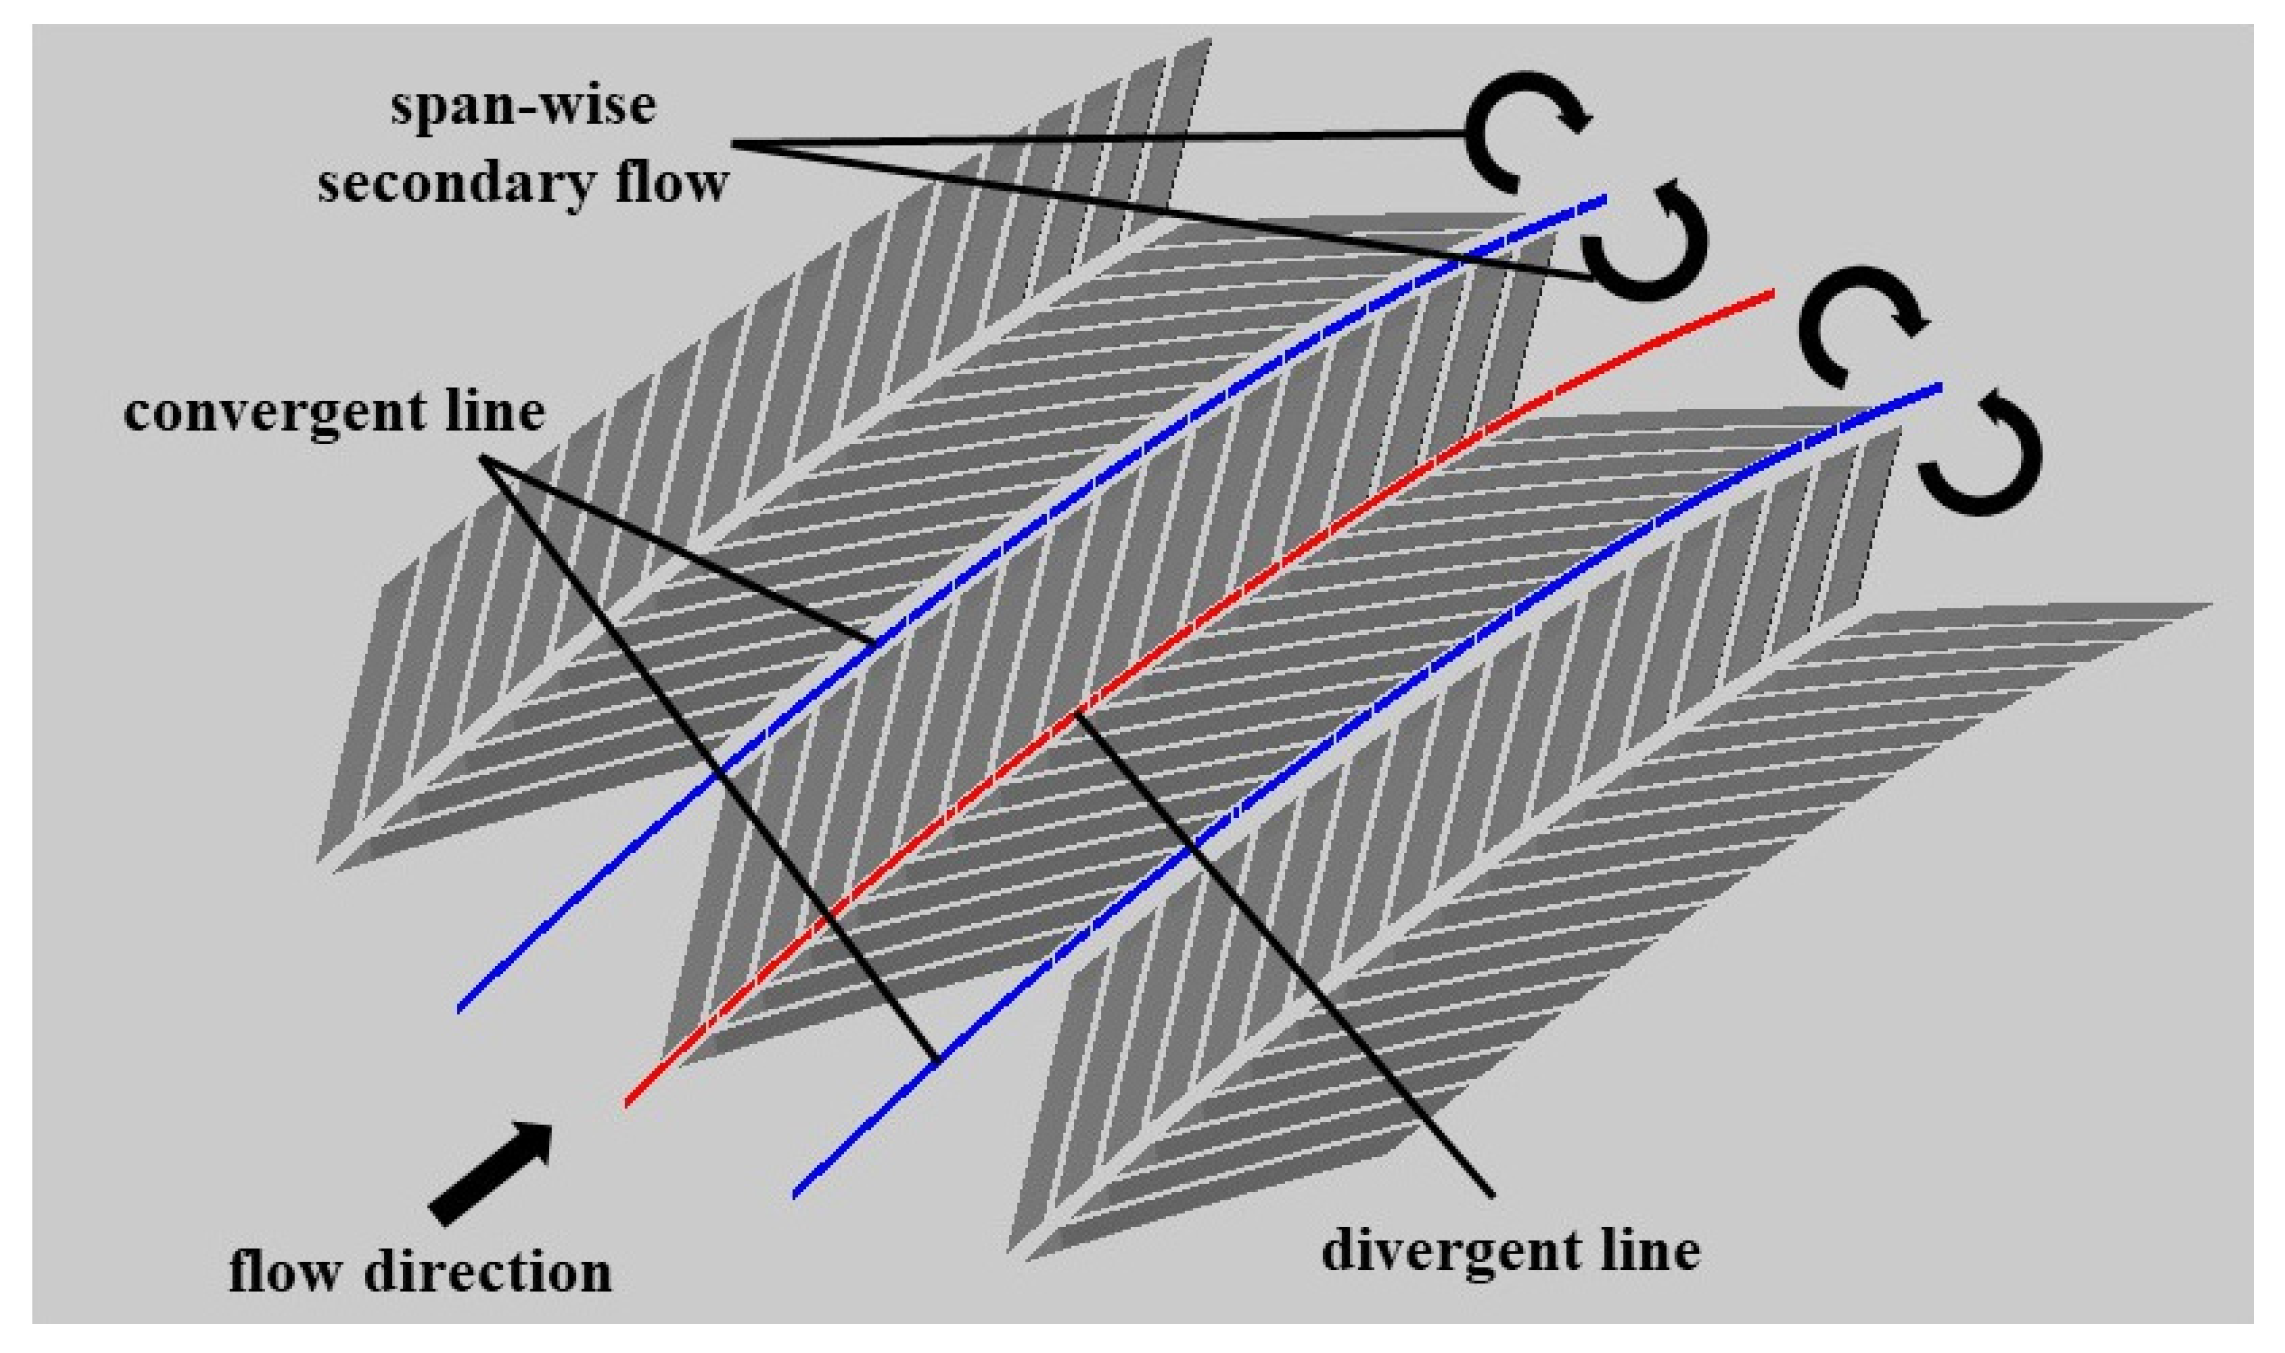
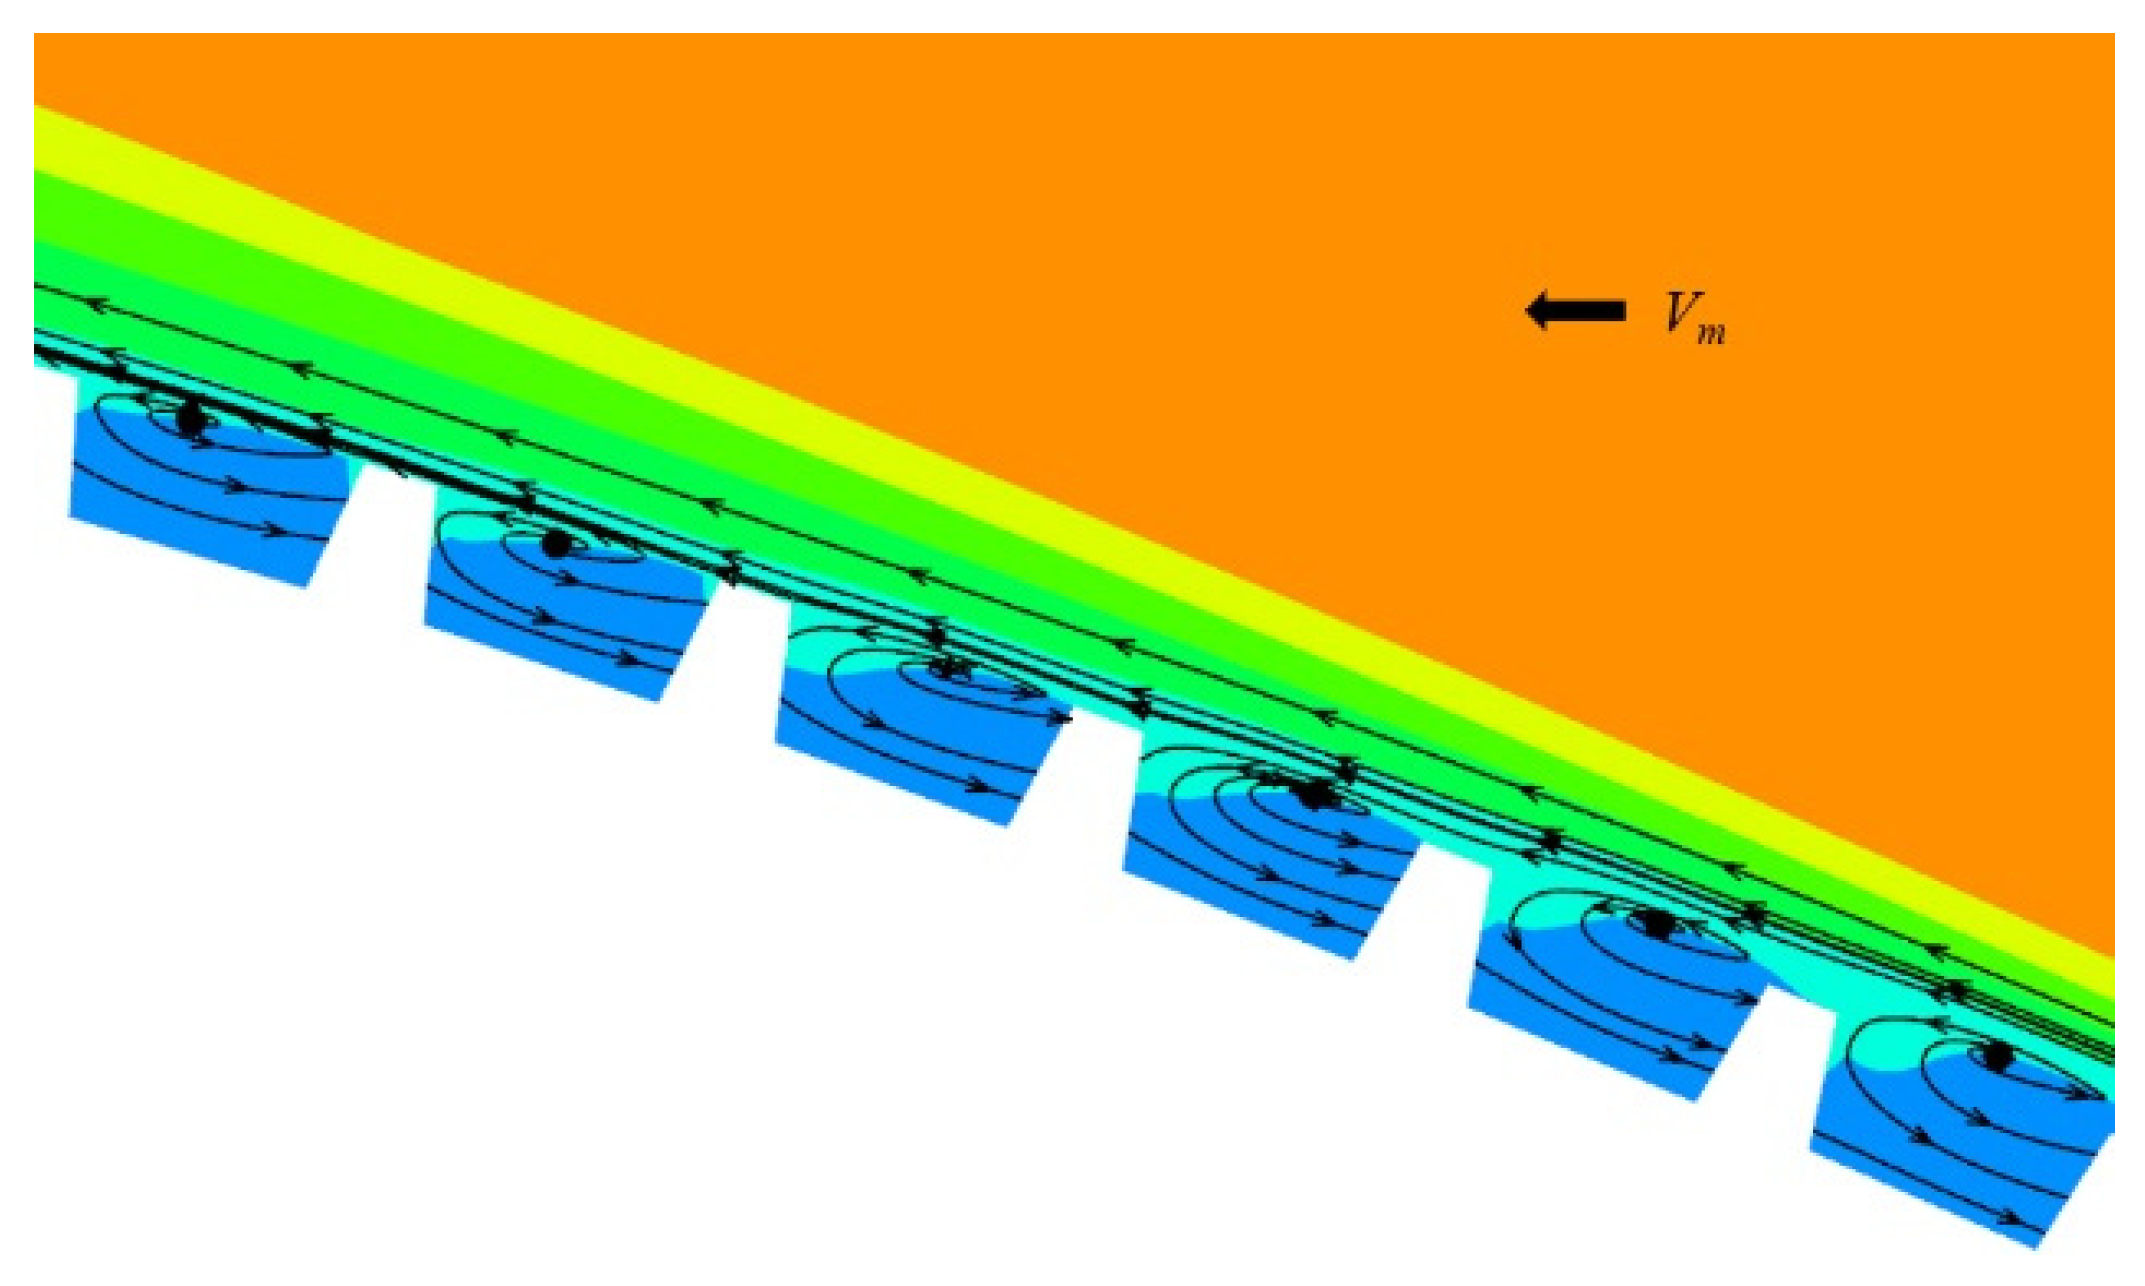
- As a near-wall flow control technique, the herringbone groove operates by enhancing the mixing between the suction surface boundary layer fluid and the mainstream through the span-wise micro-secondary flow it induces and the micro-vortex structures within the groove;
- In the Re range of 1.3 × 10⁵ to 3.5 × 10⁵, there exists an optimal groove depth h for each Re that minimizes the profile loss of the compressor blade, and the lower the blade inlet Re, the larger the optimal h value.
Author Contributions
Funding
Data Availability Statement
Acknowledgments
Conflicts of Interest
Nomenclature
| Re | Reynolds number |
| C | chord |
| Cz | axial chord |
| H | span |
| t | pitch |
| φ | stagger angle |
| α | design inlet angle |
| i | design incidence |
| Main | inlet Mach number |
| total pressure loss coefficient | |
| total pressure of the inlet | |
| local total pressure | |
| static pressure of the inlet | |
| p | local static pressure |
| static pressure ratio coefficient | |
| dissipation function | |
| TKE | turbulent kinetic energy |
| Vm | mainflow velocity |
| h | groove height |
| a | groove width |
| s | groove spacing |
| outlet flow angle | |
| x | span-wise direction |
| y | pitch-wise direction |
| z | axial direction |
| dynamic viscosity |
References
- Hu, X. Development of high-altitude long endurance UAV propulsion technology. Gas Turbine Exp. Res. 2006, 19, 56–60. [Google Scholar]
- Ling, D.; Wang, H.; Ma, C. Subsonic compressor plan cascade experiment at low Reynolds number. Gas Turbine Exp. Res. 2013, 28, 171–179. [Google Scholar]
- List, J.; Byerley, A.; McLaughlin, T.; Van Dyken, R. Using plasma actuators flaps to control laminar separation on turbine blades in a linear cascade. In Proceedings of the 41st Aerospace Sciences Meeting and Exhibit, Reno, Australia, 6–9 January 2003. [Google Scholar]
- Reijnen, D.P. Experimental Study of Boundary Layer Suction in a Transonic Compressor. Ph.D. Thesis, Massachusetts Institute of Technology, Cambridge, MA, USA, 1997. [Google Scholar]
- Chen, Y.; Yang, L.; Zhong, J. Numerical study on endwall fence with varying geometrical parameters in a highly-loaded compressor cascade. Aerosp. Sci. Technol. 2019, 94, 105390. [Google Scholar] [CrossRef]
- Nilavarasan, T.; Joshi, G.N.; Misra, A. Effect of microramps on flare-induced shock-boundary-layer interaction. Aeronaut. J. 2019, 124, 1–29. [Google Scholar] [CrossRef]
- Bechert, D.W.; Bruse, M.; Hage, W.V.; Van der Hoeven, J.T.; Hoppe, G. Experiments on drag-reducing surfaces and their optimization with an adjustable geometry. J. Fluid Mech. 1997, 338, 59–87. [Google Scholar] [CrossRef]
- Choi, K.S. Near-wall structure of a turbulent boundary layer with riblets. J. Fluid Mech. 1989, 208, 417–458. [Google Scholar] [CrossRef]
- Miao, R.; Wang, L. Effect of hub treatment on performance of an axial flow compressor. J. Aerosp. Power 1991, 6, 13–16. [Google Scholar]
- Wen, J.; Zhao, G. An experimental study on effect of unsmoothed blade on cascade exit loss distribution. J. Aerosp. Power 2000, 15, 44–46. [Google Scholar]
- Tian, Q.; Ma, H.; Wu, H.; Gao, L. Effects of a kind of groove surface on the surface flow field of a compressor cascade. J. Eng. Thermophys. 2006, 27, 177–180. [Google Scholar]
- Hergt, A.; Hage, W.; Grund, S.; Steinert, W.; Terhorst, M.; Schongen, F.; Wilke, Y. Riblet application in compressors: Toward efficient blade design. J. Turbomach. 2015, 137, 111006. [Google Scholar] [CrossRef]
- Li, Z.; Jin, Y.; Du, J.; Zhang, H.; Nie, C. Physical mechanisms investigation of sharkskin-inspired compressor cascade based on large eddy simulations. J. Turbomach. 2021, 143, 061005. [Google Scholar] [CrossRef]
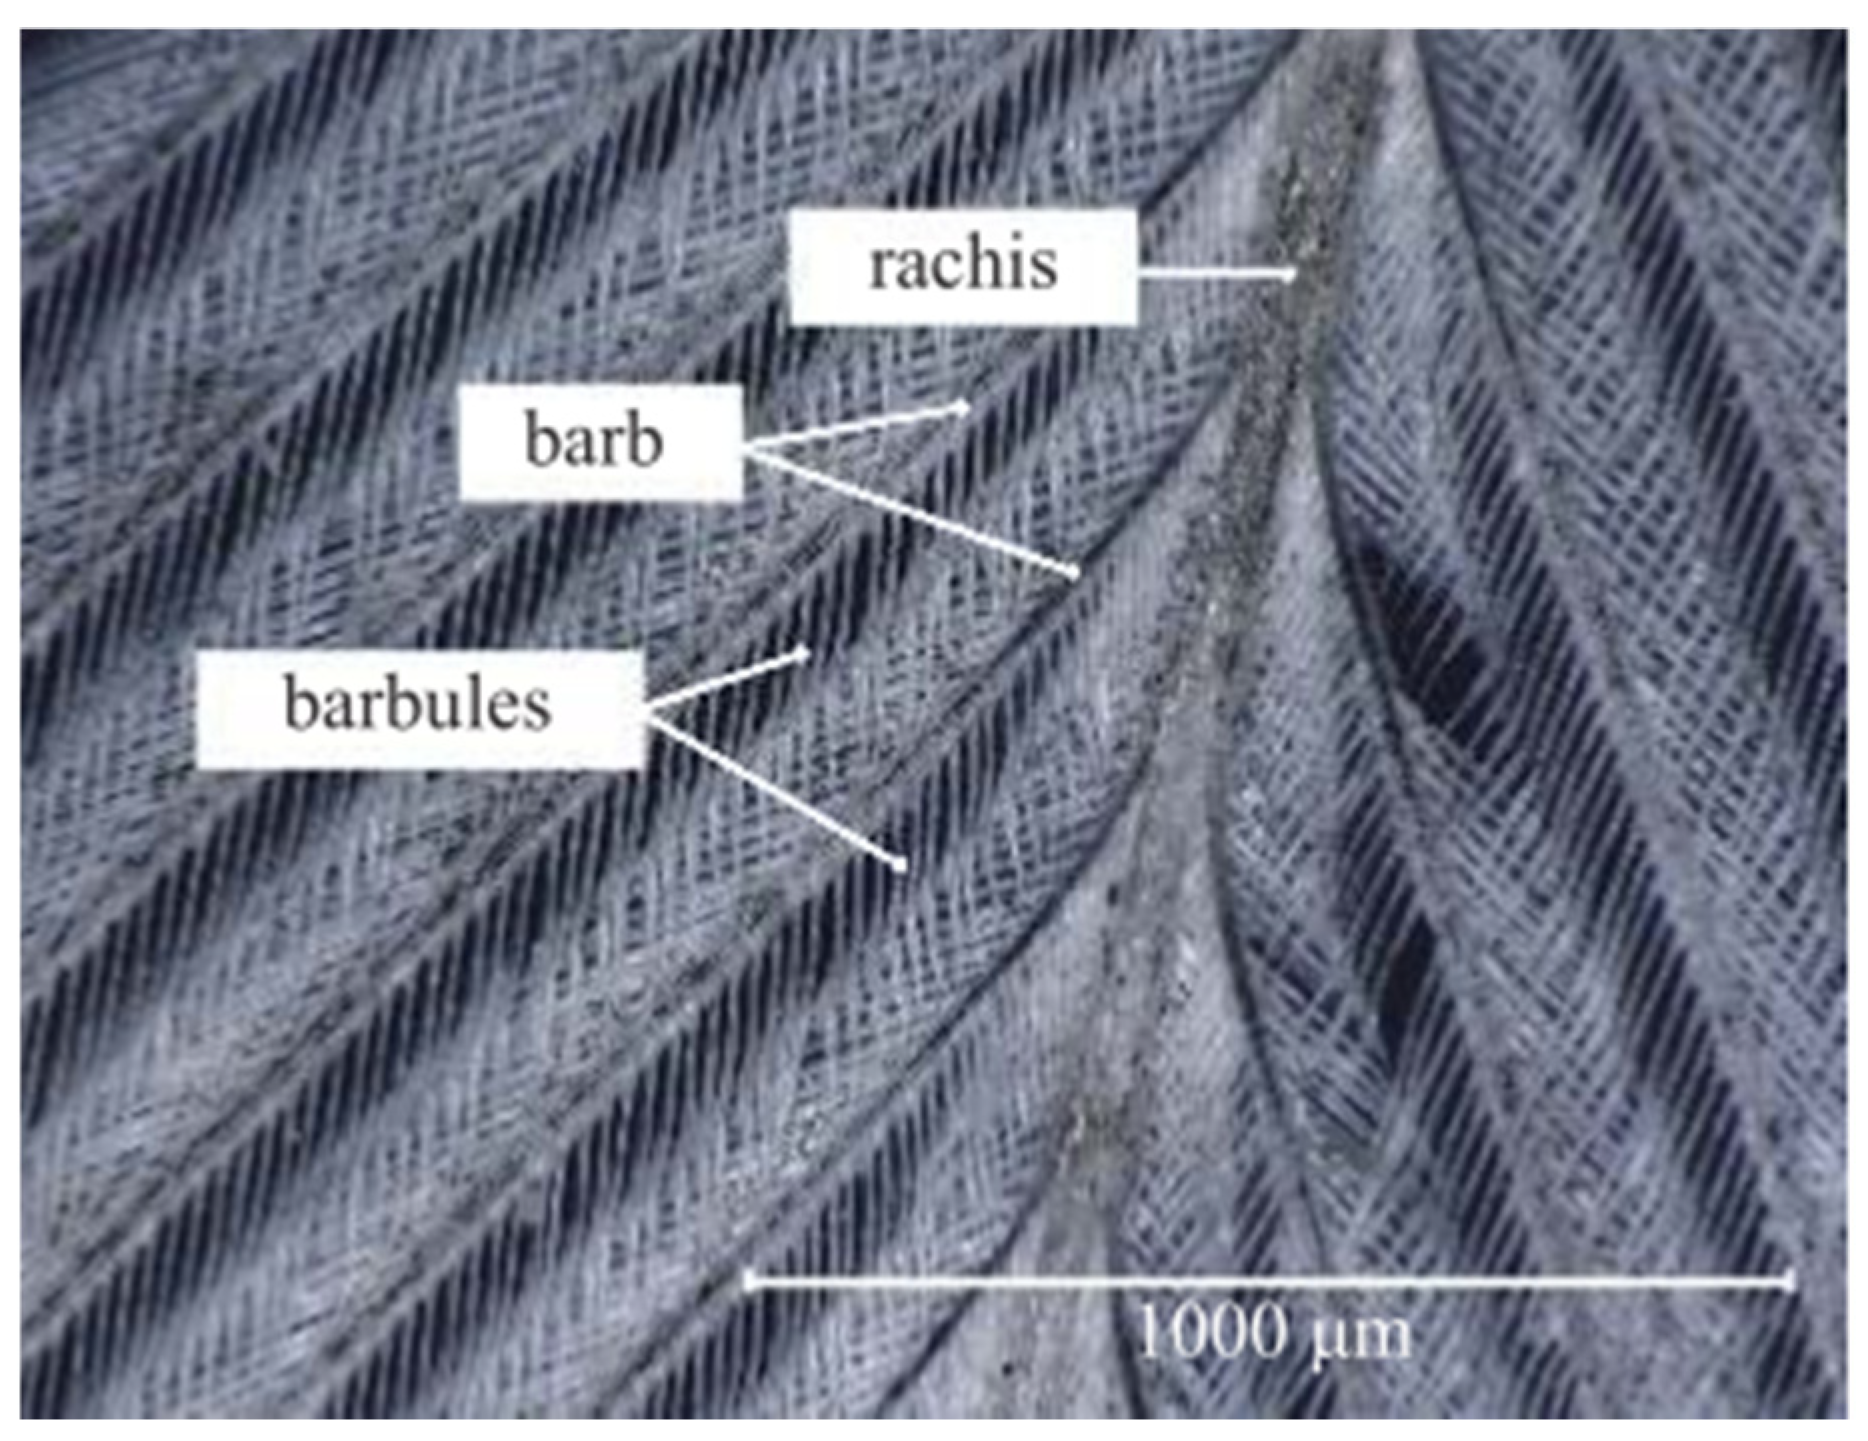
- Chen, H.; Rao, F.; Shang, X.; Zhang, D.; Hagiwara, I. Flow over bio-inspired 3d herringbone wall riblets. Exp. Fluids 2014, 55, 1698. [Google Scholar] [CrossRef]
- Guo, T.; Zhong, S.; Craft, T. Control of laminar flow separation over a backward-facing rounded ramp with c-d riblets—The effects of riblet height, spacing and yaw angle. Int. J. Heat Fluid Flow 2020, 85, 108629. [Google Scholar] [CrossRef]
- Liu, Q.; Zhong, S.; Li, L. Effects of bio-inspired micro-scale surface patterns on the profile losses in a linear cascade. J. Turbomach. 2019, 141, 121006. [Google Scholar] [CrossRef]
- Wu, K.; Ye, Z.; Ye, K.; Hong, Z. Mechanical characteristics of the deformation of bird feathers in airflow. Chin. J. Theor. Appl. Mech. 2023, 55, 874–884. [Google Scholar]
- Hergt, A.; Meyer, R.; Liesner, K.; Nicke, E. A new approach for compressor endwall contouring. In Proceedings of the ASME 2011 Turbo Expo: Turbine Technical Conference and Exposition. Volume 7: Turbomachinery, Parts A, B, and C, Vancouver, BC, Canada, 6–10 June 2011; ASME: New York, NY, USA, 2011. ASMEGT2011-54679. [Google Scholar]


| Parameters | Values |
|---|---|
| Chord, C/(mm) | 40 |
| Axial chord, Cz/(mm) | 36.95 |
| Span, H/(mm) | 40 |
| Pitch, t/(mm) | 22 |
| Stagger angle, φ/(°) | 22.5 |
| Design inlet angle, α/(°) | 42 |
| Design incidence, i/(°) | −6 |
| Inlet Mach number, Main | 0.67 |
| Parameters | Values |
|---|---|
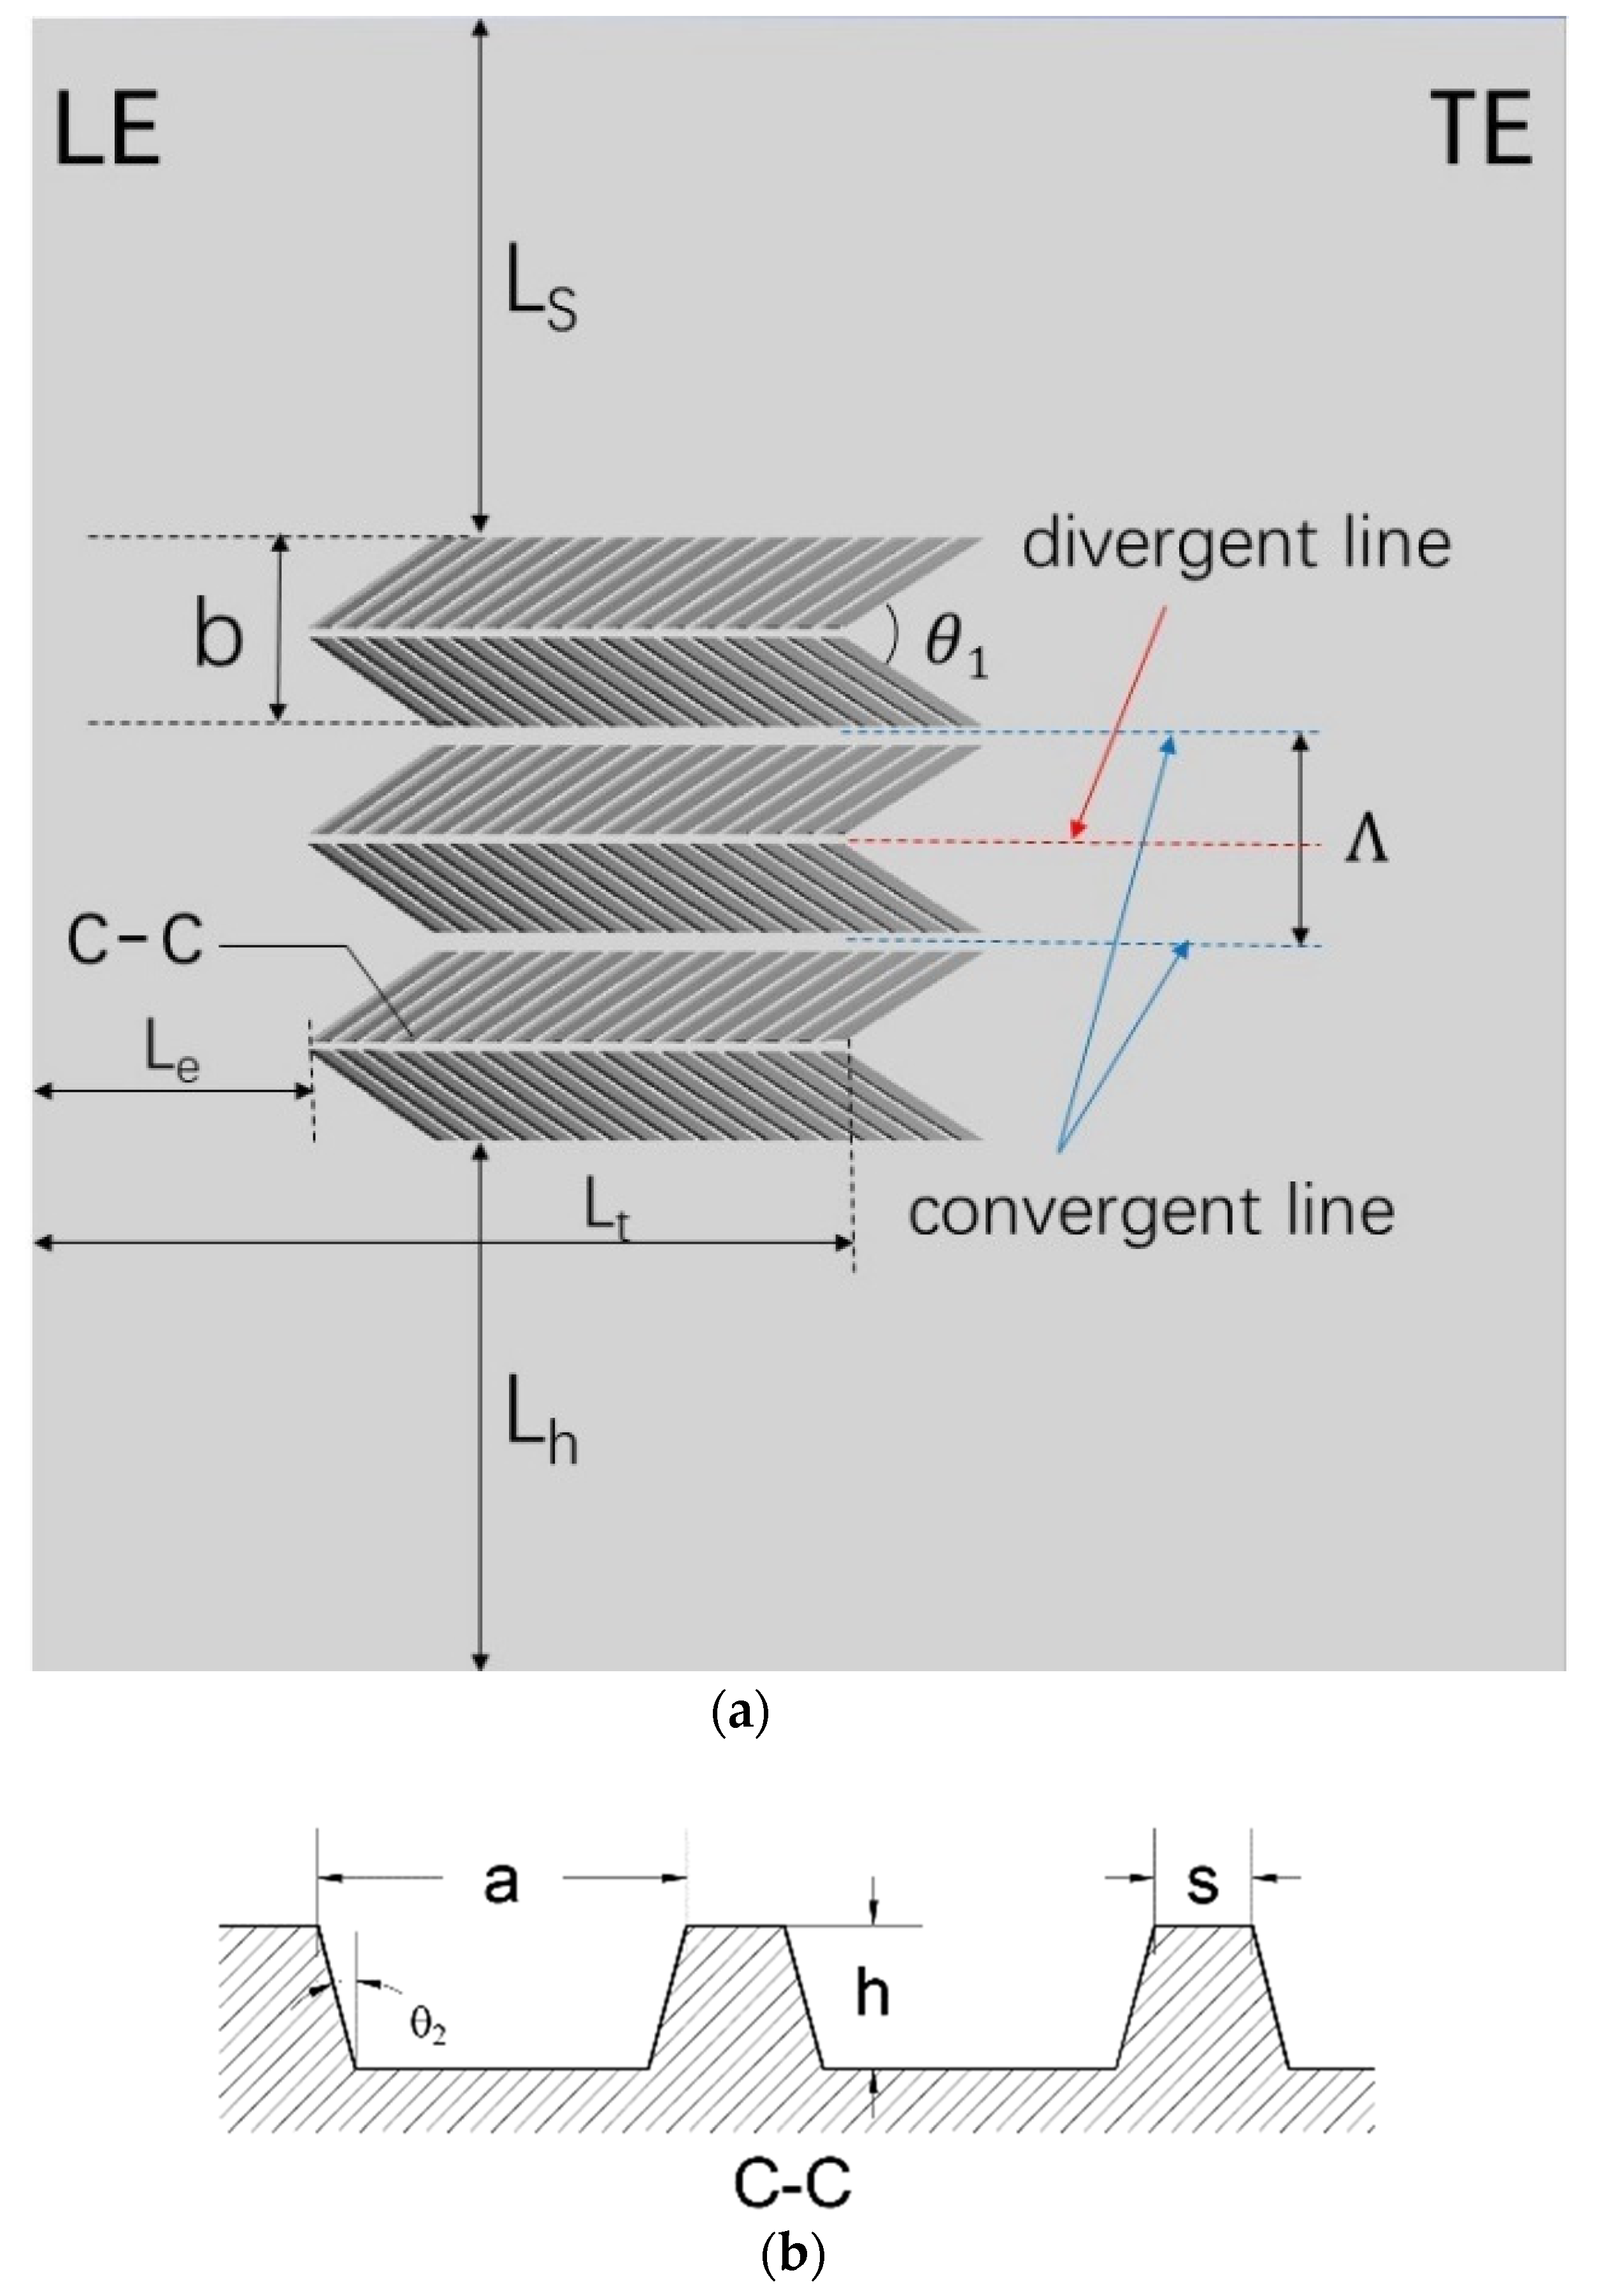
| Ls/(mm) | 12.6 |
| Lh/(mm) | 12.6 |
| Le/(mm) | 6.4 |
| Lt/(mm) | 21.6 |
| /(°) | 60 |
| /(°) | 10 |
| b/(mm) | 4.55 |
| /(mm) | 5 |
| a/(mm) | 0.65 |
| s/(mm) | 0.2 |
| h/(mm) | 0.1, 0.2, 0.3, 0.4 |
Disclaimer/Publisher’s Note: The statements, opinions and data contained in all publications are solely those of the individual author(s) and contributor(s) and not of MDPI and/or the editor(s). MDPI and/or the editor(s) disclaim responsibility for any injury to people or property resulting from any ideas, methods, instructions or products referred to in the content. |
© 2024 by the authors. Licensee MDPI, Basel, Switzerland. This article is an open access article distributed under the terms and conditions of the Creative Commons Attribution (CC BY) license (https://creativecommons.org/licenses/by/4.0/).
Share and Cite
Han, S.; Yang, Z.; Zhong, J.; Yan, Y. Influence of Herringbone Grooves Inspired by Bird Feathers on Aerodynamics of Compressor Cascade under Different Reynolds Number Conditions. Aerospace 2024, 11, 626. https://doi.org/10.3390/aerospace11080626
Han S, Yang Z, Zhong J, Yan Y. Influence of Herringbone Grooves Inspired by Bird Feathers on Aerodynamics of Compressor Cascade under Different Reynolds Number Conditions. Aerospace. 2024; 11(8):626. https://doi.org/10.3390/aerospace11080626
Chicago/Turabian StyleHan, Shaobing, Zhijie Yang, Jingjun Zhong, and Yuying Yan. 2024. "Influence of Herringbone Grooves Inspired by Bird Feathers on Aerodynamics of Compressor Cascade under Different Reynolds Number Conditions" Aerospace 11, no. 8: 626. https://doi.org/10.3390/aerospace11080626