Article

Dynamic Fault Tree Model of Civil Aircraft Avionics Network Transmission Failure Based on Optimized Extended Fuzzy Algorithm

1
Information Security Evaluation Centre, Civil Aviation University of China, Tianjin 300300, China
2
College of Computer Science and Technology, Civil Aviation University of China, Tianjin 300300, China
3
College of Aeronautical Engineering, Civil Aviation University of China, Tianjin 300300, China
*
Author to whom correspondence should be addressed.
Aerospace 2024, 11(8), 631; https://doi.org/10.3390/aerospace11080631
Submission received: 13 June 2024 / Revised: 24 July 2024 / Accepted: 31 July 2024 / Published: 1 August 2024

Abstract

:
The avionics network supports high-safety-level flight operations, with the analysis of transmission failures serving as a crucial means for its safety evaluation. Due to the time-dependent nature of the failure probability in avionics networks, traditional constant and unchangeable probability values can deviate from the actual situation under specific conditions. This deviation may lead to inadequate responses to occasional events and potentially cause flight accidents. A Dynamic Fault Tree (DFT) model for civil aircraft avionics network transmission failures, based on an optimized extended fuzzy algorithm, is introduced in this paper. Initially focusing on event correlations, a DFT is established for the transmission failure of the Avionics Full Duplex Switched Ethernet (AFDX). Subsequently, considering the variations between events, triangular fuzzy processing is applied to the event failure rates based on relative confidence levels. Finally, by optimizing the weakest t-norm operator, the failure probability intervals are aggregated and the fuzzy scale is regulated. Experimental results demonstrate that, compared to the static-minimum t-norm and traditional weakest t-norm methods, the proposed approach enhances the accuracy of the fuzzy failure probability intervals by 66.15% and 40.59%, respectively. Concurrently, it maintains consistency in the ranking of event importance, highlighting the superior effectiveness of the proposed method in analyzing transmission failures in avionics networks.

1. Introduction

The commercial aircraft network domain includes the aircraft control domain (ACD), the airline information services domain, the passenger information and entertainment services domain, and other network domains. The avionics network is the core of the ACD domain, interacting with environmental control, flight control, power, navigation, onboard maintenance systems, and more, based on the ARINC 664 protocol. It carries high aviation safety level (A-C level) services that are crucial for ensuring the safe operation of civil aircrafts [1].
With the advancement of civil aircraft electronics, the avionics network has transitioned from a closed system to an increasingly open one [2]. The increase in information exchange paths has made transmission failure a new risk element for avionics networks. Malicious users might exploit the vulnerabilities of the avionics network through these communication paths for malicious penetration and remote attacks, leading to paralysis of the avionics data transmission network. At the 2013 Hack in the Box conference in Amsterdam, German cybersecurity consultant Hugo Teso demonstrated the interference of avionics data transmission using a standard smartphone. US government reports have also indicated that certain civil aircraft’s onboard Wi-Fi systems can be exploited to attack their avionics navigation systems.
In comprehensive systems that require extensive data interaction, the transmission link is a crucial component for real-time data transfer. Both wireless communication technologies, such as 5G networks, and wired communication systems demand that the transmission bus deliver high-bandwidth and low-latency services. Any latency or failure in this transmission link can lead to significant system functionality loss [3,4]. Therefore, the security analysis of the data transmission bus is necessary to ensure the maintenance and sustainability of system functions.
Given that the avionics network carries critical data communications, a transmission failure would directly impede the transfer of flight parameters, navigation information, and flight control commands. Such failures could result in cascading issues, severely affecting flight safety. Therefore, conducting a transmission failure analysis of civil aircraft avionics networks is essential for enhancing the overall reliability of the aircraft.
The existing safety analysis of avionics networks primarily focuses on two aspects. First, standard-setting organizations have released numerous avionics network security standards. Among them, ARINC 811 allocates security roles based on organizational strategies and provides cost-effective aircraft information security operation procedures, emphasizing the security scheduling of airlines and suppliers [5]. This process relies on the normal operation of the onboard systems. SAE ARP 4754A provides guidance principles for system safety management, including determining safety goals, safety analysis, assessment, safety verification, validation, etc. [6], and refers to SAE ARP 4761, offering graded airworthiness approval reference methods [7]. For instance, function hazard analysis evaluates the safety impact of aircraft-level failure modes and produces aircraft-level safety objectives. Furthermore, fault tree analysis (FTA) generates system-level fault modes. Because existing standards encompass various aspects of flight system safety, the overall process becomes complex, involves macroscopic methods, lacks flexibility, is not sufficiently specific for certain safety objectives, and cannot support the transmission failure analysis of specific avionics network protocols (such as AFDX and TTE).
Second, researchers have optimized existing safety analysis methods to better match avionics network business scenarios. Dong et al. proposed a safety model based on fault correlation matrices to analyze the fault propagation process [8]. Dou et al. introduced a multilayer network correlation analysis method, which was applied to the spectrum and coupling analysis of aviation big data information systems [9]. Dou et al. combined fault trees with Markov chains for electronic flight instrument system analysis, neglecting the fact that avionics network failures directly lead to data loss [10]. Yang et al. introduced a method that combines HiP-HOPS with Architecture Analysis and Design Language to establish dynamic models for complex integrated modular avionics systems, but a quantitative analysis could not be performed [11]. Salma et al. proposed a layered reliability analysis model for onboard wind-energy systems [12]. The aforementioned research outcomes have been applied to the safety analysis of multiple vital avionic systems, such as flight control systems (FCSs), electronic flight instrument systems (EFISs), flight management systems (FMSs), and ADS-B.
In terms of the safety analysis methodology, AI and fog computing have proven effective in improving the service quality (QoS) of industrial IoT [13]. The fog architecture supporting 6G can serve as a rigorous theoretical foundation for integrated IoT solutions [14]. Integrating reinforcement learning with Markov decision processes can protect data security unloading in the IoT [15], and ant colony optimization algorithms and deep neural networks can optimize drone anomaly detection research [16]. However, owing to limited data samples, valuable computing resources, and changing physical environments in avionics networks, they fail to meet the data input conditions of machine learning models and high computational resource demands. Thus, a reliability analysis based on AI, RL, and DRL is unsuitable for avionics networks. Compared with machine learning theories, fuzzy theory provides a flexible mathematical framework that does not require vast training data and offers relatively accurate descriptions of uncertainties, which is precisely required by avionics network security analysis.
Furthermore, the inherent uncertainty of avionics networks is not caused by randomness, which cannot be described by probability theory. Instead, it refers to the fluctuation in failure probabilities influenced by functional parameters under different operational environments. Traditional constant failure probability values may significantly deviate from the actual system operation in specific situations, potentially leading to flight accidents (symptoms).
Currently, there is limited research on failure analysis methods that consider the uncertainty characteristics of avionics networks. In the field of failure analysis, a theoretical framework that combines qualitative and quantitative methods provides a more flexible and feasible approach to analyzing different failure states [17]. Therefore, to enhance the accuracy of avionics network security analysis, this study proposes a new method for network transmission failure analysis, combining qualitative and quantitative approaches, with the following specific contributions:
  • Addressing the issues of missing transmission failure analysis methods in avionics networks and the mismatch between existing methods and their security requirements, this paper introduces a DFT modeling method for civil aircraft avionics network transmission based on an optimized extended fuzzy algorithm, assessing the reliability of AFDX data transmission;
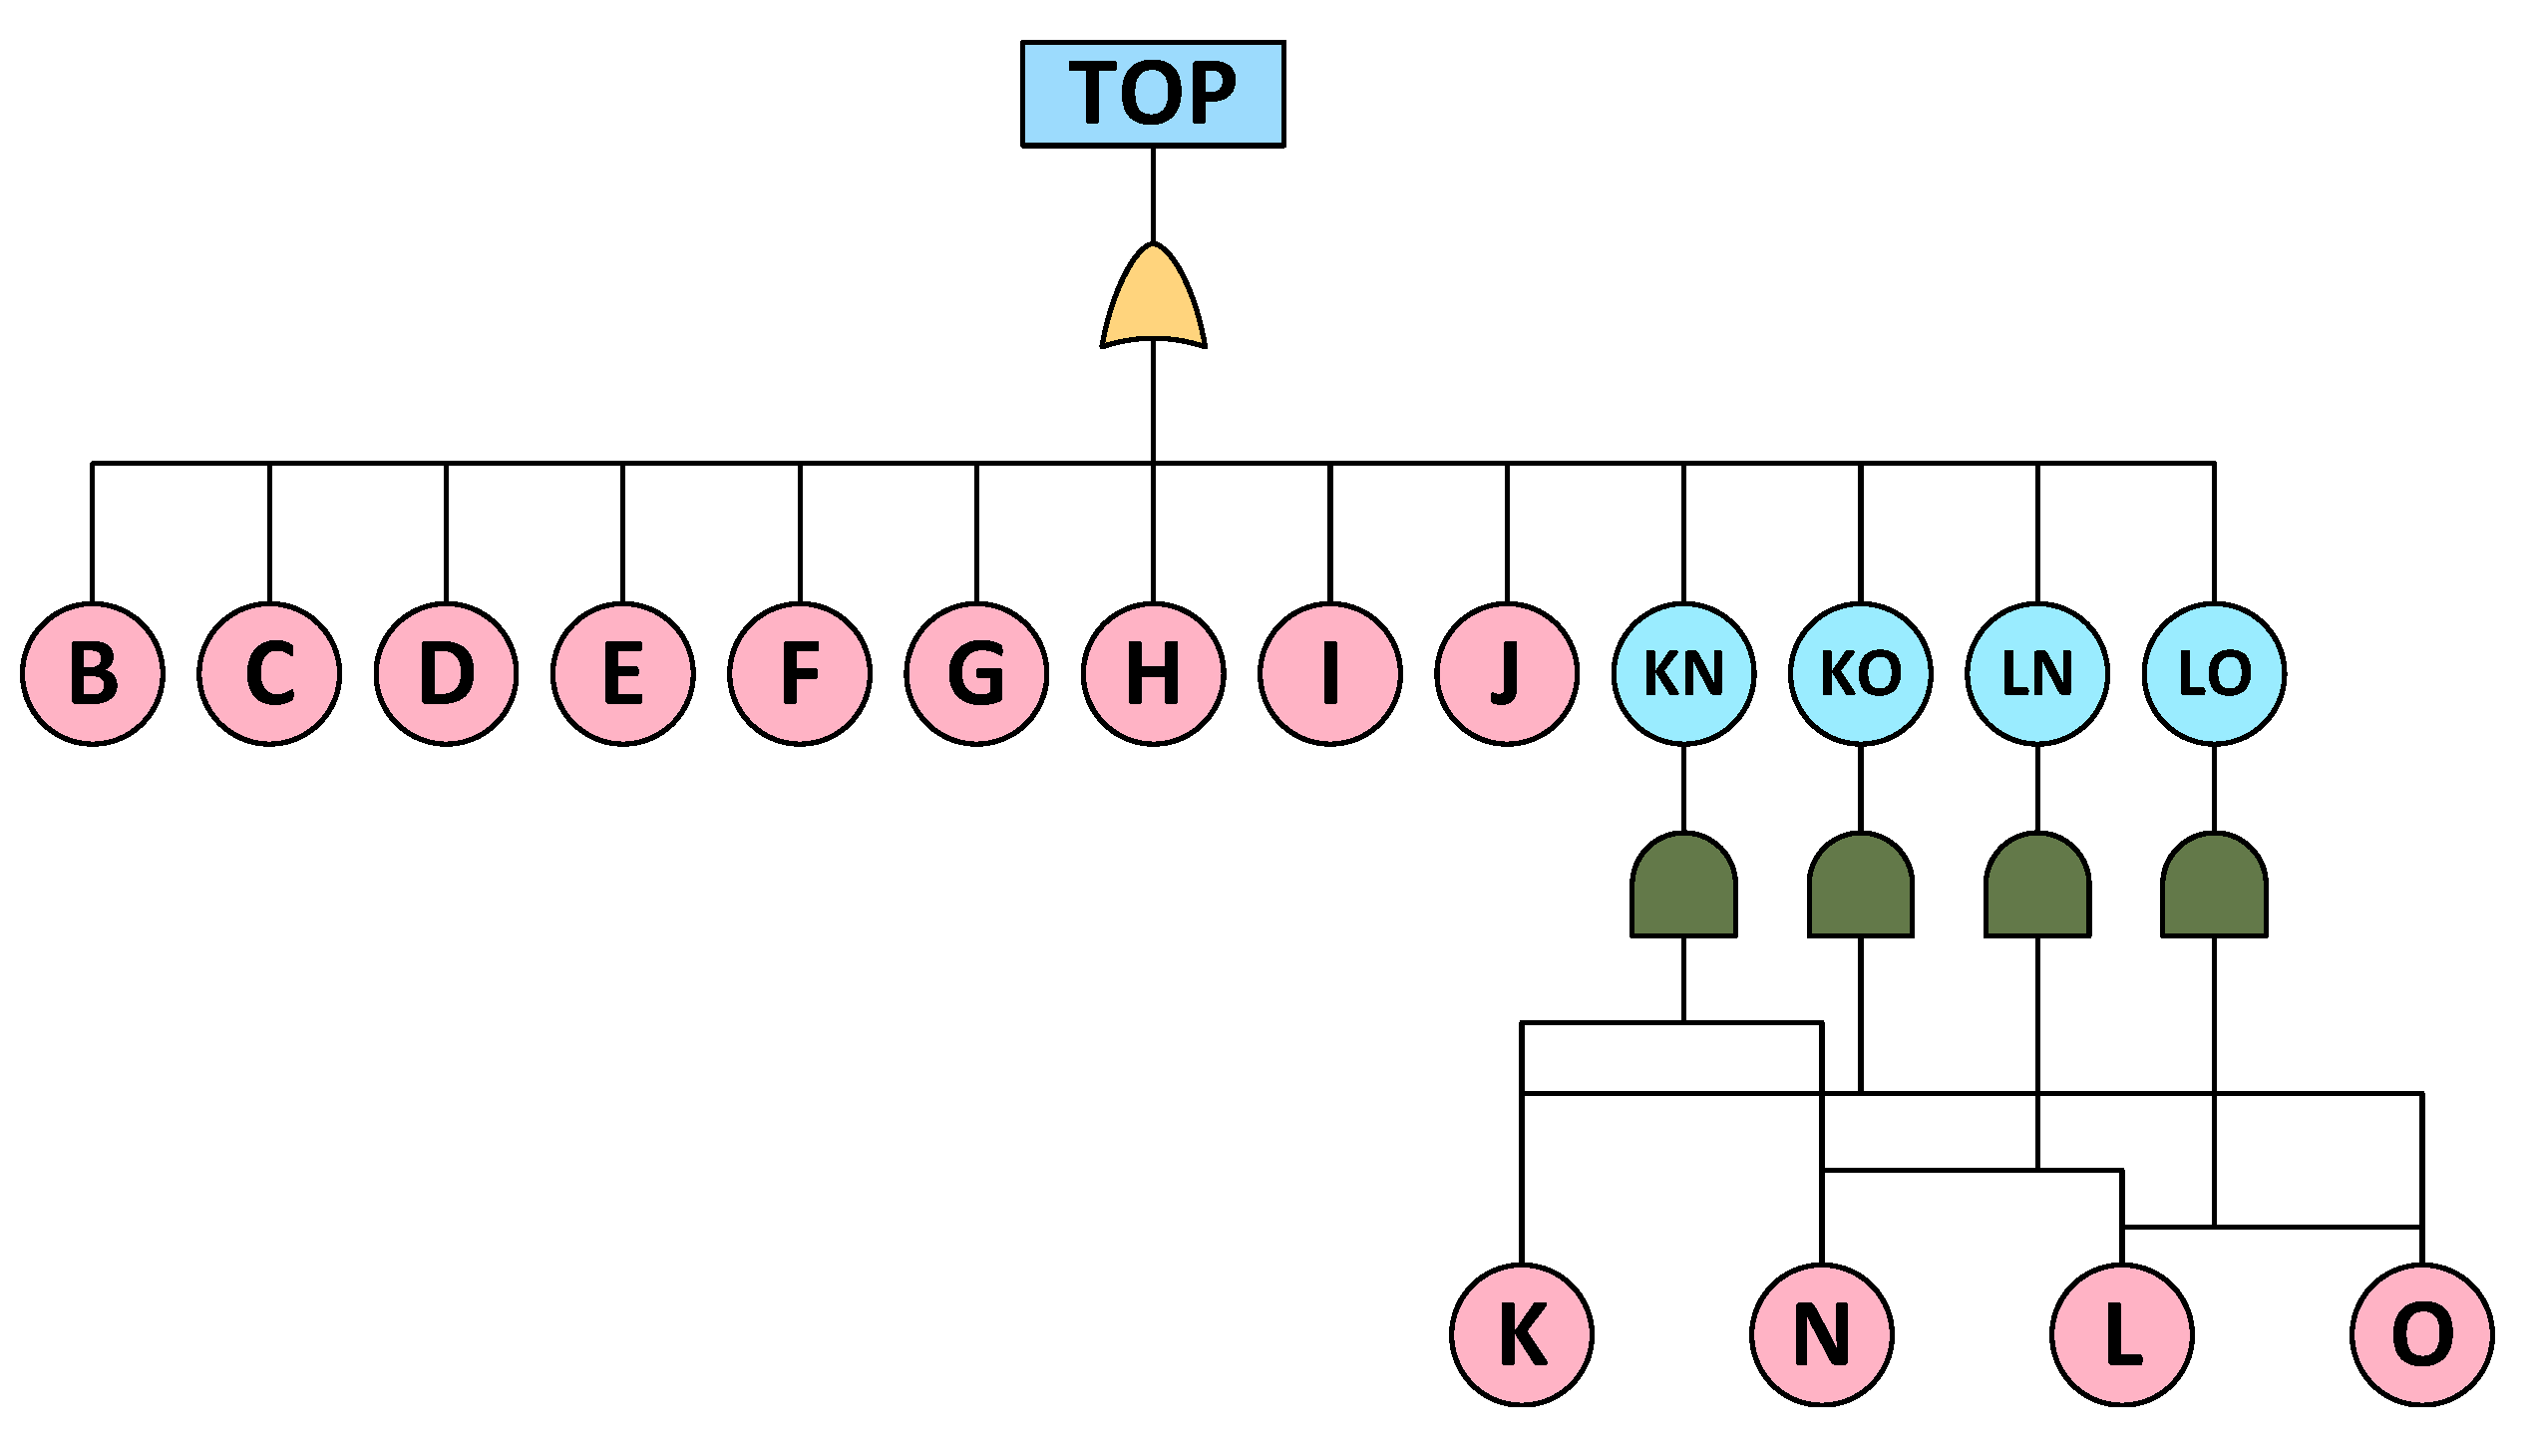
  • To address the redundancy structure and event dependencies in the avionics network, dynamic logic gates are employed to construct a DFT model. In line with practical requirements, certain nodes are removed to reconstruct the simplest fault tree by solving the minimal cut set, thereby reducing the accumulated fuzziness in subsequent quantitative analyses;
  • Considering the unstable characteristics of the avionics network’s failure states and the disparities between events, a triangular fuzzy representation based on relative confidence levels is applied to depict the failure rates of basic events (BEs).
  • To further regulate the fuzzy scale and enhance accuracy, the proposed approach aggregates multisource fuzzy failure probability intervals using the optimized weakest t-norm operator, thereby bolstering the referential reliability of the evaluation results.
The subsequent chapters of this paper are arranged as follows: Section 2 briefly discusses the research progress on avionics network transmission, FTA, and fuzzy set theory; Section 3 elaborates on the analysis methods proposed in this paper; Section 4 considers the A380’s AFDX avionics network as an example to analyze and experimentally study the methods proposed in this paper; and Section 5 summarizes the research findings and provides potential future research directions.

2. Related Work

Based on the main research content of this paper, this chapter discusses the research progress in three aspects: avionics network transmission, FTA, and fuzzy set theory.

2.1. Avionics Network Transmission

Currently, research on avionics network transmission mainly focuses on transmission performance and transmission security analysis.
In terms of transmission performance analysis, Tang et al. proposed a modified trajectory method that calculated the worst-case ETE delay in avionics networks [18]. Finzi et al. introduced a time-sensitive networking shaper combined with a burst-limiting shaper to analyze worst-case timing in avionics networks [19]. Li et al. presented two methods to mitigate the effects of data frame jitter [20]. Ma et al. introduced a time-triggered scheduling method that optimized data frame scheduling strategies and alleviated congestion at output ports [21]. Wang et al. proposed an optimized RSP scheduling strategy (R-RSP), prioritizing different data frames [22].
Regarding transmission security analysis, if avionics networks are connected to ground networks, they are prone to access attacks [23]. Attackers could influence the transmission of information and commands within avionics networks [24]. Kainrath et al. indicated that avionics networks could be attacked by passengers [25]. Predescu et al. further categorized attacks on avionics networks into physical, network, and cyber–physical attacks [26]. They analyzed the types of attackers and threats and provided strategies to enhance avionics network security. Naeem proposed an anomaly-based network intrusion detection system that simulated offline attack traffic [27].

2.2. Fault Tree Analysis

FTA is an event-driven safety analysis method [28], primarily categorized into two methods: static and dynamic FTAs. Within SAP ARP 4761, the fault tree is recommended as an assessment method for avionics system safety [29]. It can trace aircraft-level functional failures back to specific security events at lower levels, emphasizing the relationship between subevents and upper-level events. Traditional FTA includes static logic gates such as AND, OR, and NOT gates. This is typically combined with other quantitative calculation methods. For instance, Nobakhti et al. proposed a hybrid method that combined FTA with Mamdani fuzzy reasoning [30], achieved discrete event simulation without historical data, and assessed system reliability under different operating conditions. Yazdi et al. introduced an approach that integrates fuzzy set theory and evidence theory with Bayesian networks (BNs) to describe system uncertainty and identify the most critical events in FTA [31]. Ung et al. combined FTA with fuzzy BNs to evaluate the risk of human error leading to oil tanker collisions [32].
To model and analyze time-causal relationships and sequence dependencies between events [33], researchers have introduced DFT methods. To compute the dynamic changes in the system’s safety state, attempts have been made to combine data theory with DFT. Höflinger et al. studied the fault impact on spatially distributed onboard computers based on DFT and formalized the modeling of the FDIR software architecture [34]. To enhance the efficiency of quantitative calculations in DFT, various optimization methods have been proposed. Wang et al. faced a vast state space when establishing a Bayesian network based on DFT [35]. Aslansefat et al. introduced a layered solving method based on semi-Markov processes for DFT [36]. Jiang et al. proposed a binary-tree-based DFT modular preprocessing method that partially avoids the issue of state-space explosion [37]. Kabir et al. combined Petri nets with Monte Carlo to improve the model’s solving efficiency [38]. Ammar et al. combined time DFT with a Fourier transform to capture the influence of time on events in the system while avoiding a state-space explosion [39].

2.3. Fuzzy Set Theory

The fuzzy set theory can effectively handle uncertainties in system safety analysis, diverse data types, multisource information fusion, and ambiguities. It provides a flexible, scalable, and intuitive approach. Current research mainly focuses on optimizing expert evaluation models and multisource information fusion.
In terms of optimizing expert evaluation models, intuitionistic fuzzy sets enable experts to hesitate when scoring [40]. Hesitant fuzzy sets further address the unique membership issue in intuitionistic fuzzy sets [41], allowing experts to have multiple memberships and enhancing the ambiguity of the scoring results. Moreover, to facilitate more effective communication between system designers and safety experts, Baklouti et al. proposed a generation algorithm that automatically generates DFT in SysML [42]. Yang et al. introduced a method based on Pythagorean fuzzy sets for uncertainty handling, analyzed the safety status indicators of civil aviation airport security information systems, and established a Pythagorean fuzzy Petri net model based on the indicator system [43]. Żyluk et al. combined expert scores and fuzzy set theory to assess the reliability of aircraft onboard systems [44]. Goncharenko et al. used the Simulink tool to establish a hierarchical tree structure of risks and calculated the quantitative values of flight safety risks using expert scores and fuzzy logic theory [45]. However, these methods employ static algorithms in the aggregation process, and the fuzziness of the initial values is eliminated. Moreover, the expert evaluation method is influenced by multiple subjective factors and inadequately considers uncertainties in real operational environments, enabling a high dependence on expert experience for the analysis results.
Regarding the problem of multisource information fusion, Zhou et al. considered the fuzzy correlation between risk indices and elements using fuzzy event elements [46]. Pan et al. incorporated fuzzy probability into BNs, achieving a reliability assessment of uncertain systems, including predictive, sensitivity, and diagnostic analysis [47]. Li et al. proposed an analytical method that combines fuzzy probability with BNs and realizes the common cause failure analysis of multistate systems [48], further assisting decision-making processes with fuzzy reasoning [49].

2.4. Chapter Summary
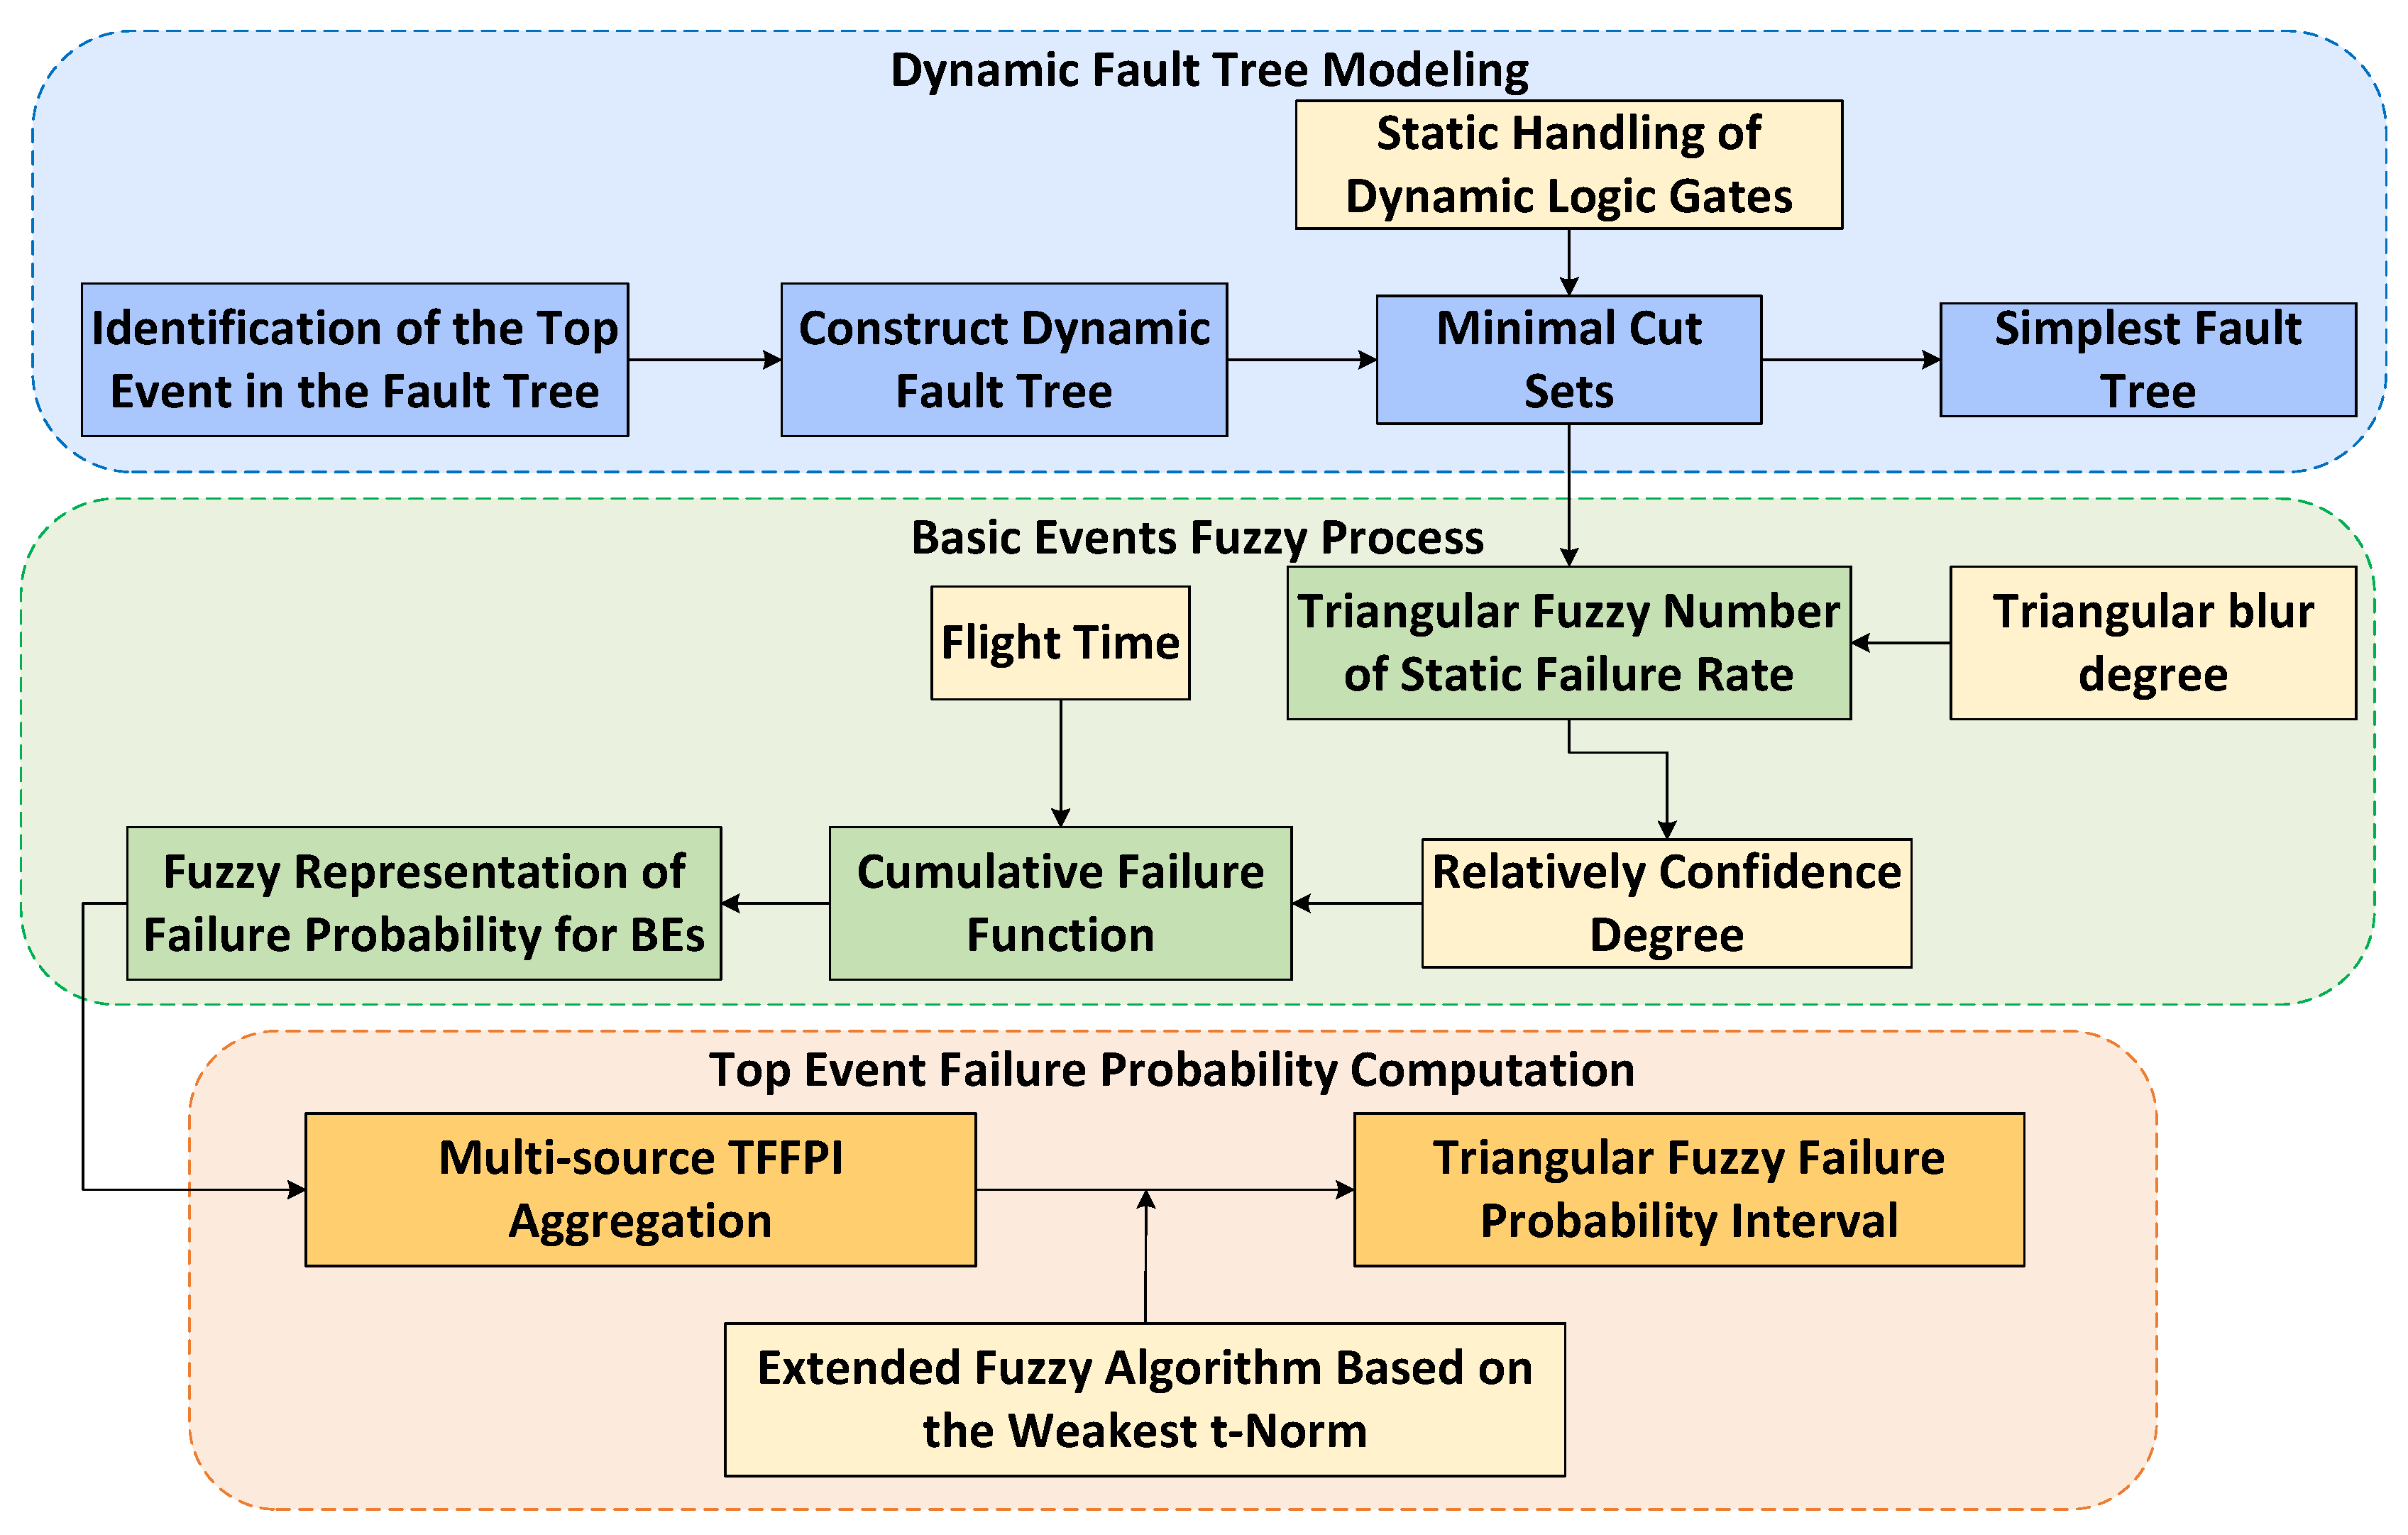
In terms of avionics network transmission, the A380 was the first to use avionics full-duplex switched Ethernet (AFDX) as the avionic data transmission network. Owing to the high bandwidth and security of AFDX, it was accepted by ARINC and became the universal standard ARINC 664 P7 [1]. AFDX has three main safety features: dual-redundant networks, virtual link (VL) allocation, and end-to-end deterministic transmission. As network protocols develop, the openness of the avionic network has gradually increased, and the interconnection between forward and aircraft cabin networks has strengthened [50], potentially leading to increased threat elements for failures. Despite some progress in related research on avionics network transmission, it has primarily focused on performance analysis and threat detection. An in-depth analysis of the avionics network protocol architecture and a study of the impact of specific threats on the overall reliability of the network remain as gaps in the literature.
In the context of fault tree analysis, SAP ARP 4761 [7] does not provide FTA modeling examples for AFDX’s dual redundancy and strong functional dependencies. The inherent limitations of static logic gates do not support modeling these characteristics [51]. The dynamic logic gates of DFT, such as backup, functional dependency, and transfer gates, can be consistent with the requirements of AFDX and reflect its safety requirements. Therefore, the use of DFT to identify potential risk elements and complete a qualitative analysis in transmission failure analysis is reasonable. Although the existing fault tree quantitative analysis intends to mitigate the state-space explosion problem, the intermediate processes are redundant and computationally intensive. Thus, the DFT structure is simplified by solving minimal cut sets to compress the state space.
Regarding the fuzzy set theory, the fuzziness of expert scores is eliminated by existing static algorithms, overlooking the dynamic system requirements. Furthermore, when DFT is combined with fuzzy set theory, due to the inherent hierarchical properties of tree structures, fuzziness accumulates with calculations. While the aforementioned methods consider the calculation of fuzzy probabilities, using simple algebraic addition and subtraction to handle fuzzy probability intervals leads to high accumulated fuzziness. In addition, the consideration of interevent correlations was inadequate, resulting in insufficient accuracy in the evaluation results. Therefore, this study proposes a dynamic interval reliability assessment, considering the fluctuation levels of failure probabilities at different time points while retaining data fuzziness.

3. Proposed Method

In this study, DFT and extended fuzzy algorithms were combined to analyze the failure of avionic network data transmission. Figure 1 illustrates the analytical process of the proposed method. Before modeling with DFT, specific system objects were selected, and the network topology was drawn to further analyze the elements that affect the reliability of avionic network data transmission.

3.1. Dynamic Fault Tree Construction

The top node of the DFT represents specific security events, whereas the leaf nodes represent a BE, causing the top node event to occur. DFT is not only based on strict theoretical foundations but also heavily relies on specific system information [52]. When establishing the DFT for avionic network transmission failure, the definitions in ARINC 664 P7 related to AFDX data structures, transmission processes, and network topology were analyzed. Combined with relevant research [53,54,55], functional safety and information security events leading to transmission failures were identified. The specific tree-building process is described in the case study.
To address the occurrence relationship between hierarchical subevents and the top event, DFT introduces various dynamic logic gates based on static logic gates, considering dynamic causality. These dynamic logic gates include Priority AND (PAND), functional dependency (FDEP), Cold Spare (CSP), Warm Spare (WPS), and Hot Spare (HSP) [56]. The dynamic logic gates, module transition symbols, and special nodes relevant to this study are summarized in Table 1. Notably, diamond-shaped nodes represent “undetermined events”, meaning events that cannot be further analyzed or events for which further analysis is deemed unnecessary and are treated as a BE.
To integrate the computation of dynamic logic gates into the Boolean operations of the minimum cut set (MCS), Xiang et al. proposed an effective method to achieve the static handling of dynamic logic gates [57], which can extend dynamic logic gates to quantitative calculations.
Figure 2 includes three types of logic gates.
The dynamic dependency within the FDEP logic gate is not directly influenced by events, E1 and E2. Instead, it is governed by the Trigger Event (TE) and the TOP. Specifically, under the premise that the TE’s state is well, the operational status of the TOP is contingent upon whether E1 or E2 is normal. However, if the TE fails, the state of the TOP is immediately affected, rendering the statuses of the TOP irrelevant to E1 and E2.
While FDEP illustrates varying degrees of dependency between the top event and its subevents, the occurrence of any TE or basic events (E1 and E2) can lead to the manifestation of the top event (TOP) [58]. This indicates that events connected through FDEP are both parallel and asynchronous. The static handling of FDEP in Boolean operations is expressed by Equation (1):
T O P = T E + E 1 + E 2 ,
In the HSP gate, E1 and E2 act as hot backups for each other, implying that both events operate simultaneously. Only when both E1 and E2 fail will it lead to the occurrence of the top event (TOP). Therefore, the static handling of the HSP gate for Boolean operations is represented by Equation (2):
T O P = E 1 × E 2 ,
The PAND gate is an optimization of the AND gate. However, the PAND gate requires event E1 to occur before event E2, and only when both E1 and E2 occur will it lead to the occurrence of the top event (TOP). Therefore, the PAND computation process considers E2 as a conditional event that occurs only if E1 has happened already. After the static handling of the PAND gate, the Boolean operation is represented by Equation (3):
T O P = E 1 × ( E 2 | E 1 ) ,

3.2. Fuzzy Representation of the Basic Events

In traditional FTA, each quantitative calculation is based on static probability multiplication. However, in many practical engineering scenarios, the uncertainty of the system must be considered. By applying fuzzy set theory to DFT, the uncertainty and fuzziness of events can be comprehensively considered in quantitative calculations. The domain MCS is a set of BEs, and the fuzzy set F corresponding to the domain MCS comprises the BEs in the domain and their memberships μ ( B E ) , as shown in Equation (4):
F = B E , μ B E | B E M C S
In system safety analysis, triangular and trapezoidal membership functions are widely used. The membership calculation function determines the membership value corresponding to the BE. The occurrence probability of the BE is represented by a triangular fuzzy number (TFN), as shown in Equation (5):
T B E = ( m l , m , m + r ) , 0 l , r 1 , B E M C S
where m − l, m, and m + r are the lower, center, and upper bounds of the triangular fuzzy number, respectively. They are used to describe the uncertainty of the occurrence probability of a BE in the DFT. The probability interval of the occurrence of the BE is represented by Equation (6), which provides a specific quantification of the probability range:
P B E = T B E , T B E + = ( m l , m + r )
Equation (7) defines the triangular membership function of the BE, which describes the membership degree of the BE under a given occurrence probability x, where m represents the value when the membership degree is at its maximum:
μ T B E ( x ) = x ( m l ) l , if m l x m ( m + r ) x r , if m x m + r 0 , otherwise
Considering the uncertainty in the occurrence probability of the BE in real scenarios, a confidence variable was introduced. Equation (8) provides the TFN of the BE at a given confidence level:
T B E γ = m γ l , m , m + γ r , 0 l , r 1 , B E M C S
Similarly, the probability range of the BE under a given confidence level γ is represented by Equation (9):
P B E γ = T B E γ , T B E γ + = m γ l , m + γ r
Here is an example: If the failure rate of event T is 1.03 × 10 3 with a fuzzy parameter of 25% on both sides, then l , r = 25 % 1.03 × 10 3 with a confidence level of 95%, the lower bound of the TFN is 7.85375 × 10 4 , and the upper bound is 1.274625 × 10 3 . The membership degree of 1.03 × 10 3 is 1.

3.3. Extended Aggregation of the BE Fuzzy Intervals

Owing to the uncertainty inherent in fuzzy interval elements, when multiple fuzzy intervals must be aggregated, traditional static methods are unsuitable for their aggregation calculation. Existing algorithms for fuzzy numbers can be categorized into two types [59]: standard fuzzy algorithms and extended fuzzy algorithms. The fuzzy numbers aggregated using the standard fuzzy algorithm have a higher level of uncertainty. To obtain analysis results that agree more with reality and more accurately, the extended fuzzy algorithm uses t-norms, Dombi, and Prade conjunction operators based on static algorithms and standard fuzzy algorithms. The t-norm (triangular norm) has good closure and associativity, which is consistent with the requirements of quantitative analysis in DFT and Zadeh’s fuzzy theory. By contrast, the Dombi and Prade conjunction operators involve more parameter choices and are more computationally complex. T-norms include the minimum t-norm, the product t-norm, and the weakest t-norm, etc. Because the t ω operator (the weakest t-norm) has good stability during the aggregation process, it can effectively reduce the accumulated fuzziness in calculations [60].
Equation (10) represents the general form of the extended fuzzy algorithm based on t-norms. In it, F 1 x and F 2 y are two input fuzzy numbers, and C z is the resulting output after fuzzy number operations. ⊛ represents any of the four fuzzy operations, and on the right side of the equation, ∗ represents any of the four arithmetic operations on real numbers:
C z = F 1 x F 2 y = sup z = x y t ω F 1 x , F 2 y
In DFT quantitative calculations, when it is necessary to aggregate the occurrence probabilities of BEs to calculate the occurrence probability P (TOP) of a top-level event, two probability algorithms are typically involved: (1) probability multiplication and (2) probability addition. When the BEs are independent of each other, aggregation algorithms are defined using Equations (11) and (12):
P A N D T O P = i n P B E i
P O R T O P = 1 i n 1 P B E i
If the value of the failure probability variable χ within its TFN is continuous rather than discrete, the TFN transforms into a triangular fuzzy failure probability interval (TFFPI). Equation (13) represents multiple TFFPIs corresponding to multiple events, with the aggregated output being a top-level event (TOP). Because the TFFPI inherits the closure property of the TFN algorithm, P(TOP) will still be expressed in the form of the TFFPI:
T 1 ˜ = m 1 l 1 , m 1 , m 1 + r 1 : l 1 , m 1 , r 1 0 , T 2 ˜ = m 2 l 2 , m 2 , m 2 + r 2 : l 2 , m 2 , r 2 0 , T n ˜ = m n l n , m n , m n + r n : l n , m n , r n 0
The aggregation methods for the “AND gate” and “OR gate” are given by Equations (14) and (15), respectively. To further improve the accuracy of the aggregation results, the relative confidence of the triangular failure rate interval for BEs was introduced. The relative confidence is defined as the relative length ratio between the BE that has the largest length of failure rate and the other BE.
Relative confidence is defined as the ratio of the length of a given BE to the length of the BE with the largest length:
P ˜ T O P A N D t ω = T 1 ˜ t ω T 2 ˜ t ω T n ˜ = m 1 l 1 , m 1 , m 1 + r 1 t ω m 2 l 2 , m 2 , m 2 + r 2 t ω m n l n , m n , m n + r n = j = 1 n m j max i = 1 , i j n l i · j = 1 , j i n m j , j = 1 n m j , i = 1 n m i + max i = 1 , i j n r i · j = 1 , j i n m j
P ˜ T O P O R t ω = 1 1 T 1 ˜ t ω 1 T 2 ˜ t ω 1 T n ˜ = 1 m 1 l 1 , m 1 , m 1 + r 1 t ω m 2 l 2 , m 2 , m 2 + r 2 t ω m n l n , m n , m n + r n = 1 j = 1 n 1 m j max i = 1 n l i · j = 1 , j i n 1 m j , 1 j = 1 n 1 m j , 1 j = 1 n 1 m j + max i = 1 n r i · j = 1 , j i n 1 m j
To determine the accuracy of the TFFPI and rank the importance of BEs, it is essential to defuzzify the TFFPI. This involves deriving a representative value from a dynamic set of values to characterize the overall status of the data. Among the methods for defuzzification, the center of gravity (COG) is particularly notable. The COG method uses the ratio of the area integrals to determine the representative value within the interval, thereby removing the ambiguity inherent in fuzzy numbers. If T ˜ = r 1 , r 2 , r 3 : r 1 , r 2 , r 3 0 represents a TFFPI, the process of the COG simplifies when applied to the TFFPI, as shown in Equation (16):
C O G T ˜ = 1 3 r 3 + r 2 2 r 3 · r 2 r 1 + r 2 2 + r 1 · r 2 r 3 r 1
Given that the failure probability is one-dimensional, the Euclidean distance between the defuzzified value and a constant failure probability can be computed to assess the accuracy of the fuzzy failure interval. For a constant value S and a defuzzified value of a TFN C O G T ˜ , the method for computing the Euclidean distance is represented by Equation (17):
Δ Euclidean = S 2 + C O G T ˜ 2
This study employs the Birnbaum algorithm to calculate event importance. Birnbaum’s importance, also known as probability importance, posits that the sensitivity of the system’s operational failure probability to the component failure probability reflects the importance of the corresponding component. Thus, the calculation of the Birnbaum importance for a BE in FTA is shown in Equation (18):
Δ B i r n b a u m = P T O P | B E = 1 P T O P | B E = 0
where BE = 1 indicates the occurrence of the BE, and BE = 0 denotes that the BE does not occur or has a probability of zero. Birnbaum’s importance signifies the difference in the top event (TOP) occurrence probability given the assumption of BE occurrence and the TOP occurrence probability given the assumption of BE nonoccurrence. A higher importance value for the BE indicates that it holds a relatively more critical position within the set of all BEs. Consequently, the paths in DFT connected to this BE must be further emphasized.

4. Case Studies

4.1. Experimental Object

To validate the proposed method through empirical analysis, this study refers to the failure of the A380 avionic network as the research subject. The core topology structure is illustrated in Figure 3. Within this topology, five AFDX switches exist. Two switches can form a redundant network group based on the system configuration, which is highly integrated with applications such as EFISs, FMSs, and FCSs. The application terminals have independent AFDX end systems, and data from multiple end systems are integrated into a single AFDX switch for transmission based on the system configuration.
The AFDX network was designed using a dual-redundancy mechanism. When a sender sends a data packet, it simultaneously generates a redundant packet. The internal effective data within this redundant packet were identical to those of the original data packet. These two packets are then transmitted through Networks A (ES1-Sw1-Sw2-ES4) and B (ES1-Sw1-Sw4-ES4). If a network node (such as a switch or data link) within either Network A or B fails and causes the data packet to be lost, the duplicate packet in the working redundant network can continue to be transmitted, ensuring that the data reach the receiving end.
However, although this redundancy design enhances the reliability of AFDX data transmission, it also introduces potential ways in which associated components can fail.

4.2. Experimental Design

This study conducts a case study of the proposed method through DFT modeling, BE fuzzy probability intervals, and the aggregation of BE failure probabilities. Failure probability was selected as the reliability evaluation metric. In multisource probability aggregation, comparisons are made among the static TFN aggregation based on the t min operator; the traditional t ω operator-expanded fuzzy aggregation; and the method proposed in this paper, which is based on relative confidence optimization with the t ω operator-expanded fuzzy aggregation.
In the quantitative analysis section, this study combines the SAE ARP 4761 standard [7], a reasonable order of magnitude, and expert opinions to set the failure rate of the BE. When fuzzifying the failure rate, the left and right fuzzy parameters were set to 20% and 25% [61], respectively. The fuzziness range of this TFN was relatively small. To ensure the accuracy of the sampling calculation, the BE with the maximum length of the Triangular Fuzzy Failure Rate Interval (TFFRI) is set to an initial confidence level of 95%. Simultaneously, the relative confidence levels of other BEs are calculated based on the initial TFFRI length.
In this experiment, the 9.0 h flight mission was divided into the following segments: (1) take off and climb: 0–1.5 h; (2) cruise 1: 1.5–4.6 h; (3) cruise 2: 4.6–7.6 h; (4) descent and approach: 7.6–8.5 h; and (5) landing: 8.5–9.0 h.
The specific tasks accomplished by the AFDX in a full flight mission are as follows:
  • Preflight: configuring the avionics network settings and verifying that the AFDX data bus is fully operational and ready for deployment.
  • Take off and climb: Ensuring real-time data transmission with minimal latency for critical systems. This includes transmitting flight state data from sensors and accessing historical reference information from the onboard database.
  • Cruise, descent, and approach: continuously monitoring and managing data flow to maintain consistent performance and reliability throughout these phases.
  • Landing: providing dependable communication to support landing procedures and facilitating fault detection.
  • Post-flight: Collecting and analyzing data for maintenance and troubleshooting purposes.
To sum up, during each phase in a full flight mission, the AFDX avionics network plays a crucial role in flight data transmission through a dual-redundancy mechanism. The AFDX is designed to meet stringent requirements for real-time communication, high bandwidth, and low latency. By leveraging AFDX network redundancy and predicting optimized failure probability intervals, the reliability of the AFDX is enhanced, ensuring robust metrics from the initial design phase through regular maintenance and fault tolerance.
The experimental environment for the fuzzy aggregation of multisource failure probabilities was the Windows operating system. The algorithm was primarily implemented using Python 3.8, with PyCharm serving as the integrated development environment. The computer system was equipped with an Intel(R) Core(TM) i5-10505 CPU @ 3.20 GHz processor, 16 GB of RAM, running specifically on the Windows 11 Pro 22H2 operating system.

4.3. Results Analysis and Discussion

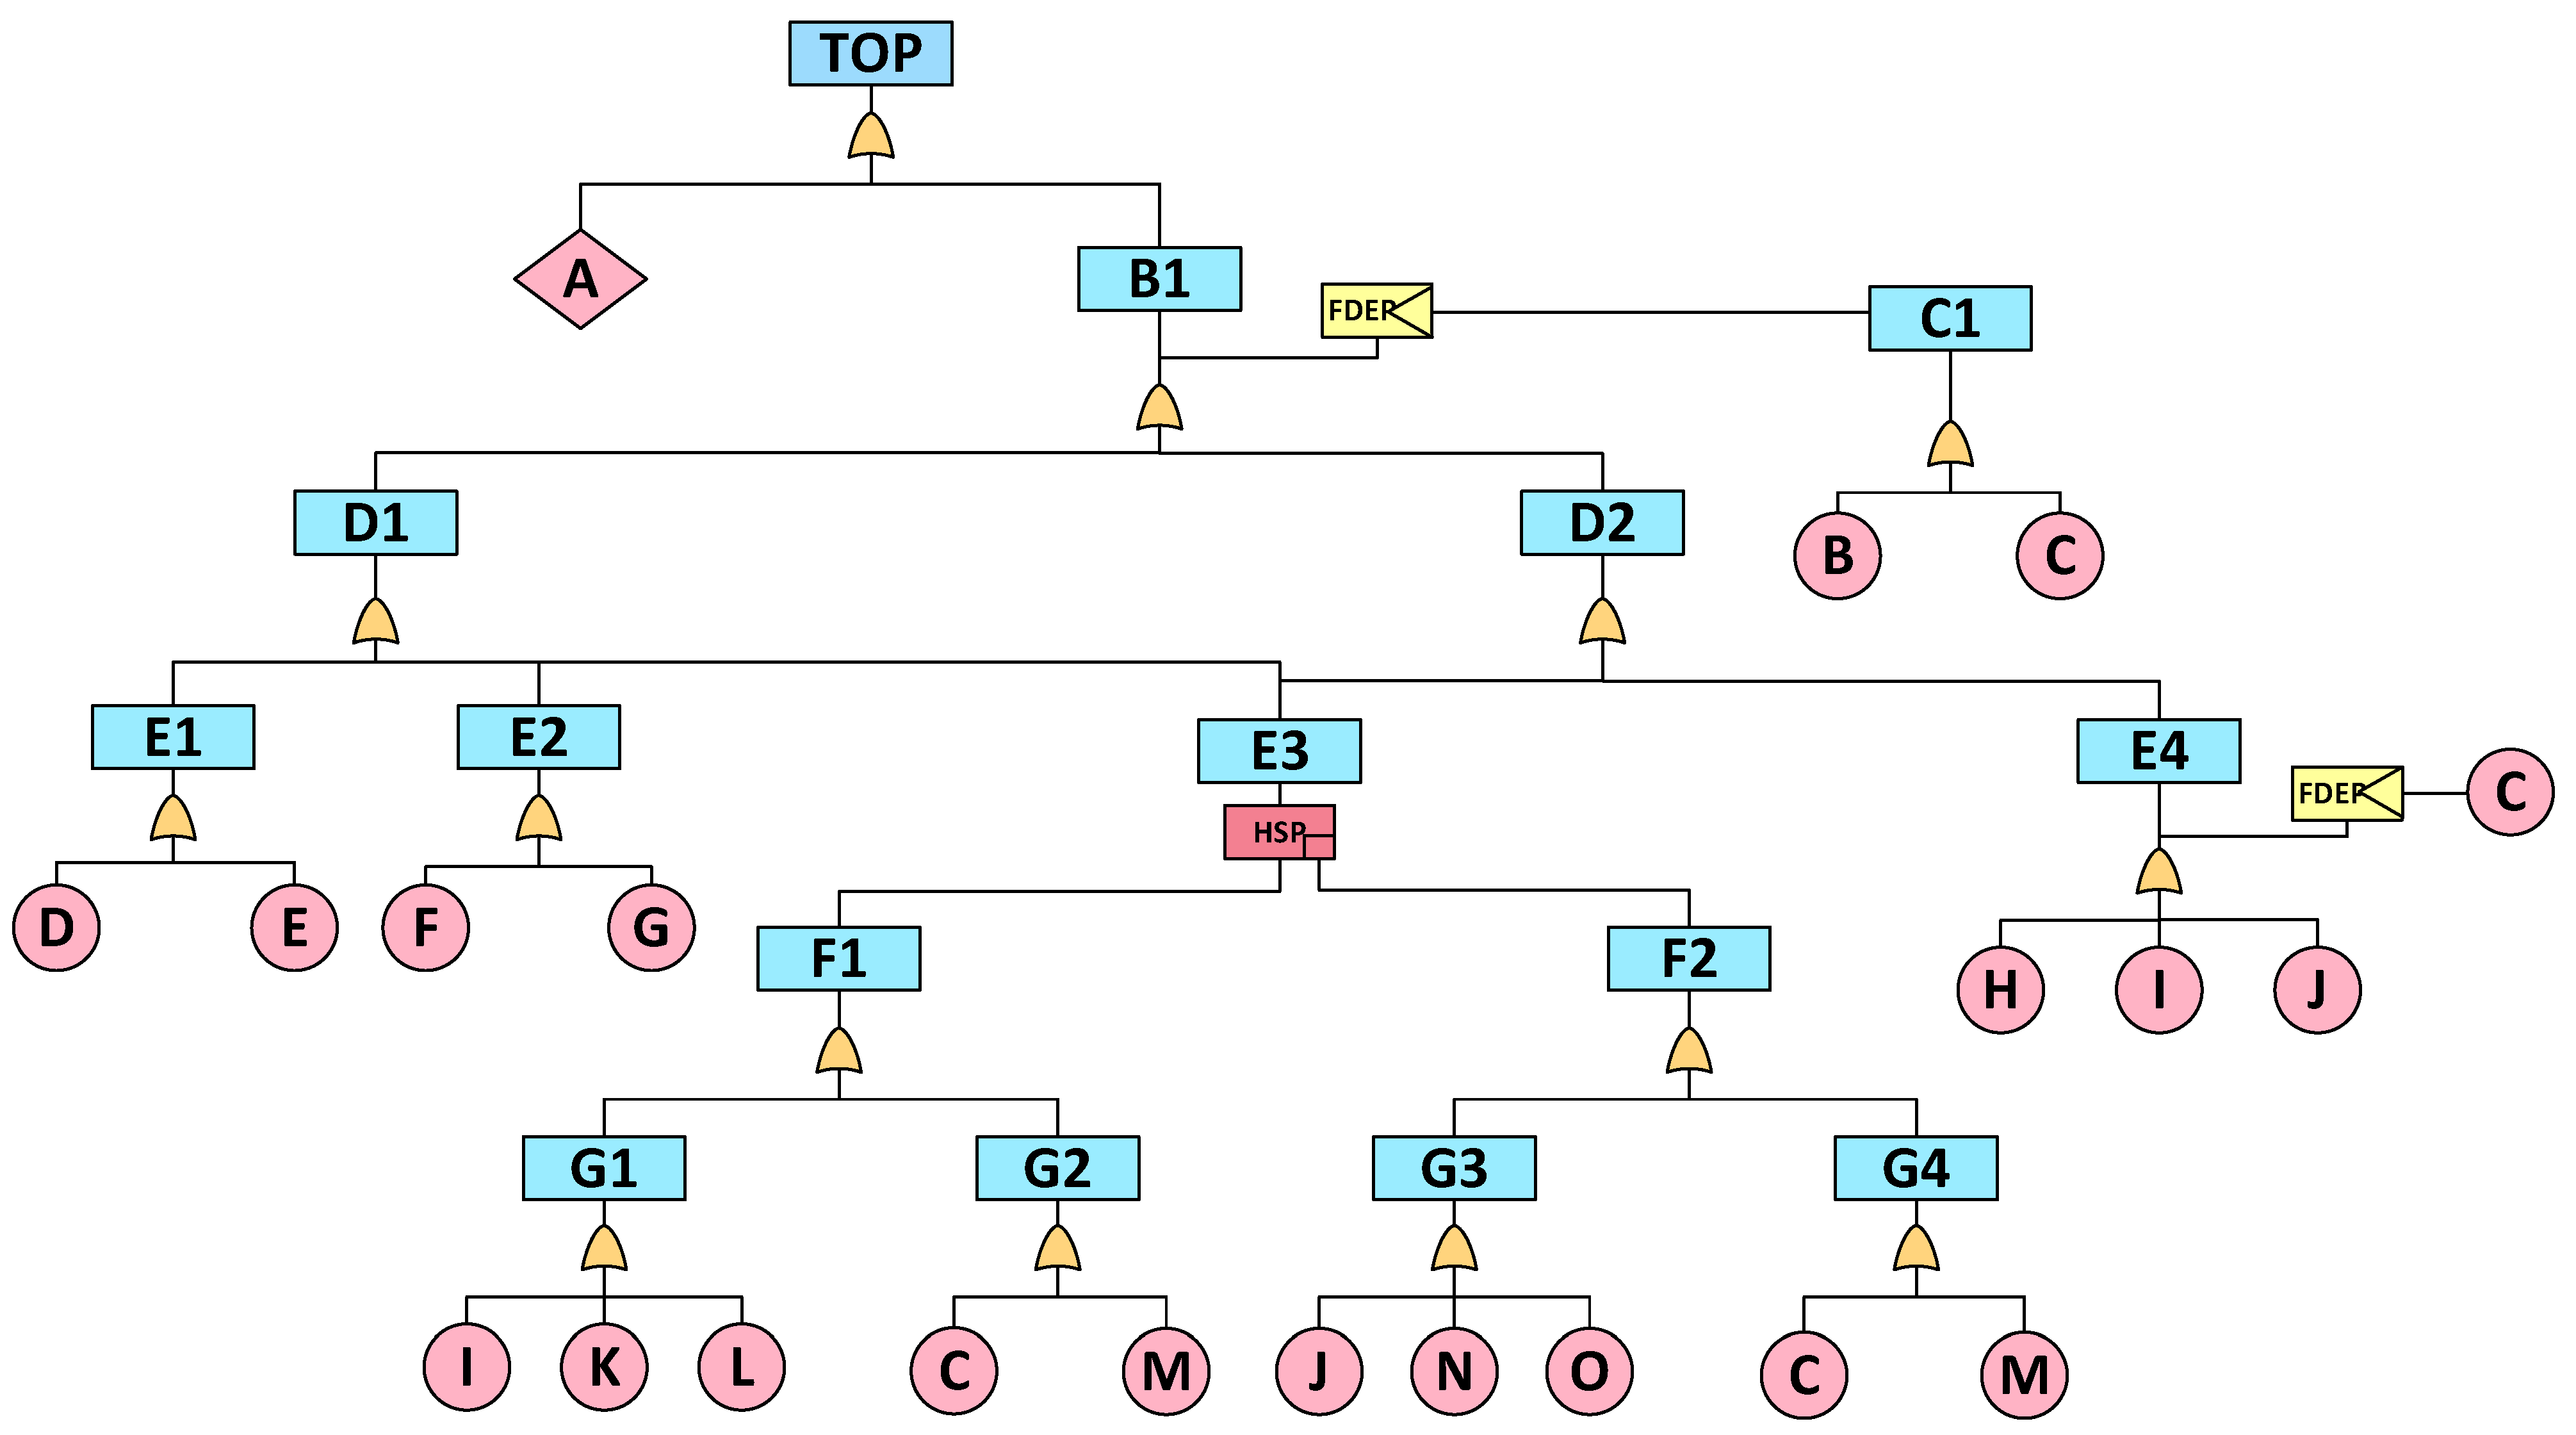
4.3.1. Transmission Failure Dynamic Fault Tree

Using AFDX data transmission failure as the top event in the DFT and considering both functional safety and information security, the DFT was established, as depicted in Figure 4. The symbols are listed in Table 2. Functional dependency relationships are connected using the FDEP gate, whereas the dual-redundancy network relationships are linked through the HSP gate, indicating that both redundant networks must fail for the higher-level node to fail.
To qualitatively describe the relationships of all nodes within the DFT, Boolean operations were initially used to establish the dependencies between each upper-level event and the lower-level events and to solve the MCS of the TOP within complex DFT. The MCS represents the most concise form of dependency between all basic events and the top event, serving as the foundation for building the simplest FT and computing quantitative failure probability.
The initial Boolean logic operation process for the TOP is represented by Equation (19):
T O P = A + B 1 ,
Because A’s safety mechanisms, such as complete verification, flow filtering, and data frame sequence checks, actively discard erroneous packets without causing security impacts on the system, A is not considered in the MCS calculation. In addition, the aging of equipment M was not considered. Therefore, it can be simplified to Equation (20):
T O P = B 1 ,
The dynamic logic gates involved are FDEP and HSP. The two FDEP dynamic relationships in the DFT can be expressed using Equations (21) and (22):
B 1 = C 1 + D 1 + D 2 ,
E 4 = C + H + I + J ,
The dynamic relationship between E3, F1, and F2 connected by HSP is represented by Equation (23):
E 3 = F 1 · F 2 ,
After the Boolean logic operations, the simplified Boolean expression for the TOP is represented by Equation (24). The MCS for the DFT of the TOP is represented by Equation (25):
T O P = B + C + D + E + F + G + H + I + J + K N + K O + L N + L O ,
B , C , D , E , F , G , H , I , J , K , N , K , O , L , N , L , O ,
The simplified FT based on the MCS is shown in Figure 5, which consists of 13 BEs. This avoids redundant calculations caused by duplicate events. Moreover, when calculating the failure probability of the TOP node, the AFDX transmission failure DFT contains six layers of aggregation calculations. However, the simplified FT contained only two layers of aggregation calculations. Therefore, removing the intermediate nodes of the DFT can reduce the accumulation of ambiguity layer-by-layer, making the failure probability interval of the TOP more compact.
The simplified FT excludes dynamic logic gates. However, because of the static treatment of dynamic logic gates, this does not compromise the dynamic characteristics of the complete DFT. This forms a qualitative basis for uncertainty calculations.

4.3.2. BE Failure Probability Fuzzy Interval

Based on the experimental parameters, the static TFFRI for the BE and the TFFRI interval with relative confidence are listed in Table 3. The TFFRI for event L was the longest at 0.02538, and its initial confidence level was set to 95%.
The provided text discusses the modeling of the failure state of system components using specific failure distribution functions. If the failure probability is a function of time, the failure probability at a specific time point can be computed using appropriate probabilistic algorithms. Because of its good fitting properties, the exponential distribution is widely used in reliability distributions. The exponential distribution exhibits memorylessness, which means that the failure rate is a constant real number. Equation (26) represents the Cumulative Distribution Function (CDF), where x is the random variable, and in this study, it represents time:
F ( x ) = 1 e λ x , x 0 0 , x < 0 ( θ > 0 ) ,
Utilizing the lower bound, maximum membership value, and upper bound of the TFFRI for the BE as inputs for the exponential distribution CDF, the TFFPIs for each BE at various time points under static and relative confidence levels were calculated. For instance, at 1.5 h, the static failure probability intervals and those at a 95% initial confidence level for event L are [0.0654405, 0.0811202, 0.1003505] and [0.0662308, 0.0811202, 0.0993986], respectively. Event D, with a relative confidence level of 41.099%, has static failure probability intervals and relative failure probability intervals of [0.0288555, 0.0359383, 0.0447192] and [0.0330336, 0.0359383, 0.0395569], respectively. The computation method for failure probability intervals for other time points and BEs follows a similar rationale.

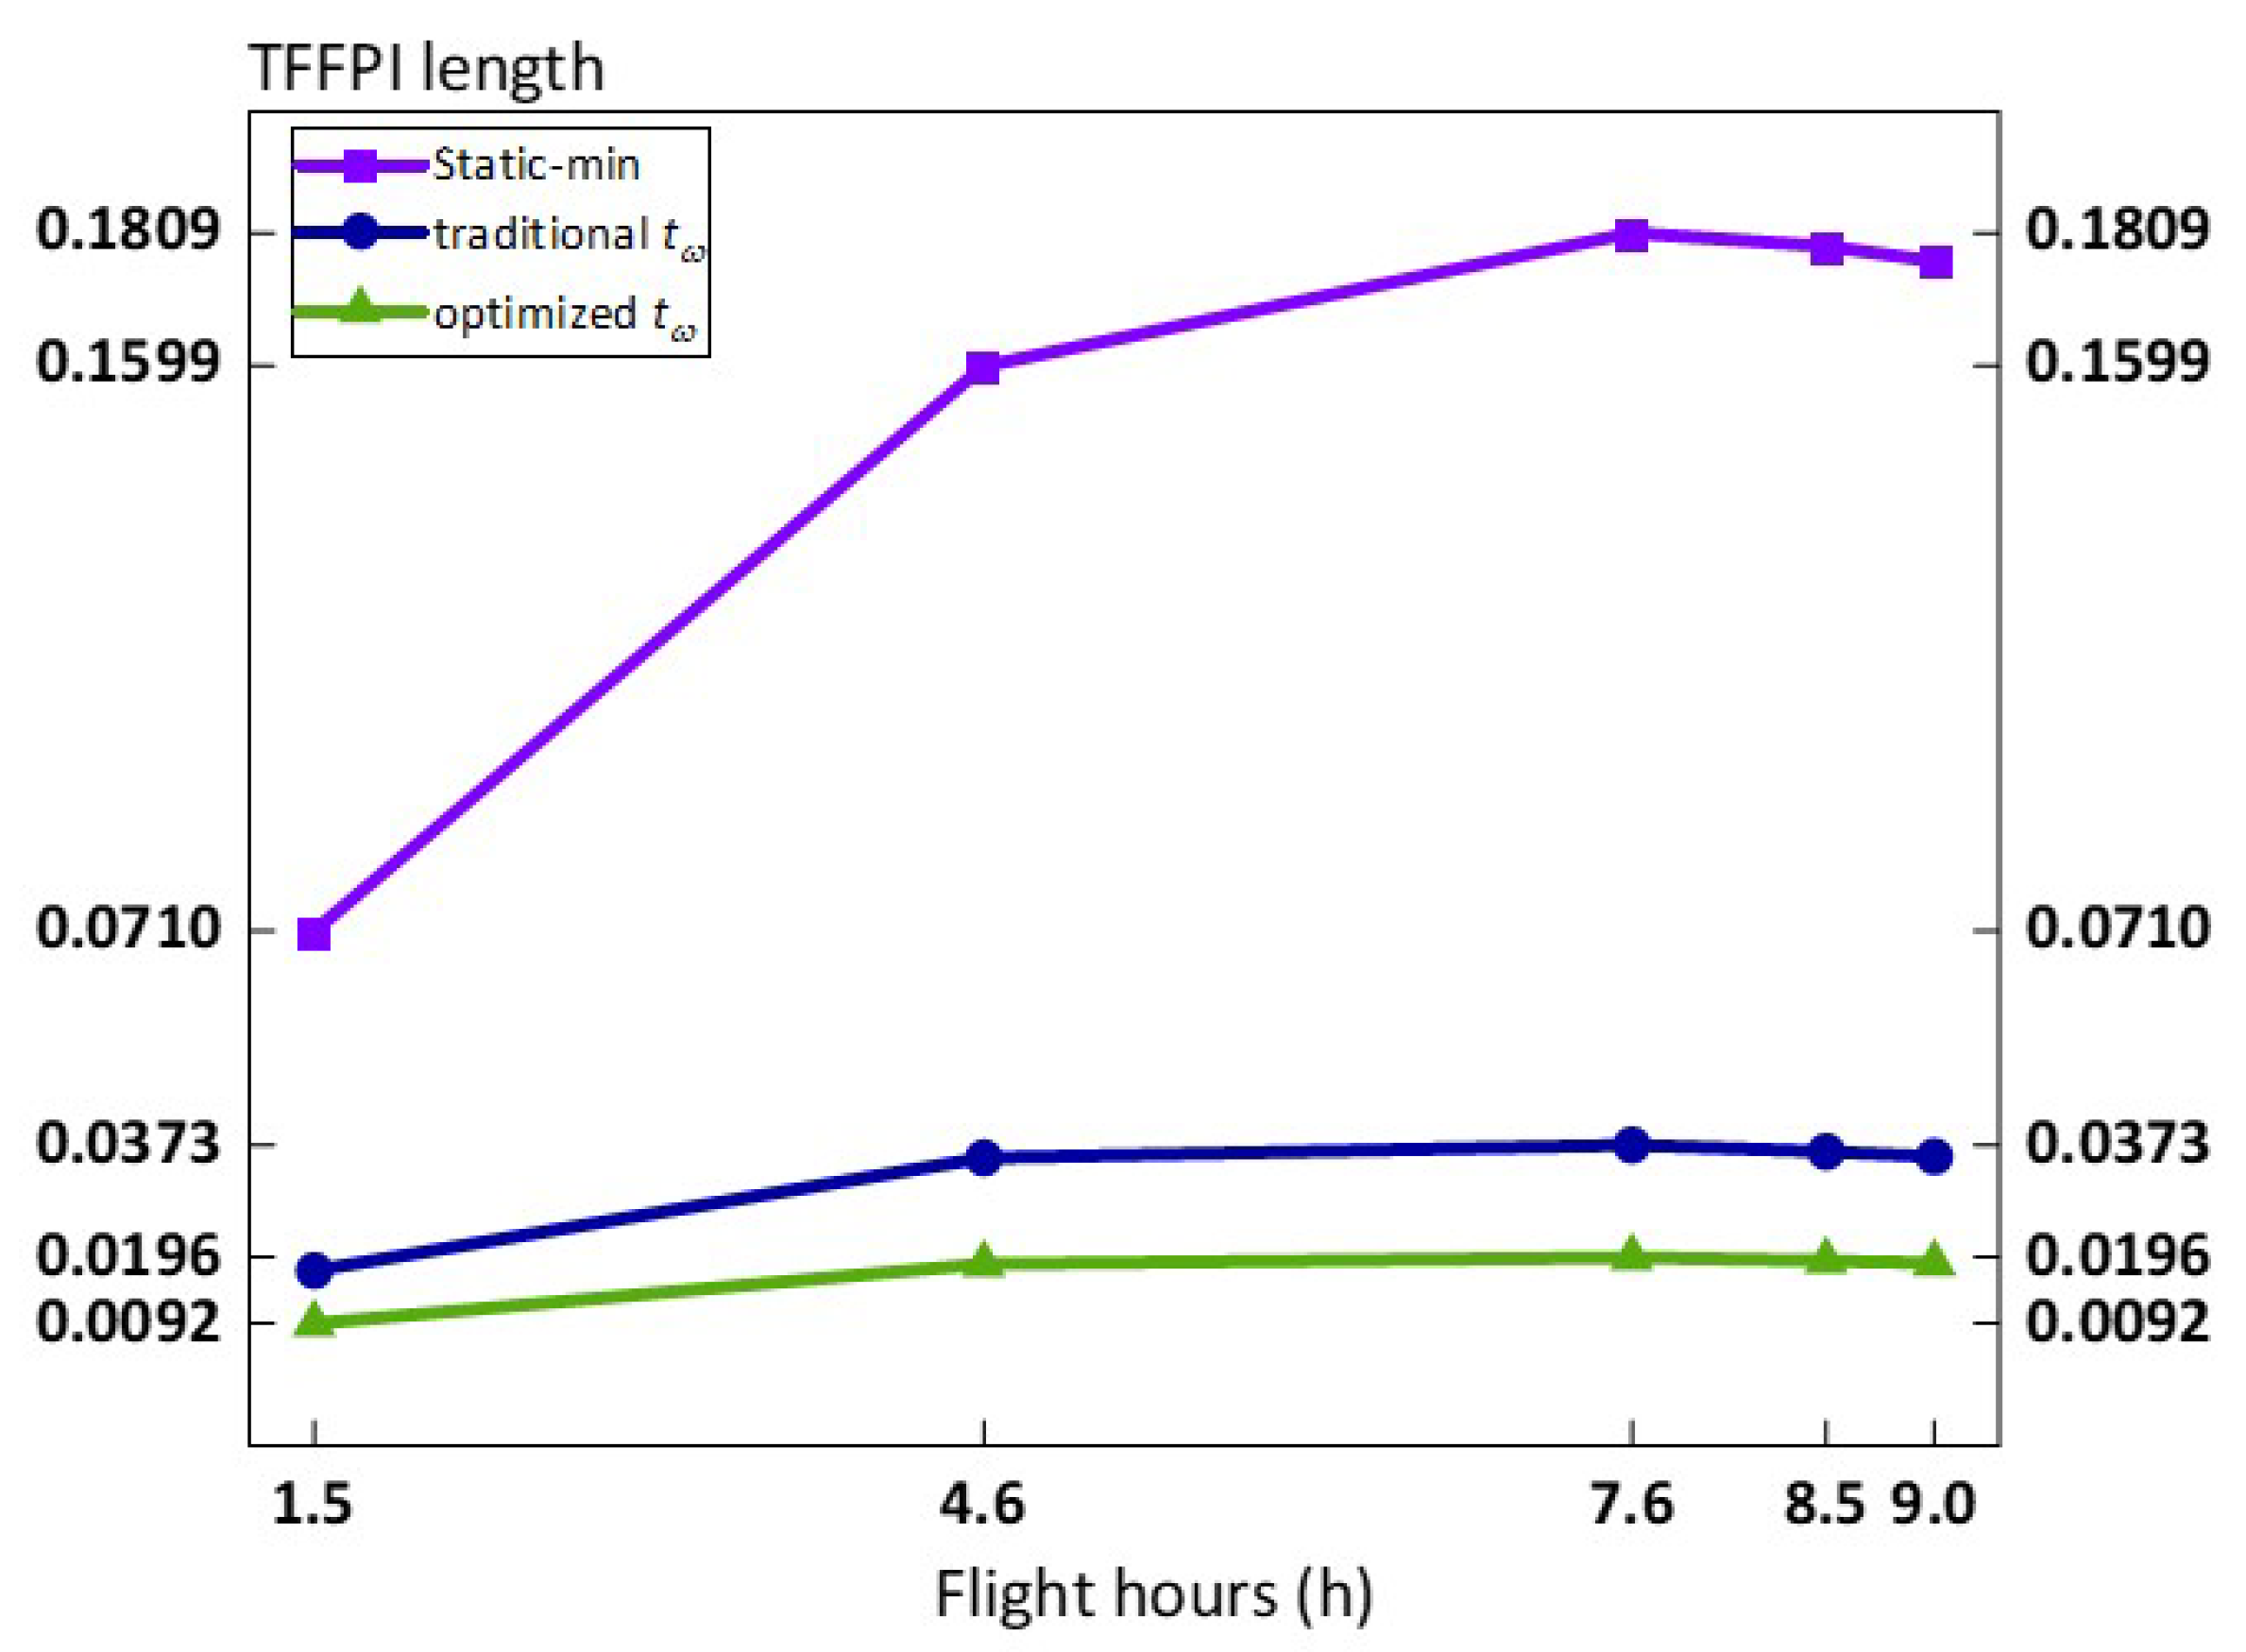
4.3.3. Failure Probability Aggregation and T-Norm Effects

At a given time point, components corresponding to different BEs operate under various conditions, face different threats, and have different failure probabilities. However, all of them might lead to the failure of AFDX data transmission. Therefore, multisource extended aggregation was performed on these 13 BEs.
Based on the dependency and MCS solved previously, the TOP failure probability computation is executed. When all BEs occur (BE = 1), the top event aggregation TFFPI and COG defuzzified values at five time points are obtained. These values are calculated using three different operators: the static t min operator, the traditional t ω operator, and the optimized t ω operator under relative confidence, as shown in Table 4.
The quantitative failure probability interval computation process, according to the three extended fuzzy algorithms, requires time points to serve as the parameters of the failure probability interval of each basic event. At each time point, the TFFPI of the TOP is determined by aggregating the TFFPI of the basic events within the MCS.
Since the TFFPI is derived from fuzzifying the constant failure probability after extending it from the static state, the constant failure probability value falls within the output interval of the extended fuzzy algorithm. If the constant failure probability lies outside this interval, the result will be considered incorrect. This ensures the validity and accuracy of the TOP failure probability computation within the context of the extended fuzzy algorithms.
According to the static probability theory calculation, the constant failure probabilities at the five time points were 0.1665012, 0.4516913, 0.6486323, 0.6943245, and 0.717369. In reality, the failure probability of a BE is often influenced by multiple factors. If the failure probability of a certain BE fluctuates within the range of the TFFPI, the failure probability of the TOP will also change accordingly.
The t-norm extended fuzzy algorithm ensures that the failure probability of the TOP ultimately falls within the TFFPI range. However, the initial constant failure probability calculations did not account for such fluctuations and dependencies. By incorporating the extended fuzzy algorithm, the model provides a more accurate and realistic representation of the AFDX transmission failure probabilities, reflecting the dynamic nature of the influencing factors over time.
Figure 6 presents a comparison of the lengths of the aggregated TFFPI for the three methods. As flight hours increase, the minimum t-norm operator consistently shows the highest value, indicating the greatest degree of fluctuation. The TFFPI length for the traditional t ω operator remains relatively low and is centered around the constant failure probability. The optimized t ω operator based on relative confidence levels aligns better with the real-world scenario, where different confidence levels correspond to different failure rates. Consequently, it further reduces the degree of fluctuation in the fuzzy interval.
Calculating the average length of the top event TFFPI, the static t min operator, traditional t ω operator, and optimized t ω operator under relative confidence are 0.1533828, 0.0323719, and 0.0170500, respectively.
The three TFFPI results of the TOP are shown in Figure 7, where RC represents relative confidence. Among them, the static t min operator result has the largest fluctuation and the TFFPI of the relative confidence-optimized t ω operator has the smallest fluctuation, i.e., the degree of ambiguity is the smallest.
Using the COG method, the representative value of each TFFPI was computed. The Euclidean distance between each representative value and the constant failure probability was then calculated and is presented in Table 5.
The average Euclidean distance rankings were as follows: static-minimum t-norm > traditional weakest t-norm > relative confidence-optimized weakest t-norm. The accuracy of the relative confidence-optimized weakest t-norm improved by 66.15% compared to the static-minimum t-norm and by 40.59% compared to the traditional weakest t-norm.
Further, based on the COG defuzzification value, the relative importance BEs were calculated using 7.6 h as an example. The Birnbaum importance and ranking results of BEs for the constant failure probability and the three aggregation methods are shown in Table 6.
The discriminative results indicate that the importance ranking of BEs within the MCS remained consistent across the four failure probability aggregation methods at 7.6 h. Moreover, the BE importance ranking was consistent at the other four time points. According to the above experimental results, the relative confidence-optimized weakest t-norm operator enhances the accuracy of the TFFPI without compromising the objective importance priority of BEs.

5. Conclusions

In this paper, a DFT model for transmission failure in civil aircraft avionics networks based on an optimized extended fuzzy algorithm is introduced. Initially, a DFT is established by removing self-protection mechanisms and equipment aging, followed by solving the minimal cut set representing the correlation of basic events. Subsequently, the failure rates are triangularly fuzzified based on relative confidence levels to represent event disparities. Finally, by optimizing the weakest t-norm, the fuzzy scale of the failure probability interval is controlled to enhance the referential reliability of the assessment results. At five flight time points, the proposed method provides more accurate fuzzy intervals for failure probabilities while maintaining the ranking of event importance. In summary, the uncertainty of risk using fuzzy theory and control of the fuzzy scale using the optimized weakest t-norm is described. Decision makers can deploy limited defense resources to cover uncertain risks, avoiding generalized resource deployment.
The proposed method is currently applicable for offline AFDX data transmission failure analysis. One of our future works is to use the lower-level DFT as a modular input for hierarchical DFT, reducing redundant calculations. Additionally, the computational workload in this paper remains significant, and computing resources are valuable in the “online” state of avionics systems. Therefore, based on this work, the next step is researching how to apply game theory to security analysis in avionics networks, aiming to find a utility-maximizing strategy for attack and defense, achieving dynamic target defense online, and improving the overall security of flight missions.

Author Contributions

Conceptualization, Z.G. and Y.Z.; methodology, Y.Z.; software, Y.Z.; validation, Y.Z. and H.S.; formal analysis, Y.Z.; investigation, Y.Z.; resources, H.S.; data curation, Y.Z.; writing—original draft preparation, Y.Z.; writing—review and editing, Z.G., Y.Z. and H.S.; visualization, Y.Z.; supervision, Z.G.; project administration, H.S.; funding acquisition, Z.G. All authors have read and agreed to the published version of the manuscript.

Funding

This research was funded by National Natural Science Foundation of China under Grant U2333201, Fundamental Research Funds for the Central one Universities of Civil Aviation University of China under Grant 3122023033, and Security Capacity Building Foundation of Civil Aviation of China under Grant PESA2022093.

Data Availability Statement

The original contributions presented in the study are included in the article further inquiries can be directed to the corresponding author.

Conflicts of Interest

The authors declare no conflicts of interest.

References

  1. Aeronautical Radio Inc. ARINC 664: Aircraft Data Network, Part 7: Avionics Full Duplex Switched Ethernet Network; Electronic Engineering Committee: New York, NY, USA, 2009. [Google Scholar]
  2. Kirshner, M. Model-based systems engineering cybersecurity for space systems. Aerospace 2023, 10, 116. [Google Scholar] [CrossRef]
  3. Fusco, F.; Castrillo, V.U.; Giannetta, H.M.R.; Albano, M.; Cavallini, E. Methods, Standards and Components for Wireless Communications and Power Transfer Aimed at Intra-Vehicular Applications of Launchers. Aerospace 2024, 11, 132. [Google Scholar] [CrossRef]
  4. Chen, W.; Tian, Y.; Sun, S.; Liu, R. Interference Study of 5G System on Civil Aircraft Airborne Beidou RDSS System in Takeoff and Landing Phase. Aerospace 2024, 11, 522. [Google Scholar] [CrossRef]
  5. Aeronautical Radio Inc. ARINC 811: Commercial Aircraft Information Security Concepts of Operation and Process Framework; Electronic Engineering Committee: New York, NY, USA, 2005. [Google Scholar]
  6. Society of Automotive Engineers. ARP4754A Guidelines for Development of Civil Aircraft Systems; SAE International: Warrendale, PA, USA, 2011. [Google Scholar]
  7. Society of Automotive Engineers. ARP4761, Guidelines and Methods for Conducting the Safety Assessment Process on Civil Airborne Systems and Equipment; SAE International: Warrendale, PA, USA, 1996. [Google Scholar]
  8. Dong, H.; Zhai, Z.; Lu, Y.; Gu, Q.; Wang, G.; Wang, M. Availability Analysis of Electronic Flight Instrument System Based on Dynamic Fault Dependent Matrix. In Proceedings of the 2019 IEEE 19th International Conference on Communication Technology (ICCT), Xi’an, China, 16–19 October 2019. [Google Scholar]
  9. Dou, X. Big data and smart aviation information management system. Cogent Bus. Manag. 2020, 7, 1766736. [Google Scholar] [CrossRef]
  10. Haiyong, D.; Guoqing, W.; Zhengjun, Z.; Yanhong, L.; Qingfan, G. Availability analysis of electronic flight instrument system based on dynamic fault tree. In Proceedings of the 2018 Tenth International Conference on Advanced Computational Intelligence (ICACI), Xiamen, China, 29–31 March 2018. [Google Scholar]
  11. Haiyun, Y.; Sun, Y. A combination method for integrated modular avionics safety analysis. Aircr. Eng. Aerosp. Technol. 2023, 95, 345–357. [Google Scholar]
  12. Volkan, S.; Friedl, F.; Schmehl, R. Improving reliability and safety of airborne wind energy systems. Wind. Energy 2020, 23, 340–356. [Google Scholar]
  13. Mohit, K.; Walia, G.K.; Shingare, H.; Singh, S.; Gill, S.S. AI-Based Sustainable and Intelligent Offloading Framework for IIoT in Collaborative Cloud-Fog Environments. IEEE Trans. Consum. Electron. 2023, 70, 1414–1422. [Google Scholar]
  14. Anas, A.S.; Samriya, J.K.; Kumar, M.; Gill, S.S.; Khan, R.A. Intelligent Fog-IoT Networks with 6G Endorsement: Foundations, Applications, Trends and Challenges. In 6G Enabled Fog Computing in IoT: Applications and Opportunities; Springer: New York, NY, USA, 2023; pp. 287–307. [Google Scholar]
  15. Kumar, S.J.; Kumar, M.; Gill, S.S. Secured data offloading using reinforcement learning and Markov decision process in mobile edge computing. Int. J. Netw. Manag. 2023, 33, E2243. [Google Scholar]
  16. Kumar, S.J.; Kumar, M.; Tiwari, R. Energy-aware aco-dnn optimization model for intrusion detection of unmanned aerial vehicle (uavs). J. Ambient. Intell. Humaniz. Comput. 2023, 14, 10947–10962. [Google Scholar]
  17. Kang, J.; Xiong, Z.; Wang, R.; Hua, B. Resilient Multi-Source Integrated Navigation Method for Aerospace Vehicles Based on On-Line Evaluation of Redundant Information. Aerospace 2022, 9, 333. [Google Scholar] [CrossRef]
  18. Xueqian, T.; Li, Q.; Lu, G.; Xiong, H. A Revised Trajectory Approach for the Worst-Case Delay Analysis of an AFDX Network. IEEE Access 2019, 7, 142564–142573. [Google Scholar]
  19. Anaïs, F.; Mifdaoui, A. Worst-case timing analysis of AFDX networks with multiple TSN/BLS shapers. IEEE Access 2020, 8, 106765–106784. [Google Scholar]
  20. Meng, L.; Zhu, G.; Savaria, Y.; Lauer, M. Reliability enhancement of redundancy management in AFDX networks. IEEE Trans. Ind. Inform. 2017, 13, 2118–2129. [Google Scholar]
  21. Lan, M.; Wang, Y. Mitigation of Sequence Inversion in AFDX based on Time-triggered Scheduling. In Proceedings of the 2022 Integrated Communication, Navigation and Surveillance Conference (ICNS), Herndon, VI, USA, 5–7 April 2022. [Google Scholar]
  22. Wang, Y.; Haolin, M.; Meng, Y.; Zhijun, W. Optimization of Airborne AFDX Transmission Delay Based on Revised RSP Method. In Proceedings of the 2021 IEEE 6th International Conference on Computer and Communication Systems (ICCCS), Chengdu, China, 23–26 April 2021. [Google Scholar]
  23. Tyler, P.; Sugunaraj, N.; Ranganathan, P. Aircraft Communication Systems-Topologies, Protocols, and Vulnerabilities. J. Netw. Comput. Appl. 2023. Available online: https://commons.und.edu/ee-stu/11/ (accessed on 12 June 2024).
  24. Uncu, A.; Üzümcü, S.; Mert, A.A. Cyber Security Concerns Regarding Federated, Partly IMA and Full IMA Implementations. In Proceedings of the 2019 IEEE/AIAA 38th Digital Avionics Systems Conference (DASC), San Diego, CA, USA, 8–12 September 2019. [Google Scholar]
  25. Klaus, K.; Fruhmann, M.; Gebeshuber, K.; Leitgeb, E.; Gruber, M. Evaluation of Cyber Security in Digital Avionic Systems. In Proceedings of the 2020 IEEE 91st Vehicular Technology Conference (VTC2020-Spring), Antwerp, Belgium, 25 May–31 July 2020. [Google Scholar]
  26. Predescu, A.V.; Stelkens-Kobsch, T.H. Aviation Security Lab: A testbed for security testing of current and future aviation technologies. In Proceedings of the 2022 IEEE/AIAA 41st Digital Avionics Systems Conference (DASC), Portsmouth, VI, USA, 18–22 September 2022. [Google Scholar]
  27. Naeem, M.H.; Abbasi, I.H.; Mohsin, M. An Autonomous Intrusion Detection System for Ethernet-Based Avionics Communication Bus. In Proceedings of the 2021 International Conference on Engineering and Emerging Technologies (ICEET), Istanbul, Turkey, 27–28 October 2021. [Google Scholar]
  28. Gascard, E.; Simeu-Abazi, Z. Quantitative analysis of dynamic fault trees using Monte Carlo simulations: Event-driven simulation approach. Reliab. Eng. Syst. Saf. 2018, 180, 487–504. [Google Scholar] [CrossRef]
  29. Wang, Y.; Lei, H.; Hackett, R.; Beeby, M. Safety assessment process optimization for integrated modular avionics. IEEE Aerosp. Electron. Syst. Mag. 2019, 34, 58–67. [Google Scholar] [CrossRef]
  30. Nobakhti, A.; Raissi, S.; Damghani, K.K.; Soltani, R. Dynamic reliability assessment of a complex recovery system using fault tree, fuzzy inference and discrete event simulation. Eksploat. Niezawodn. 2021, 23, 593–604. [Google Scholar] [CrossRef]
  31. Yazdi, M.; Kabir, S. Fuzzy evidence theory and Bayesian networks for process systems risk analysis. Hum. Ecol. Risk Assess. Int. J. 2020, 26, 57–86. [Google Scholar] [CrossRef]
  32. Ung, S.T. Evaluation of human error contribution to oil tanker collision using fault tree analysis and modified fuzzy Bayesian Network based CREAM. Ocean. Eng. 2019, 179, 159–172. [Google Scholar] [CrossRef]
  33. Xue, L.; MacKenzie, C.A. Assessing risk in different types of supply chains with a dynamic fault tree. Comput. Ind. Eng. 2019, 137, 106061. [Google Scholar]
  34. Höflinger, K.; Müller, S.; Peng, T.; Ulmer, M.; Lüdtke, D.; Gerndt, A. Dynamic fault tree analysis for a distributed onboard computer. In Proceedings of the 2019 IEEE Aerospace Conference, Dayton, OH, USA, 15–19 July 2019. [Google Scholar]
  35. Chong, W.; Wang, L.; Chen, H.; Yang, Y.; Li, Y. Fault diagnosis of train network control management system based on dynamic fault tree and Bayesian network. IEEE Access 2020, 9, 2618–2632. [Google Scholar]
  36. Koorosh, A.; Latif-Shabgahi, G.-R. A hierarchical approach for dynamic fault trees solution through semi-Markov process. IEEE Trans. Reliab. 2019, 69, 986–1003. [Google Scholar]
  37. Jiang, G.J.; Li, Z.Y.; Qiao, G.; Chen, H.X.; Li, H.B.; Sun, H.H. Reliability analysis of dynamic fault tree based on binary decision diagrams for explosive vehicle. Math. Probl. Eng. 2021, 2021, 5559475. [Google Scholar]
  38. Sohag, K.; Aslansefat, K.; Sorokos, I.; Papadopoulos, Y.; Konur, S. A hybrid modular approach for dynamic fault tree analysis. IEEE Access 2020, 8, 97175–97188. [Google Scholar]
  39. Marwan, A.; Hamad, G.B.; Mohamed, O.A.; Savaria, Y. Towards an accurate probabilistic modeling and statistical analysis of temporal faults via temporal dynamic fault-trees (TDFTs). IEEE Access 2019, 7, 29264–29276. [Google Scholar]
  40. Aikhuele, D.O.; Ighravwe, D.E.; Akinyele, D. Evaluation of renewable energy technology based on reliability attributes using hybrid fuzzy dynamic decision-making model. Technol. Econ. Smart Grids Sustain. Energy 2019, 4, 16. [Google Scholar] [CrossRef]
  41. Torra, V. Hesitant fuzzy sets. Int. J. Intell. Syst. 2010, 25, 529–539. [Google Scholar] [CrossRef]
  42. Baklouti, A.; Nguyen, N.; Mhenni, F.; Choley, J.Y.; Mlika, A. Dynamic fault tree generation for safety-critical systems within a systems engineering approach. IEEE Syst. J. 2019, 14, 1512–1522. [Google Scholar] [CrossRef]
  43. Hongyu, Y.; Feng, Y. A Pythagorean fuzzy Petri net based security assessment model for civil aviation airport security inspection information system. Int. J. Intell. Syst. 2021, 36, 2122–2143. [Google Scholar]
  44. Żyluk, A.; Kuźma, K.; Grzesik, N.; Zieja, M.; Tomaszewska, J. Fuzzy Logic in Aircraft Onboard Systems Reliability Evaluation—A New Approach. Sensors 2021, 21, 7913. [Google Scholar] [CrossRef]
  45. Goncharenko, Y.; Blyskun, O.; Martyniuk, O. Flight safety fuzzy risk assessment for combat aviation system. In Proceedings of the 2nd IEEE International Conference on Advanced Trent in Information Theory, Kyiv, Ukraine, 25–27 November 2020. [Google Scholar]
  46. Zhou, H.; Zhao, Y.; Shen, Q.; Yang, L.; Cai, H. Risk assessment and management via multi-source information fusion for undersea tunnel construction. Autom. Constr. 2020, 111, 103050. [Google Scholar] [CrossRef]
  47. Pan, Y.; Zhang, L.; Li, Z.; Ding, L. Improved fuzzy Bayesian network-based risk analysis with interval-valued fuzzy sets and D–S evidence theory. IEEE Trans. Fuzzy Syst. 2019, 28, 2063–2077. [Google Scholar] [CrossRef]
  48. Li, Y.-F.; Huang, H.Z.; Mi, J.; Peng, W.; Han, X. Reliability analysis of multi-state systems with common cause failures based on Bayesian network and fuzzy probability. Ann. Oper. Res. 2022, 311, 195–209. [Google Scholar] [CrossRef]
  49. Zhou, X.; Peng, T. Application of multi-sensor fuzzy information fusion algorithm in industrial safety monitoring system. Saf. Sci. 2020, 122, 104531. [Google Scholar] [CrossRef]
  50. Gil Casals, S. Risk Assessment and Intrusion Detection for Airbone Networks. Ph.D. Thesis, INSA, Toulouse, France, 2014. [Google Scholar]
  51. Guo, Y.; Zhong, M.; Gao, C.; Wang, H.; Liang, X.; Yi, H. A discrete-time Bayesian network approach for reliability analysis of dynamic systems with common cause failures. Reliab. Eng. Syst. Saf. 2021, 216, 108028. [Google Scholar] [CrossRef]
  52. Zhu, C.; Zhang, T. A review on the realization methods of dynamic fault tree. Qual. Reliab. Eng. Int. 2022, 38, 3233–3251. [Google Scholar] [CrossRef]
  53. Tang, X.; Luo, Z.; Qu, G. Worst-Case End-to-End Delay Analysis for an AFDX Evolution Network. In Proceedings of the 2020 IEEE 6th International Conference on Computer and Communications (ICCC), Chengdu, China, 11–14 December 2020. [Google Scholar]
  54. Villegas, J.; Fortes, S.; Escaño, V.; Baena, C.; Colomer, B.; Barco, R. Verification and Validation Framework for AFDX Avionics Networks. IEEE Access 2022, 10, 66743–66756. [Google Scholar] [CrossRef]
  55. Dai, J.; Li, C.; Wang, K.; Zhao, C. Application prospect of time-sensitive network in airborne communication network. J. Phys. Conf. Ser. 2022, 2253, 012035. [Google Scholar] [CrossRef]
  56. Aslansefat, K.; Kabir, S.; Gheraibia, Y.; Papadopoulos, Y. Dynamic fault tree analysis: State-of-the-art in modeling, analysis, and tools. In Reliability Management and Engineering; CRC Press: Boca Raton, FL, USA, 2020; pp. 73–112. [Google Scholar]
  57. Xiang, J.; Machida, F.; Tadano, K.; Yanoo, K.; Sun, W.; Maeno, Y. A static analysis of dynamic fault trees with priority-and gates. In Proceedings of the 2013 Sixth Latin-American Symposium on Dependable Computing, Rio de Janeiro, Brazil, 1–5 April 2013. [Google Scholar]
  58. Fahmy, R.A.; Selim, H.K. Application of dynamic fault tree technique in safety assessment for the containment spray system of nuclear power plant. Electr. Eng. 2023, 105, 3411–3421. [Google Scholar] [CrossRef]
  59. Seresht, N.G.; Fayek, A.R. Computational method for fuzzy arithmetic operations on triangular fuzzy numbers by extension principle. Int. J. Approx. Reason. 2019, 106, 172–193. [Google Scholar] [CrossRef]
  60. Kumar, M. A novel weakest t-norm based fuzzy fault tree analysis through qualitative data processing and its application in system reliability evaluation. J. Intell. Syst. 2018, 29, 977–993. [Google Scholar] [CrossRef]
  61. Komal. Fuzzy fault tree analysis for patient safety risk modeling in healthcare under uncertainty. Appl. Soft Comput. 2015, 37, 942–951. [Google Scholar] [CrossRef]
Figure 1. Proposed analysis method process.
Aerospace 11 00631 g001
Figure 2. Dynamic logic gates.
Aerospace 11 00631 g002
Figure 3. A380 avionics network topology.
Aerospace 11 00631 g003
Figure 4. AFDX data transmission failure DFT.
Aerospace 11 00631 g004
Figure 5. Simplified FT for avionic network transmission failure.
Aerospace 11 00631 g005
Figure 6. Lengths of fuzzy failure probability intervals for AFDX data transmission.
Aerospace 11 00631 g006
Figure 7. Fuzzy failure probability interval of TOP.
Aerospace 11 00631 g007
Table 1. DFT special symbols.
ContentSymbol
PANDAerospace 11 00631 i001
FDEPAerospace 11 00631 i002
HSPAerospace 11 00631 i003
Undertermined EventAerospace 11 00631 i004
Table 2. DFT symbols and corresponding meaning.
SymbolMeaningSymbolMeaning
TOPAFDX data transmission failureAActively discard data frames
B1Data frame passive lossBVL configuration error
C1VL failureCPhysical damage
D1Data frames in the wrong orderDData frame copy error
D2Data frame lostEThe data frame was not sent
E1Sender failedFIntegrity check failure
E2Receiver failureGRedundancy check failure
E3Redundant network failureHLink congestion
E4Data frame delayINetwork A buffer failure
F1Network A failsJNetwork B buffer failure
F2Network B failsKNetwork A data frame filtering failure
G1Network A switch logic errorLNetwork A data frame shaping failure
G2Network A switch is damagedMEquipment worn out
G3Network B switch logic errorNNetwork B data frame filtering failure
G4Network B switch is damagedONetwork B data frame shaping failure
Table 3. Statistic of BEs’ TFFRI.
BEFailure RateStatic TFFRIRelative Confidence LevelRelative Confidence TFFRI
B 1.03 × 10 3 [0.0008240, 0.0010300, 0.0012875]1.735%[0.0010264, 0.0010300, 0.0010345]
C 7.63 × 10 3 [0.0061040, 0.0076300, 0.0095375]12.852%[0.0074339, 0.0076300, 0.0078752]
D 2.44 × 10 2 [0.0195200, 0.0244000, 0.0305000]41.099%[0.0223944, 0.0244000, 0.0269071]
E 3.44 × 10 3 [0.0027520, 0.0034400, 0.0043000]5.794%[0.0034001, 0.0034400, 0.0034898]
F 3.01 × 10 3 [0.0024080, 0.0030100, 0.0037625]5.070%[0.0029795, 0.0030100, 0.0030482]
G 8.59 × 10 3 [0.0068720, 0.0085900, 0.0107375]14.469%[0.0083414, 0.0085900, 0.0089007]
H 5.43 × 10 3 [0.0043440, 0.0054300, 0.0067875]9.146%[0.0053307, 0.0054300, 0.0055542]
I 3.12 × 10 2 [0.0249600, 0.0312000, 0.0390000]52.553%[0.0279207, 0.0312000, 0.0352991]
J 3.12 × 10 2 [0.0249600, 0.0312000, 0.0390000]52.553%[0.0279207, 0.0312000, 0.0352991]
K 6.34 × 10 3 [0.0050720, 0.0063400, 0.0079250]10.679%[0.0062046, 0.0063400, 0.0065093]
L 5.64 × 10 2 [0.0451200, 0.0564000, 0.0705000]95%[0.0456840, 0.0564000, 0.0697950]
N 6.34 × 10 3 [0.0050720, 0.0063400, 0.0079250]10.679%[0.0062046, 0.0063400, 0.0065093]
O 5.64 × 10 2 [0.0451200, 0.0564000, 0.0705000]95%[0.0456840, 0.0564000, 0.0697950]
Table 4. TOP’S TFFPI.
Flight HoursStatic-Minimum t-NormCOGTraditional Weakest t-NormCOGRelative Confidence—Optimized the Weakest t-NormCOG
1.5 h[0.1345081, 0.1665012, 0.2054686]0.1688260[0.158663, 0.1665012, 0.1761963]0.1671202[0.1623911, 0.1665012, 0.1716104]0.1668342
4.6 h[0.375984, 0.4516913, 0.5358843]0.4545199[0.4357246, 0.4516913, 0.4710159]0.4528106[0.4433575, 0.4516913, 0.4619334]0.4523274
7.6 h[0.5579795, 0.6486323, 0.7388497]0.6484872[0.6315676, 0.6486323, 0.668856]0.6496853[0.6397652, 0.6486323, 0.6594099]0.6492691
8.5 h[0.6031371, 0.6943245, 0.7818931]0.6931182[0.6776738, 0.6943245, 0.7139335]0.6953106[0.6856842, 0.6943245, 0.7047916]0.6949334
9.0 h[0.6264817, 0.7173692, 0.8029088]0.7155866[0.7010425, 0.7173692, 0.7365295]0.7183137[0.7089034, 0.7173692, 0.7276062]0.7179596
Table 5. Euclidean distances of fuzzy intervals.
Flight HoursStatic-Minimum t-NormTraditional Weakest t-NormRelative Confidence—Optimized the Weakest t-Norm
1.5 h0.00232480.00061900.0003330
4.6 h0.00282860.00111930.0006361
7.6 h0.00014510.00105300.0006368
8.5 h0.00120630.00098610.0006089
9.0 h0.00178260.00094450.0005904
Average0.00165750.00094440.0005610
Table 6. Statistical and ranking results of the Birnbaum importance of BEs.
BEConstant ValueStatic-Minimum t-NormTraditional Weakest t-NormRelative Confidence—Optimized the Weakest t-NormRanking of Importance
B0.00276130.00270200.00275300.002756313
C0.02097750.02053280.02091460.02093947
D0.07159050.07013490.07137590.07146073
E0.00930730.00910840.00927940.00929049
F0.00813050.00795660.00810610.008115810
G0.02370400.02320260.02363300.02366106
H0.01480360.01448840.01475920.01477678
I0.09402360.09215090.09374180.09385321
J0.09402360.09215090.09374180.09385321
K0.00665040.00653440.00663050.006638311
L0.05527590.05447360.05511020.05517574
N0.00665040.00653440.00663050.006638311
O0.05527590.05447360.05511020.05517574
Disclaimer/Publisher’s Note: The statements, opinions and data contained in all publications are solely those of the individual author(s) and contributor(s) and not of MDPI and/or the editor(s). MDPI and/or the editor(s) disclaim responsibility for any injury to people or property resulting from any ideas, methods, instructions or products referred to in the content.

