Article

Propeller Effects and Elasticity in Aerodynamic Analysis of Small Propeller-Driven Aircraft and UAVs

Department of Aerospace Engineering, Toronto Metropolitan University, Toronto, ON M5B 2K3, Canada
Aerospace 2024, 11(8), 664; https://doi.org/10.3390/aerospace11080664
Submission received: 4 June 2024 / Revised: 17 July 2024 / Accepted: 10 August 2024 / Published: 13 August 2024
(This article belongs to the Special Issue Aerodynamic Numerical Optimization in UAV Design)

Abstract

:
The importance of propeller effects and power contribution to the aerodynamics of small aircraft and unmanned aerial vehicles (UAVs) is indispensable. The aerodynamic analysis of wings in flight varies from rigid wing analysis due to wing deflection caused by transferred aerodynamic loads. This paper investigates the intertwined influence of propeller effects and elasticity on the aerodynamics of small propeller-driven aircraft and UAVs. Through a detailed methodology, a twin-engine propeller-driven aircraft is analyzed as a case study, providing insights into the proposed approach. Two critical analyses are presented: an examination of propeller effects in rigid aircraft and the incorporation of elastic wing properties. The former establishes a foundational understanding of aerodynamic behavior, while the latter explores the impact of wing elasticity on performance. Validation is achieved through comparative analysis with wind tunnel test results from a similar rigid structure aircraft. Utilizing NASTRAN software V2010.1, aerodynamic analysis of the elastic aircraft is conducted, complemented by semi-empirical insights. The results highlight the importance of these factors across different angles of attack. Furthermore, deviations from the rigid aircraft configuration emphasize the considerable influence of static aeroelasticity analysis, notably increasing longitudinal characteristics by approximately 20%, while showing a lower impact of 5% in lateral-directional characteristics. This study contributes to enhanced design and operational considerations for small propeller-driven aircraft, with implications for future research and innovation, particularly for the purpose of efficient concepts in advanced air mobility.

1. Introduction

Currently, there is an increasing interest in daily passenger and cargo transport by small aircraft and UAVs over distances that have been traditionally served by ground transportation vehicles. Although the idea of using small aircraft and drones for transportation is not novel, over recent years, there have been significant enhancements in technologies and societal variations that may make these operations a practical part of our daily lives. The convergence of advanced technologies, such as electric propulsion and autonomy, along with new business models, such as mobile application-based ride-sharing and network-enabled on-demand services, bring new general aviation markets [1,2,3]. Advanced air mobility (AAM) is the general term defined by NASA for these new small aircraft. AAM services fall into the two categories of urban air mobility (UAM) and regional air mobility (RAM) [4,5]. UAM is the transport system that transfers people or goods by air within cities. RAM will be responsible for the transportation of goods and people to rural and remote communities [6]. AAM has the potential to enhance our daily transportation by reducing travel time, avoiding traffic on the ground and within cities, smoothing travel between different parts of cities, and advancing regional mobility, particularly in areas underserved by modern air transportation [7].
The propeller effects and power contribution to the aerodynamics of small aircraft and UAVs are essential. Since the introduction of airplanes, this has always been important to understand propeller behavior due to the generation of substantial lateral forces in the presence of side wind [8,9]. Recently, much research has enhanced semi-empirical procedures to study the aerodynamics of sophisticated propeller aircraft and propeller effects on stability and handling quality [10,11,12,13]. These studies presented augmented and combined analytical procedures and design data compendia to account for the restrictions of earlier approaches [8]. Among those, the semi-empirical multidisciplinary analysis program MAPLA has been developed for the optimization of small conventional and eVTOL aircraft. MAPLA consists of the five primary disciplines of weight and balance, aerodynamics, propulsion, stability, and control as well as performance. In a series of previous studies, MAPLA was demonstrated to be able to model the characteristics of small conventional and eVTOL aircraft with acceptable precision [10,14,15,16,17]. In addition, high-fidelity computational fluid dynamics (CFD) simulations have been conducted to study the behavior of propeller effects for UAM and VTOL concepts [18,19,20,21,22].
In the design process of new airplanes, the performance of wings is dominated by the aero-structural-coupled system [23]. Due to the deflection of wings in flight, which results from aerodynamic loads that are transferred to the wing structure, the aerodynamic analysis of a wing in flight is different from rigid wing analysis [24,25]. In order to simulate this behavior, the general approach is to couple the aerodynamic solver and the structural computations. This coupling requires an iteration loop to find the equilibrium solution [26,27,28].
Among aero-structural coupling analysis tools, NASTRAN is a finite element analysis program that was originally developed for NASA [29]. In aero-structural coupling problems, structural and aerodynamic grids are connected by interpolation [30]. This approach enables the independent selection of grid points for both the structural model and the aerodynamic elements of lifting surfaces or bodies. The structural model of a wing may encompass a one-, two-, or three-dimensional array of grid points, while the aerodynamic theory may employ lifting surface theory or strip theory. A versatile interpolation method is available to connect various combinations seamlessly. Any aerodynamic panel or body can be subdivided into subregions for interpolation, utilizing separate functions for each. This interpolation method, known as splining, involves mathematical analysis of beams and plates, including linear splines that generalize infinite beams to accommodate torsional and bending degrees of freedom, surface splines that address solutions for infinite uniform plates, and explicit user-defined interpolation methods [31,32].
Static (or quasi-steady) aeroelasticity investigation is an interdisciplinary field that combines knowledge of aerodynamics, elasticity, and inertial forces [33,34,35]. By understanding and addressing static aeroelastic effects, engineers can ensure the stability and structural integrity of aircraft under various operating conditions, contributing to safer and more reliable flight operations [36]. Structural analysts are primarily concerned with aerodynamic load redistribution and the resulting internal structural load and stress redistributions [37,38]. They also consider the possibility of static aeroelastic instability, such as divergence. Aerodynamicists and control systems analysts are interested in aerodynamic load redistribution and its effects on aerodynamic stability and control derivatives. The static aeroelastic capability of Nastran addresses these needs by computing aircraft trim conditions, followed by the recovery of structural responses, aeroelastic stability derivatives, and static aeroelastic divergence dynamic pressures [31,39].
The primary objective of this paper is to investigate the significance of propeller effects and elasticity in the aerodynamic analysis of small propeller-driven airplanes. Subsequently, the methodology section elaborates on the proposed procedure in detail, offering a comprehensive insight into the analytical approach. The results pertaining to a twin-engine propeller-driven aircraft are presented meticulously, serving as a case study to illustrate the application of the proposed methodology.

2. Materials and Methods

This methodology section delineates two key analyses: firstly, an examination of propeller effects in rigid aircraft, followed by the integration of elastic wing properties to explore alterations in aerodynamic characteristics. The analysis of propeller effects in rigid aircraft serves as the foundational step, providing insights into the aerodynamic behavior under normal operating conditions. Subsequently, the incorporation of elastic wing properties enriches our understanding by exploring how these variables influence aerodynamic performance. Validation of the studied aircraft was accomplished through a comparative analysis with wind tunnel test results obtained from a similar twin-engine propeller-driven aircraft with a rigid structure. Furthermore, the aerodynamic analysis of the elastic aircraft was conducted utilizing NASTRAN software, complemented by semi-empirical findings derived from the rigid aircraft analysis.

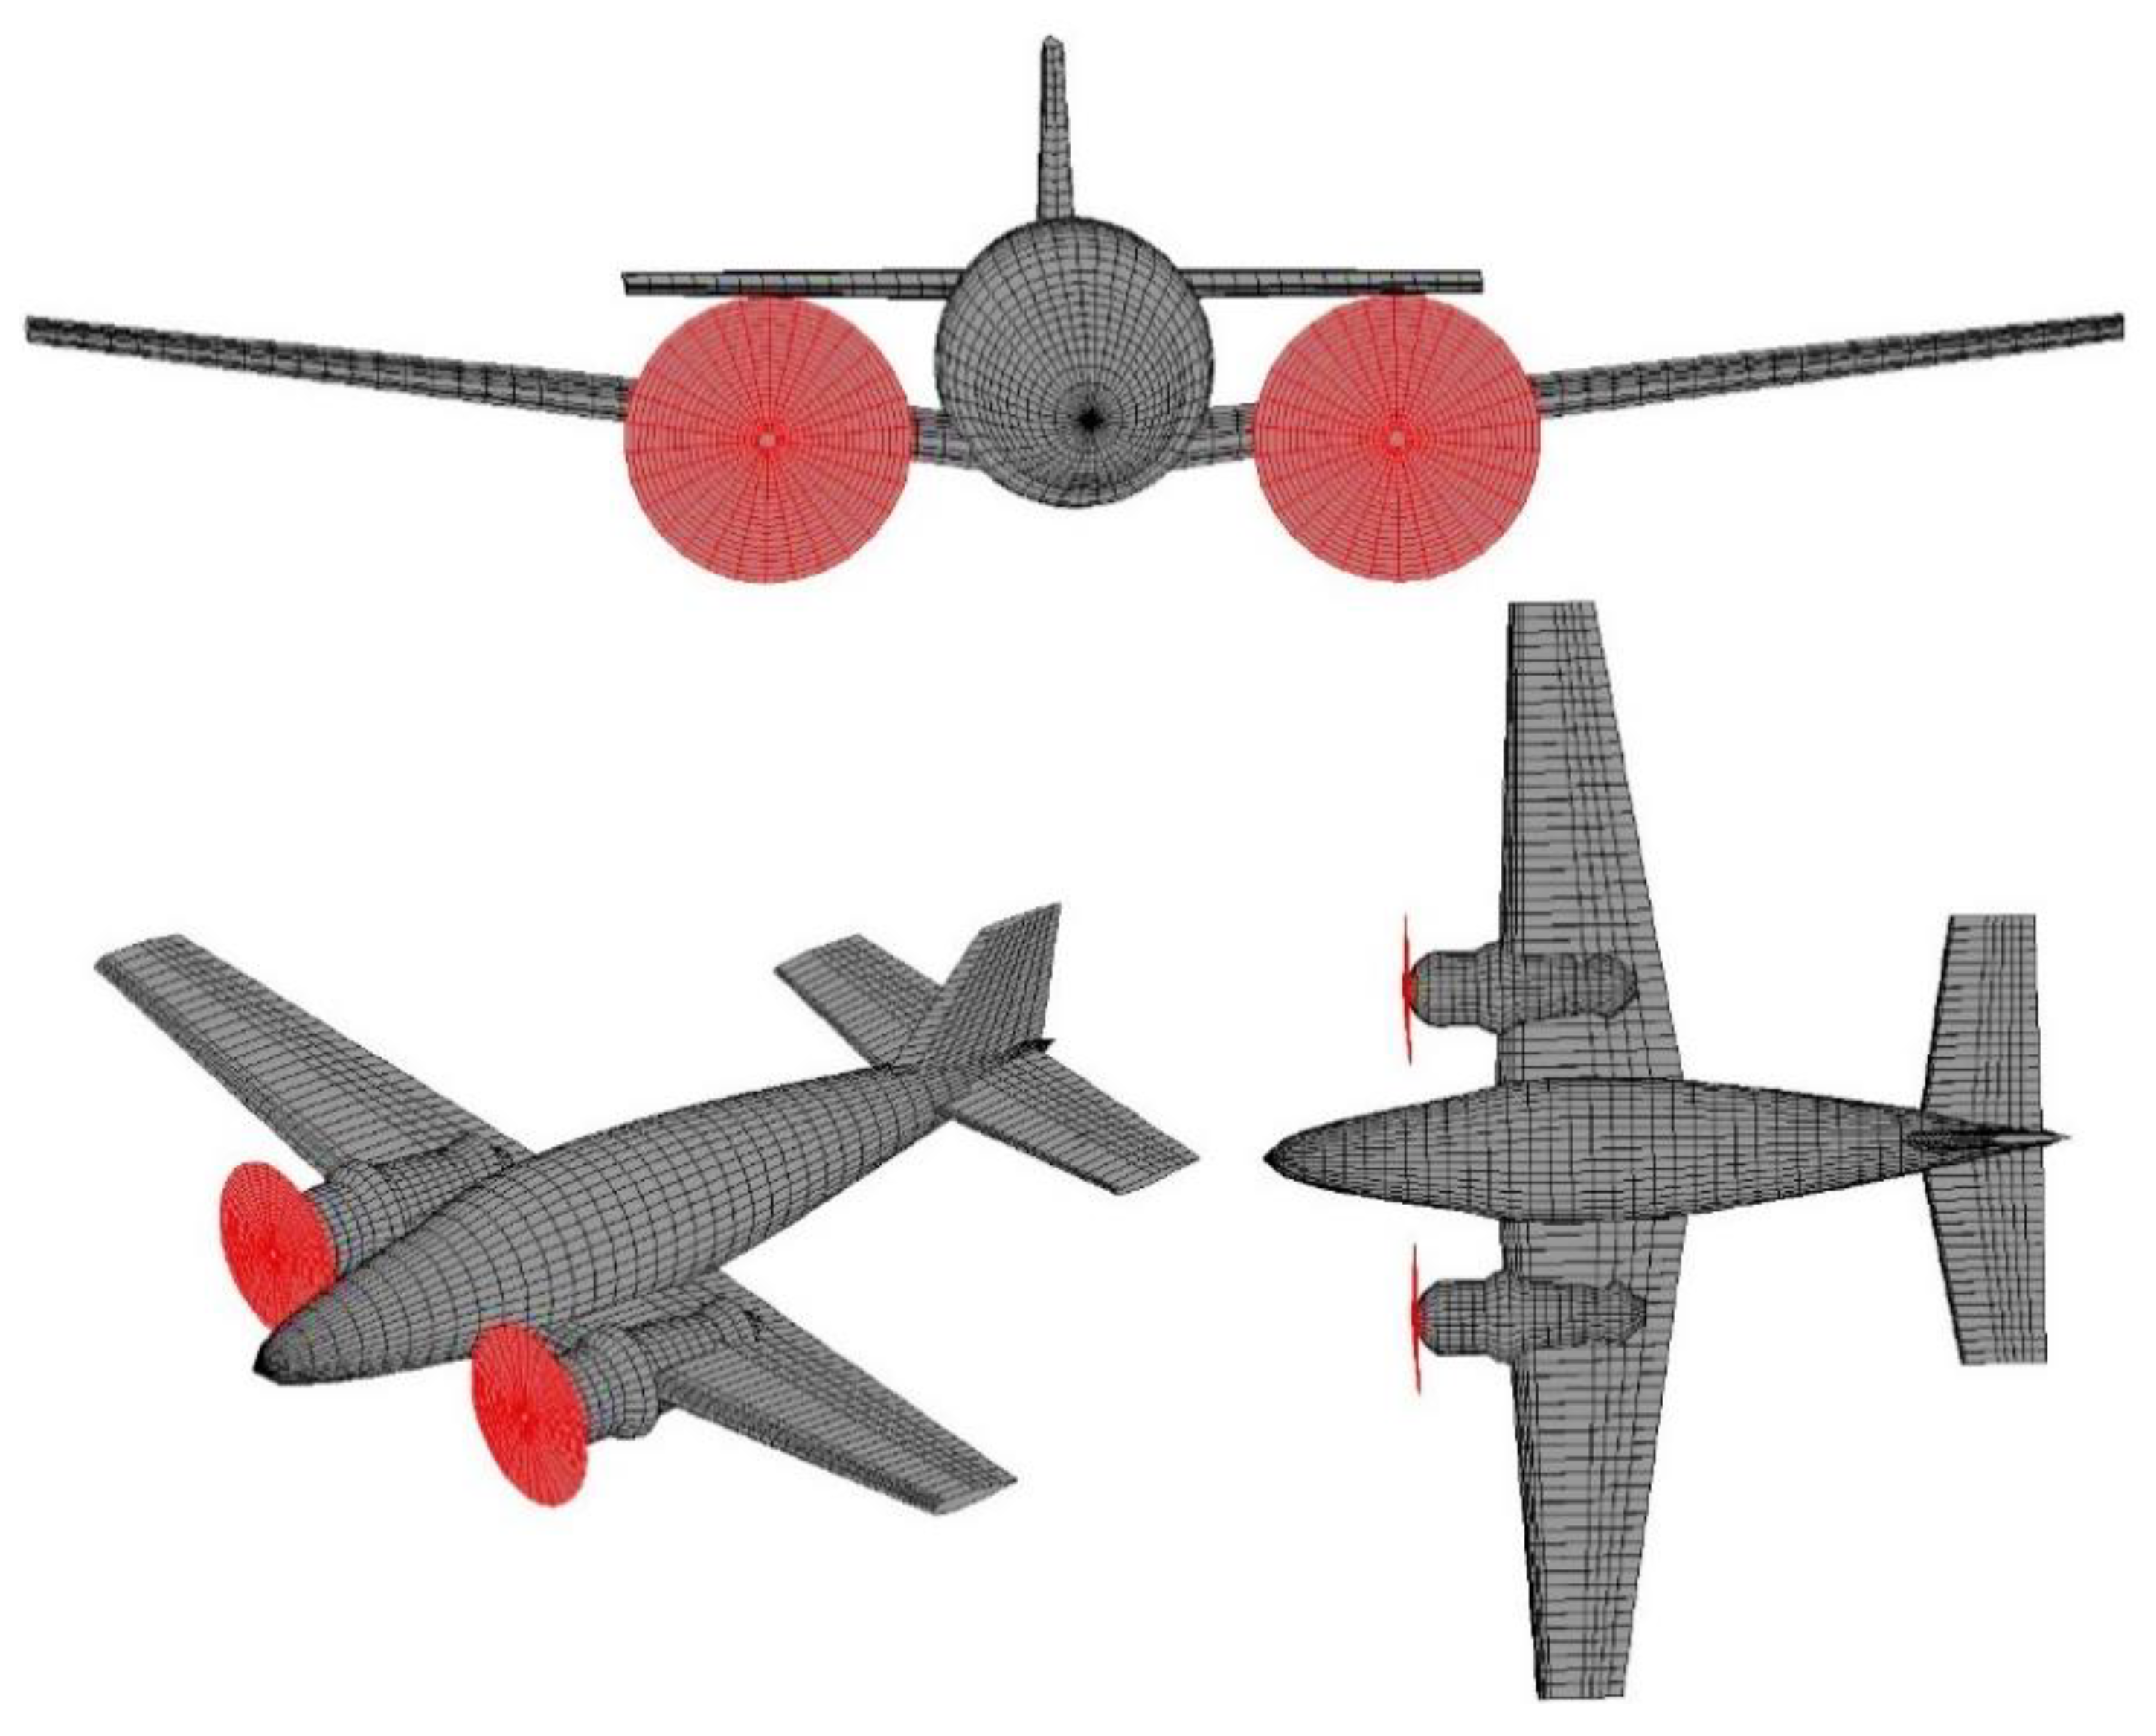
2.1. Rigid Aircraft Aerodynamic Analysis with Propeller Effects

The semi-empirical analysis program MAPLA, initially designed for optimizing small, general aviation aircraft and UAVs, underwent enhancements for increased efficacy. Its original implementation encompasses five crucial disciplines: aerodynamics, propulsion, performance, weight and balance, and stability and control, amalgamating cutting-edge analytical procedures and design data collections into a fully automated method. For this investigation, the propulsion module specifically computed the propeller and power effects on longitudinal and lateral-directional aerodynamic coefficients and stability derivatives of rigid aircraft. Within each subprogram, power-on static stability and control derivatives were initially estimated across various aircraft components, including the wing, fuselage, nacelle, horizontal tail, vertical tail, and high-lift surfaces. The total power-on static stability and control derivatives were subsequently derived by amalgamating these individual contributions. Following this, the dynamic characteristics of the aircraft were estimated using static derivatives. The propulsion module’s development was rooted in NASA’s work, with enhancements tailored to generalize its application, particularly for small aircraft design and development purposes. In a series of previous investigations, this tool demonstrated its capability to model small aircraft characteristics with commendable precision [8,10,12,14,15,16].
The propeller effects on the lift forces could be divided into two groups such as those created from propeller forces and those created from the propeller slipstream. Hence, the aircraft lift could be presented by [10,40]
C L = C L p r o p   o f f + ( Δ C L T + Δ C L N p Propelle r     Forces   + Δ C L q ¯ w + Δ C L ϵ p + Δ C L h q ¯ h + Δ C L h Δ ϵ h power   Propeller   slipstream   effect  
where propeller force components are propeller thrust vector C L T and propeller normal force, C L N p . Propeller slipstream effects contain the lift due to the power-induced change in dynamic pressure, C L h q ¯ h and lift change because of the propeller downwash for the wing C L q ¯ w + C L p and horizontal tail C L h ( h ) p o w e r .
The same c be done to present the pitching moment coefficient of the aircraft in the presence of propeller effects [10,40]:
C m = C m w f n p r o p   o f f + ( Δ C m T + Δ C m N p Propelle r   forces   + Δ C m 0 q ¯ w + Δ C m w L + C m n p Propeller   slipstream   effect   + C m h + C ¯ m h h f p r o p   o f f
where, similar to the lift equation, propeller force components are propeller thrust vector C m T and propeller normal force C m N p . Propeller slipstream effects contain the contribution of the power-induced change in dynamic pressure C m 0 q ¯ w , propeller slipstream-induced dynamic pressure and angle of attack changes on the wing C m w L = C m q ¯ w + C m p , propeller slipstream on nacelle free moments C m n p , and propeller slipstream on dynamic pressure and downwash on the horizontal tail C m h .
The following components are necessary for aircraft drag change due to the propeller effects. Firstly, the propeller thrust components are parallel to the X-stability axis. Second is the change in slipstream stream dynamic pressure. Third is the change in induced drag due to the lift component of the direct propeller forces. Finally, there is the change in cooling drag. These components are summarized as [10,40]
C D = C D p r o p   o f f n T c / prop   c o s α T + Δ C D 0 w + Δ C D 0 h + Δ C ¯ D 0 n + Δ C D i + Δ C D cooling   drag   Change in drag due to propeller effects and power on
where n ( T c / prop ) cos α T is the component of total thrust parallel to the velocity vector, C D 0 is the change in profile drag coefficient due to power, C D i is the induced drag coefficient due to power, and C D c o o l i n g d r a g is the change in the cooling system drag coefficient due to power.
The power effects on the side force derivative include the propeller normal force contribution C Y β N p , propeller-induced increase in dynamic pressure C Y β n ( q ¯ ) , and power-induced sidewash C Y β n ( σ p ) [10,41].
C Y β = C Y β p r o p   o f f + C Y β N p + C Y β n ( q ¯ ) + C Y β n ( σ p ) Change of side force derivative due to propeller effects and power on
The propeller and power effects on the weathercock stability also include the propeller normal force contribution C n β N p , propeller-induced increase in dynamic pressure C n β n ( q ¯ ) , and power-induced sidewash C n β n ( σ p ) [10,40].
Finally, the propeller and power effects on the dihedral derivative include the propeller side force contribution C l β N p and the propeller-induced increase in dynamic pressure and downwash C l β w ( q ¯ + ϵ p ) [41].
C l β = C l β p r o p   o f f + C l β N p + C l β w ( q ¯ + ϵ p ) Change in dihedral derivative due to propeller effects and power-on propeller forces

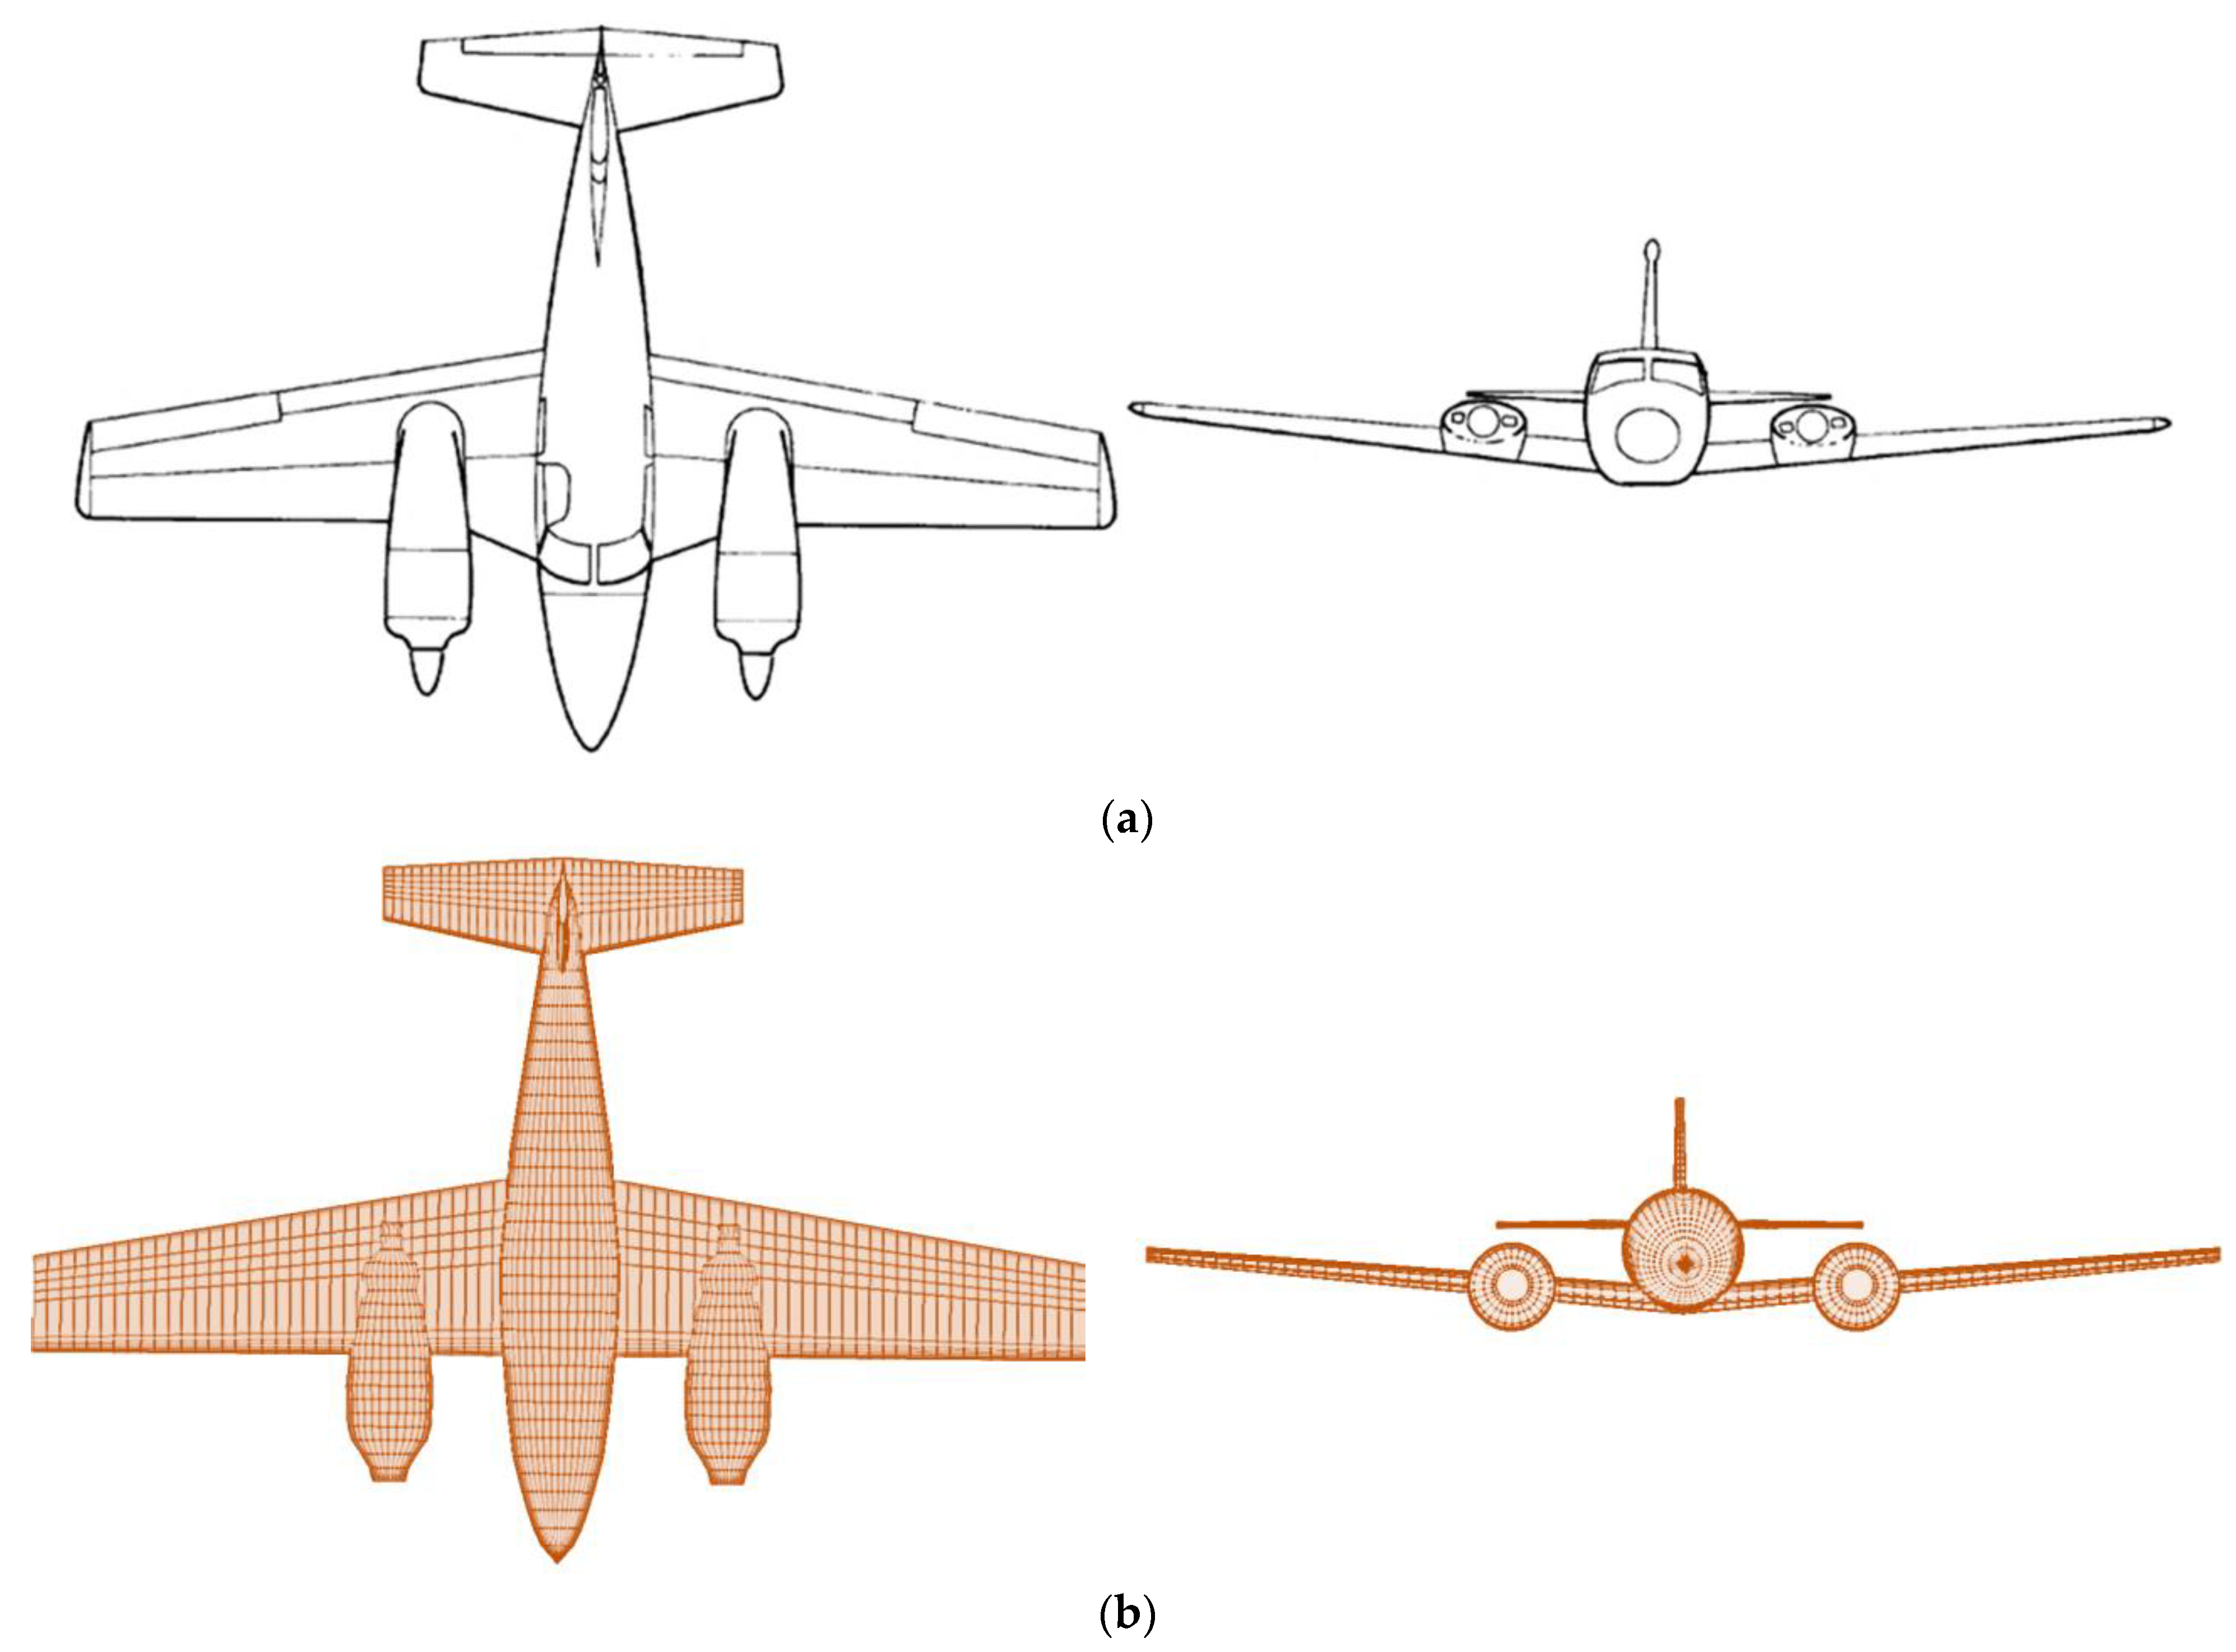
Rigid Aircraft Analysis Validation

To validate the calculated results, the aerodynamics module outcomes were compared with wind tunnel test data of a twin-engine propeller-driven small aircraft [35,36]. Figure 1a,b depict the geometry of the original aircraft model and the modeled aircraft using MAPLA, respectively. Additionally, Table 1 outlines the general characteristics of the small twin-engine propeller airplane and the properties of the investigated flight conditions.
In the subsequent sections, Figure 2a–c delineate the longitudinal aerodynamic characteristics of the investigated aircraft across various flight conditions. Additionally, Figure 3a,b compare the lateral-directional aerodynamic characteristics of the twin-engine propeller-driven small aircraft using MAPLA with the corresponding data obtained from available wind tunnel tests [35,36]. All results are presented for the power-off conditions, where the trust coefficient of the propellers CT is equal to zero up to CT = 0.2 and CT = 0.44. The trust coefficient parameter that accounts for propeller effects could be defined using the below formula:
C T = T h r u s t q ¯ S w
where q ¯ is the dynamic pressure ratio in newton per square meter and S w is the surface area of the wing in square meters.
The deviation results of MAPLA from the wind tunnel test results are presented in Table 2. With respect to the deviation results presented in Table 1, MAPLA’s results presented an accuracy of 5% for lift coefficient values for power-off conditions in the case of CT = 0.2 and even higher CT values of 0.44. The same could be seen for the power-off conditions for the drag coefficient results. However, as power increased, the results’ deviation also increased by up to 15% for CT = 0.2 and 35% for CT = 0.44. For the pitching moment coefficient results, MAPLA presented a higher deviation from the wind tunnel test results, starting from 10% for the power-off condition and increasing to up to 20% and 50% for CT = 0.2 and CT = 0.44, respectively. For lateral-directional characteristics, MAPLA reported a higher deviation from the wind tunnel test results, where, for the weathercock stability analysis, the reported value for power-off conditions showed a deviation of 35%, and this value increased for the higher power conditions to up to 40% for CT = 0.2 and 45% for CT = 0.44. The dihedral effect characteristic showed a better accuracy, with a 25% deviation from the wind tunnel test results for CT = 0, 15% for CT = 0.2 and 10% for CT = 0.44. Overall, MAPLA showed better accuracy for longitudinal aerodynamic characteristics compared to the lateral-directional characteristics. The results indicated that MAPLA’s aerodynamics module is able to determine the aerodynamic characteristics of small aircraft with acceptable accuracy for low-fidelity analysis, where conceptual and preliminary studies are of interest. However, compared to the other methods such as DATCOM [34], MAPLA’s results are closer to the wind tunnel test data in almost all studied conditions for linear angles of attacks.

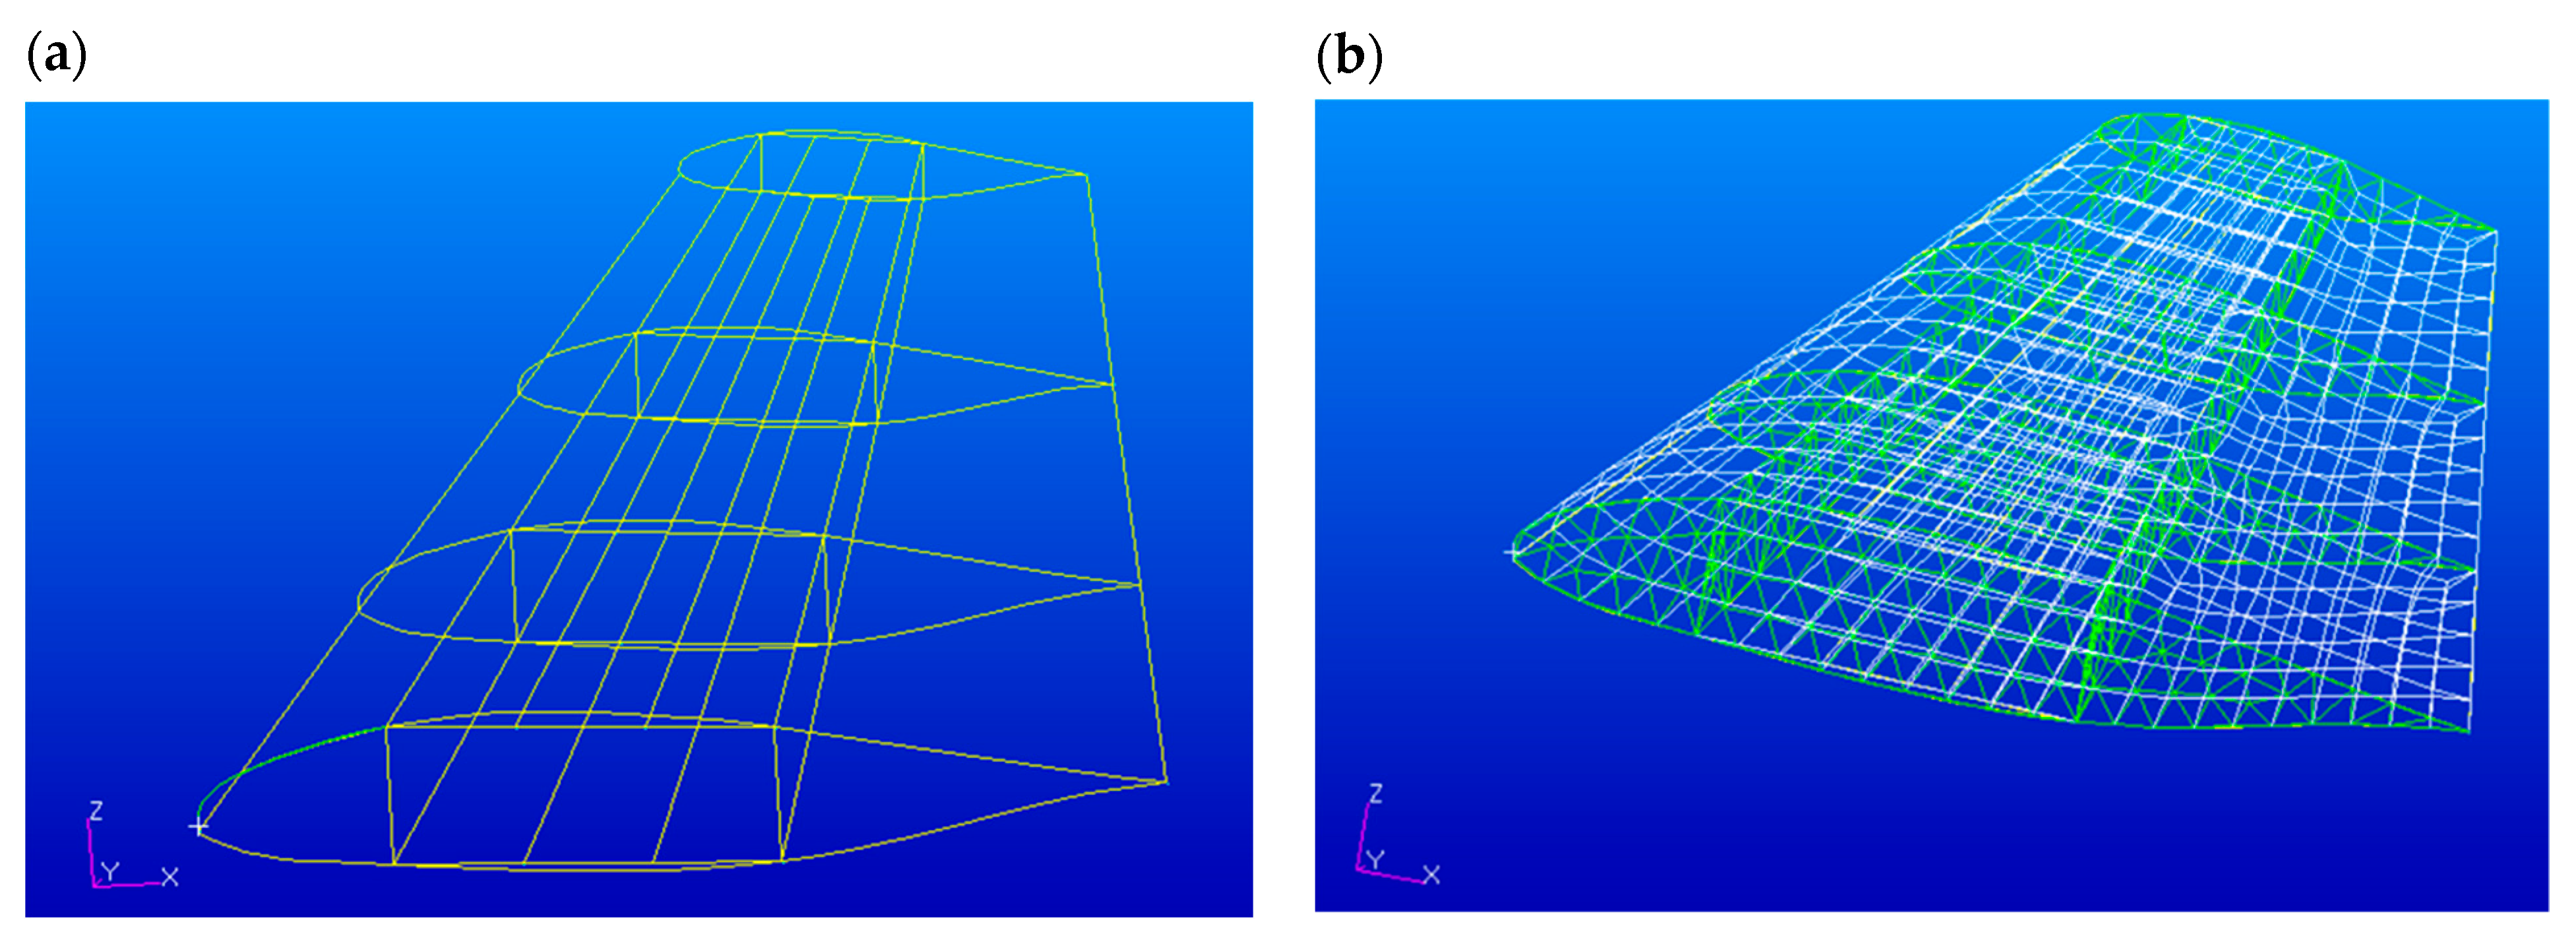
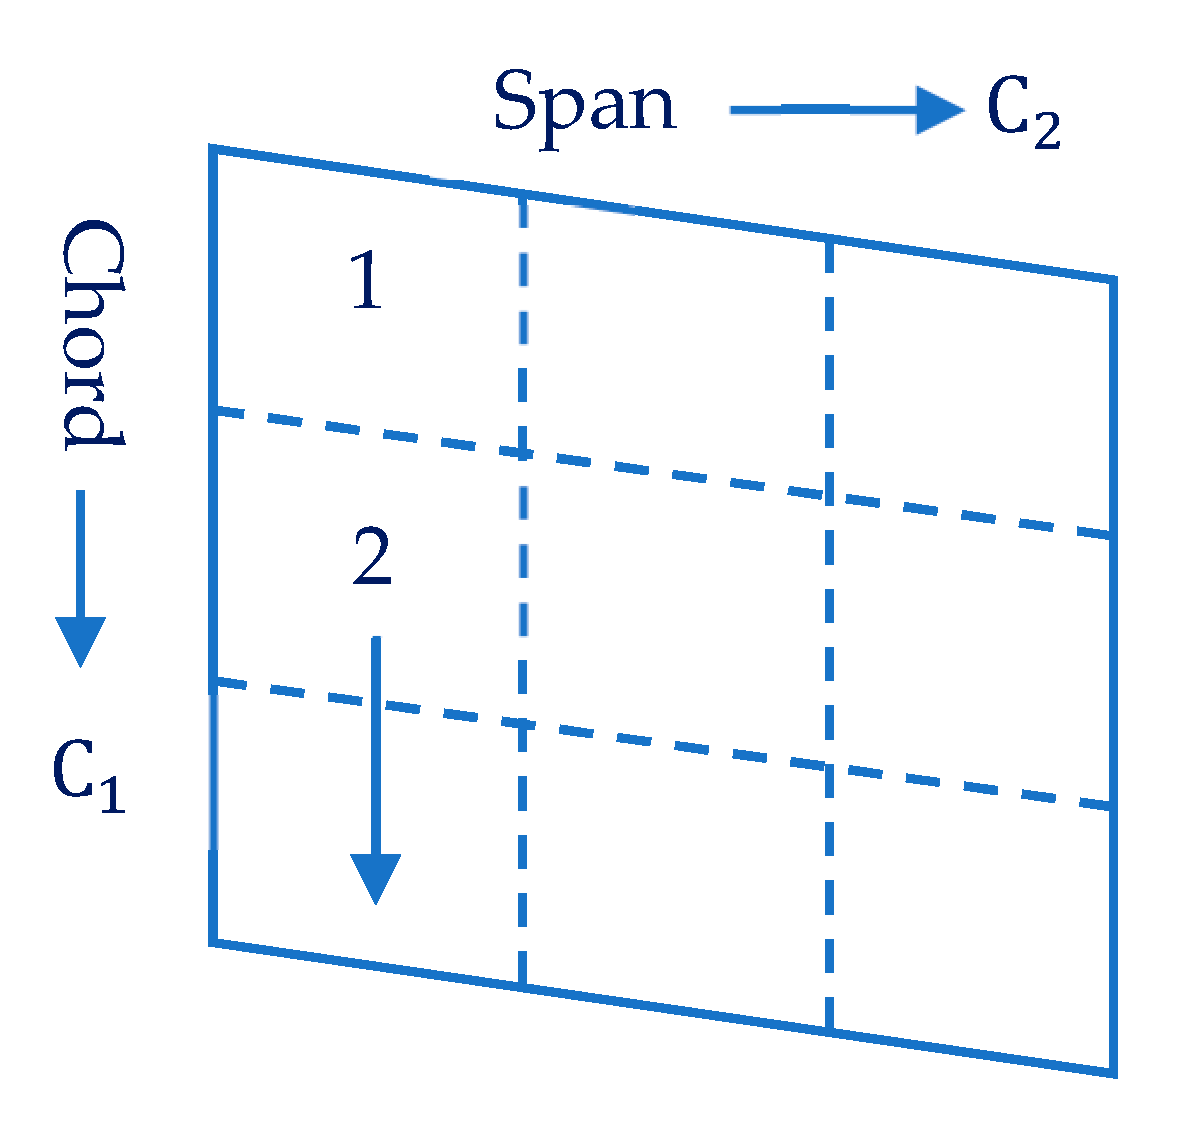
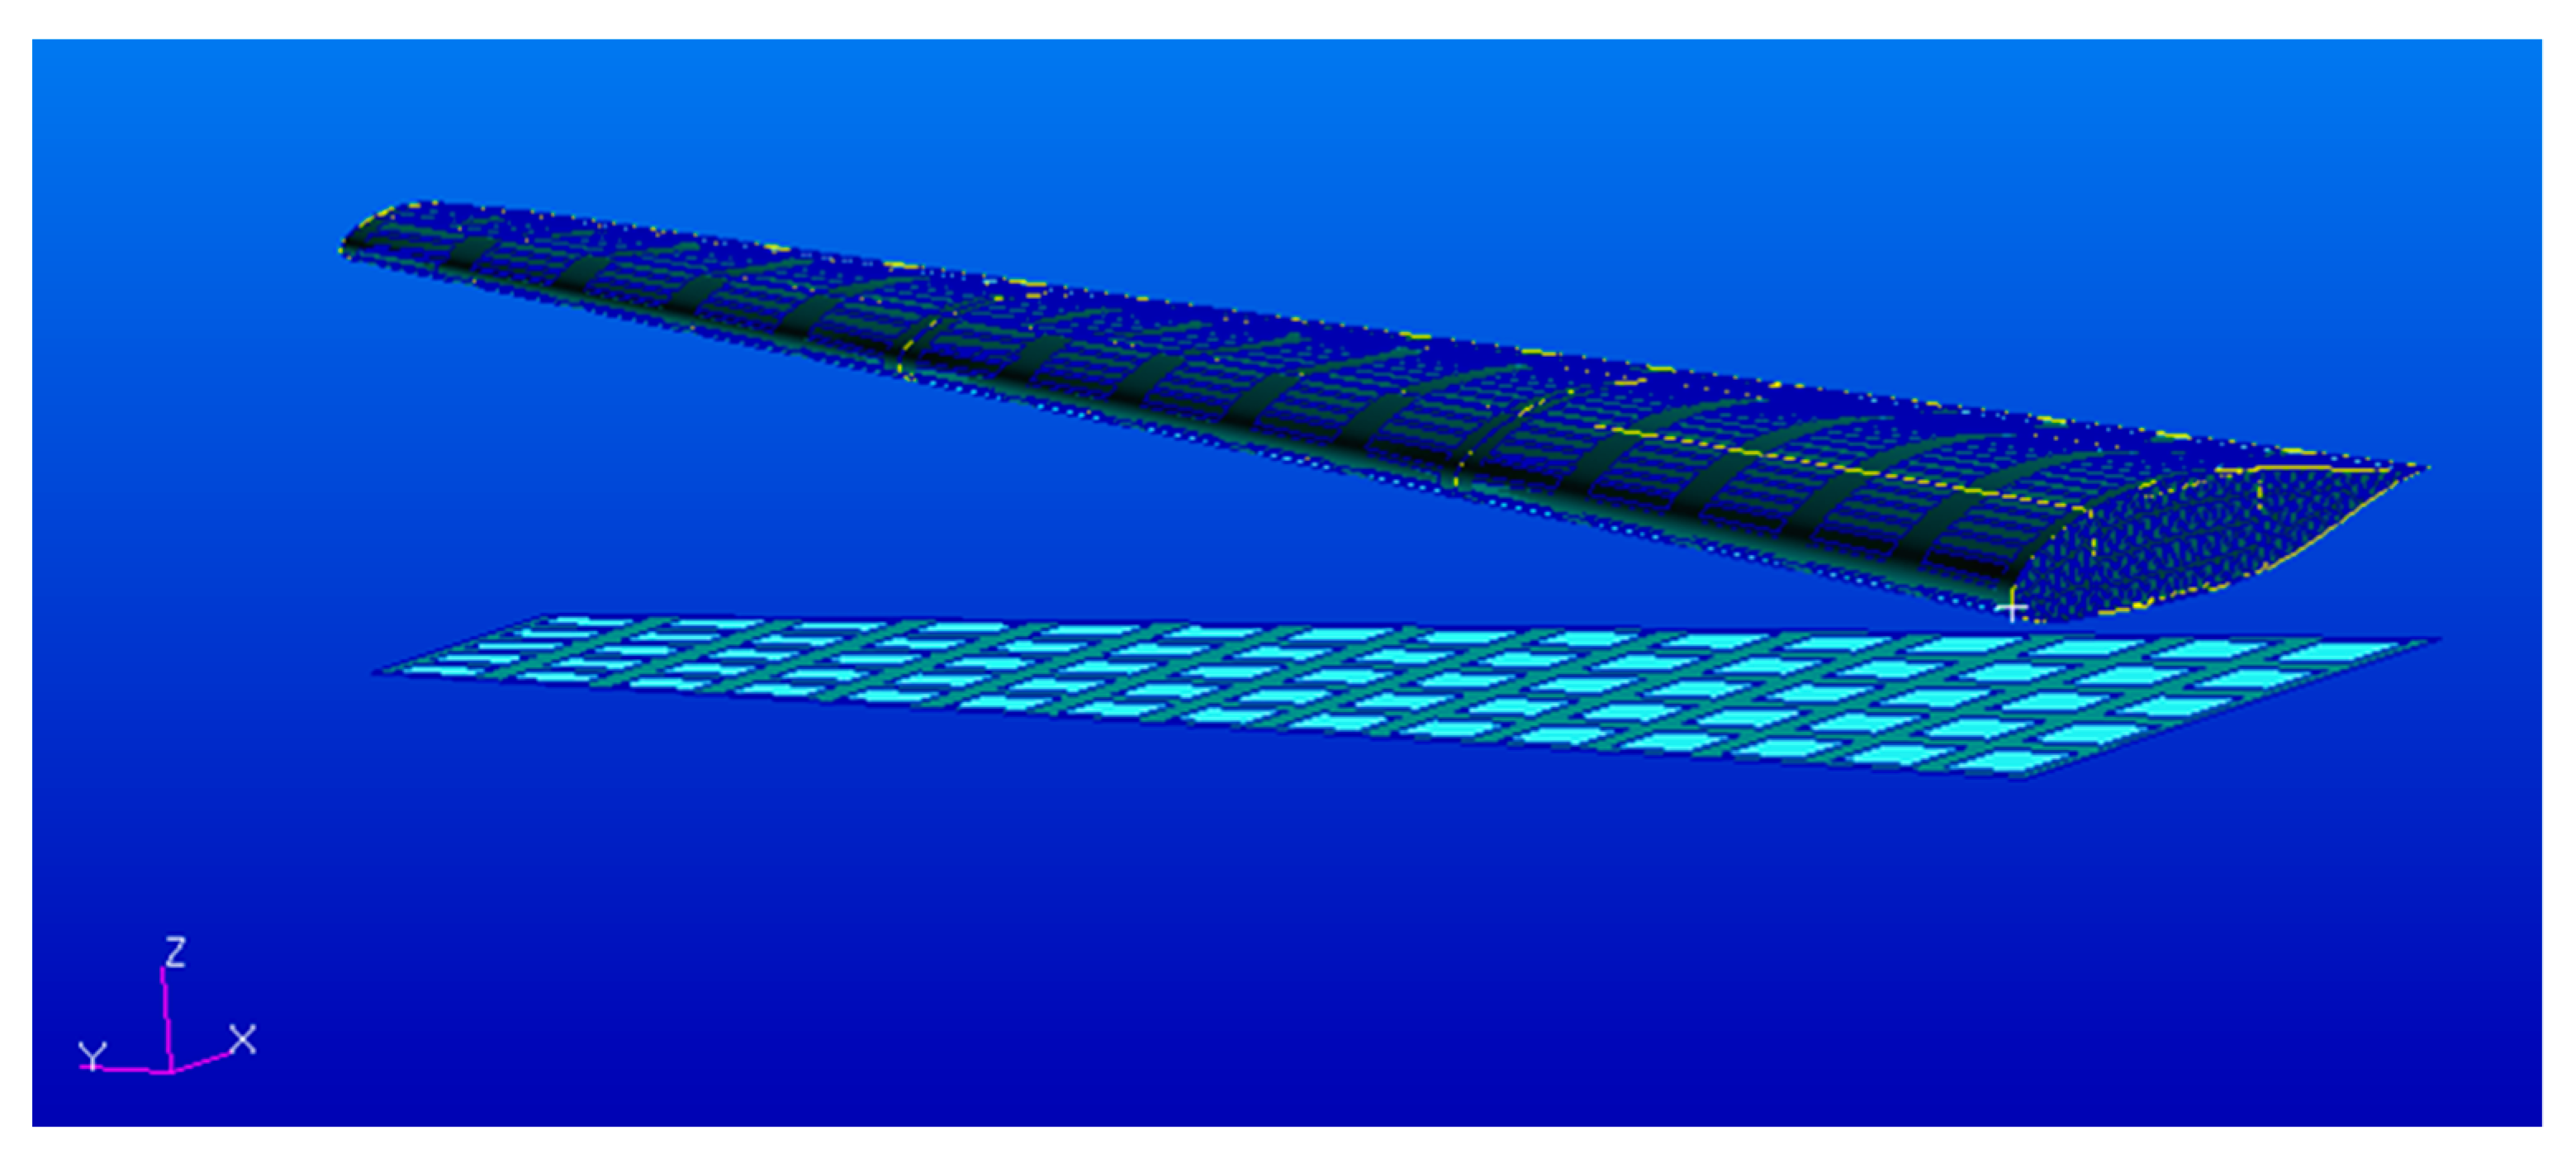
2.2. Elastic Wing Integration

In this study, the aeroelastic analysis was based on the NASTRAN approach for static aeroelastic problems and dealt with the interaction of aerodynamic and structural forces on a flexible vehicle that resulted in a redistribution of the aerodynamic loading as a function of airspeed [31]. The static aeroelastic study here addresses the static aeroelastic problem in aircraft trim conditions.
Three matrix equations summarize the relationships required to define a set of aerodynamic influence coefficients [31,42]. These are the basic relationships between the lifting pressure and the dimensionless vertical or normal velocity induced by the inclination of the surface to the airstream, i.e., the downwash (or normalwash)
w j = A j j { f j / q }
the substantial differentiation matrix of the deflections to obtain downwash
w j = D j k 1 + i k D j k 2 u k + w j g
and the integration of the pressure to obtain forces and moments
P k = S k j { f j }
where w j denotes the downwash and w j g is the static aerodynamic downwash and includes the static incidence distribution that may arise from an initial angle of attack, camber, or twist. f j is the pressure on lifting element j and q is the dynamic pressure. k is the reduced frequency and equal to ω b s / V , where ω is the angular frequency, b s is the reference semichord, and V is the free-stream velocity. A j j is the aerodynamic influence coefficient matrix, a function of the Mach number and reduced frequency. u k and P k are displacements and forces at aerodynamic grid points, respectively. D j k 1 and D j k 2 are real and imaginary parts of the substantial differentiation matrix, respectively. S k j is the integration matrix.
The three matrices presented as Equations (7) through (9) can also be combined to give an aerodynamic influence coefficient matrix [31]:
Q k k = S k j A j j 1 [ D j k 1 + i k D j k 2 ]
Structural and aerodynamic grids are connected by interpolation. This allows for the independent selection of grid points of the structure and aerodynamic elements of the lifting surfaces/bodies in a manner best suited to the particular theory. The interpolation method is called splining. The structural degrees of freedom are chosen as the independent degrees of freedom and the aerodynamic degrees of freedom are dependent. The splining methods lead to an interpolation matrix, [ G k g ] , that relates the components of structural grid point deflections { u g } to the deflections of the aerodynamic grid points { u k } ,
u k = G k g u g
In the case of static aeroelasticity, the downwash relation presented as Equation (7) becomes the following:
w j = D j k u k + D j x u x + w j g
where w j is the vector of aerodynamic degrees of freedom, also called the angle of attack; u k is the vector of aerodynamic displacements or deformations; and u x is the vector of “extra aerodynamic points” used to describe control surface deflections and overall rigid body motions. w j g is an initial static aerodynamic downwash that includes the static incidence distribution that may arise from an initial angle of attack, camber, or washout (twist). D j k denotes the substantial derivative matrix for the aerodynamic displacements. This is basically the D j k 1 term in Equation (8), where the D j k 2 term is not used for the extra aerodynamic points [31].
The theoretical aerodynamic pressures could be derived from the below formula:
f j = q ¯ A j j 1 { w j }
where f j is the vector of pressure on lifting elements. Finally, the aerodynamic forces could be presented by
P k = q ¯ W k k S k j A j j 1 w j + q S k j f j e q ¯
where W k k is a matrix of empirical correction factors to adjust each theoretical aerodynamic box lift and moment to agree with experimental data for incidence changes [31,43]. f j e q ¯ is the vector of experimental pressure coefficients at some reference incidence (e.g., zero angle of attack) for each aerodynamic element.

3. Results

In this section, the results of the rigid airplane will be initially presented, followed by the elastic wing analysis. These analyses will then be integrated to provide comprehensive aerodynamic characteristics of the full aircraft.

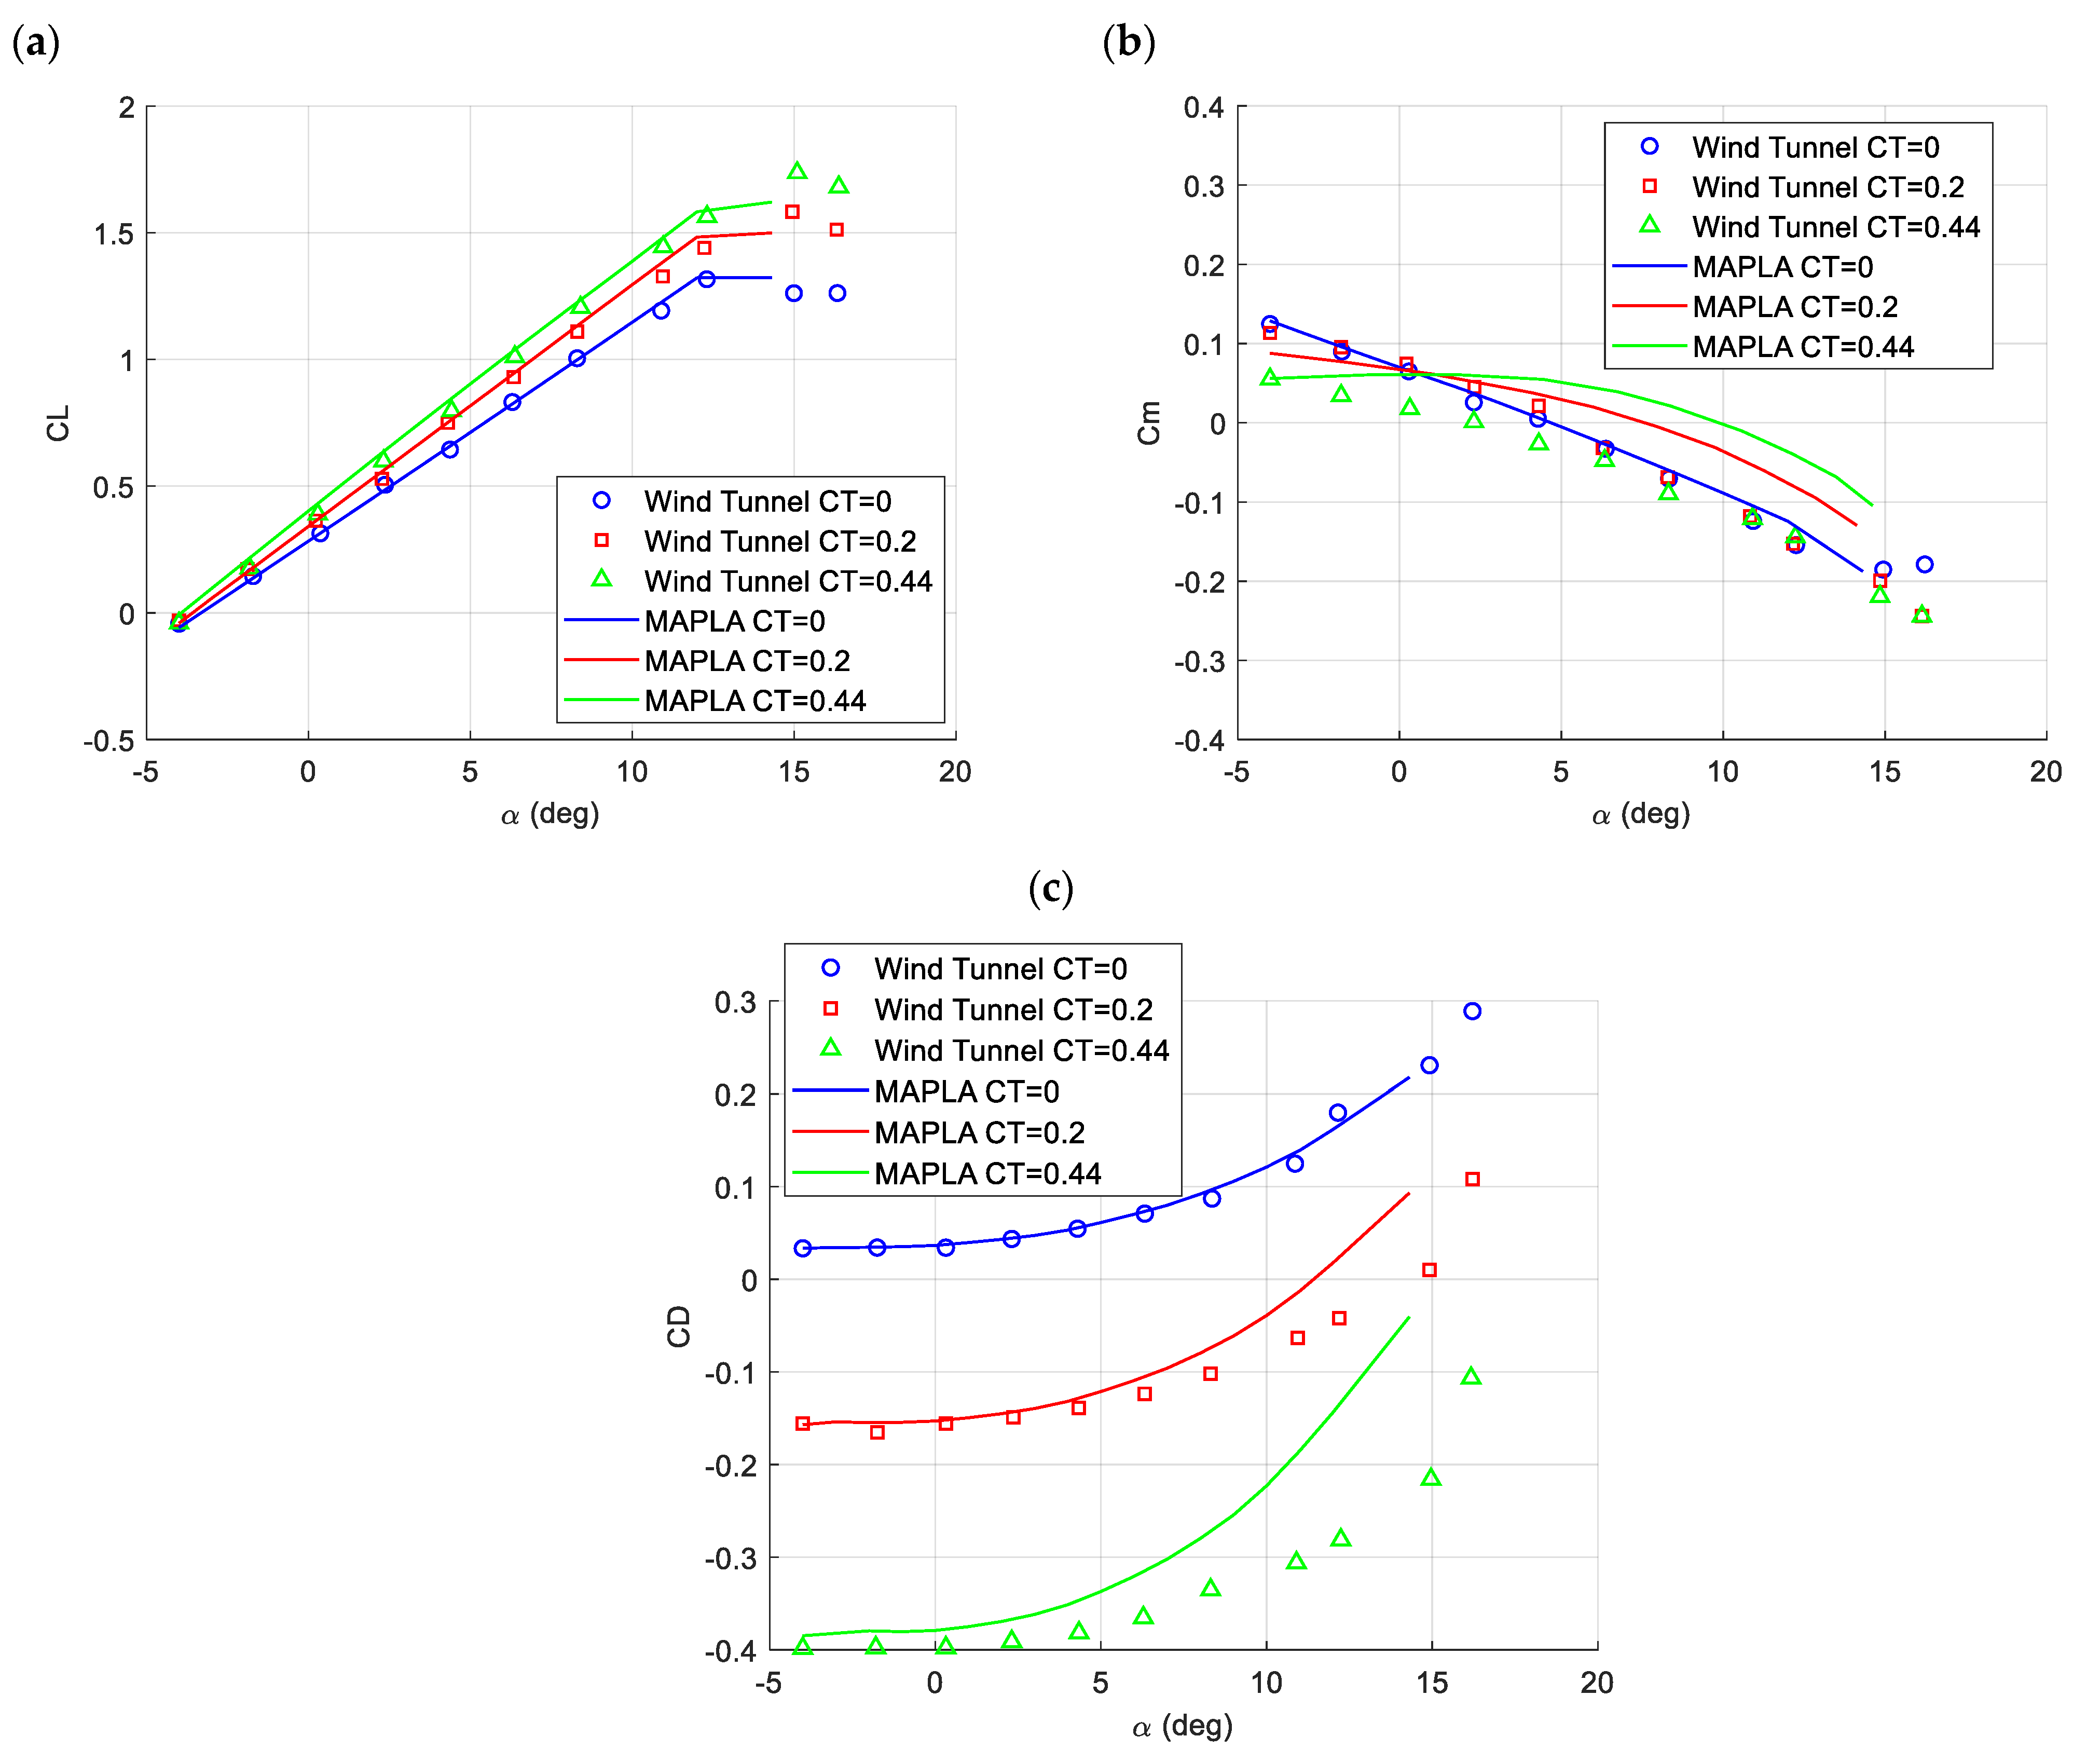
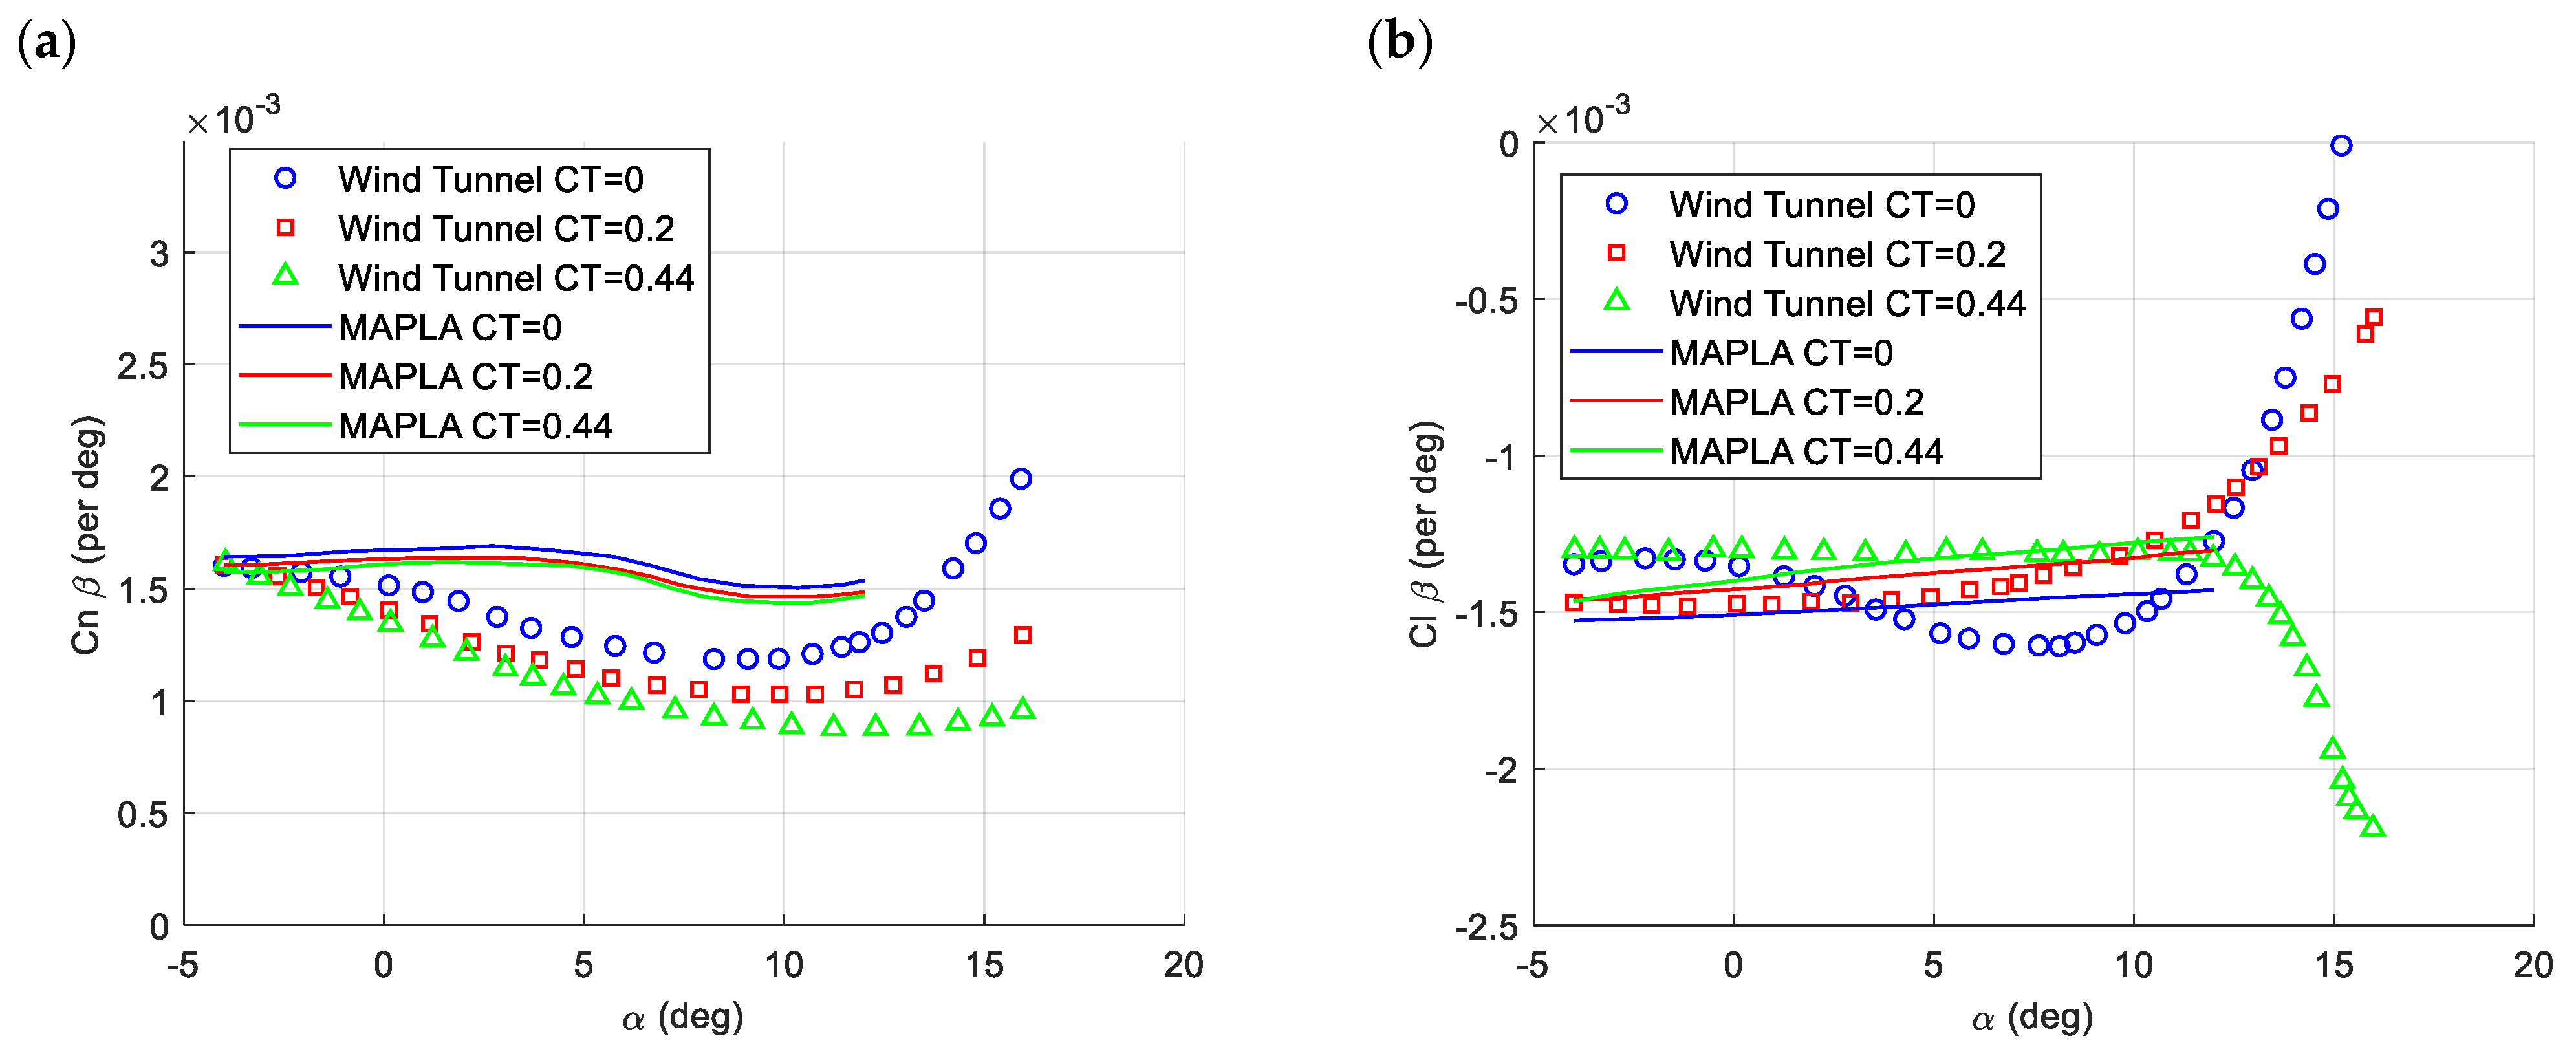
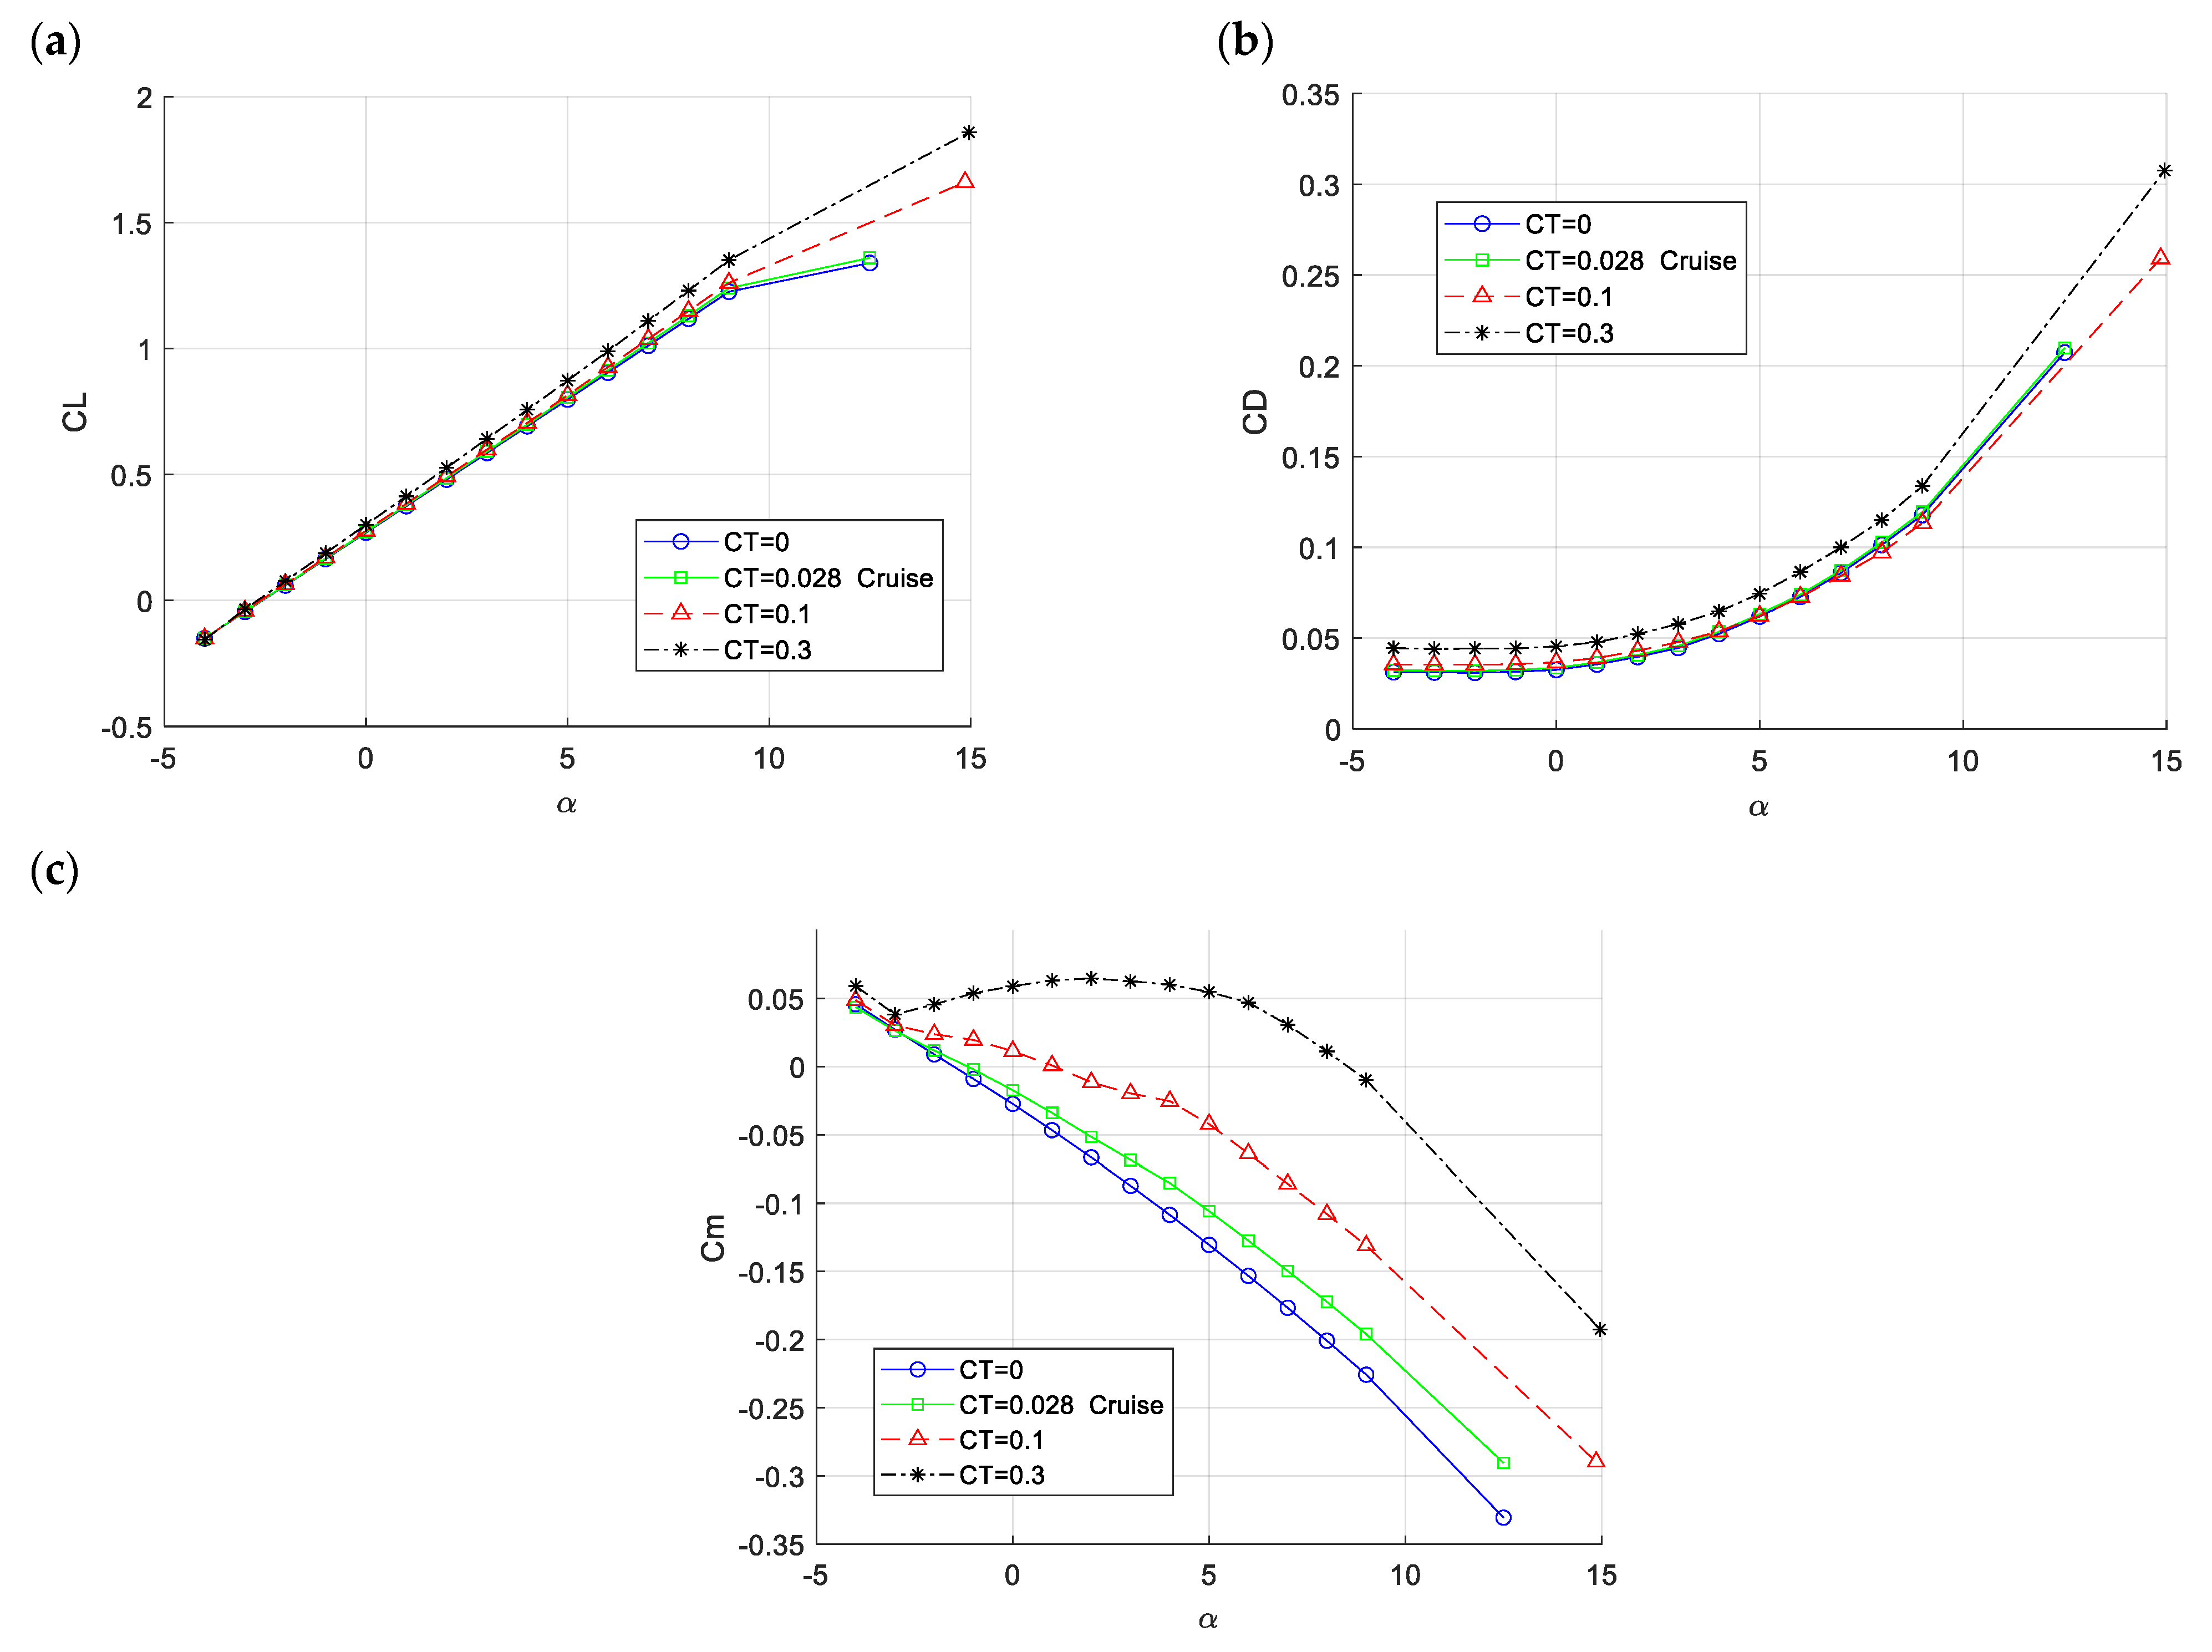
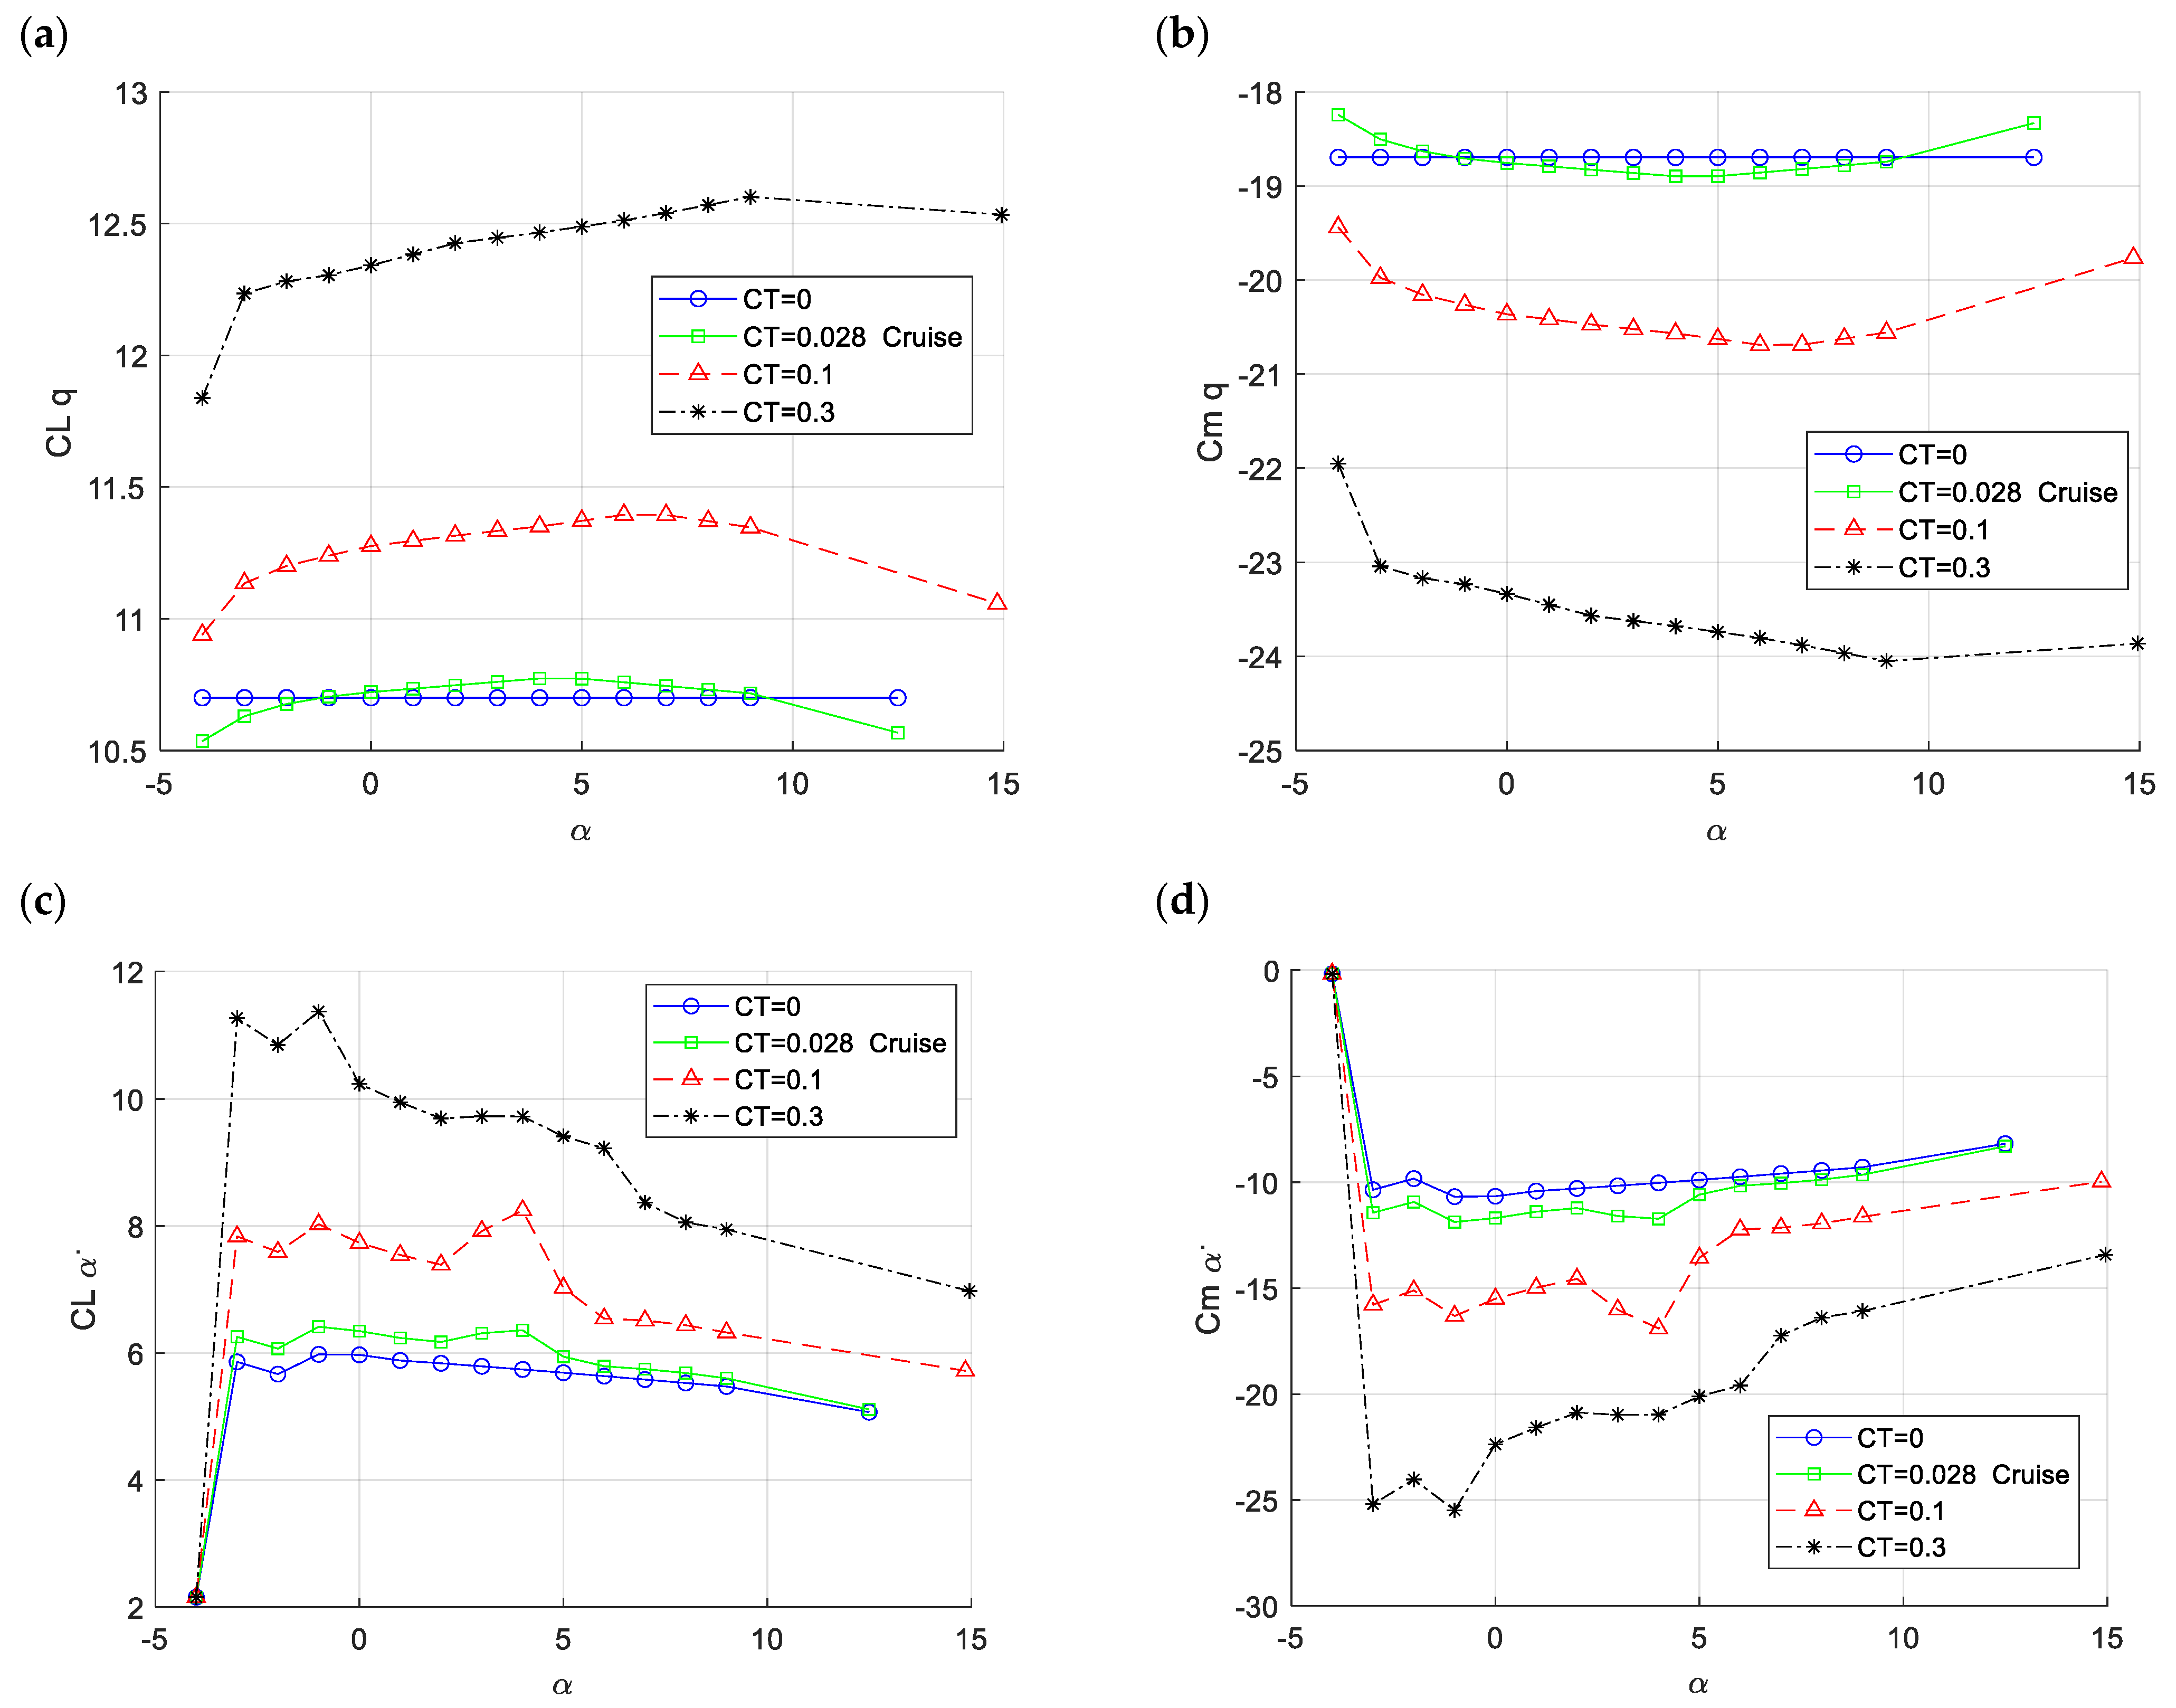
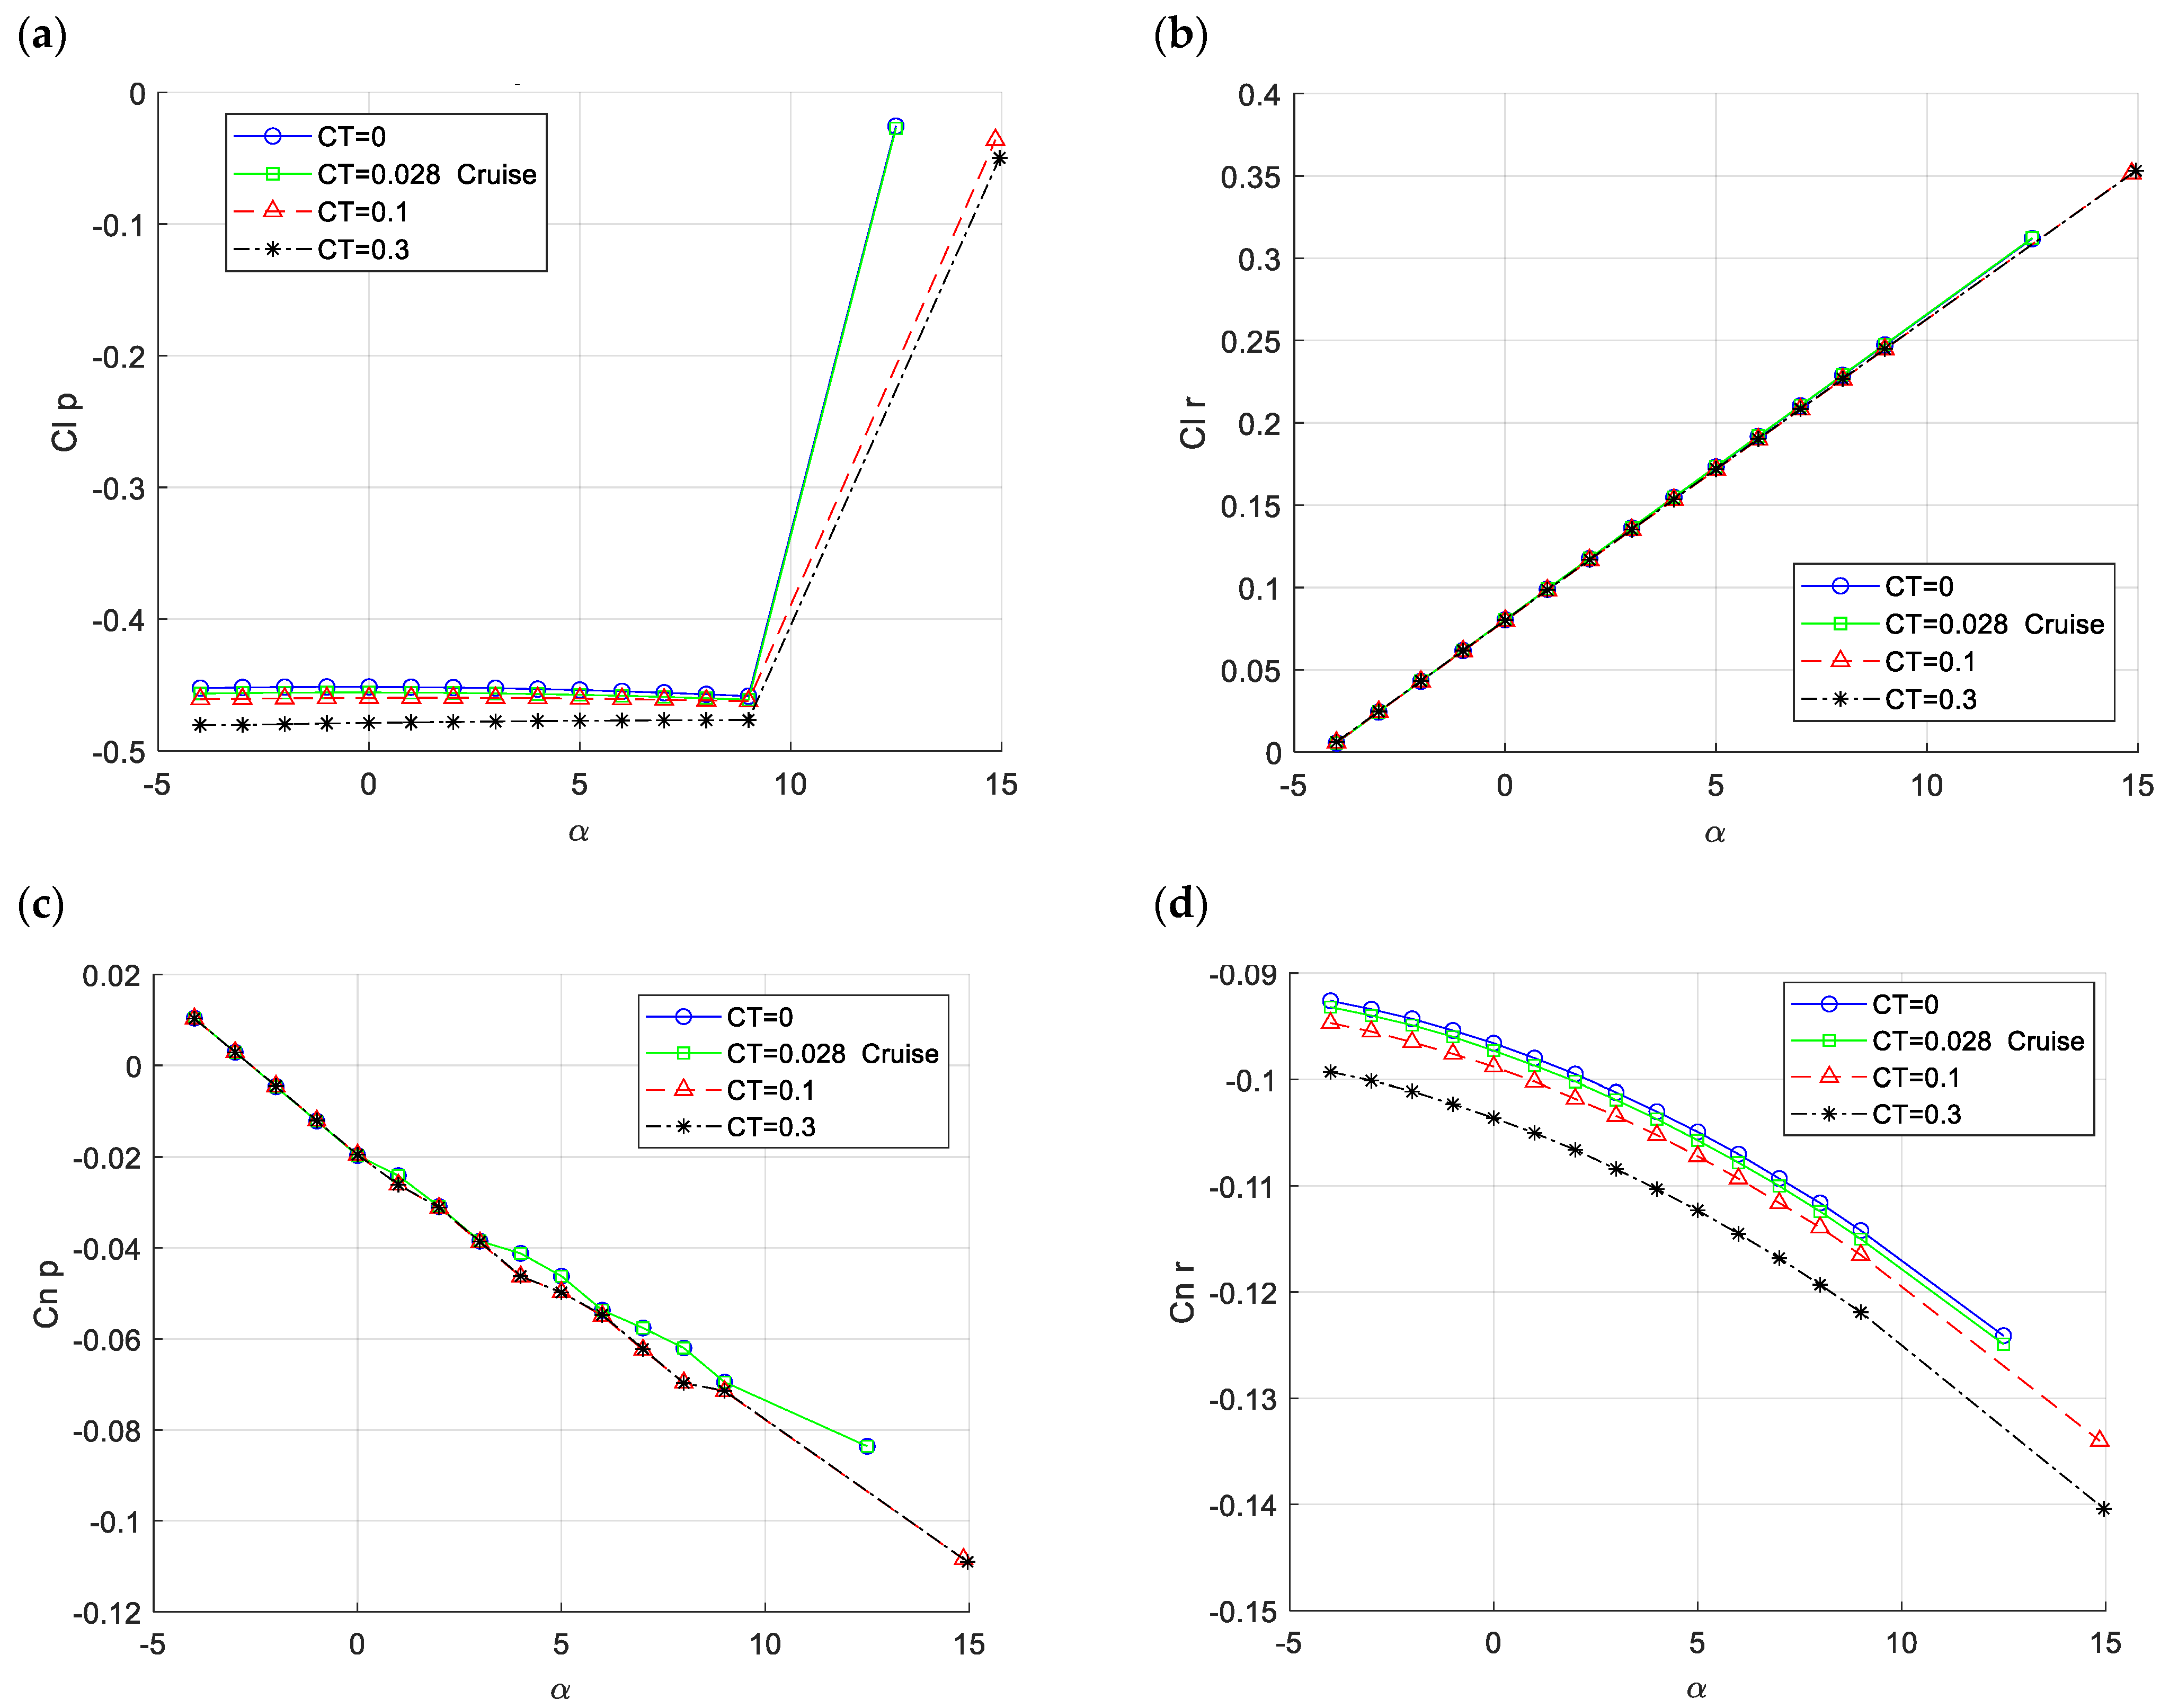
3.1. Rigid Aircraft Aerodynamic Analysis

The aerodynamic characteristics of the twin-engine small aircraft, utilizing the geometry outlined in Figure 4 (generated by MAPLA’s geometry module) and detailed in Table 3, were examined across various flight conditions. This comprehensive analysis aimed to better understand the behavior of the investigated airplane, particularly in relation to propeller effects.
The longitudinal aerodynamic characteristics of the twin-engine propeller-driven aircraft, utilizing the geometry outlined in Table 3, are analyzed in Figure 5 across various flight conditions, including power-off, cruise, and different thrust coefficients such as medium (0.1) and higher (0.3) values typical of take-off conditions. The results highlight significant changes attributed to propeller effects in all longitudinal aerodynamic characteristics compared to the power-off condition. Notably, while lift and drag characteristics exhibit relatively minor alterations with increased values, the pitching moment coefficient demonstrates substantial variations due to heightened propeller effects, as indicated by the thrust coefficient.
Figure 6 illustrates the lateral-directional static results of the twin-engine propeller-driven small aircraft in different flight conditions. It is evident that similar to the longitudinal characteristics, propeller effects intensify the values across all angles of attack.
Figure 7 shows the longitudinal dynamic characteristic results of the twin-engine propeller-driven small aircraft. It is notable that, similar to the trends observed in the static characteristics, the influence of propeller effects amplifies the values across all angles of attack for the longitudinal dynamic characteristics. This indicates a consistent pattern where the propulsion system significantly impacts the aircraft’s dynamic behavior, underscoring the importance of considering propeller effects in aerodynamic analyses for accurate performance predictions.
Finally, Figure 8 shows the lateral-directional dynamic characteristics of the twin-engine propeller-driven small aircraft. Remarkably, akin to the observations made in the static characteristics, the influence of propeller effects is discernible, intensifying the values across all angles of attack. However, it is noteworthy that the results for Clp and Cnr were more significantly impacted by the propeller effects compared to those of Clr and Cnp. This consistency highlights the significant impact of propeller dynamics on the aircraft’s lateral-directional behavior, underscoring the need to account for such effects for comprehensive aerodynamic analysis and design optimization.

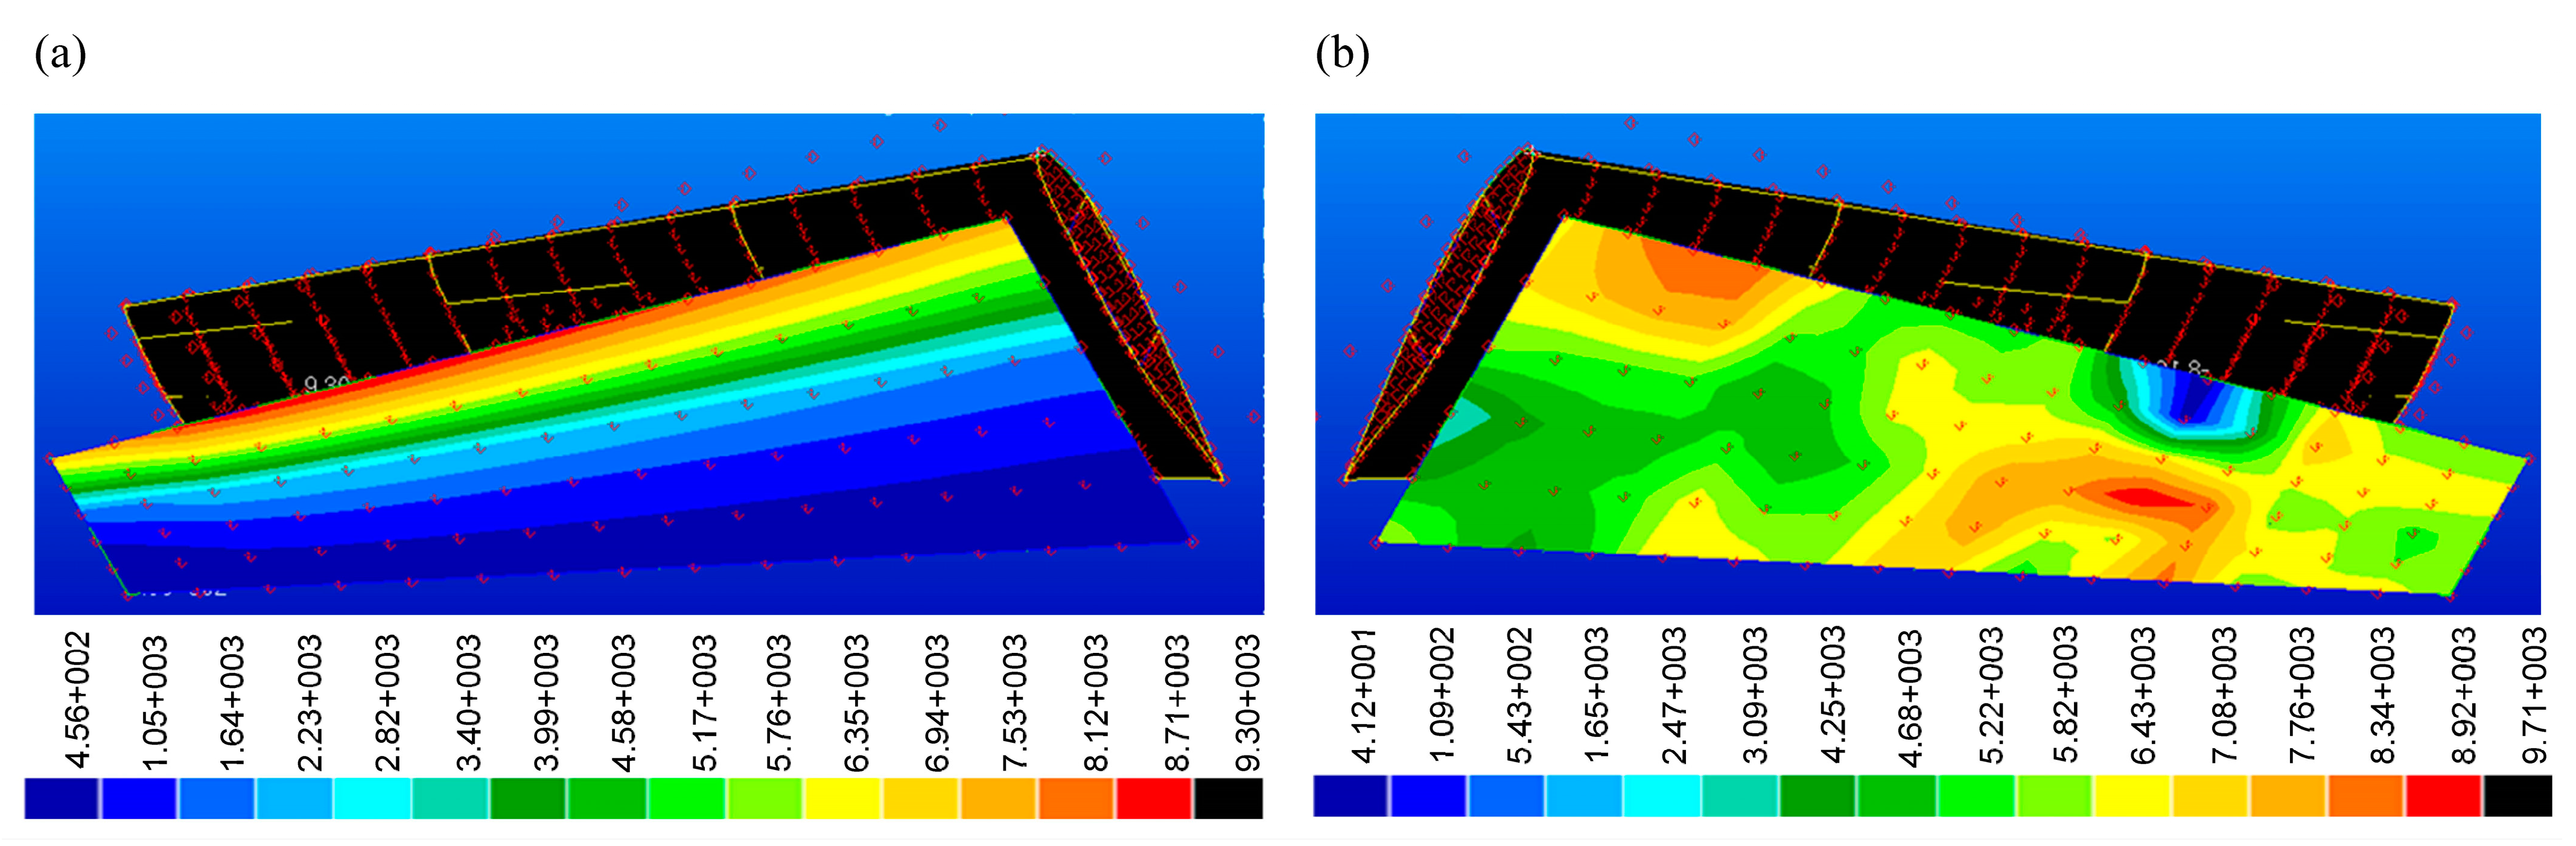
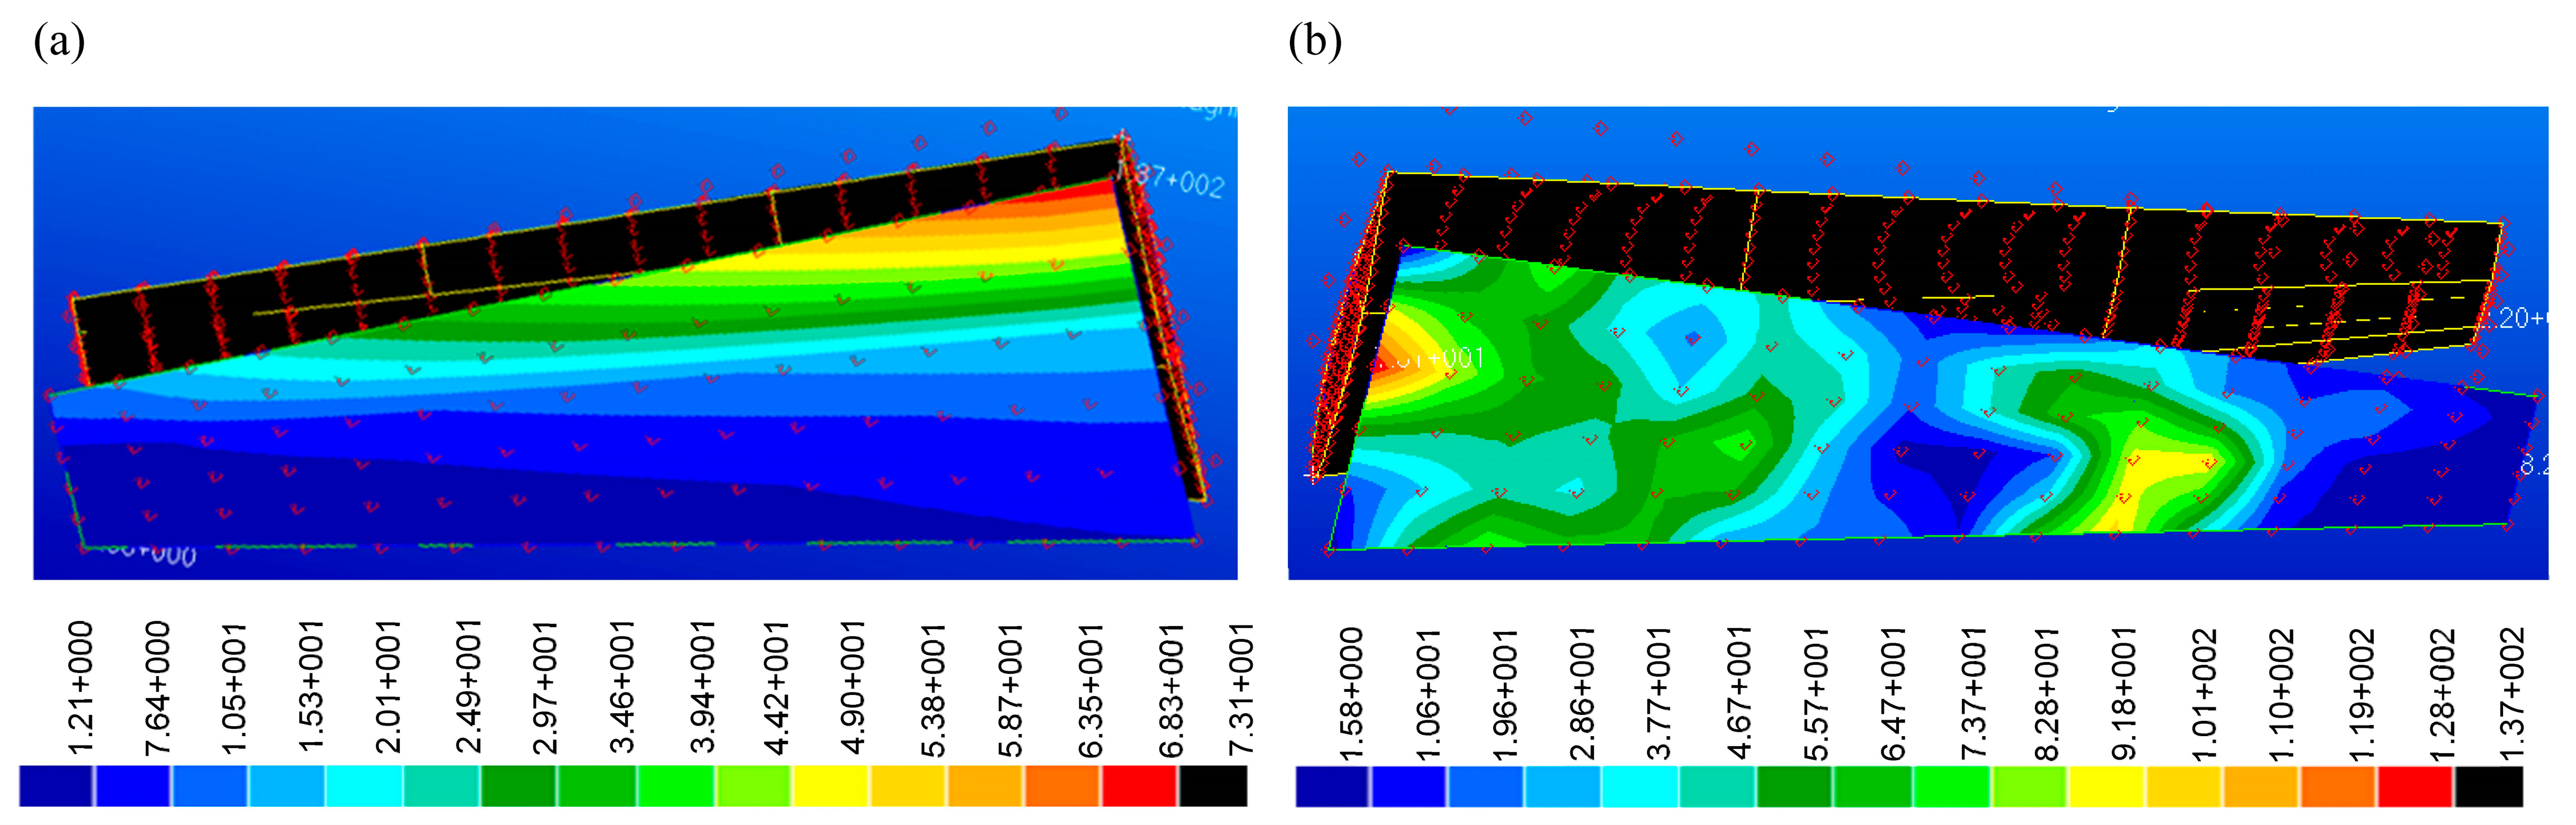
3.2. Aircraft Aerodynamic Analysis with Elastic Wing Integration

As previously mentioned, the aeroelastic analysis presented here was performed using NASTRAN, primarily focusing on static aeroelastic problems (e.g., Solver 144). This approach delved into the intricate interaction between aerodynamic and structural forces acting upon a flexible vehicle, leading to the redistribution of aerodynamic loading relative to airspeed. Specifically, the static aeroelastic study addressed the static aeroelastic problem under aircraft trim conditions [31]. The wing modeling process was conducted using PATRAN, adhering to the methodology proposed by [44]. Figure 9 illustrates the resulting geometry of the wing considered for analysis in the subsequent steps.
The structural model depicted in Figure 9 utilized shell elements for all skins, ribs, and spars, with thickness as the only geometric parameter, suitable for homogeneous isotropic metals. For the beam elements, L-Beam strips were used for the wing box (WB) corners, while Hat-Beam elements were chosen for the strips in the WB skin. The materials used were metals with homogeneous and isotropic properties, with Elastic Modulus, Poisson’s Ratio, and density as the key parameters. The modeling approach considered a linear scaling factor and torsion along the span for each rib, with a specific origin for the profile in space. The meshing strategy ensured accuracy by varying mesh density based on geometry complexity and stress concentrations, especially around critical regions such as WB corners and skin–rib–spar connections. Table 4 presents the details of each element’s mesh strategy. Boundary conditions included fixed constraints at attachment points and distributed loads to represent aerodynamic forces under various flight conditions. These detailed specifications provide a comprehensive evaluation of the structural model, enhancing its credibility and reliability.
In the subsequent phase, the Aero-Structure Coupling module of NASTRAN was employed to generate the coupled aerodynamic and structural models for aeroelastic analysis. Accordingly, from the Flightloads module, using the Aero Modeling tool, Flat Plate aero modeling was selected. For the Flat Plate aero modeling, it was crucial to appropriately select the surface. As illustrated in Figure 10, the nodes on the surface were first chosen chordwise and then spanwise, and this approach was also used for meshing, ensuring that the mesh was generated chordwise first and then spanwise. Next, using the aeroelasticity module of NASTRAN, under the Aero-Structure Coupling section, both structure and aero models were selected to initiate the coupling process. Finally, by choosing the Auto Select Spline option, the Aero-Structural Coupling process was completed. The resultant Aero-Structural Coupling model is depicted in Figure 11. Following the creation of the Aero-Structural Coupling model, the Aeroelastic Analysis module was utilized, with the solution type set to Static Aeroelasticity. Specifically, the Flexible Trim method from NASTRAN was employed for this analysis.
Figure 12a presents the pressure distribution across the wing surface in Newtons per square meter, emphasizing aerodynamic behavior while assuming rigid components within the wing model, considering cruise flight conditions at a speed of 90 m/s. Notably, a linear distribution of pressure along the wingspan was evident, accompanied by chordwise nonlinear behavior. Higher pressure values were observed on the front side, contrasting with lower values on the aft side of the wing model. This depiction provides valuable insights into the interaction between aerodynamic forces and the wing structure under conditions of rigidity. In contrast, Figure 12b explores the same analysis while accounting for the presence of elastic components within the wing model. As illustrated, the pressure distribution was influenced by the behavior of elasticity. This representation offers a nuanced understanding of how aerodynamic forces are impacted by the incorporation of elasticity into the wing structure. By comparing these two scenarios, we gain valuable insights into the effects of structural flexibility on aerodynamic behavior and its consequential implications for overall aircraft performance. The resulting aerodynamic characteristics for both rigid and elastic configurations of the total aircraft are consolidated in Table 1, covering the linear range of the angle of attack.
Figure 13a illustrates the moment distribution across the wing surface in Newtons per meter, assuming rigid components within the wing model, considering cruise flight conditions at a speed of 90 m/s. Notably, it reveals a linear distribution of moment along the wingspan, accompanied by chordwise nonlinear behavior. Higher moment values were concentrated on the front side, contrasting with lower values on the aft side of the wing model. This depiction provides valuable insights into the interaction between moment changes and the wing structure under conditions of rigidity. In contrast, Figure 13b delves into the same analysis, this time considering the moment distribution of elastic components within the wing model. As depicted, the moment distribution was notably influenced by the behavior of elasticity. By comparing these two scenarios, we gain valuable insights into the effects of structural flexibility on moment behavior and its consequential implications for overall aircraft performance.
Finally, Figure 14a illustrates the force distribution across the wing surface in Newtons, emphasizing aerodynamic behavior under the assumption of rigid components within the wing model at a speed of 90 m/s. As with the previous characteristics, a linear distribution of force along the wingspan was evident, accompanied by chordwise nonlinear behavior. Higher force values were concentrated on the front side, while lower values were observed on the aft side of the wing model. This representation offers valuable insights into the interaction between aerodynamic forces and the wing structure under conditions of rigidity. In contrast, Figure 14b delves into the same analysis, this time considering the force distribution of elastic components within the wing model. As depicted, the force distribution was notably influenced by the behavior of elasticity. This representation offers a nuanced understanding of how aerodynamic forces are impacted by the incorporation of elasticity into the wing structure. By comparing these two scenarios, we gain valuable insights into the effects of structural flexibility on force behavior throughout the wing model surface and its consequential implications for overall aircraft performance. The resulting aerodynamic characteristics for both rigid and elastic configurations of the total aircraft are consolidated in Table 1, encompassing the linear range of the angle of attack.
In the subsequent step, leveraging MAPLA’s modular capability, the aerodynamic analysis for the wing component was updated using the attained aerodynamic results from NASTRAN. Subsequently, the remaining analysis was conducted by running MAPLA based on the new results for the wing, while considering propeller effects and power contributions. The summary of the results for both rigid and elastic aircraft configurations in different power settings is presented in Table 5, focusing on the linear angles of attack. Furthermore, the presentation of the average deviation from the rigid aircraft configuration offers a more comprehensive understanding, enabling a clearer distinction of the contribution and significance of aeroelasticity in the analysis. Regarding these deviations, it is evident that the aircraft would be notably influenced by elasticity, particularly for longitudinal characteristics, with an increase of nearly 20%. Conversely, for lateral-directional characteristics, this effect appears to be relatively lower, with an estimated impact of approximately 4%. The observed average deviation between the rigid and elastic airplane results can be attributed to several factors. Firstly, the rigid model did not account for deformation under load, leading to differences in stress distribution compared to the elastic model. Secondly, the mesh quality and density played a crucial role; the elastic model typically required a finer mesh to accurately capture stress concentrations and deformation characteristics. Thirdly, the assumptions and simplifications made in the modeling approach, such as the linear scaling factor and specific origin for the profile, could have introduced variations in the results. The results achieved in this study are also consistent with other studies on aeroelasticity aircraft analysis [45].

4. Conclusions

In conclusion, this paper explored the critical influence of propeller effects, power contribution, and elasticity on small propeller-driven aircraft and UAV aerodynamics. Through meticulous analysis, a twin-engine propeller-driven aircraft was examined, shedding light on their combined impact. Validation through comparative analysis and NASTRAN software utilization reinforced our findings. Leveraging MAPLA’s capability, the aerodynamic analysis was updated for the wing component, considering propeller effects and power contributions. The results underscore the significance of these factors at various angles of attack. Additionally, deviations from the rigid aircraft configuration highlighted a substantial impact of aeroelasticity, particularly in longitudinal characteristics, with an approximately 20% increase, and a lower impact of less than 5% in lateral-directional characteristics. This study advances small propeller-driven aircraft design considerations, offering insights for future research in UAM. By deepening the understanding of aerodynamic complexities, future works can contribute to more efficient and optimized aircraft designs in the evolving aviation landscape.

Funding

This research received no external funding.

Data Availability Statement

Data are contained within the article.

Conflicts of Interest

The authors declare no conflicts of interest.

References

  1. Garrow, L.A.; German, B.; Schwab, N.T.; Patterson, M.D.; Mendonca, N.; Gawdiak, Y.O.; Murphy, J.R. A Proposed Taxonomy for Advanced Air Mobility. In Proceedings of the AIAA AVIATION 2022 Forum 2022, Chicago, IL, USA, 27 June–1 July 2022; p. 3321. [Google Scholar] [CrossRef]
  2. Du, S.; Zha, Y.; Zhao, Q. Research on Aerodynamic Test Validation and the Vector Force Control Method for an E-STOL Fan Wing Unmanned Aerial Vehicle. Aerospace 2024, 11, 55. [Google Scholar] [CrossRef]
  3. Wen, J.; Song, Y.; Wang, H.; Han, D.; Yang, C. Training Sample Pattern Optimization Based on a Swarm Intelligence Algorithm for Tiltrotor Flight Dynamics Model Approximation. Aerospace 2023, 10, 1006. [Google Scholar] [CrossRef]
  4. NASA Website, Advanced Air Mobility Mission Overview. Available online: https://www.nasa.gov/aam (accessed on 12 February 2024).
  5. Transport Canada, Advanced Air Mobility. Available online: https://tc.canada.ca/en/aviation/advanced-air-mobility (accessed on 12 February 2024).
  6. FAA Website, Section 6. Advanced Air Mobility. Available online: https://www.faa.gov/air_traffic/publications/atpubs/aim_html/chap11_section_6.html (accessed on 12 February 2024).
  7. Kiesewetter, L.; Shakib, K.H.; Singh, P.; Rahman, M.; Khandelwal, B.; Kumar, S.; Shah, K. A holistic review of the current state of research on aircraft design concepts and consideration for advanced air mobility applications. Prog. Aerosp. Sci. 2023, 142, 100949. [Google Scholar] [CrossRef]
  8. Rostami, M.; Chung, J.; Neufeld, D. Vertical tail sizing of propeller-driven aircraft considering the asymmetric blade effect. Proc. Inst. Mech. Eng. Part G J. Aerosp. Eng. 2021, 236, 1184–1195. [Google Scholar] [CrossRef]
  9. Benedict, M.; Jarugumilli, T.; Chopra, I. Effect of rotor geometry and blade kinematics on cycloidal rotor hover performance. J. Aircr. 2013, 50, 1340–1352. [Google Scholar] [CrossRef]
  10. Rostami, M.; Bagherzadeh, S.A. Development and validation of an enhanced semi-empirical method for estimation of aerodynamic characteristics of light, propeller-driven airplanes. Proc. Inst. Mech. Eng. Part G J. Aerosp. Eng. 2018, 232, 638–648. [Google Scholar] [CrossRef]
  11. Cole, J.A.; Maughmer, M.D.; Kinzel, M.; Bramesfeld, G. Higher-order free-wake method for propeller-wing systems. J. Aircr. 2019, 56, 150–165. [Google Scholar] [CrossRef]
  12. Rostami, M.; Chung, J.; Park, H.U. Design optimization of multi-objective proportional–Integral–Derivative controllers for enhanced handling quality of a twin-engine, propeller-driven airplane. Adv. Mech. Eng. 2020, 12, 1687814020923178. [Google Scholar] [CrossRef]
  13. Clarke, M.A.; Erhard, R.M.; Alonso, J.J. Aerodynamic Optimization of Wing-Mounted Propeller Configurations for Distributed Electric Propulsion Architectures, AIAA Aviat. Aeronaut. In Proceedings of the Forum Expo. AIAA Aviation Forum 2021, Virtual Event, 2–6 August 2021; pp. 1–19. [Google Scholar] [CrossRef]
  14. Rostami, M.; Chung, J. Multidisciplinary Analysis Program for Light Aircraft (Mapla). Prog. Can. Mech. Eng. 2021, 4, 27–30. [Google Scholar] [CrossRef]
  15. Rostami, M.; Bardin, J.; Neufeld, D.; Chung, J. EVTOL Tilt-Wing Aircraft Design under Uncertainty Using a Multidisciplinary Possibilistic Approach. Aerospace 2023, 10, 718. [Google Scholar] [CrossRef]
  16. Rostami, M.; Bardin, J.; Neufeld, D.; Chung, J. A Multidisciplinary Possibilistic Approach to Size the Empennage of Multi-Engine Propeller-Driven Light Aircraft. Aerospace 2022, 9, 160. [Google Scholar] [CrossRef]
  17. Oyama, Y.; Rostami, M.; Chung, J. Conceptual Design and Analysis of a Box Fan-in-Split-Wing Tiltrotor EVTOL Aircraft. Aircr. Eng. Aerosp. Technol. 2024. [Google Scholar] [CrossRef]
  18. Liu, Y.; Druyor, C.T.; Wang, L. High-fidelity Analysis of Lift+Cruise VTOL Urban Air Mobility Concept Aircraft. In Proceedings of the AIAA AVIATION 2023 Forum, San Diego, CA, USA, 12–16 June 2023; p. 3671. [Google Scholar] [CrossRef]
  19. Liu, Y.; Wang, L. High-Fidelity Simulations of Lift+Cruise VTOL Urban Air Mobility Concept Aircraft in Hover. In Proceedings of the AIAA SciTech Forum Exposition 2024, Orlando, FL, USA, 8–12 January 2024; pp. 1–21. [Google Scholar] [CrossRef]
  20. Diaz, P.V.; Yoon, S. Computational Analysis of Urban Air Mobility Vehicles. In Proceedings of the 8th European Conference for Aeronautics and Space Sciences, Madrid, Spain, 1–4 July 2019. [Google Scholar] [CrossRef]
  21. Murphy, P.C.; Buning, P.G.; Simmons, B.M. Rapid aero modeling for urban air mobility aircraft in computational experiments. In Proceedings of the AIAA Scitech 2021 Forum, Virtual, 11–15 January 2021; pp. 1–23. [Google Scholar] [CrossRef]
  22. Yoon, S.; Lee, H.C.; Pulliam, T.H. Computational Analysis of Multi-Rotor Flows. In Proceedings of the 54th AIAA Aerospace Sciences Meeting, San Diego, CA, USA, 4–8 January 2016. [Google Scholar] [CrossRef]
  23. Kenway, G.K.W.; Martins, J.R.R.A. Multipoint high-fidelity aerostructural optimization of a transport aircraft configuration. J. Aircr. 2014, 51, 144–160. [Google Scholar] [CrossRef]
  24. Andersen, G.R.; Cowan, D.L.; Piatak, D.J. Aeroelastic modeling, analysis and testing of a morphing wing structure. In Proceedings of the 48th AIAA/ASME/ASCE/AHS/ASC Structures, Structural Dynamics, and Materials Conference, Honolulu, HI, USA, 23–26 April 2007; Volume 1, pp. 359–373. [Google Scholar] [CrossRef]
  25. Tiomkin, S.; Raveh, D.E. A review of membrane-wing aeroelasticity. Prog. Aerosp. Sci. 2021, 126, 100738. [Google Scholar] [CrossRef]
  26. Geuzaine, P.; Brown, G.; Harris, C.; Farhat, C. Aeroelastic dynamic analysis of a full F-16 configuration for various flight conditions. AIAA J. 2003, 41, 363–371. [Google Scholar] [CrossRef]
  27. Taylor, N.V.; Allen, C.B.; Gaitonde, A.; Jones, D.P. A structure-coupled CFD method for time-marching flutter analysis. Aeronaut. J. 2004, 108, 389–401. [Google Scholar] [CrossRef]
  28. Woodgate, M.A.; Badcock, K.J.; Rampurawala, A.M.; Richards, B.E.; Nardini, D.; DeC Henshaw, M.J. Aeroelastic calculations for the hawk aircraft using the euler equations. J. Aircr. 2005, 42, 1005–1012. [Google Scholar] [CrossRef]
  29. NASA STRuctrual ANalysis (NASTRAN). Available online: https://software.nasa.gov/software/LAR-16804-GS#:~:text=NASTRAN%20is%20a%20finite%20element,for%20insight%20into%20structural%20behavior (accessed on 12 February 2024).
  30. Kilimtzidis, S.; Kostopoulos, V. Static Aeroelastic Optimization of High-Aspect-Ratio Composite Aircraft Wings via Surrogate Modeling. Aerospace 2023, 10, 251. [Google Scholar] [CrossRef]
  31. MSC Nastran 2017—Aeroelastic Analysis User’s Guide. 2017. Available online: https://simcompanion.hexagon.com/customers/s/article/msc-nastran-2017-1--aeroelastic-analysis-user-s-guide-doc11552 (accessed on 12 February 2024).
  32. Solano, D.; Sarojini, D.; Corman, J.; Mavris, D. Structural sizing of unconventional aircraft under static and dynamic aeroelastic loading. In Proceedings of the AIAA Scitech 2020 Forum, Orlando, FL, USA, 6–10 January 2020. 1 PartF. [Google Scholar] [CrossRef]
  33. Guo, H.; Yan, Y.; Xia, H.; Yu, L.; Lv, B. The Prediction and Correction Method of Aircraft Static Aeroelastic Effects: A Review of Recent Progress. Actuators 2022, 11, 309. [Google Scholar] [CrossRef]
  34. Guerrero, J.E.; Sanguineti, M.; Wittkowski, K. Variable cant angle winglets for improvement of aircraft flight performance. Meccanica 2020, 55, 1917–1947. [Google Scholar] [CrossRef]
  35. Hoang, N.T.B. Computational investigation of variation in wing aerodynamic load under effect of aeroelastic deformations. J. Mech. Sci. Technol. 2018, 32, 4665–4673. [Google Scholar] [CrossRef]
  36. Scholten, W.; Hartl, D. Uncoupled method for static aeroelastic analysis. J. Fluids Struct. 2021, 101, 103221. [Google Scholar] [CrossRef]
  37. Guo, S. Aeroelastic optimization of an aerobatic aircraft wing structure. Aerosp. Sci. Technol. 2007, 11, 396–404. [Google Scholar] [CrossRef]
  38. Amoozgar, M.R.; Fazelzadeh, S.A.; Khodaparast, H.H.; Friswell, M.I.; Cooper, J.E. Aeroelastic stability analysis of aircraft wings with initial curvature. Aerosp. Sci. Technol. 2020, 107, 106241. [Google Scholar] [CrossRef]
  39. Crovato, A.; Almeida, H.S.; Vio, G.; Silva, G.H.; Prado, A.P.; Breviglieri, C.; Guner, H.; Cabral, P.H.; Boman, R.; Terrapon, V.E.; et al. Effect of levels of fidelity on steady aerodynamic and static aeroelastic computations. Aerospace 2020, 7, 42. [Google Scholar] [CrossRef]
  40. Wolowicz, H.; Yancey, R.B. Longitudinal Aerodynamic Characteristics of Light, Twin-Engine Propeller-Driven Airplanes. In Nasa Technical Note; No. H-646; NASA Flight Research Center: Edwards, CA, USA, 1972. [Google Scholar]
  41. Wolowicz, H.; Yancey, R.B. Lateral Directional Aerodynamic Characteristics of Light, Twin-Engine Propeller-Driven Airplanes. In Nasa Technical Note; No. H-694; NASA Flight Research Center: Edwards, CA, USA, 1972; pp. 17–56. [Google Scholar]
  42. Rodden, W.P.; Revell, J.D. Errata: “The Status of Unsteady Aerodynamic Influence Coefficients”. AIAA J. 1963, 1, 724–725. [Google Scholar] [CrossRef]
  43. Giesing, J.P.; Kalman, T.P.; Rodden, W.P. Correction Factor Techniques for Improving Aerodynamic Prediction Methods, NASA Rep. 1976. Available online: https://ntrs.nasa.gov/citations/19760016071 (accessed on 12 February 2024).
  44. Morlier, J. “Wing Creation using PCL/PATRAN”, DMSM/ISAE, SUPAERO. 2011. Available online: https://docplayer.net/12545262-Wing-creation-using-pcl-patran.html (accessed on 12 February 2024).
  45. Rodden, W.P.; Wilson, C.T.; Herting, D.N.; Bellinger, E.D.; MacNeal, R.H. Static Aeroelastic Addition to MSC/NASTRAN; The MacNeal-Schwendler Corporation: Los Angeles, CA, USA, 1984. [Google Scholar]
Figure 1. The twin-engine propeller-driven small airplane under investigation is referenced from NASA’s report [40,41], denoted as (a) for the reported aircraft and (b) for the modeled aircraft utilizing MAPLA.
Aerospace 11 00664 g001
Figure 2. Comparison of longitudinal aerodynamic characteristics between the twin-engine small airplane using MAPLA and wind tunnel test results [40,41] considering (a) lift coefficient, (b) drag coefficient, and (c) pitching moment coefficient across various flight conditions, with an empty weight at CG = 10%.
Aerospace 11 00664 g002
Figure 3. Comparison of lateral-directional aerodynamic characteristics between the investigated twin-engine small airplane using MAPLA and wind tunnel test results [40,41], focusing on (a) weathercock stability and (b) effective dihedral coefficient across various flight conditions, with an empty weight at CG = 10%.
Aerospace 11 00664 g003
Figure 4. The investigated twin-engine propeller-driven small airplane.
Aerospace 11 00664 g004
Figure 5. Results of investigated twin-engine propeller-driven small aircraft model in various flight conditions, where CT = 0, CT = 0.028, CT = 0.1, and CT = 0.3, versus angle of attack for (a) lift coefficient, (b) drag coefficient, and (c) pitching moment coefficient.
Aerospace 11 00664 g005
Figure 6. Results of investigated twin-engine propeller-driven small aircraft model in 1/rad in various flight conditions, where CT = 0, CT = 0.028, CT = 0.1, and CT = 0.3, versus angle of attack for (a) weathercock stability coefficient, and (b) effective dihedral coefficient.
Aerospace 11 00664 g006
Figure 7. Results of investigated twin-engine propeller-driven small aircraft model in 1/rad various flight conditions, where CT = 0, CT = 0.028, CT = 0.1, and CT = 0.3, versus angle of attack for (a) lift coefficient due to pitch rate, (b) lift coefficient due to vertical acceleration, (c) pitching moment coefficient due to pitch rate, and (d) pitching moment coefficient due to vertical acceleration.
Aerospace 11 00664 g007
Figure 8. Results of investigated twin-engine propeller-driven small aircraft model in 1/rad in various flight conditions, where CT = 0, CT = 0.028, CT = 0.1, and CT = 0.3, versus angle of attack for (a) lift coefficient due to pitch rate, (b) lift coefficient due to vertical acceleration, (c) pitching moment coefficient due to pitch rate, and (d) pitching moment coefficient due to vertical acceleration.
Aerospace 11 00664 g008
Figure 9. (a). Schematic of the modeled wing in Patran considering four airfoil sections and the connection boxes (b). Schematic of the mesh model in Patran.
Aerospace 11 00664 g009
Figure 10. The Flat Plate aero modeling definition for Aero-Structure Coupling analysis.
Aerospace 11 00664 g010
Figure 11. The coupled aerodynamic model and structural model (Aero-Structural Coupling model) for aeroelastic analysis in Nastran.
Aerospace 11 00664 g011
Figure 12. The pressure distribution on the wing in Newton per square meter considering (a) rigid components in the model and (b) elastic components in the model.
Aerospace 11 00664 g012
Figure 13. The moment distribution on the wing in Newton–meters considering (a) rigid components in the model and (b) elastic components in the model.
Aerospace 11 00664 g013
Figure 14. The force distribution on the wing in Newtons considering (a) rigid components in the model and (b) elastic components in the model.
Aerospace 11 00664 g014
Table 1. The general characteristics of the aircraft employed in the validation process for MAPLA [40,41].
ParameterDescriptionValue
b w Wingspan, m10.97
MACMean aerodynamic chord, m1.51
S w Wing surface area, m216
ARAspect ratio7.52
MMach number0.25
W T O m a x Max take-off weight, Kg980
CGCenter of mass, %10
hAltitude, m0
Table 2. Deviation of the aerodynamic characteristics for the investigated twin-engine aircraft.
Aerodynamic CharacteristicsDeviation from Wind Tunnel Tests (Linear Angles)
CT = 0CT = 0.2CT = 0.44
C L 5 % 5 % 5 %
C D 5 % 15 % 35 %
C m 10 % 20 % 50 %
C n β 35 % 40 % 45 %
C l β 25 % 15 % 10 %
Table 3. Geometry parameters and descriptions of the small twin-engine propeller-driven aircraft.
ComponentParameterDescriptionValue
Fuselage l f Fuselage length, m8.6
S f Planform area of fuselage, sq m8.0
w f Maximum width of the fuselage, m1.545
Horizontal Tail i h Horizontal tail incidence angle, deg1.92
bhHorizontal tail span, m4.95
c r h Horizontal tail root chord, m1.29
c t h Horizontal tail tip chord, m0.82
Λ L E h Leading edge sweep angle of the horizontal tail, deg12.2
lhDistance, parallel to the X-body axis, from the nose of the fuselage to the horizontal tail mean aerodynamic chord, m8.32
Vertical TailbvVertical tail span, m1.847
c r v Vertical tail root chord, m1.955
c t v Vertical tail tip chord, m0.874
ϕ T E Trailing edge sweep angle of the vertical tail, deg17.15
lvDistance along the X-body axis from the nose of the fuselage to the leading edge of the tip chord of the vertical tail, m9.08
Wing i w Wing incidence angle, deg2.74
α t w i s t Wing incidence angle−3.15
bwWing span, m11.95
c r w Wing root chord, m2.143
c t w Wing tip chord, m0.9
Λ L E w Wing leading edge sweep angle, deg3.2
Λ T E w Wing trailing edge sweep angle, deg−9.5
lwDistance, parallel to the X-body axis, from the nose of the fuselage to the leading edge of the wing mean aerodynamic chord, m2.76
Γ Wing dihedral angle, deg7.5
Engine and Propeller η p Propeller efficiency, %80
β ´ Propeller blade angle at 0.75 Rp, deg20
n b Number of blades3
b p 0.3 Width of propeller blade at 30%, m0.144
b p 0.6 Width of propeller blade at 60%, m0.16
b p 0.9 Width of propeller blade at 90%, m0.118
R p Propeller radius, m0.993
P m a x Maximum power per engine, hp300
n e Number of engines2
Weight and BalanceCGCenter of mass, %20
W T O m a x Max take-off weight, Kg2500
Table 4. Meshing strategies used for each component in the wing structure.
SurfaceElement ShapeMesh StyleTopology
SparsTriaPaverTria3
RibsTriaPaverTria3
WB SkinQuadIsoMeshQuad4
Upper Wing SkinQuadIsoMeshQuad4
Lower Wing SkinQuadIsoMeshQuad4
Table 5. The rigid and elastic aircraft aerodynamic characteristics and the deviation from rigid aircraft for different flight conditions and power settings.
Aerodynamic CharacteristicsRigid Airplane
(MAPLA)
Elastic Airplane
(MAPLA + NASTRAN)
Average
Deviation
CT = 0CT = 0.028CT = 0.1CT = 0.3CT = 0CT = 0.028CT = 0.1CT = 0.3
C D α (rad−1)0.3150.3140.3110.3180.390.390.390.3922.5%
C L α (rad−1)6.056.116.196.576.987.047.137.5815.3%
C l α ˙ (rad−1)5.495.817.009.236.446.818.2110.8317.3%
C l q (rad−1)10.7010.7111.2812.3712.4212.4313.0914.3616.0%
C m α (rad−1)−1.17−1.01−0.68−0.10−1.40−1.21−0.81−0.1219.7%
C m α ˙ (rad−1)−9.32−10.20−13.47−19.61−11.4−12.43−16.41−23.8921.8%
C m q (rad−1)−18.70−18.74−20.37−23.42−22.2−22.25−24.19−27.8118.8%
C n β (rad−1)0.120.120.120.120.130.130.130.134.2%
C l β (rad−1)−0.11−0.11−0.11−0.10−0.13−0.13−0.13−0.1320.6%
C l p (rad−1)−0.45−0.46−0.46−0.48−0.59−0.60−0.60−0.6230.4%
Disclaimer/Publisher’s Note: The statements, opinions and data contained in all publications are solely those of the individual author(s) and contributor(s) and not of MDPI and/or the editor(s). MDPI and/or the editor(s) disclaim responsibility for any injury to people or property resulting from any ideas, methods, instructions or products referred to in the content.

