Article

Shear Stress Distribution of the Separation Region on a Plate in Supersonic Jet Flow

1
College of Aerospace Engineering, Nanjing University of Aeronautics and Astronautics, Nanjing 210016, China
2
Ministerial Key Laboratory of Unsteady Aerodynamics and Flow Control, Nanjing University of Aeronautics and Astronautics, Nanjing 210016, China
*
Author to whom correspondence should be addressed.
Aerospace 2025, 12(3), 179; https://doi.org/10.3390/aerospace12030179
Submission received: 9 February 2025 / Revised: 21 February 2025 / Accepted: 23 February 2025 / Published: 24 February 2025
(This article belongs to the Section Aeronautics)

Abstract

:
An experimental study is conducted on the surface shear stress vector distribution on a plate in a supersonic jet flow, with a focus on the separation region. The shear-sensitive liquid crystal coating (SSLCC) technique is employed for the flow visualization and measurement, which is based on the shear stress distribution, and the flow pattern on the plate is captured. The results demonstrate that the nozzle pressure ratio (NPR) is the main inducement to flow evolution, and a high NPR causes a separation region on the plate, where the adverse flow is challenging to the SSLCC technique. Therefore, an improved measurement method for the SSLCC is proposed to successfully obtain the wall shear stress distribution inside the separation and reattachment area. The flow structures on the plate, including the separation and reattachment positions and vortex and adverse flows, are accurately captured in detail, which indicates that this method is practical for measuring the wall shear stress in separated flow.

1. Introduction

Supersonic jets are widely employed in engineering applications, e.g., supersonic wind tunnels, high-speed vehicles, and vertical landing airplanes. Jet flow is characterized by a series of compression and expansion waves that interact with the shear layer. Downstream of the jet exit, the flow patterns are closely related to the nozzle pressure ratio (NPR) [1]. For a clear jet flow without wall interaction, expansion fans appear along the exit edge due to the expansion of the flow boundary, which results in a complex flow structure with expansion waves and compression waves reflected by the shear layer [2]. The compression fans converge and form a Mach disk with a relatively high NPR [3]. When the jet flow interacts with a plate that is parallel to the central flow direction, separation and reattachment will appear at the trailing edge of the Mach stem due to the boundary layer [4,5]. This is often the result of a close integration of propulsion nozzle and aircraft afterbody. The surface shear stress distribution can visually show the flow characteristics of the supersonic jet–plate interactions, and the motivation of the current study is to measure the wall shear stress, with a focus on the separation region behind the Mach stem.
Studies on jet flow date back more than half a century ago [6], and jet flow is still a topic of interest in recent years, attracting researchers to conduct investigations with numerical simulations [1,2,3] and experiments [7,8,9,10,11,12,13,14,15]. For experimental studies on supersonic jets, the flow visualization technique plays an important role in capturing the key structure of flow evolution. Liepmann and Gharib [7] studied the streamwise structures of round jets by laser-induced fluorescence, and the dynamic and static properties of the shear layer were captured. Khan et al. [8] and Faheem et al. [9] employed schlieren to study supersonic twinjet flow and multiple jet flow, respectively, and they suggested that the images with vertical knife edges were more revealing than those with horizontal knife edges. Shadowgraph imaging and acoustic measurements were used by Semlitsch et al. [10] to investigate the generation mechanism of higher harmonic screech tones in supersonic exhausts. The flow configuration is more complex when the jet flow interacts with walls, and measurement on the surface is helpful for learning the interaction flow. However, few studies have reported on the surface flow visualization of supersonic jet–wall interactions. Oil flow visualization can obtain the main streamline and flow directions on the surface but provides limited information. Other measurements for scalar fields, such as infrared detection technology and pressure-sensitive paint (PSP) technology, can show temperature and pressure fields, respectively, while hardly distinguishing between forward and backward flows. Wall shear stress is a vector field that not only presents streamlines but also friction drag on the overall surface; thus, measurements of the wall shear stress are an efficient way to understand the characteristics of this interaction.
The measurement of the wall shear stress has always been a challenge, especially for complex flow fields such as flow separation and reattachment [16]. There are several well-known measurement methods, such as shear-stress sensors and invasive probes, which have been widely used in wall shear stress measurements. However, these methods can only achieve single-point measurement, and they cannot obtain the wall shear stress information on the overall surface. The SSLCC (shear-sensitive liquid crystal coating) method [17], introduced as a direct approach for measuring global surface shear stress, offers rapid response times, high resolution, and minimal sensitivity to temperature variations. This technique serves dual purposes: it acts as a powerful tool for flow visualization and provides quantitative data on shear stress vector fields, making it particularly useful for studying interactions between jet flows and plates [4]. Initial calibration efforts by Klein and Margozzi [18] established the correlation between color changes and shear stress levels. Further advancements by Reda et al. [17,19] detailed how these color shifts are influenced by shear stress direction and magnitude, as well as by the angles of both illumination and observation. Over time, the SSLCC technique has been adapted for use on various surfaces, including curved and aerodynamic profiles [20,21], and has been successfully applied in supersonic conditions [22,23,24]. Notably, Jiao et al. [4] utilized SSLCC to explore the dynamics of supersonic jets interacting with plates, capturing detailed changes in flow structures as the nozzle pressure ratio (NPR) varied. These diverse applications underscore the effectiveness of SSLCC in detecting and analyzing shear stress across different environments and surface types.
In summary, the interaction between the supersonic jet flow and plate is a complex structure that may contain a separation region on the surface at a high NPR. However, the majority of existing literature primarily focuses on “clean jets” without flat plates, leaving the flow structures on the plate surface, particularly the complex structures induced by jet–plate interaction, such as separation and reattachment, largely unexplored. Therefore, an effective measurement that can obtain the vector field on the surface flow is necessary. The purpose of the present work is to quantitatively measure the wall shear stress of a complex supersonic flow with separation and reattachment by using SSLCC technology to consider the flows induced by the interactions of supersonic jet flow and plates as the research objects. The novelty of this work lies in its comprehensive approach to both flow field visualization and quantitative skin friction measurement of jet–plate interaction. Furthermore, the existing SSLCC measurement technique has been enhanced, enabling quantitative measurement of wall skin friction in supersonic flow fields with complex flow structures involving separation and reattachment.

2. Experimental Apparatus

2.1. Test Model

The jet nozzle is mounted downstream of a spherical air tank that is 640 m3 in volume at a maximum pressure of 800 kPa, as shown in Figure 1. The exit of the rectangular nozzle is 40 mm in width and 20.6 mm in height, and the flat plate is 250 mm in length and 200 mm in width, with the upper surface connected horizontally with the bottom surface of the nozzle exit, as shown in Figure 2. A blackened aluminum plate 200 mm in length and 100 mm in width is embedded on the flat plate as a test surface downstream of the nozzle. A total pressure transducer is mounted upstream of the nozzle to control the NPR.

2.2. Experimental Setup of the SSLCC Measurement System

An optical path arrangement plays an important role in the SSLCC technique and is a challenge to investigate the separation region because of the adverse flow. For the application of the SSLCC technique for a selected flow field, there must be at least four viewing angles within the range of ±90° between the circumferential angle of the shooting angle and the flow direction, which means that the camera should be arranged for shooting within the range of a 360° circumferential angle. However, having a perfect optical path is difficult due to complex experimental conditions, such as the influence of the light path occlusion and several other factors.
The measuring system for the SSLCC consists of a white light source and twelve synchronous cameras, as shown in Figure 3. According to our previous study [4], the SSLCC with a conventional optical path cannot obtain vortex structures on the surface in the separation region; hence, an improved optical device is designed in the current study to solve this problem. Twelve cameras are fixed by a rotatable bracket, and the spacing between each camera is 30°. The camera is mounted at the same height as the rotating bracket to capture the above-plane view angle of the camera. The rotating bracket can rotate freely in the horizontal direction so that the flow field can be recorded in the range of a 360° in-plane view angle. This design can minimize the occlusion of the angle of view and can achieve the purpose of an arbitrary shooting angle in the experiment.
The light source is a white parallel light perpendicular to the test surface. A Canon EOS80D camera (Canon Inc., Tokyo, Japan) is used for image acquisition, of which the exposure time is set at 0.2 s. For a high-quality color response, the above-plane view angle is set to 28°. A CN/R2 mixture is used as the shear-sensitive liquid crystal, of which the viscosity is 4950 cps. Before the experiment, a liquid crystal film is sprayed on the surface of the object to be tested. The liquid crystal film is left on the test surface after the mixture of the liquid crystal and acetone evaporates.

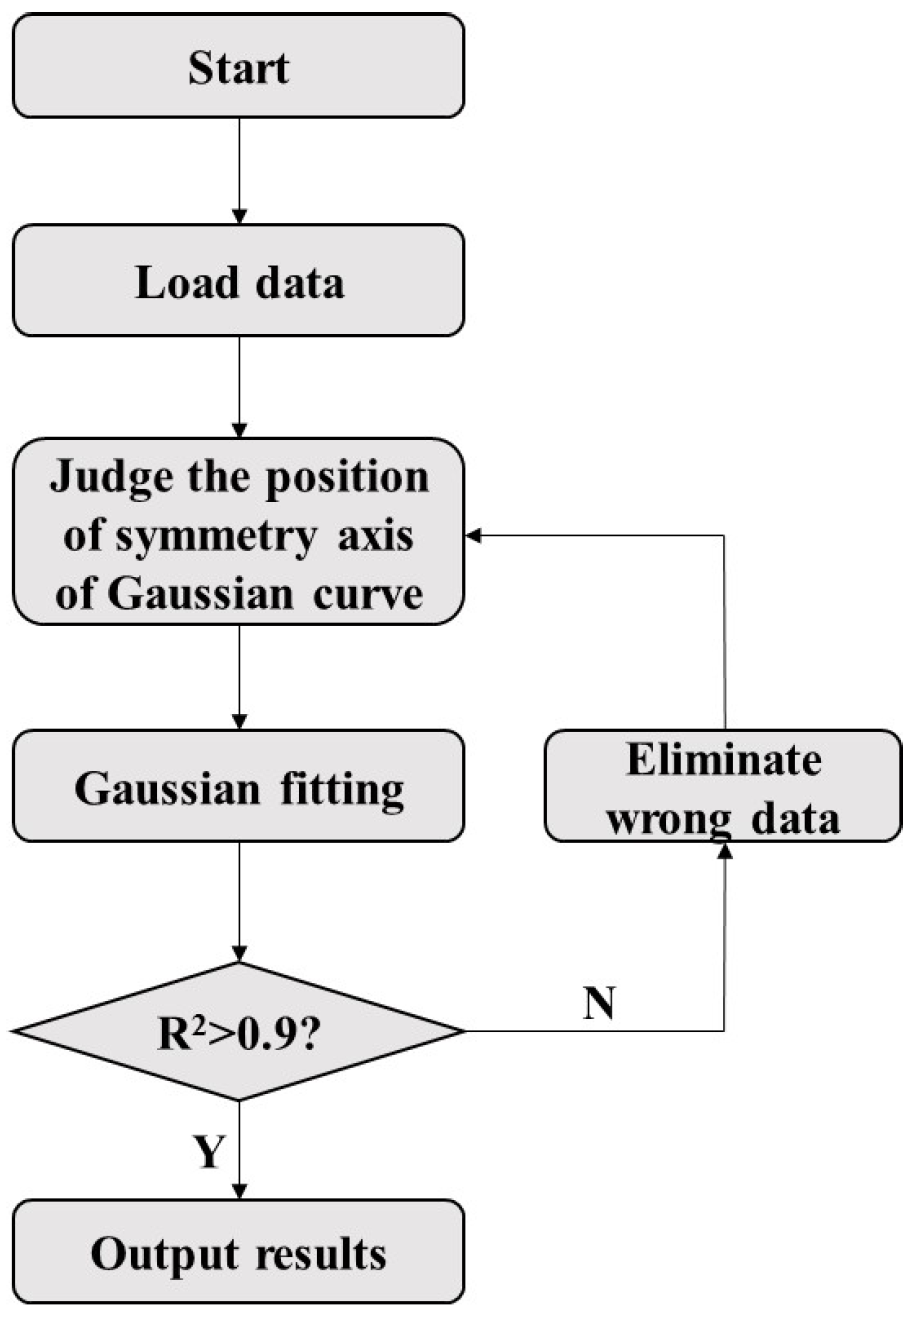
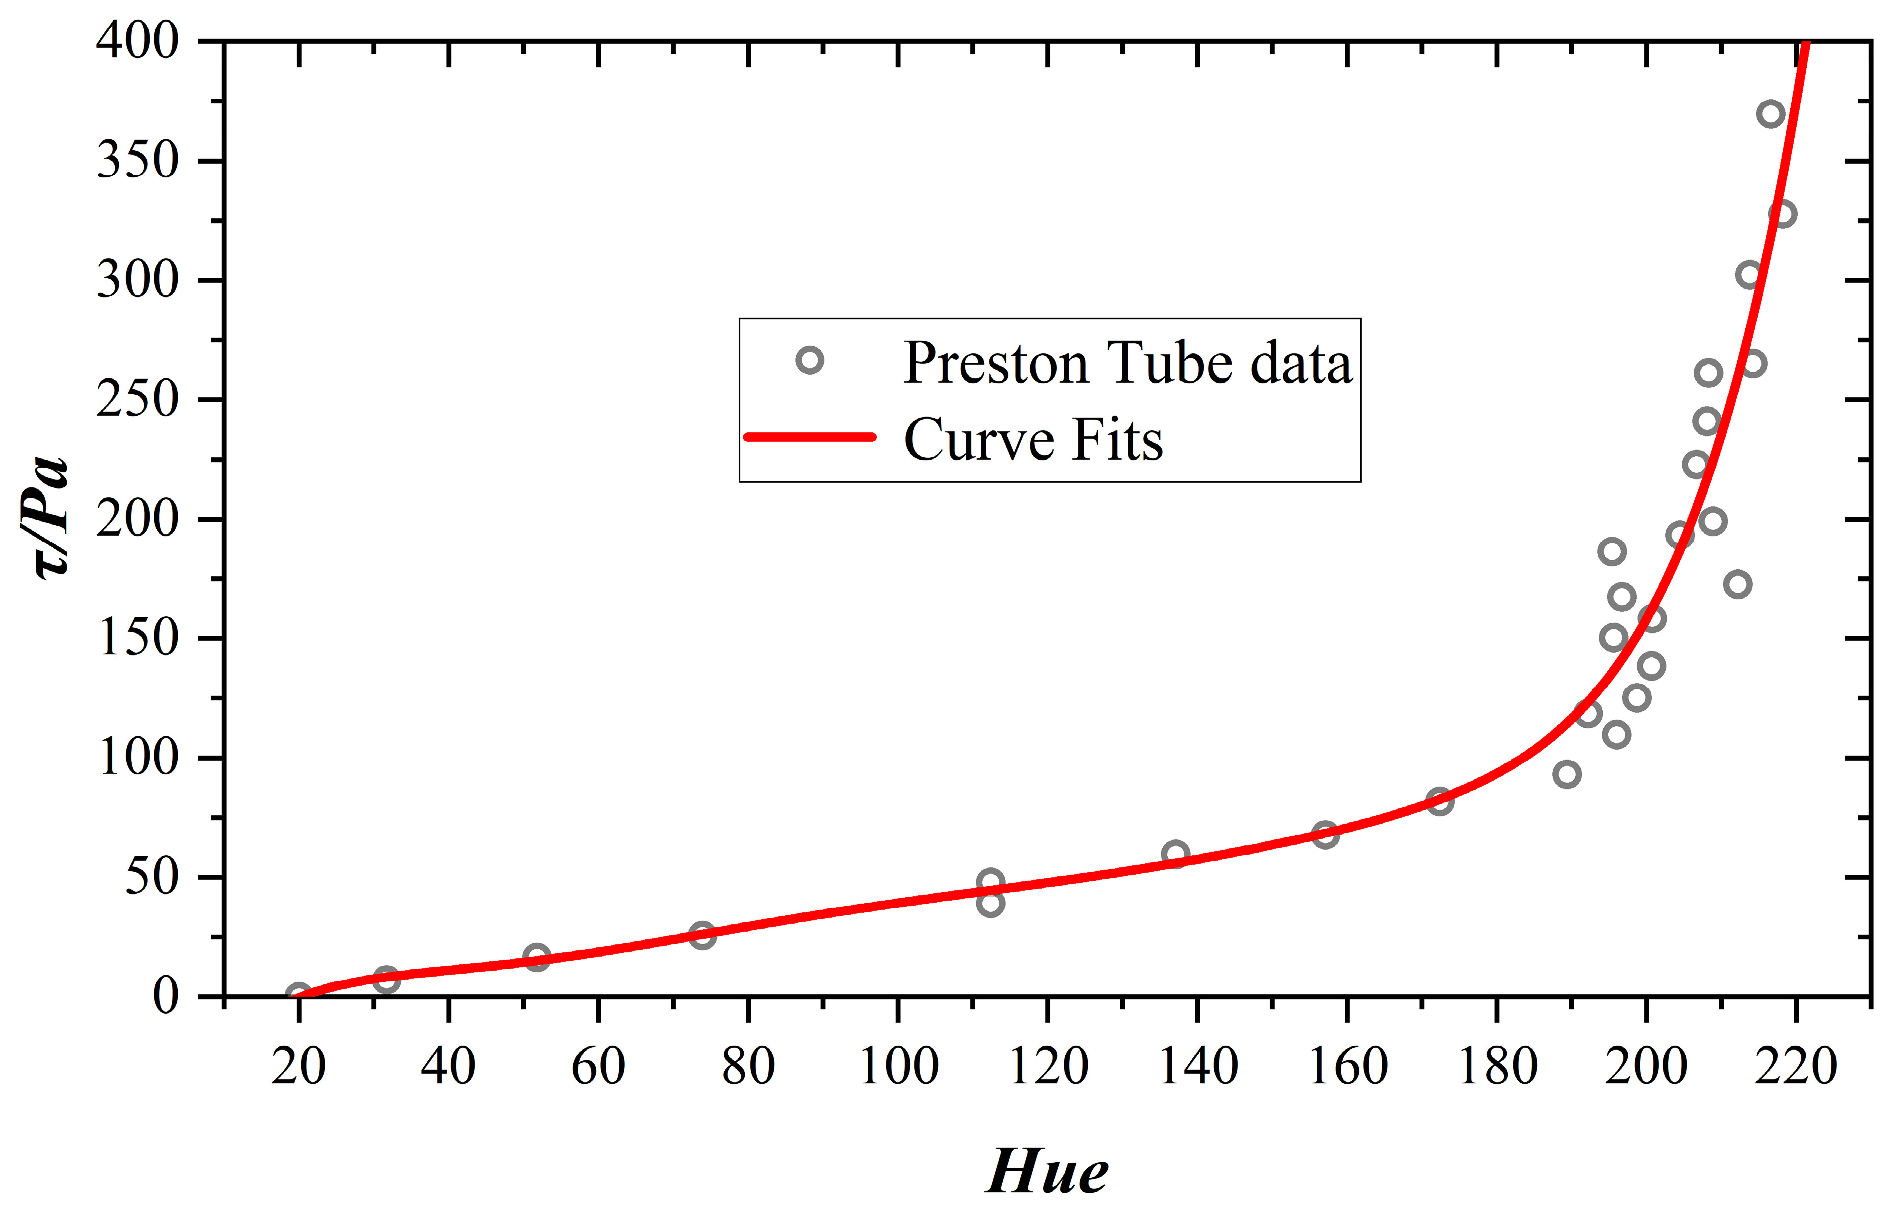
3. Transformation of the Color Images to Shear Stress Distributions

To convert the color images into shear stress distributions, a three-step process was necessary once the initial images were captured at various circumferential angles, as shown in Figure 4.
The first step was to transform the original image into a normal view by a direct linear transformation (DLT) method [25] so that the pixel coordinates of the images corresponded to the actual physical coordinates. Furthermore, the circumferential and depression angles were obtained by the DLT method, which was used to calculate the distribution of the shear stress. Then, transforming RGB to the hue-saturation-intensity (HSI) of the images was necessary. The hue value was only used for further analysis because it is one of the main properties of a color.
Second, a Gaussian curve was fitted to the hue versus circumferential angles for each physical point for −90° < ϕ   < 90°. This method was verified by Reda et al. [17]. The data can be calculated from the following:
h ( ϕ ) = h ( ϕ τ ) h V N exp ϕ ϕ τ σ 2 + h V N
where h V N represents the hue measured at a circumferential viewing angle perpendicular to the shear vector; σ is the standard deviation of the Gaussian distribution; and ϕ τ and h ϕ τ correspond to the orientation of the shear stress vector and the hue aligned with the vector, respectively. The peak of the Gaussian curve identifies the vector-aligned hue, and its angular position reveals the direction of the shear stress vector.
However, in supersonic flows, the flow field often involves complex phenomena such as shock wave–boundary layer interactions, separation, and reattachment. Existing SSLCC measurement techniques are primarily suitable for flows with a single dominant direction and struggle to provide quantitative measurements for flow fields containing reverse flows. In this work, an improved experimental setup was developed to capture SSLCC color responses across a 360° circumferential viewing angle. By analyzing the color responses from different circumferential angles, the wall shear stress was calculated. Furthermore, the original computational method was enhanced, with the specific steps illustrated in Figure 5. This improved approach addresses the influence of flow direction on the fitting results when using Gaussian curves to model the internal shear stress within separation bubbles. First, a preliminary judgment on the hue values that are recorded at different circumferential angles was necessary to determine the approximate position of the axis of symmetry. Then, the data within ±90° of the axis of symmetry were fitted by a Gaussian curve. If the correlation coefficient of the fitted curve was greater than 0.9, the result was correct. Two reasons were considered to explain the case if the correlation coefficient was less than 0.9. One is the distortion of the data recorded by the camera during the test, and the other is the deviation in the selection of the symmetry axis. At this time, the wrong data that obviously deviated from the curve were eliminated, and the above steps were repeated until the correlation coefficient was greater than 0.9.
Finally, the vector-aligned hue value was converted into the real wall shear stress after calibration. In this paper, Preston tube technology [26] was used. Initially, a Preston tube was positioned on the flat plate to measure the shear stress magnitudes under various NPR conditions. Subsequently, the corresponding SSLCC color responses were captured for each NPR setting. Through repeated experiments, the relationship between the actual shear stress magnitudes and the SSLCC color responses was established, as illustrated in Figure 6. The detailed methodologies for data acquisition, processing, and fitting were comprehensively described in our earlier work [4]. Furthermore, the calibration data in this paper, whose calibration values ranged from 0 Pa to 390 Pa, had a wider application range than our previous work [4] to adapt to the low shear stress inside the separation bubble and the high shear stress outside.

4. Results and Discussion

4.1. Evolution of the Jet Flow–Plate Interaction

Before examining the formation of separation bubbles on the plates, it is essential to outline the evolution of jet flow–plate interactions. As demonstrated in prior research [4], at low nozzle pressure ratios (NPR), the wall flow structure closely resembles that observed without an extended shelf, transitioning from overexpansion to underexpansion. This structure is characterized by alternating shockwaves and expansion fans. However, at higher NPR values (NPR > 5), the wall flow structure exhibits notable differences due to the influence of the boundary layer, as depicted in Figure 7. A key feature is the separation and reattachment of the boundary layer near the trailing edge of the Mach stem, driven by an adverse pressure gradient. In earlier studies, limitations in the algorithm hindered the clear visualization of adverse flow, particularly in Figure 7c, leading to ambiguity in the separation region. To address this, the algorithm has been improved in the current study, as detailed in Section 3, enabling better visualization and analysis of the separation flow on the plate, which is discussed further in the subsequent section.

4.2. Shear Stress Distributions

As the nozzle pressure ratio of the supersonic jet increases, the jet state gradually changes from an overexpansion state to an underexpansion state. Figure 8 shows the oil flow visualization results of the underexpanded jet and flat plate interference under three different NPR conditions. The blue and yellow boxes in the figure represent the SSLCC shooting area and shear stress calculation area, respectively. As shown in Figure 8c, an obvious separation region was formed near the nozzle exit due to a strong reverse pressure gradient at NPR = 5.07 when the underexpanded jet interfered with the flat plate. In this paper, the SSLCC technique was used to measure the wall shear stress of the separation region and the flow field near it.
Figure 9 shows the color captured at ϕ = 285° for NPR = 5.07. The image was subjected to a perspective transformation to align the image coordinates with the physical coordinates on the test surface. The yellow box in the figure represents the shear stress calculation area. The visualization and measurement areas were defined as the regions enclosed by the blue boxes in Figure 8c. As illustrated in Figure 9, distinct flow features within the core region, such as the shear layer, shock structure, and separation zone, are clearly identifiable through varying color responses. Furthermore, the SSLCC image effectively captures changes in wall shear stress, highlighting one of the technique’s key strengths in flow visualization. In the core region, the dominant blue hue signifies high shear stress magnitudes. Conversely, in the separation region, the color transitions from blue to green and then to red as the distance from the core region increases, reflecting a gradual reduction in shear stress.
Figure 10 shows an enlarged view of the SSLCC image in the part of the separation region whose positions correspond to the area marked with the yellow boxes in Figure 9. The separation and reattachment positions can be clearly observed in Figure 10. However, there is a difference in detail for the results of different in-plane view angles; that is, the color response of the SSLCC in the separation region is different because of the different shooting angles. One characteristic of an SSLCC is that for the same shear stress vector, the images observed in different directions have different colors. These colors agree with the Gaussian distribution. According to this characteristic, the vector distribution of the wall shear stress can be fitted. The results of Figure 9 and Figure 10 prove that the SSLCC technique is effective for the visualization of the wall shear stress.
The Gaussian fitting curves of some points are given in Figure 11. According to the discussion in Section 3, the direction of the shear stress can be easily obtained, and the magnitude of the shear stress can be obtained after calibration. Figure 11 shows that as the shear stress gradually increases, the error of the Gaussian curve fitting also increases, which is due to the weakening of the sensitivity of the SSLCC used in this paper under large shear stress. The global distribution of the wall shear stress can be obtained by fitting all data points.
Figure 12a,b illustrate the shear stress vector distribution and the measured frictional lines within the separation region, respectively, as obtained using the SSLCC technique. Here, the vector direction corresponds to the shear stress direction, while its length indicates the shear stress magnitude. The frictional lines are depicted as thin black lines. Unlike SSLCC images captured from a single angle, which provide only qualitative insights into the wall flow structure, the vector distribution offers a more quantitative analysis of the flow characteristics. Furthermore, the triquetrous separation was accurately identified and measured through this approach.
As illustrated in Figure 12a, the shear stress value drops sharply as the airflow passes through the Mach stem. Subsequently, under the influence of the adverse pressure gradient, the boundary layer begins to separate, leading to a significant decrease in shear stress within the separation bubble and the formation of reverse flow and two distinct counter-rotating vortices, as shown in Figure 12b. The focal points of these vortices exhibit the minimum shear stress, which can be clearly observed. Reverse flow is distinctly captured along the centerline of the separation region. Once the airflow reattaches to the plate, the shear stress value recovers. Compared to Figure 7c, the flow structure on the plate measured by the current method is more accurate and detailed, demonstrating the practicality of the improved SSLCC measurement technique for quantifying wall shear stress in separated flows. This work holds potential reference value for aerospace propulsion, high-speed aerodynamics, and jet engine exhaust flow control, including applications such as nozzle design, exhaust deflector optimization, and jet noise reduction strategies.

5. Conclusions

In this paper, separation and reattachment flow generated by the interaction between a supersonic jet and plate were visualized and measured by the SSLCC technique. This technique is based on the obtained shear stress distribution and flow pattern on the plate. The main conclusions are as follows:
(1)
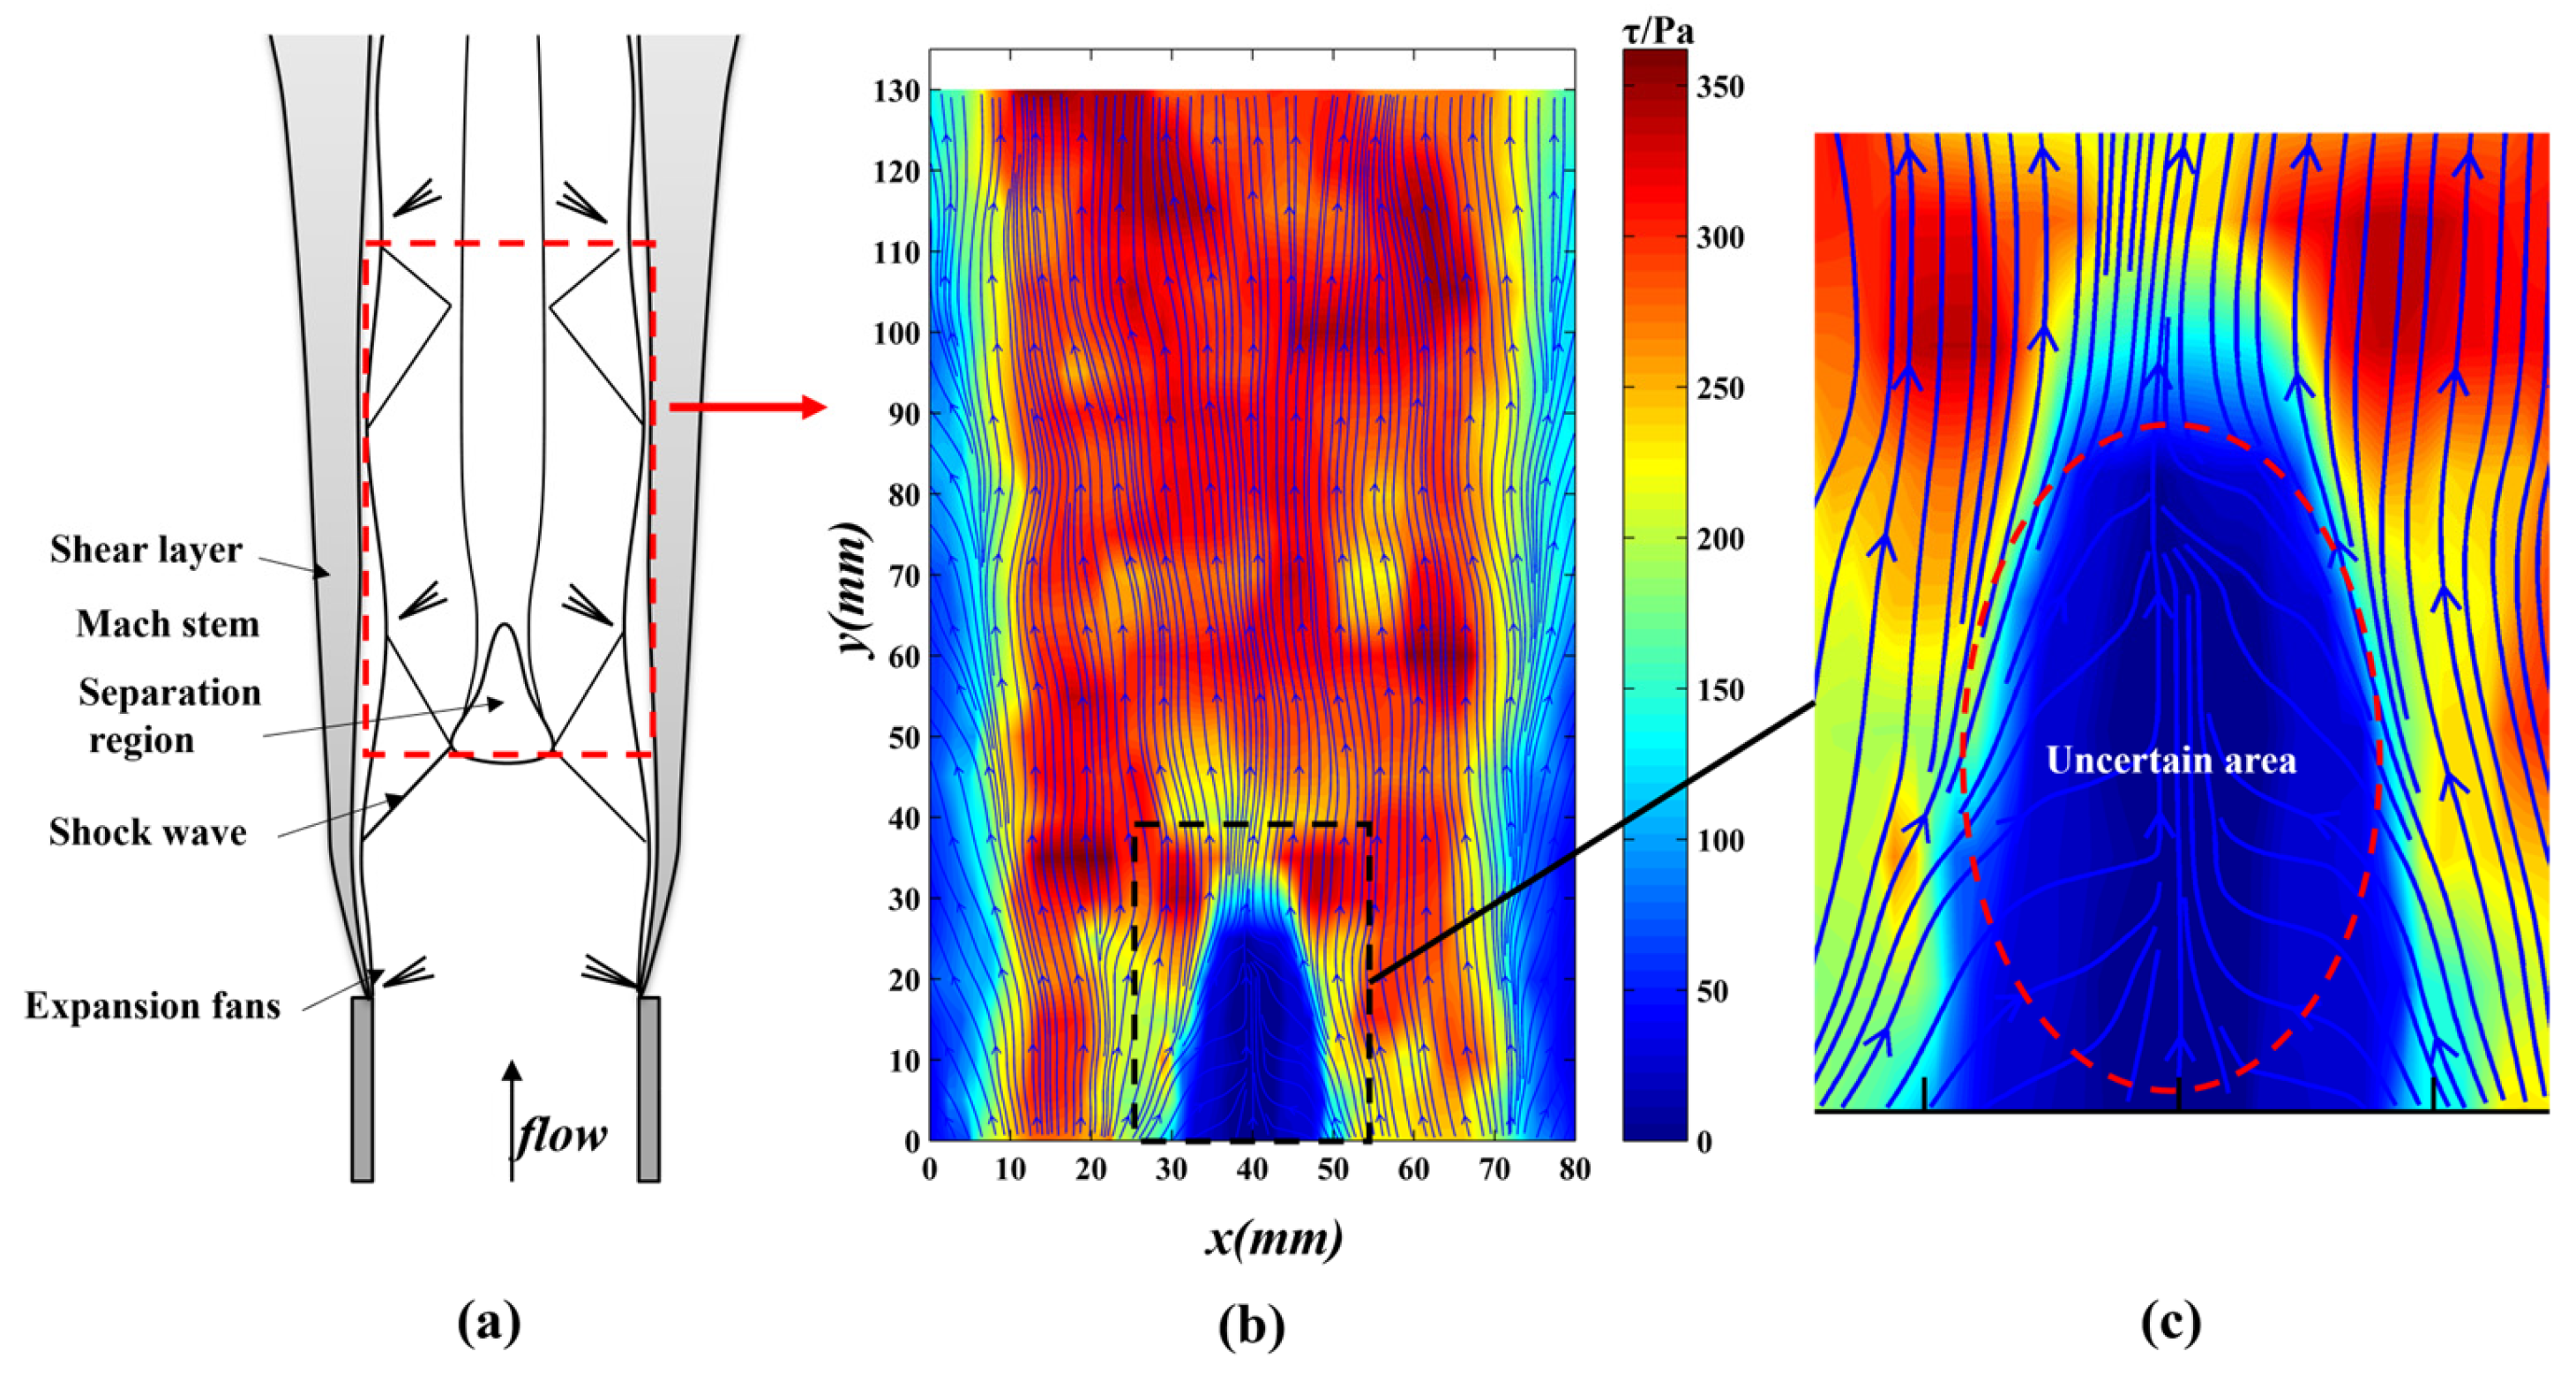
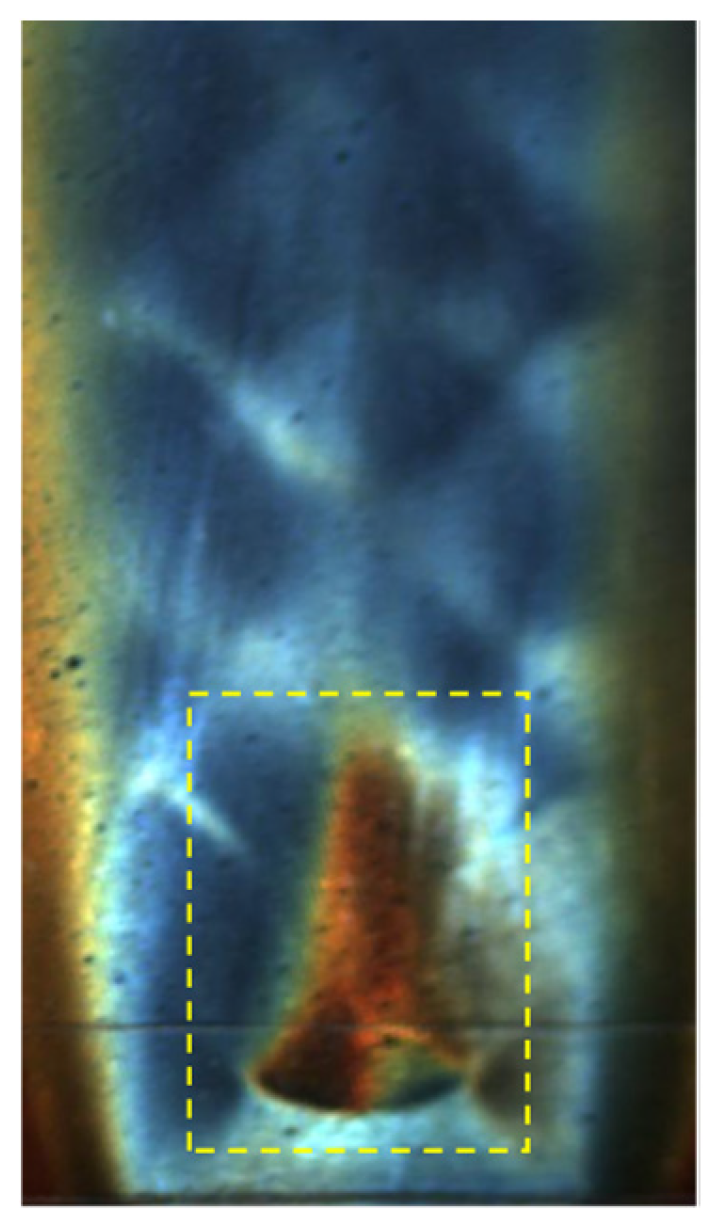
Under high NPR conditions, the interaction between a supersonic jet and a flat plate induces wall separation, with the flow field primarily characterized by the separation and reattachment of the boundary layer at the trailing edge of the Mach stem. Near the wall, complex reverse flows and vortex structures emerge, posing significant challenges for SSLCC measurements.
(2)
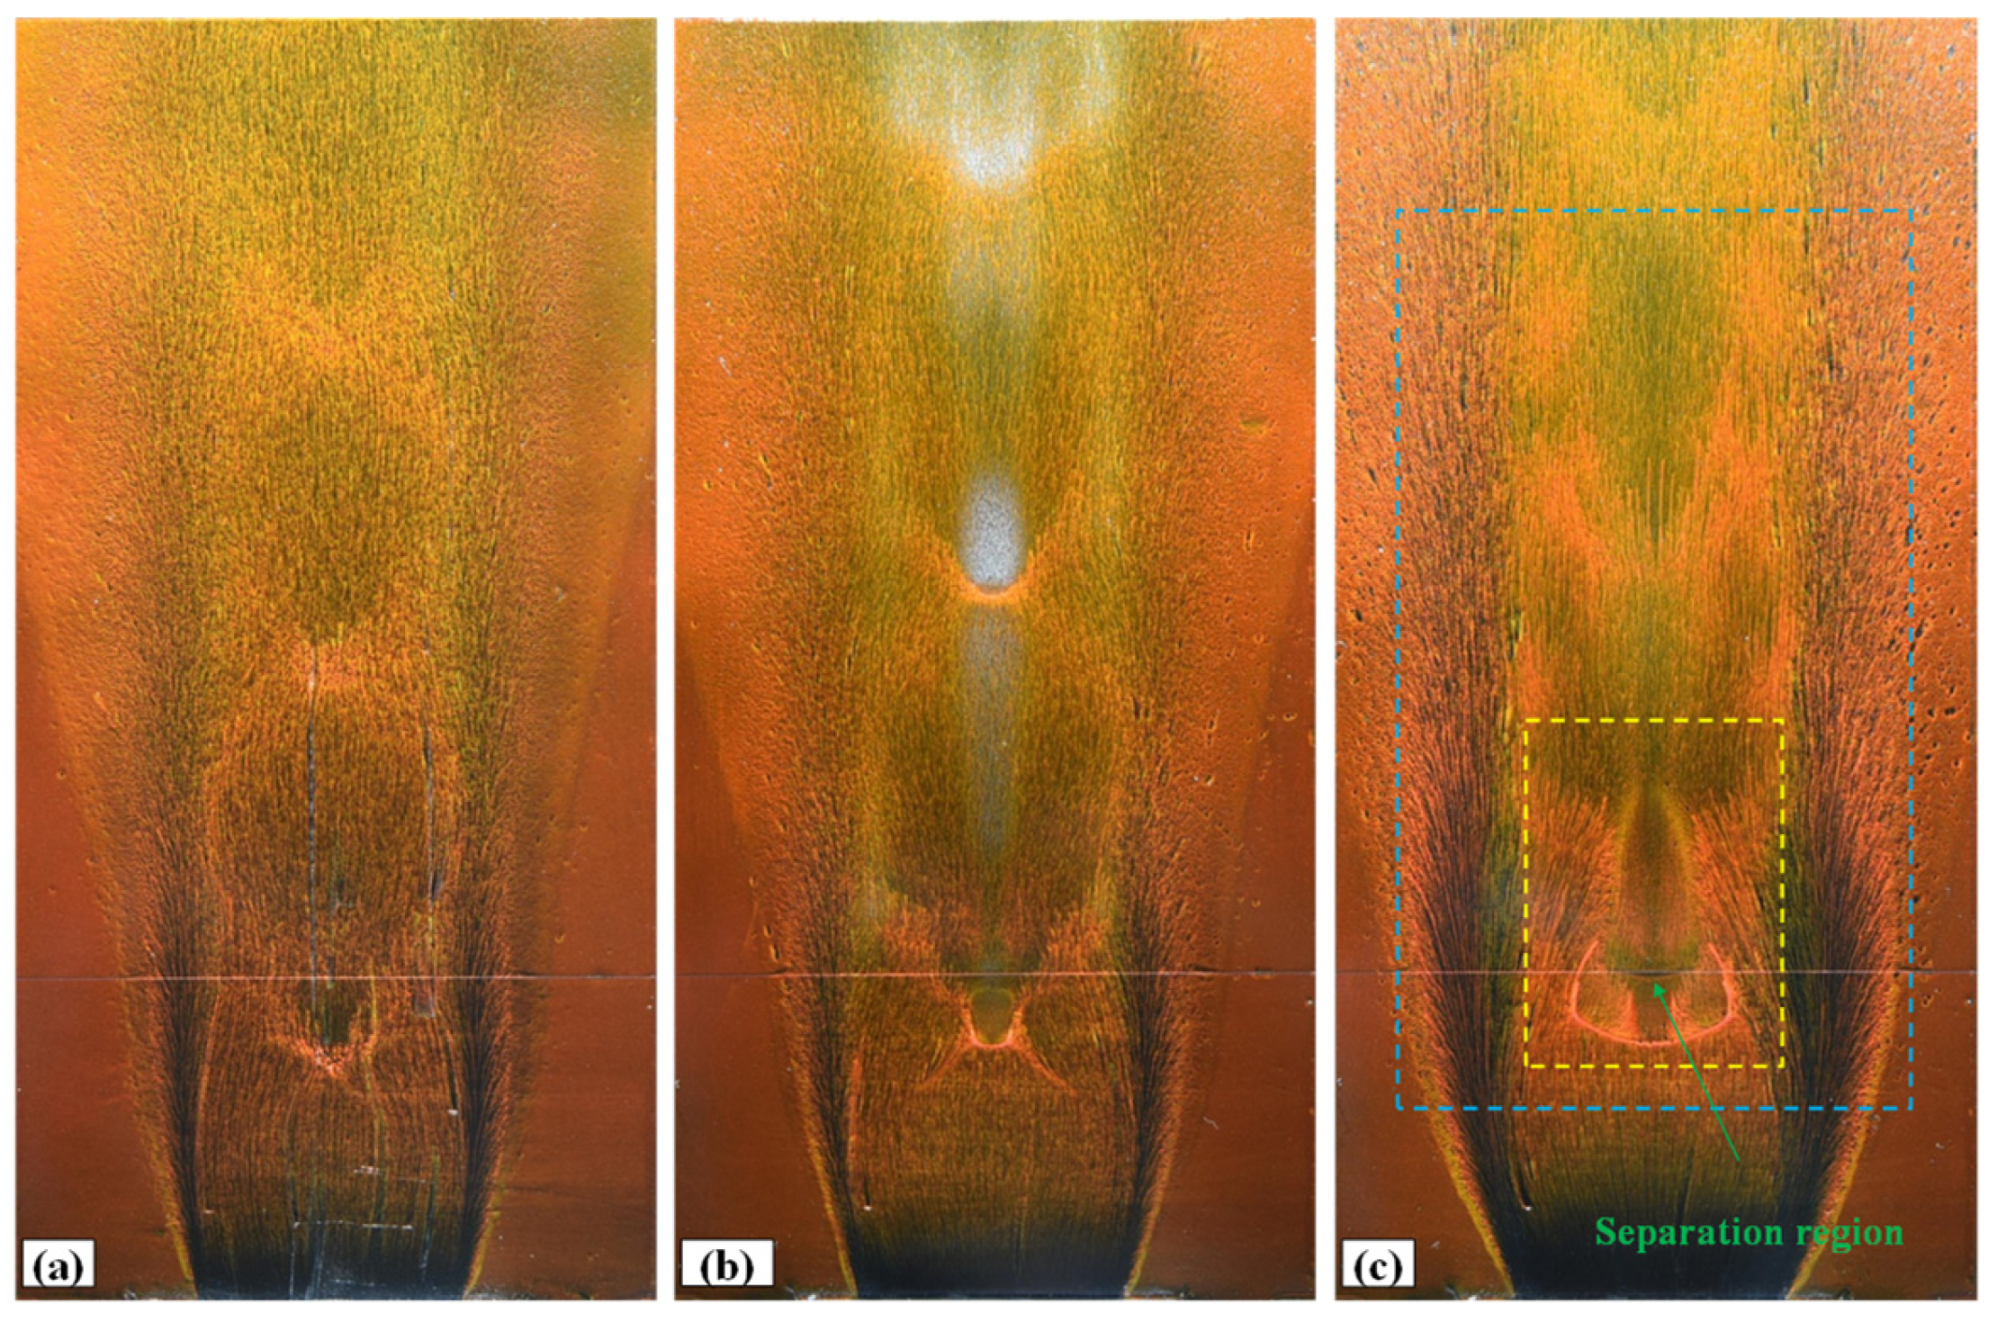
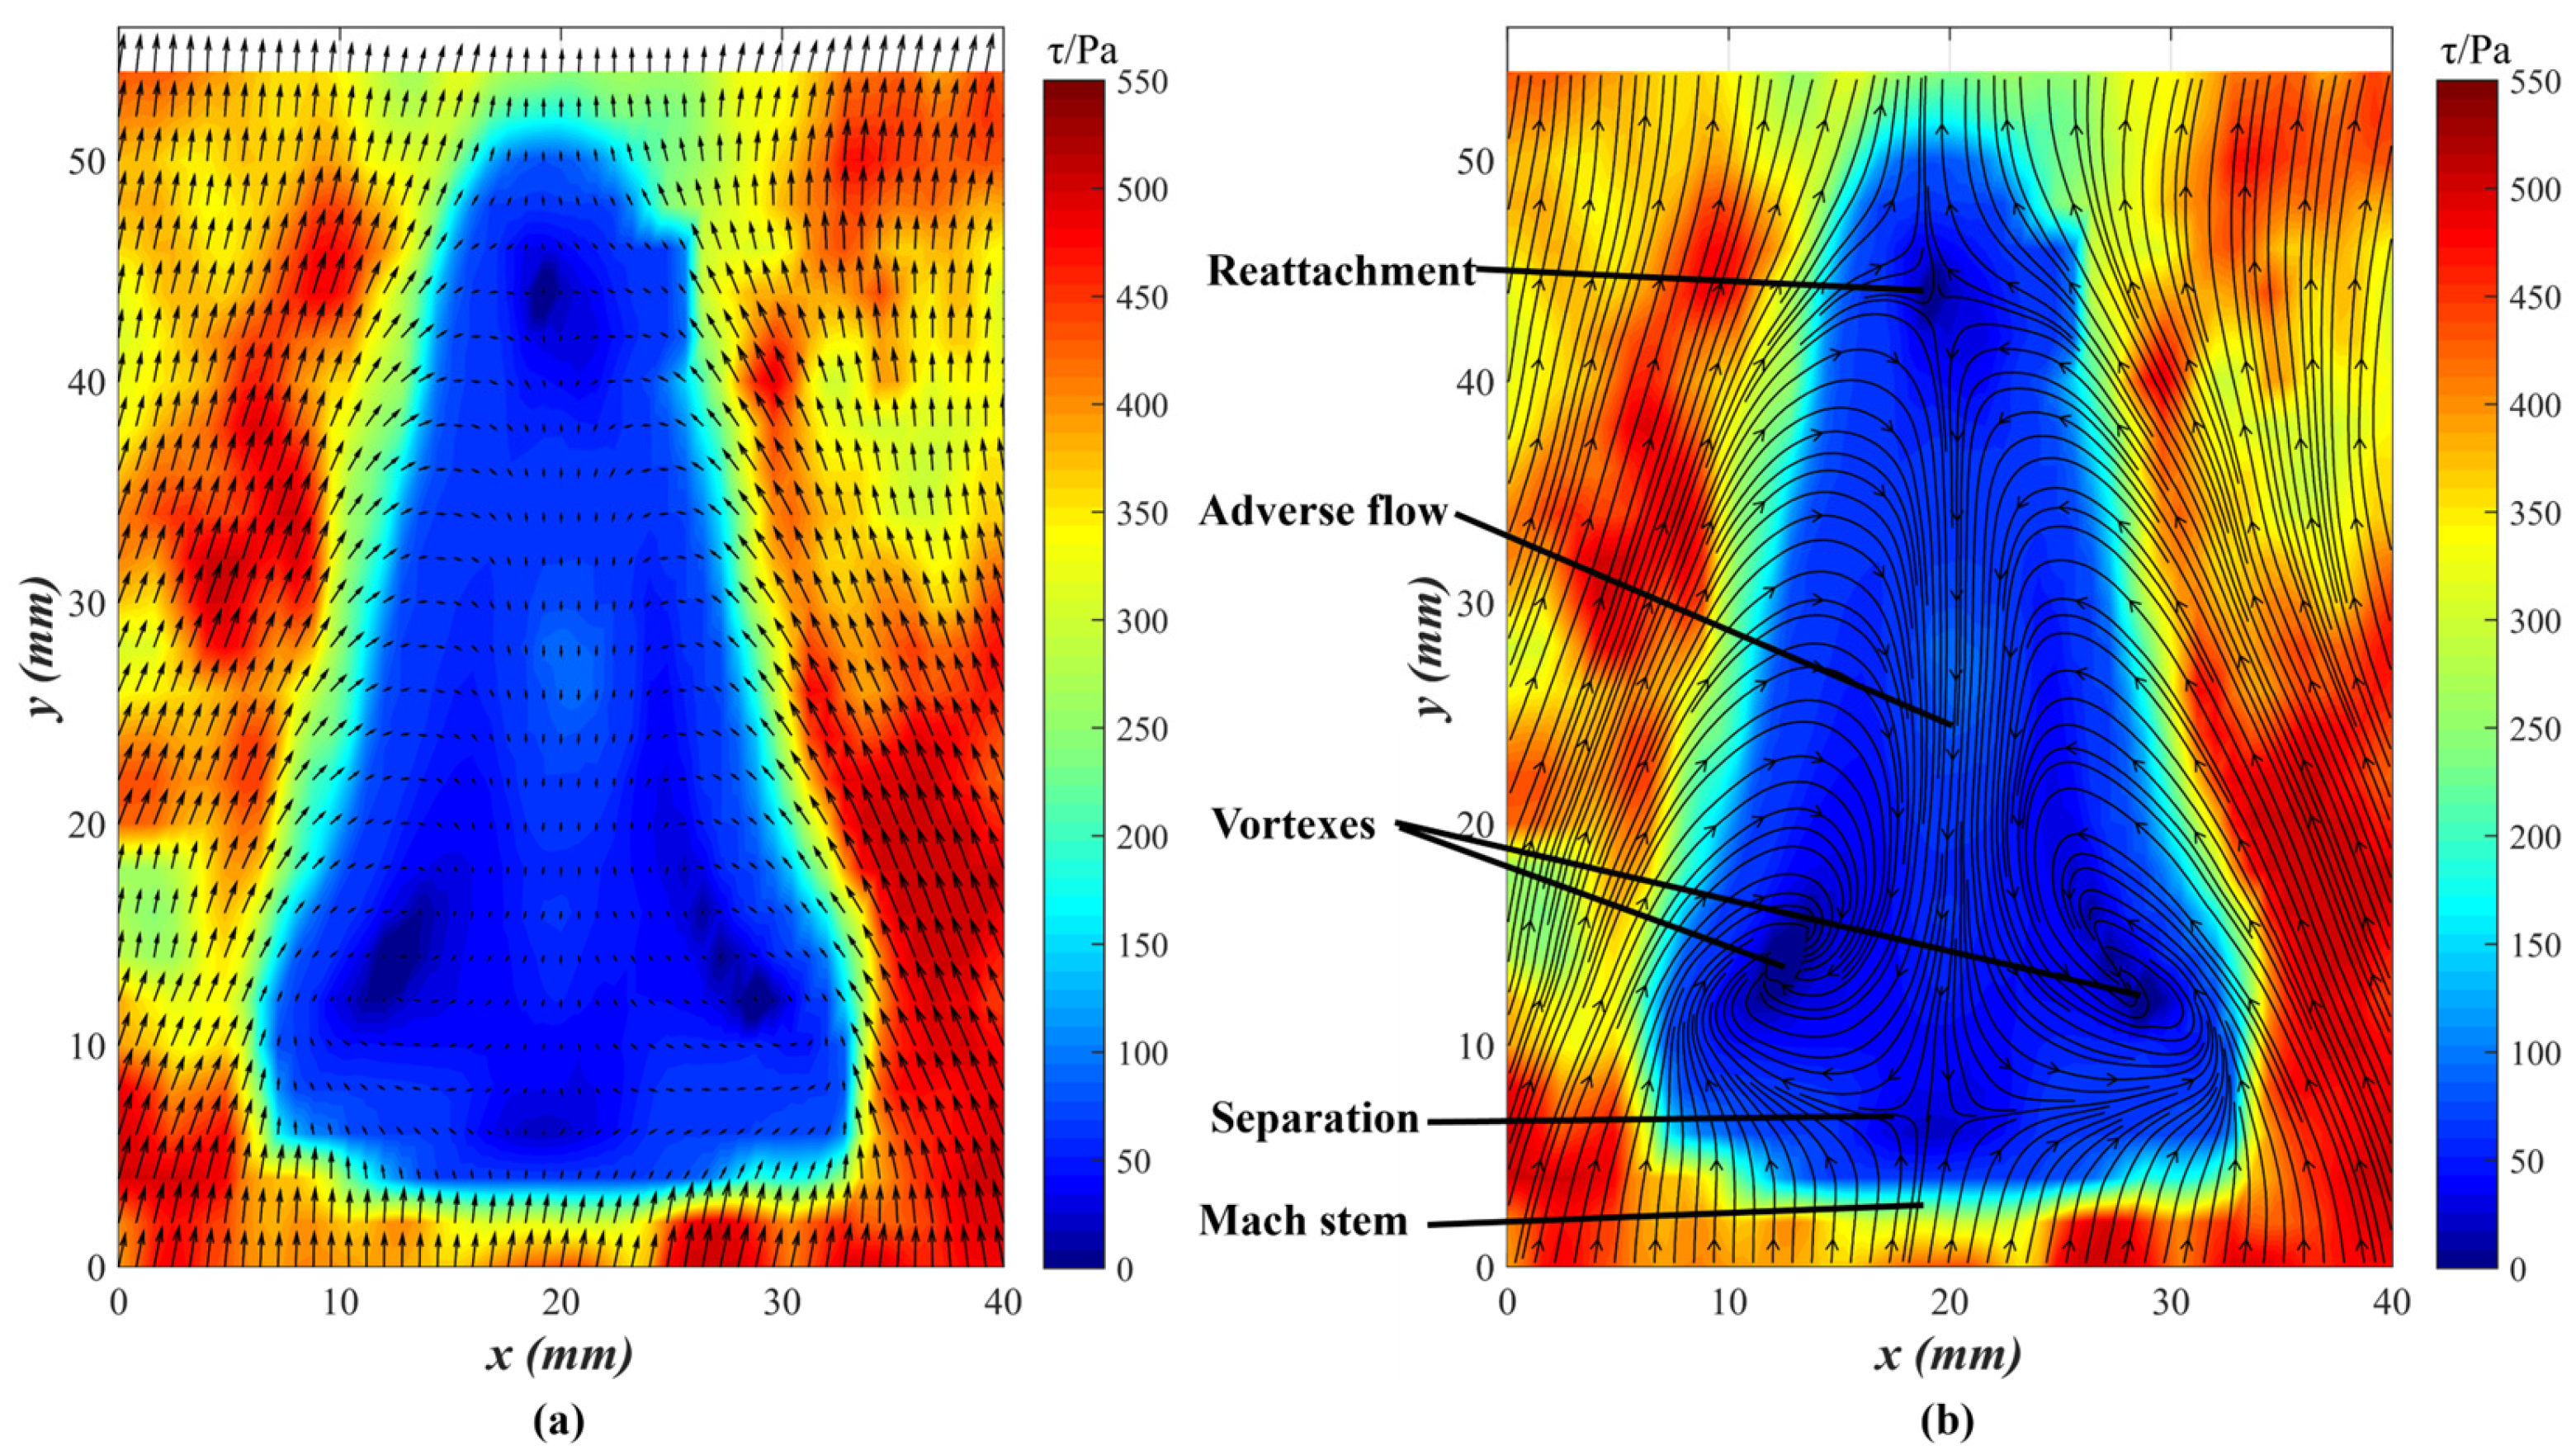
The complex flow field with separation and reattachment was successfully visualized by the proposed method for the SSLCC technique. The positions of separation and reattachment can be clearly distinguished, and vortices and adverse flows can be accurately captured. The quantitative measurement of the overall shear stress vector distribution within the separation region demonstrates that the SSLCC technique is well-suited for the visualization and measurement of complex flow structures involving separation and reattachment zones in supersonic flow.
Furthermore, this work provides valuable insights into the application of SSLCC technology in hypersonic flow fields. Future research could explore the use of SSLCC for wall shear stress measurements in hypersonic conditions. Once the challenges of measuring flow fields with reverse flows and vortex structures are addressed, there are no significant differences between hypersonic and supersonic flow fields in terms of visualization and measurement using SSLCC techniques.

Author Contributions

Methodology, K.C., C.W. and Y.J. (Yun Jiao); validation, W.L., P.H. and Y.Y.; formal analysis, Y.J. (Yun Jiao) and L.X.; investigation, Y.J. (Yun Jiao) and W.L.; resources, Y.J. (Yu Ji); data curation, Y.J. (Yun Jiao) and C.W.; writing—original draft preparation, Y.J. (Yun Jiao); writing—review and editing, Y.J. (Yun Jiao) and L.X.; project administration, Y.J. (Yun Jiao); funding acquisition, Y.J. (Yun Jiao). All authors have read and agreed to the published version of the manuscript.

Funding

This work was financially supported by the National Natural Science Foundation of China, grant numbers 12402267, 92252105, and 12072157; the Postdoctoral Fellowship Program of CPSF, grant number GZC20242231; and Jiangsu Funding Program for Excellent Postdoctoral Talent.

Data Availability Statement

The original contributions presented in this study are included in the article. Further inquiries can be directed to the corresponding author.

Conflicts of Interest

The authors declare no conflicts of interest.

References

  1. Karami, S.; Stegeman, P.C.; Ooi, A.; Theofilis, V.; Soria, J. Receptivity characteristics of under-expanded supersonic impinging jets. J. Fluid Mech. 2020, 889, A27. [Google Scholar] [CrossRef]
  2. Karami, S.; Edgington-Mitchell, D.; Theofilis, V.; Soria, J. Characteristics of acoustic and hydrodynamic waves in under-expanded supersonic impinging jets. J. Fluid Mech. 2020, 905, A34. [Google Scholar] [CrossRef]
  3. Ayupov, R.S.; Benderskii, L.A.; Lyubimov, D.A. RANS/ILES Analysis of the Flow Pattern and the Acoustic Characteristics of a Supersonic Off-Design Jet at Large Nozzle Pressure Ratios. Fluid Dyn. 2019, 54, 114–122. [Google Scholar] [CrossRef]
  4. Jiao, Y.; Wang, C.; Xie, J.; LI, K.; Cheng, K. Evolution of wall flow structure and measurement of shear stress issuing from supersonic jet withextended shelf. Chin. J. Aeronaut. 2021, 34, 94–105. [Google Scholar] [CrossRef]
  5. Behrouzi, P.; McGuirk, J.J. Underexpanded jet development from a rectangular nozzle with aft-deck. AIAA J. 2015, 53, 1287–1298. [Google Scholar] [CrossRef]
  6. Pack, D.C. On the formation of shock-waves in supersonic gas jets. Q. J. Mech. Appl. Math. 1948, 1, 1–17. [Google Scholar] [CrossRef]
  7. Liepmann, D.; Gharib, M. The role of streamwise vorticity in the near-field entrainment of round jets. J. Fluid Mech. 1992, 245, 643–668. [Google Scholar] [CrossRef]
  8. Khan, A.; Akram, S.; Kumar, R. Experimental study on enhancement of supersonic twin-jet mixing by vortex generators. Aerosp. Sci. Technol. 2019, 96, 105521. [Google Scholar] [CrossRef]
  9. Faheem, M.; Khan, A.; Kumar, R.; Khan, S.A.; Asrar, W.; Sapardi, A.M. Experimental study on the mean flow characteristics of a supersonic multiple jet configuration. Aerosp. Sci. Technol. 2020, 108, 106377. [Google Scholar] [CrossRef]
  10. Semlitsch, B.; Malla, B.; Gutmark, E.J.; Mihaescu, M. The generation mechanism of higher screech tone harmonics in supersonic jets. J. Fluid Mech. 2020, 893, A9. [Google Scholar] [CrossRef]
  11. Mohammed-Taifour, A.; Weiss, J. Periodic forcing of a large turbulent separation bubble. J. Fluid Mech. 2021, 915, A24. [Google Scholar] [CrossRef]
  12. Kimura, M.; Tung, S.; Lew, J.; Ho, C.-M.; Jiang, F.; Tai, Y.-C. Measurements of wall shear stress of a turbulent boundary layer using a micro-shear-stress imaging chip. Fluid Dyn. Res. 1999, 24, 329–342. [Google Scholar] [CrossRef]
  13. Aprojanz, J.; Miccoli, I.; Baringhaus, J.; Tegenkamp, C. 1D ballistic transport channel probed by invasive and non-invasive contacts. Appl. Phys. Lett. 2018, 113, 191602. [Google Scholar] [CrossRef]
  14. Zare-Behtash, H.; Gongora-Orozco, N.; Kontis, K.; Holder, S. Application of novel pressure-sensitive paint formulations for the surface flow mapping of high-speed jets. Exp. Therm. Fluid Sci. 2009, 33, 852–864. [Google Scholar] [CrossRef]
  15. Zare-Behtash, H.; Gongora-Orozco, N.; Kontis, K. PSP visualization studies on a convergent nozzle with an ejector system. J. Vis. 2009, 12, 157–163. [Google Scholar] [CrossRef]
  16. Zhong, S. Detection of flow separation and reattachment using shear-sensitive liquid crystals. Exp. Fluids 2002, 32, 667–673. [Google Scholar] [CrossRef]
  17. Reda, D.C.; Wilder, M.C.; Farina, D.J.; Zilliac, G. New methodology for the measurement of surface shear stress vector distributions. AIAA J. 1997, 35, 608–614. [Google Scholar] [CrossRef]
  18. Klein, E.J.; Margozzi, A.P. Exploratory Investigation on the Measurement of Skin Friction by Means of Liquid Crystals; Report No.: NASA-TMX-1774; NASA Langley Research Center: Hampton, VA, USA, 1969.
  19. Reda, D.C.; Wilder, M.C.; Mehta, R.D.; Zilliac, G. Measurement of continuous pressure and shear distributions using coating and imaging techniques. AIAA J. 1998, 36, 895–899. [Google Scholar] [CrossRef]
  20. Ruiyu, L.I.; Gao, L.; Zhang, S.; Yongzeng, L.I.; Tianyu, G.A.O. Application of shear-sensitive liquid crystal coating to visualization of transition and reattachment in compressor cascade. Chin. J. Aeronaut. 2018, 11, 2073–2079. [Google Scholar]
  21. Fujisawa, N.; Oguma, Y.; Nakano, T. Measurements of wall-shear-stress distribution on an NACA0018 airfoil by liquid-crystal coating and near-wall particle image velocimetry (PIV). Meas. Sci. Technol. 2009, 20, 065403. [Google Scholar] [CrossRef]
  22. Reda, D.C.; Aeschliman, D.P. Liquid crystal coatings for surface shear-stress visualization in hypersonic flows. J. Spacecr. Rocket. 1992, 29, 155–158. [Google Scholar] [CrossRef]
  23. Chen, X.; Wen, S.; Pan, J.J. Delta wing model skin friction measurement test and data confirming in hypersonic wind tunnel. Phys. Gases 2017, 2, 54–63. [Google Scholar]
  24. Sugiyama, H.; Minato, R.; Mizobata, K.; Tojo, A.; Muto, Y. Study on shock wave and turbulent boundary layer interactions in a square duct at Mach 2 and 4. J. Therm. Sci. 2006, 15, 37–42. [Google Scholar] [CrossRef]
  25. Abdel-Aziz, Y.I.; Karara, H.M. Direct linear transformation from comparator coordinates into object space coordinates in close-range photogrammetry. Photogramm. Eng. Remote Sens. 2015, 81, 103–107. [Google Scholar] [CrossRef]
  26. Preston, J.H. The Determination of turbulent skin friction by means of Pitot tubes. J. R. Aeronaut. Soc. 1954, 58, 109–121. [Google Scholar] [CrossRef]
Figure 1. Sketch of test facility.
Aerospace 12 00179 g001
Figure 2. Schematics of the test model.
Aerospace 12 00179 g002
Figure 3. Sketch of the experimental setup of the SSLCC measurement system.
Aerospace 12 00179 g003
Figure 4. Sketch of the data processing.
Aerospace 12 00179 g004
Figure 5. Flow chart of the curve fitting.
Aerospace 12 00179 g005
Figure 6. Calibration curve of the vector-aligned hue to shear stress magnitude.
Aerospace 12 00179 g006
Figure 7. Jet flow–plate interaction at NPR > 5 obtained in the previous study [4]. (a) Sketch of the flow structure on the plate; (b) skin friction lines measured by the SSLCC; (c) local skin friction lines in the separation region.
Aerospace 12 00179 g007
Figure 8. Surface oil flow visualization of the supersonic jet structure. (a) NPR = 3.79; (b) NPR = 4.26; (c) NPR = 5.07.
Aerospace 12 00179 g008
Figure 9. Color response of the SSLCC at ϕ   = −285° (NPR = 5.07).
Aerospace 12 00179 g009
Figure 10. Color responses of the SSLCC at different in-plane view angles.
Aerospace 12 00179 g010
Figure 11. Gaussian fitting curves of several points.
Aerospace 12 00179 g011
Figure 12. Local surface flow structure in the separation region measured by the SSLCC technique. (a) Shear stress vector field; (b) skin friction lines.
Aerospace 12 00179 g012
Disclaimer/Publisher’s Note: The statements, opinions and data contained in all publications are solely those of the individual author(s) and contributor(s) and not of MDPI and/or the editor(s). MDPI and/or the editor(s) disclaim responsibility for any injury to people or property resulting from any ideas, methods, instructions or products referred to in the content.

