Article

Thrust Measurement of an Integrated Multi-Sensor Micro-Newton Cold Gas Thruster

1
Beijing Institute of Control Engineering, Beijing 100190, China
2
State Key Laboratory of Geodesy and Earth’s Dynamics, Innovation Academy for Precision Measurement Science and Technology, Chinese Academy of Sciences, Wuhan 430077, China
*
Authors to whom correspondence should be addressed.
Aerospace 2025, 12(3), 210; https://doi.org/10.3390/aerospace12030210
Submission received: 2 February 2025 / Revised: 27 February 2025 / Accepted: 4 March 2025 / Published: 6 March 2025
(This article belongs to the Section Aeronautics)

Abstract

:
In recent years, cold gas thrusters have been successfully deployed in numerous missions, showcasing their exceptional reliability and enabling ultra-precise space operations across a broad thrust range. This article introduces an integrated cold gas thruster that integrates flow, pressure, and displacement sensors. The thrust range of this thruster can exceed 1000 μN at most, and the resolution can reach up to 0.1 μN at low thrust. The results of the high-precision displacement sensor are good, showing that the thruster performs well in terms of flow control accuracy and thrust output sensitivity. The measurement accuracy of the force frame itself is also excellent, and it can detect small thrust changes of 0.1 μN. The thrust noise level of the thruster is good, comparable to the standard noise levels of the experimental environment.

1. Introduction

In recent years, micro-Newton cold gas thrusters with variable thrust have been widely used in high-precision space science exploration missions, including the space astrometry missions GAIA and EUCLID, the space equivalence principle verification detector mission MICROSCOPE, the space gravitational wave detection verification mission LISA Pathfinder, TianQin-1, etc. [1,2,3,4,5,6,7,8]. This type of cold gas thruster has the unique advantages of high thrust accuracy and low noise, and it offsets non-conservative forces to carry out drag-free control, high-precision pointing attitude control, and precise configuration maintenance.
The thrust control of cold gas thrusters is generally achieved by adjusting the inlet pressure or valve position. The sensors used for feedback control include pressure sensors, displacement sensors, and flow sensors. The Gravity Probe B (GP-B) satellite launched in 2004 was equipped with a proportional helium thruster (PHT) developed by Stanford University in the United States. It has a pressure sensor inside. When the thruster is working, it collects feedback signals from the pressure sensor and uses a PID closed-loop control algorithm to adjust the pressure. The motor is driven according to the signals, moving the piston and adjusting the output thrust. Under the condition of a minimum input pressure of 650 Pa, the output thrust range is 2.55–8 mN [9,10,11]. Driven by the European Space Agency’s GAIA satellite mission, the Italian company Leonardo developed an integrated cold gas microthruster assembly (MTA). The MTA integrates the inlet pipeline, low-pressure filter, thrust actuator, micro-flow sensor, and thermal control component. The piezoelectric actuator drive voltage is adjusted through a closed-loop control algorithm to achieve continuous thrust adjustment. The output thrust range of the component is 0–1000 μN [12,13]. The TianQin-1 satellite launched in 2019, carrying a micro-Newton cold gas thruster developed by BICE. In addition to the flow sensor network, the thruster was also integrated with a position sensor, achieving an on-orbit target of 1–60 μN [14,15,16]. In 2024, Hu et al. reported a MEMS-processed two-dimensional cold air nozzle, which achieved a thrust output of 0–156 μN by regulating the inlet pressure [17].
Thrust measurement is a direct way to test the performance indicators of micro-Newton thrusters. At the same time, the closed-loop control of cold air thrusters depends on the calibration results of thrust flow and other parameters by ground thrust measurement devices. In 2013, France’s ONERA used a knife-edge shaft and accelerometer to synchronously monitor and differentially subtract ground vibration to calibrate the thrust of the GAIA satellite cold air thrust [18,19]. In 2018, Wang et al. proposed a horizontal torsion pendulum thrust test bench [20]. In 2022, Xu et al. proposed a vertical single pendulum measurement device [21,22]. In 2023, Zou et al. proposed a method to suppress ground vibration noise through the center of mass balancing [23]. In 2024, Tu et al. proposed an integrated weak thrust stand based on a vertical pendulum [24,25].
This paper introduces an integrated cold gas thruster equipped with multiple sensors, including flow sensors, temperature sensors, and displacement sensors. The thrust of the thruster was calibrated using a micro-Newton thrust test bench, and the relationship curves between the thrust and the flow rate and displacement were fitted. Additionally, the thrust noise level of the thruster was investigated. These results can provide some assistance for the application of cold gas thrusters in drag-free control systems.

2. Principle and Composition of Cold Gas Thruster

2.1. Principle of Thruster

The nozzle thrust calculation can be approximated by Laval nozzle theory, as illustrated in Figure 1. Assume that the entire flow process is a one-dimensional isentropic flow state. The Mach number at the nozzle outlet M e and the expansion ratio ε have the following relationship (ε = A*/ A e , the nozzle throat area is A*, and the nozzle outlet area is A):
1 ε = A * A e = M e γ + 1 2 + M e 2 γ 1 γ + 1 2 γ 1 ,
The nozzle injection mass flow rate can be expressed as follows:
m ˙ = γ p t A e γ R T t M e 1 + γ 1 2 M e 2 2 γ 2 ,
The average velocity at the nozzle outlet can be expressed as follows:
V e = 2 γ R T t γ 1 1 p e p t γ 1 γ ,
The thrust calculation formula is as follows:
F = m ˙ V e + p e p 0 A e ,
where A* is the nozzle throat area, A is the nozzle outlet area, γ is the working fluid specific heat ratio, R is the nitrogen gas constant, p e , and p t are the gas pressures at the nozzle outlet and inlet respectively, and Tt is the nozzle inlet gas temperature.
The nozzle flow state can be controlled by controlling the needle valve movement displacement. To consider the influence of the needle valve movement on the nozzle flow and thruster thrust, the effective flow area A* of the nozzle throat can be expressed as a function of the needle valve displacement and the needle valve needle tip cone angle.
The distance L between the throat inlet and the needle valve cone can be expressed as follows:
L = S sin α ,
The nozzle throat effective flow area A* can be expressed as follows:
A * = π 3 r 2 + r r L cos α + r L cos α 2 L sin α ,
where r is the nozzle throat radius, which is 0.15 mm, and α is the semi-cone angle of the needle valve tip, which is 15°.
When the thruster is working, the internal pressure range is 0.1~0.15 MPa, while the outside is a vacuum. The ratio of the outlet pressure to the inlet pressure is less than the critical pressure ratio, and the propellant is in a supercritical flow state. Therefore, the thrust formula is
F = C d A * P i 2 k R T k + 1 × 2 k + 1 1 k 1 ,
where C d is the flow coefficient, P i is the inlet pressure, R is the gas constant, T is the absolute temperature, and k is the adiabatic index. It can be seen that the thrust and needle valve displacement have a cubic function relationship.

2.2. Composition of Thruster

This micro-Newton cold gas thruster was placed on the TianQin-1 satellite launched in 2019. [4] The module has an integrated design, integrating core components such as inlet pipes, built-in filters, piezoelectric proportional thrusters, and micro-flow sensors, and innovatively embedding capacitive displacement sensors to achieve accurate measurements of the piezoelectric actuator stroke, as shown in Figure 2. This innovative design supports the operation of the module in closed-loop control mode, with two working modes: one is the flow closed-loop mode based on micro-flow sensor signal feedback and piezoelectric actuator drive adjustment; the other is the displacement-flow dual closed-loop mode that combines micro-flow sensor and capacitive displacement sensor signal feedback with piezoelectric actuator drive adjustment, thereby ensuring high-precision thrust control. The application of this advanced technology enabled the TianQin-1 satellite to verify the thrust range of 1 to 60 μN in orbit, and its upgraded version even achieved a thrust range verification of 0.1 to 1000 μN in ground testing, which is what this article focuses on.
The piezoelectric drive can achieve rapid response control of pintle displacement with nanometer precision, meet the high-precision adjustment requirements of the flow area of the micro-nozzle throat, and ensure a minimum thrust output of 0.1 μN, which is one of the most promising micro-Newton cold gas thrusters’ drive methods at present [26,27,28,29,30]. Under the premise of ensuring that the thruster can maintain accuracy and normal operations when the pintle reaches its maximum position, the corresponding displacement is defined as 100% of the opening. On the contrary, when the pintle is in a completely closed state, its corresponding displacement is considered to be 0% of the opening. Using the concept of the opening to present the data collected by the displacement sensor can more intuitively and vividly reflect the actual movement state of the pintle and the operation of the thruster, and it is also more reasonable than directly using the displacement value. This representation method makes it easier for operators to quickly understand the working degree of the thruster and to perform related operations and adjustments more accurately.
A schematic diagram of the control algorithm principle is shown in Figure 3. The nozzle is placed at the end, with the outlet facing the vacuum (below 10−2 Pa). A piezoelectric valve is set in front of the nozzle, and the flow rate is adjusted by adjusting the opening of the valve. The flow sensor measures the flow in front of the piezoelectric valve and provides a reference for the closed-loop feedback of the flow. The flow sensor is a self-developed temperature-measuring type flow sensor that uses an MEMS flow-sensitive element. It consists of a heating resistor and two temperature-sensing resistors placed above and below. The flow rate is measured by detecting the temperature difference on both sides of the heating resistor caused by the fluid flow. The closed-loop feedback uses a PID (proportional–integral–differential) controller to improve the impact on the flow control accuracy. The tank is used to supply air to the system, and the air pressure is initially stabilized at 1.5 MPa.

3. Thrust Measurement Principle

3.1. Measurement Principle

The micro-Newton thrust test bench uses a well-designed pendulum elastic structure [22,31,32,33,34]. As shown in the left figure of Figure 4, when subjected to thrust, the structure will produce an angle deflection accordingly. By measuring the angle of the pendulum or using the feedback control force, the specific size of the thrust to be measured can be calculated.
The working principle is briefly described as follows: The motion equation is
J θ ¨ + C θ ˙ + K θ = F l F ,
where F is the micro-thrust of the thruster to be measured, l F is the distance between the thrust center and the rotation axis, J is the moment of inertia of the elastic structure, C is the damping coefficient, and K is the rotation stiffness.
The test bench can work in open-loop tests, closed-loop tests, calibration, and other modes. In the open-loop test, the measured thrust can be expressed as F = f(K,θ)/ l F , which is a function of the elastic coefficient K of the structure and the deflection displacement/angle θ under the force. In the closed-loop operation, the elastic structure is locked in its equilibrium position by the feedback force. According to the principle of force or torque balance, the magnitude of the measured force or torque is the magnitude of the feedback force/torque. Taking electromagnetic force feedback as an example, the thrust measured under closed-loop control can be expressed as F = (SI × I) l T / l F , where I is the feedback current, SI is the coefficient of the current to force in the feedback actuator, and l T is the arm of the electromagnetic force. This test bench adopts a calibration method that combines gravity and electromagnetic force, anchoring the traceability of the thrust magnitude on gravity, to achieve continuous calibration during the measurement process. Since there is no coupling relationship between gravity and electromagnetic interference, temperature, or other factors in the environment, this ensures the real-time and absolute accuracy of the calibration process. As shown in the right picture of Figure 4, the thruster to be tested was installed on the test bench.

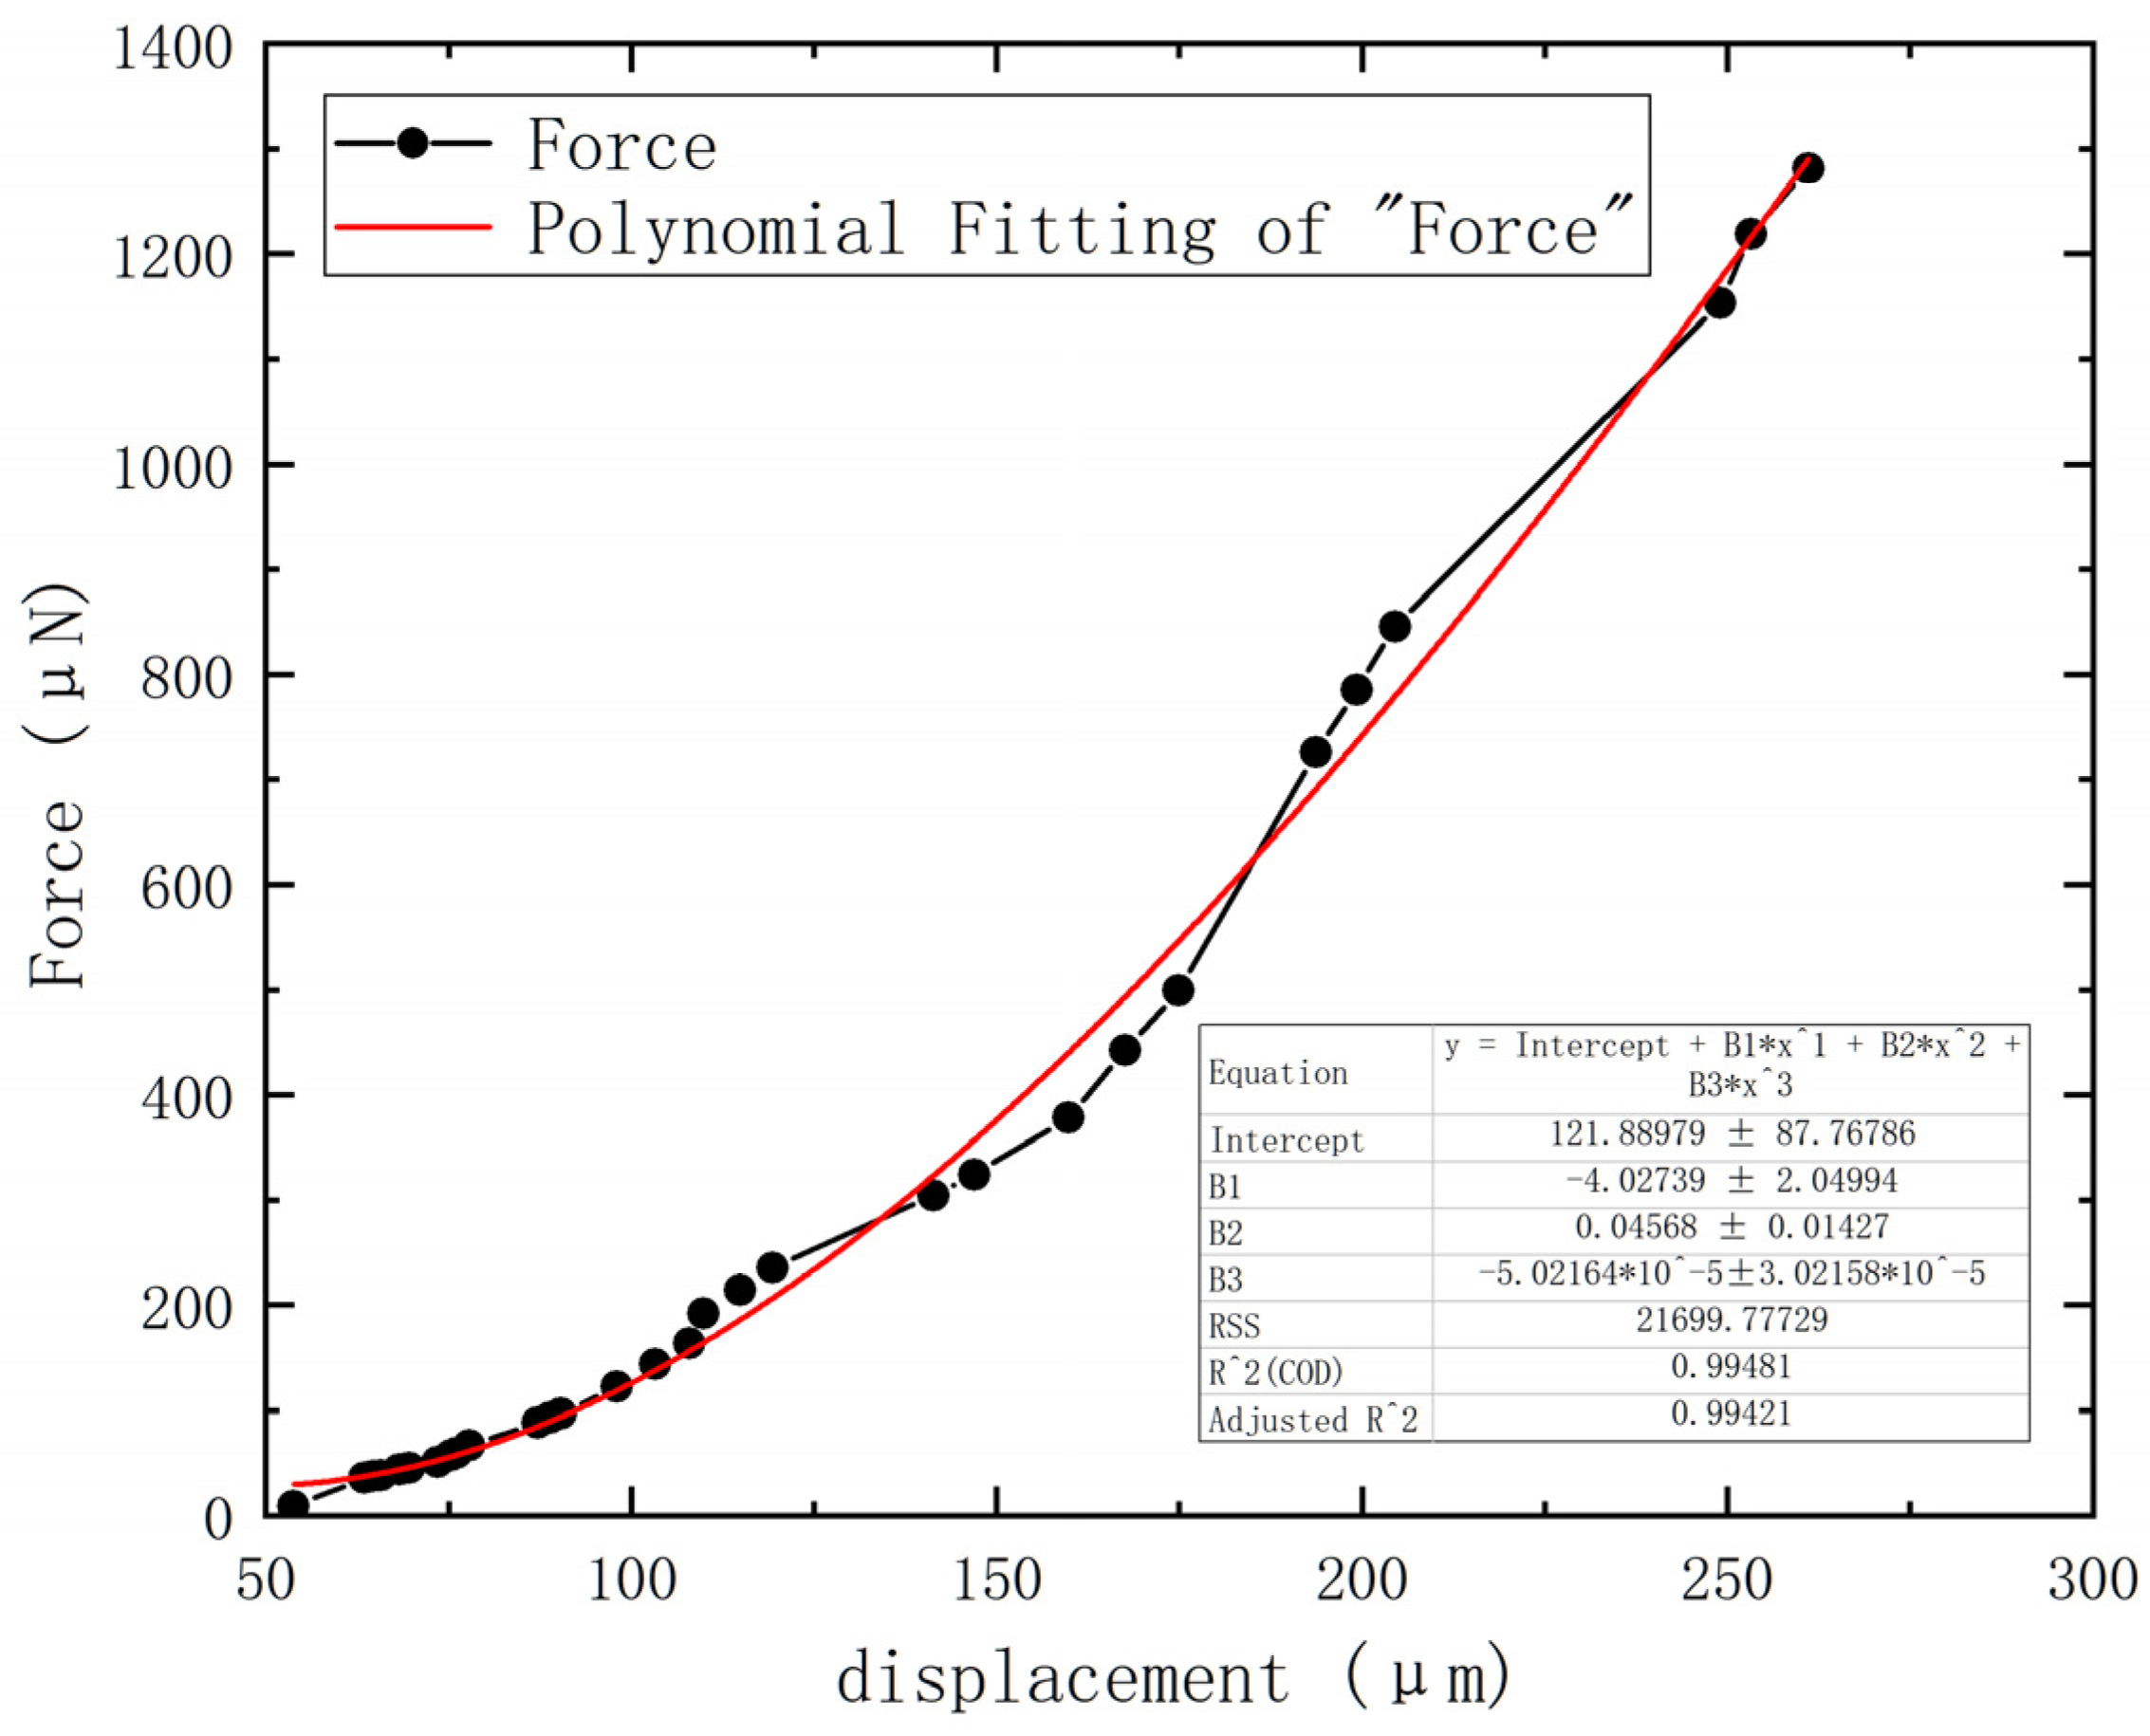
3.2. Calibration of Thrust Test Bench

To accurately calibrate the force measurement sensitivity coefficient of the test bench, as shown in Figure 5, two calibration masses m1 and m2 made of non-magnetic materials are placed in the V-shaped limit groove of the calibration arm in sequence by a motor, and then removed after a while. Taking the calibration of the open-loop working mode as an example, the angle changes of the pendulum caused by the two calibration masses are θ m 1 and θ m 2 respectively. The shaft stiffness coefficient can be calculated by the following formula:
K = m 2 g 0 l · cos φ θ m 1 · m 2 m 1 θ m 2 ,
where g 0 is the local gravity acceleration, ∆l is the distance between m2 and m1. The above formula also takes into account the effect caused by the deviation of the calibration arm from the horizontal plane φ when the pendulum deviates from the vertical direction during operation; m1   m2 = m is usually selected for the test. The uncertainty of the calibration can be evaluated by the following formula:
σ K = K × σ m m 2 + σ g 0 g 0 2 + σ l l 2 + s i n φ c o s φ φ 2 + 2 σ θ θ 2
The σ term represents the measurement standard deviation of each quantity, θ = θ m 1 θ m 2 . It should be noted that g 0 can be calculated by a theoretical formula that includes latitude and altitude, and it is easy to achieve an accuracy requirement of 0.1%. The adjustment requirements for the angle of the pendulum are not high, and φ < 2° is sufficient. Additionally, the weighing accuracy of the mass also easily meets the requirements. The main source of error is still the measurement of length. The measurement with a three-coordinate measuring machine can reach σ l = 0.1 mm, while ∆l = 40.0 mm, with a relative error of 0.25%. In addition, studies have shown that the elastic hysteresis of the shaft material can also bring about relative errors of equal magnitude or even greater, which requires careful evaluation and the use of optimized processing technology to control this error. It should be noted that the uncertainty estimate of the K calculation is one of the most important error sources during the final thrust measurement. The uncertainty estimate should account for the error contributions from both statistics and temperature fluctuations.
For the closed-loop mode, after completing the gravity calibration of the pendulum body stiffness, the coefficient K I · K V I of the voice coil motor can be calibrated in real time by comparing the electromagnetic force input and the test bench output.
Figure 6 shows the curves of five calibration cycles. In each cycle, m2 and m1 are placed on the calibration arm and then removed in turn. The upper figure is the angle response curve of the torsion pendulum, and the lower figure is the test bench output after applying the calibration coefficient. The middle figure is a partial enlargement of the test bench stabilization process within the dashed box in the lower figure. The above calibration process can be performed at any time after the assembly is completed, avoiding the system error that may be caused by the assembly and addressing the problem of other calibration methods making it difficult to determine the calibration force arm.

4. Results and Discussion
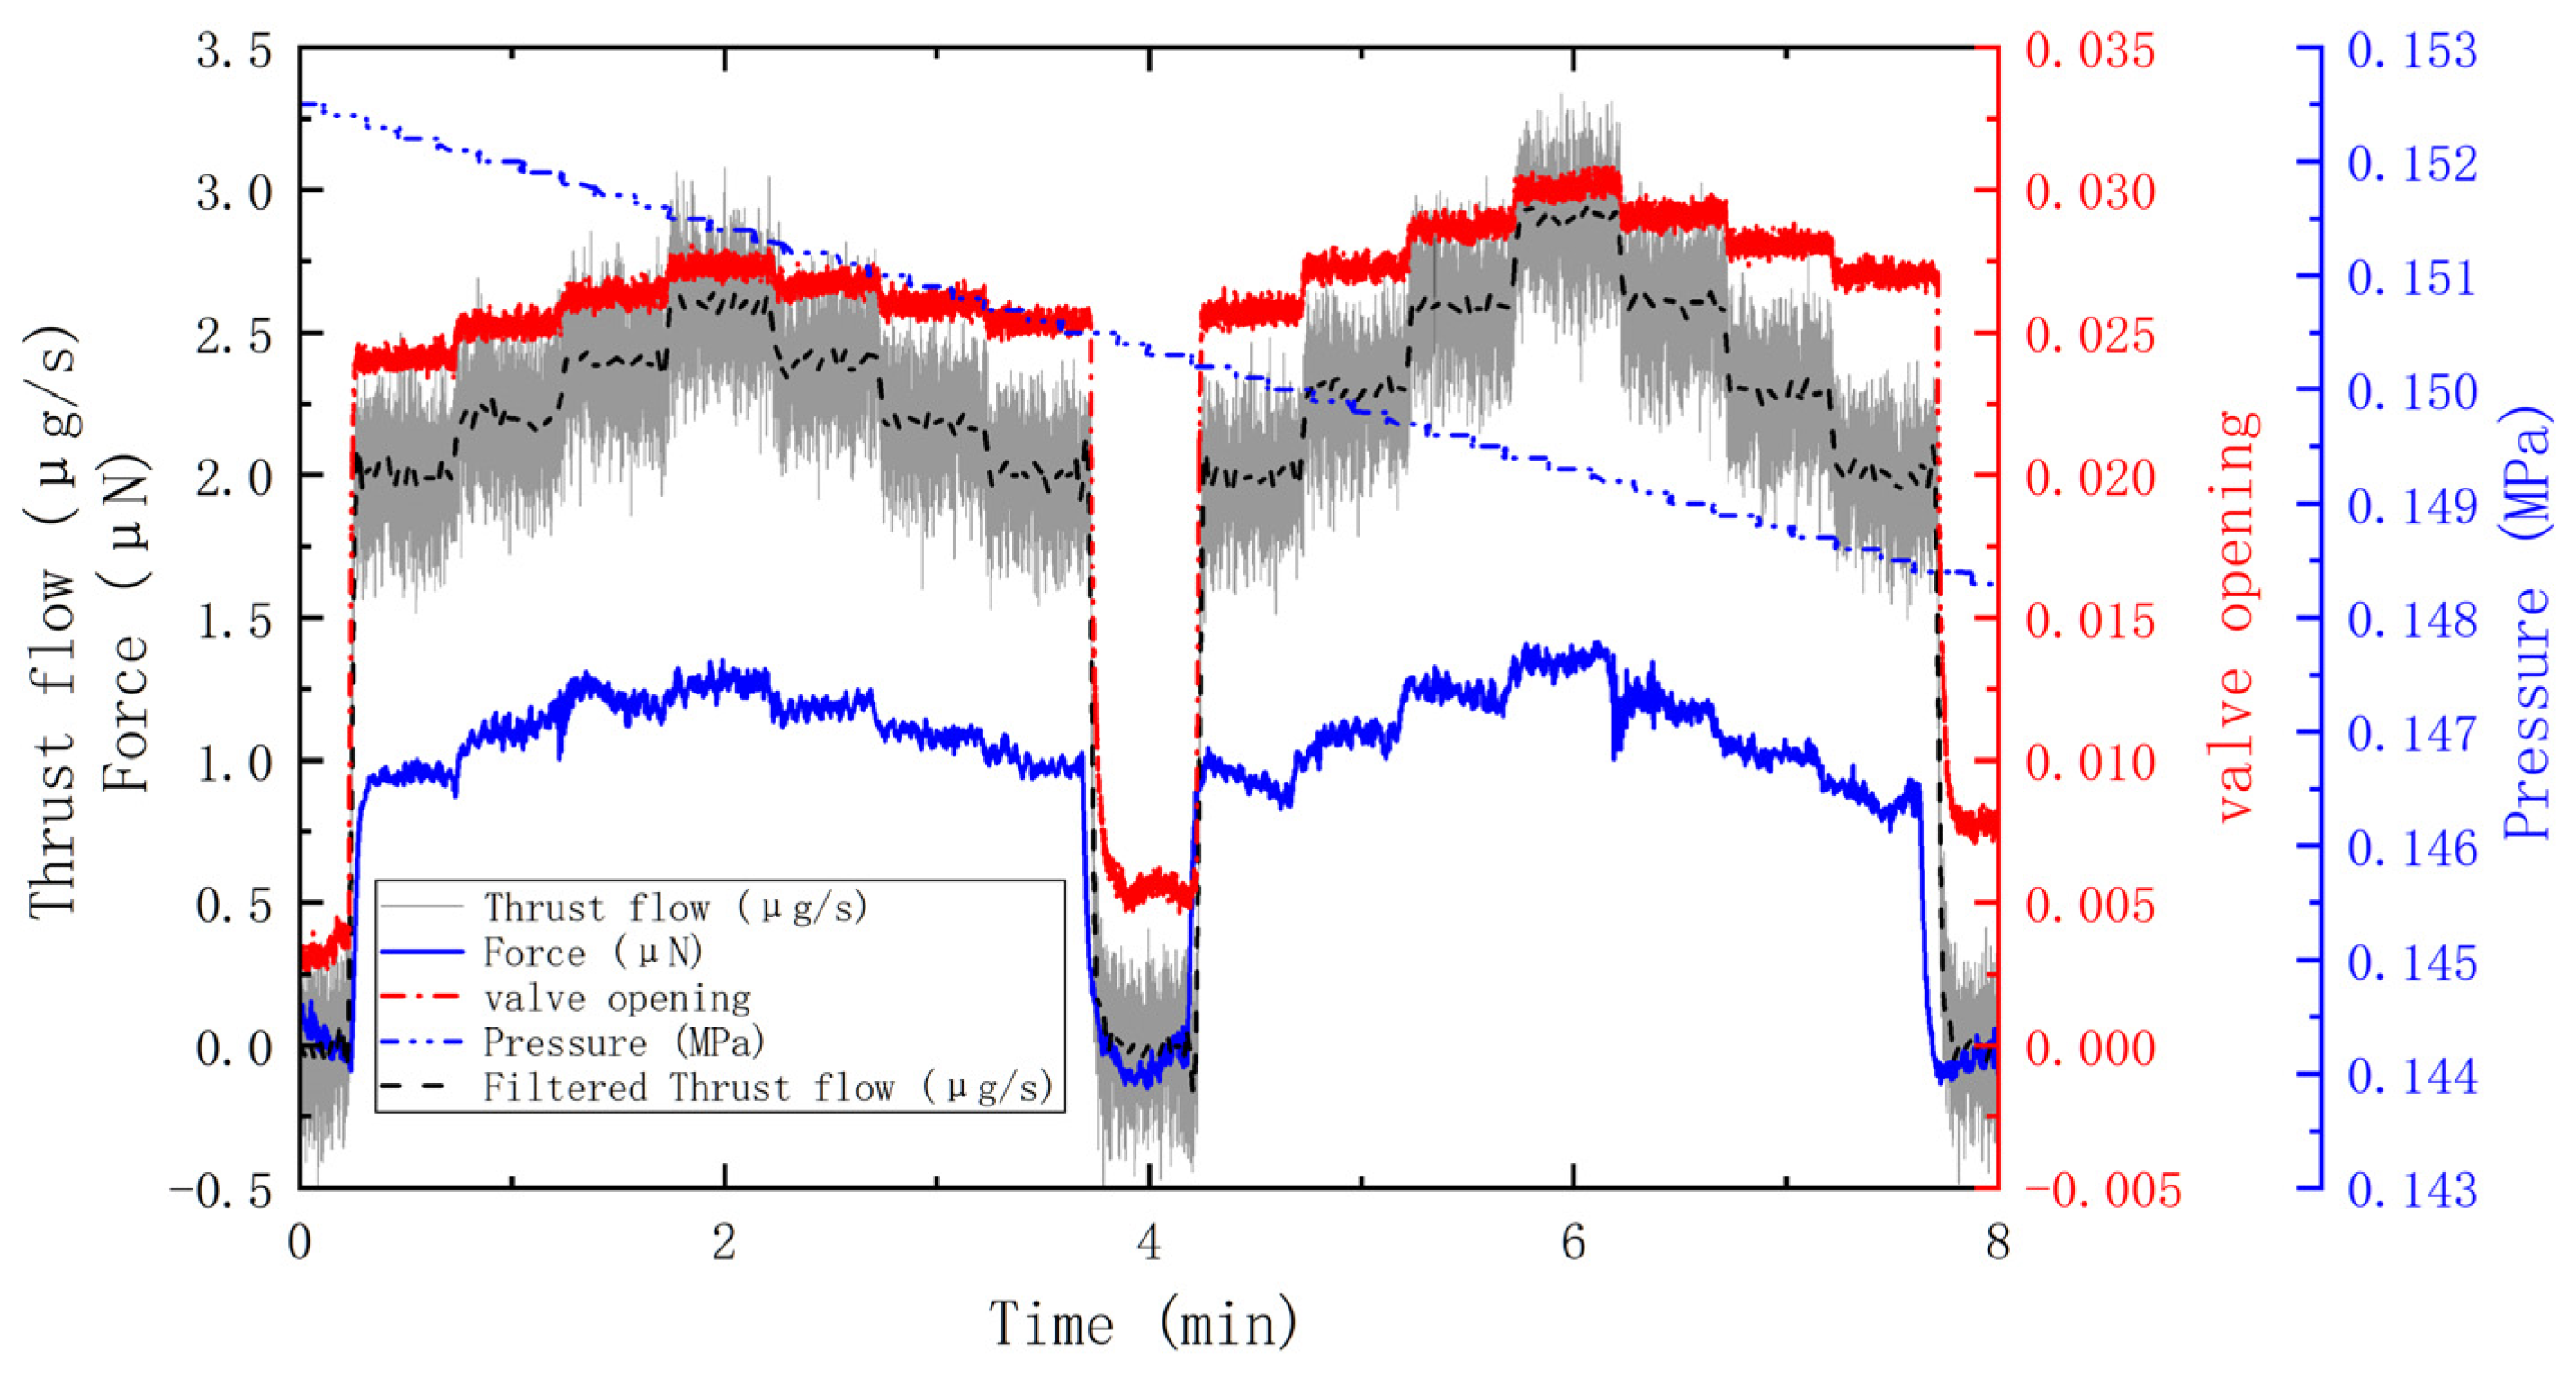
4.1. Thrust Range

In the course of a comprehensive thruster performance test, the thrust range is of primary interest. A closed-loop flow control method was adopted to give a specific flow value to the thruster. At the same time, a high-precision thrust test bench monitored and recorded, in real time, the pressure, thrust and displacement data generated by the thruster at the given flow rate. The displacement data were converted into needle valve opening values, and then a large amount of corresponding one-to-one experimental data was collected. After data analysis and processing, the corresponding relationship curves among flow, thrust, and the needle valve opening were constructed.
Figure 7 shows the thruster’s large flow dynamic range test and its corresponding thrust. In this test, the given flow was 2000 μg/s, and then the two higher flow points of 2100 μg/s and 2200 μg/s were tested, reaching the highest critical flow range of the thruster in the large flow mode. It can be observed in the figure that in the large flow mode, both the flow and thrust performance of the thruster were relatively stable. As the given flow increased, the thrust also increased steadily, and the thrust generated by the thruster stably exceeded 1000 μN when the flow reached 2000 μg/s and above. The needle valve opening gradually increased, which is due to the fact that the tank pressure gradually decreases with a large flow, and the needle valve opening has to be increased to keep the flow rate unchanged under the condition of closed-loop control.
The results are corroborated by the gradual decrease in pressure. This result demonstrates that the needle valve can move quickly under high flow conditions with closed-loop flow control, and that the thrusters have good performance stability, meeting the demand for higher thrust output under high flow conditions.
Figure 8 shows a step diagram of the flow rate, thrust, and opening in detail, showing the continuous change in the flow rate from 150 μg/s to 550 μg/s in steps of 50 μg/s, and then decreasing to 150 μg/s in the same step value. It can be seen in the figure that as the flow rate gradually increases, the corresponding thrust also shows a smooth change trend. This thrust output reflects the excellent continuous adjustment capability of the thruster in a wide flow range and also implies that in actual application, the thrust size can be flexibly adjusted according to different mission requirements to achieve precise space operations.
Figure 9 shows the results of a wide range thrust test on the actuator with a thrust range of up to 1300 μN. During the test, the thrust and flow rate were measured accurately, and the obtained thrust data were fitted linearly to obtain the relationship between the thrust and flow rate.
Using this relationship, we calculated the flow value corresponding to any thrust value within the range of 1300 μN and vice versa. This allowed us to obtain a more in-depth understanding of the thruster’s performance and to grasp its flow change law and overall operating characteristics under different thrust conditions.
Figure 10 illustrates the data correspondence between the displacement and thrust. To further explore the intrinsic relationship between displacement and thrust, we used the method of third-order polynomial fitting to obtain a fitting curve that reveals the correspondence between the displacement and thrust to some extent.
The fit has a certain deviation in the mean displacement. There are two main reasons for this problem. One is that the needle valve material itself has a hysteresis characteristic. Due to this characteristic, the relationship between the displacement and thrust of the needle valve in the process of movement is not completely linear, but has certain hysteresis and non-linear factors, which poses considerable challenges to the fitting work. Secondly, the change in tank pressure also affects the fitting accuracy. In the experimental process, the pressure is not always constant, and its fluctuation causes corresponding changes in the thrust, which in turn disrupt the normal correspondence between the displacement and thrust, making it difficult to fit the curve to the actual data.

4.2. Thrust Resolution
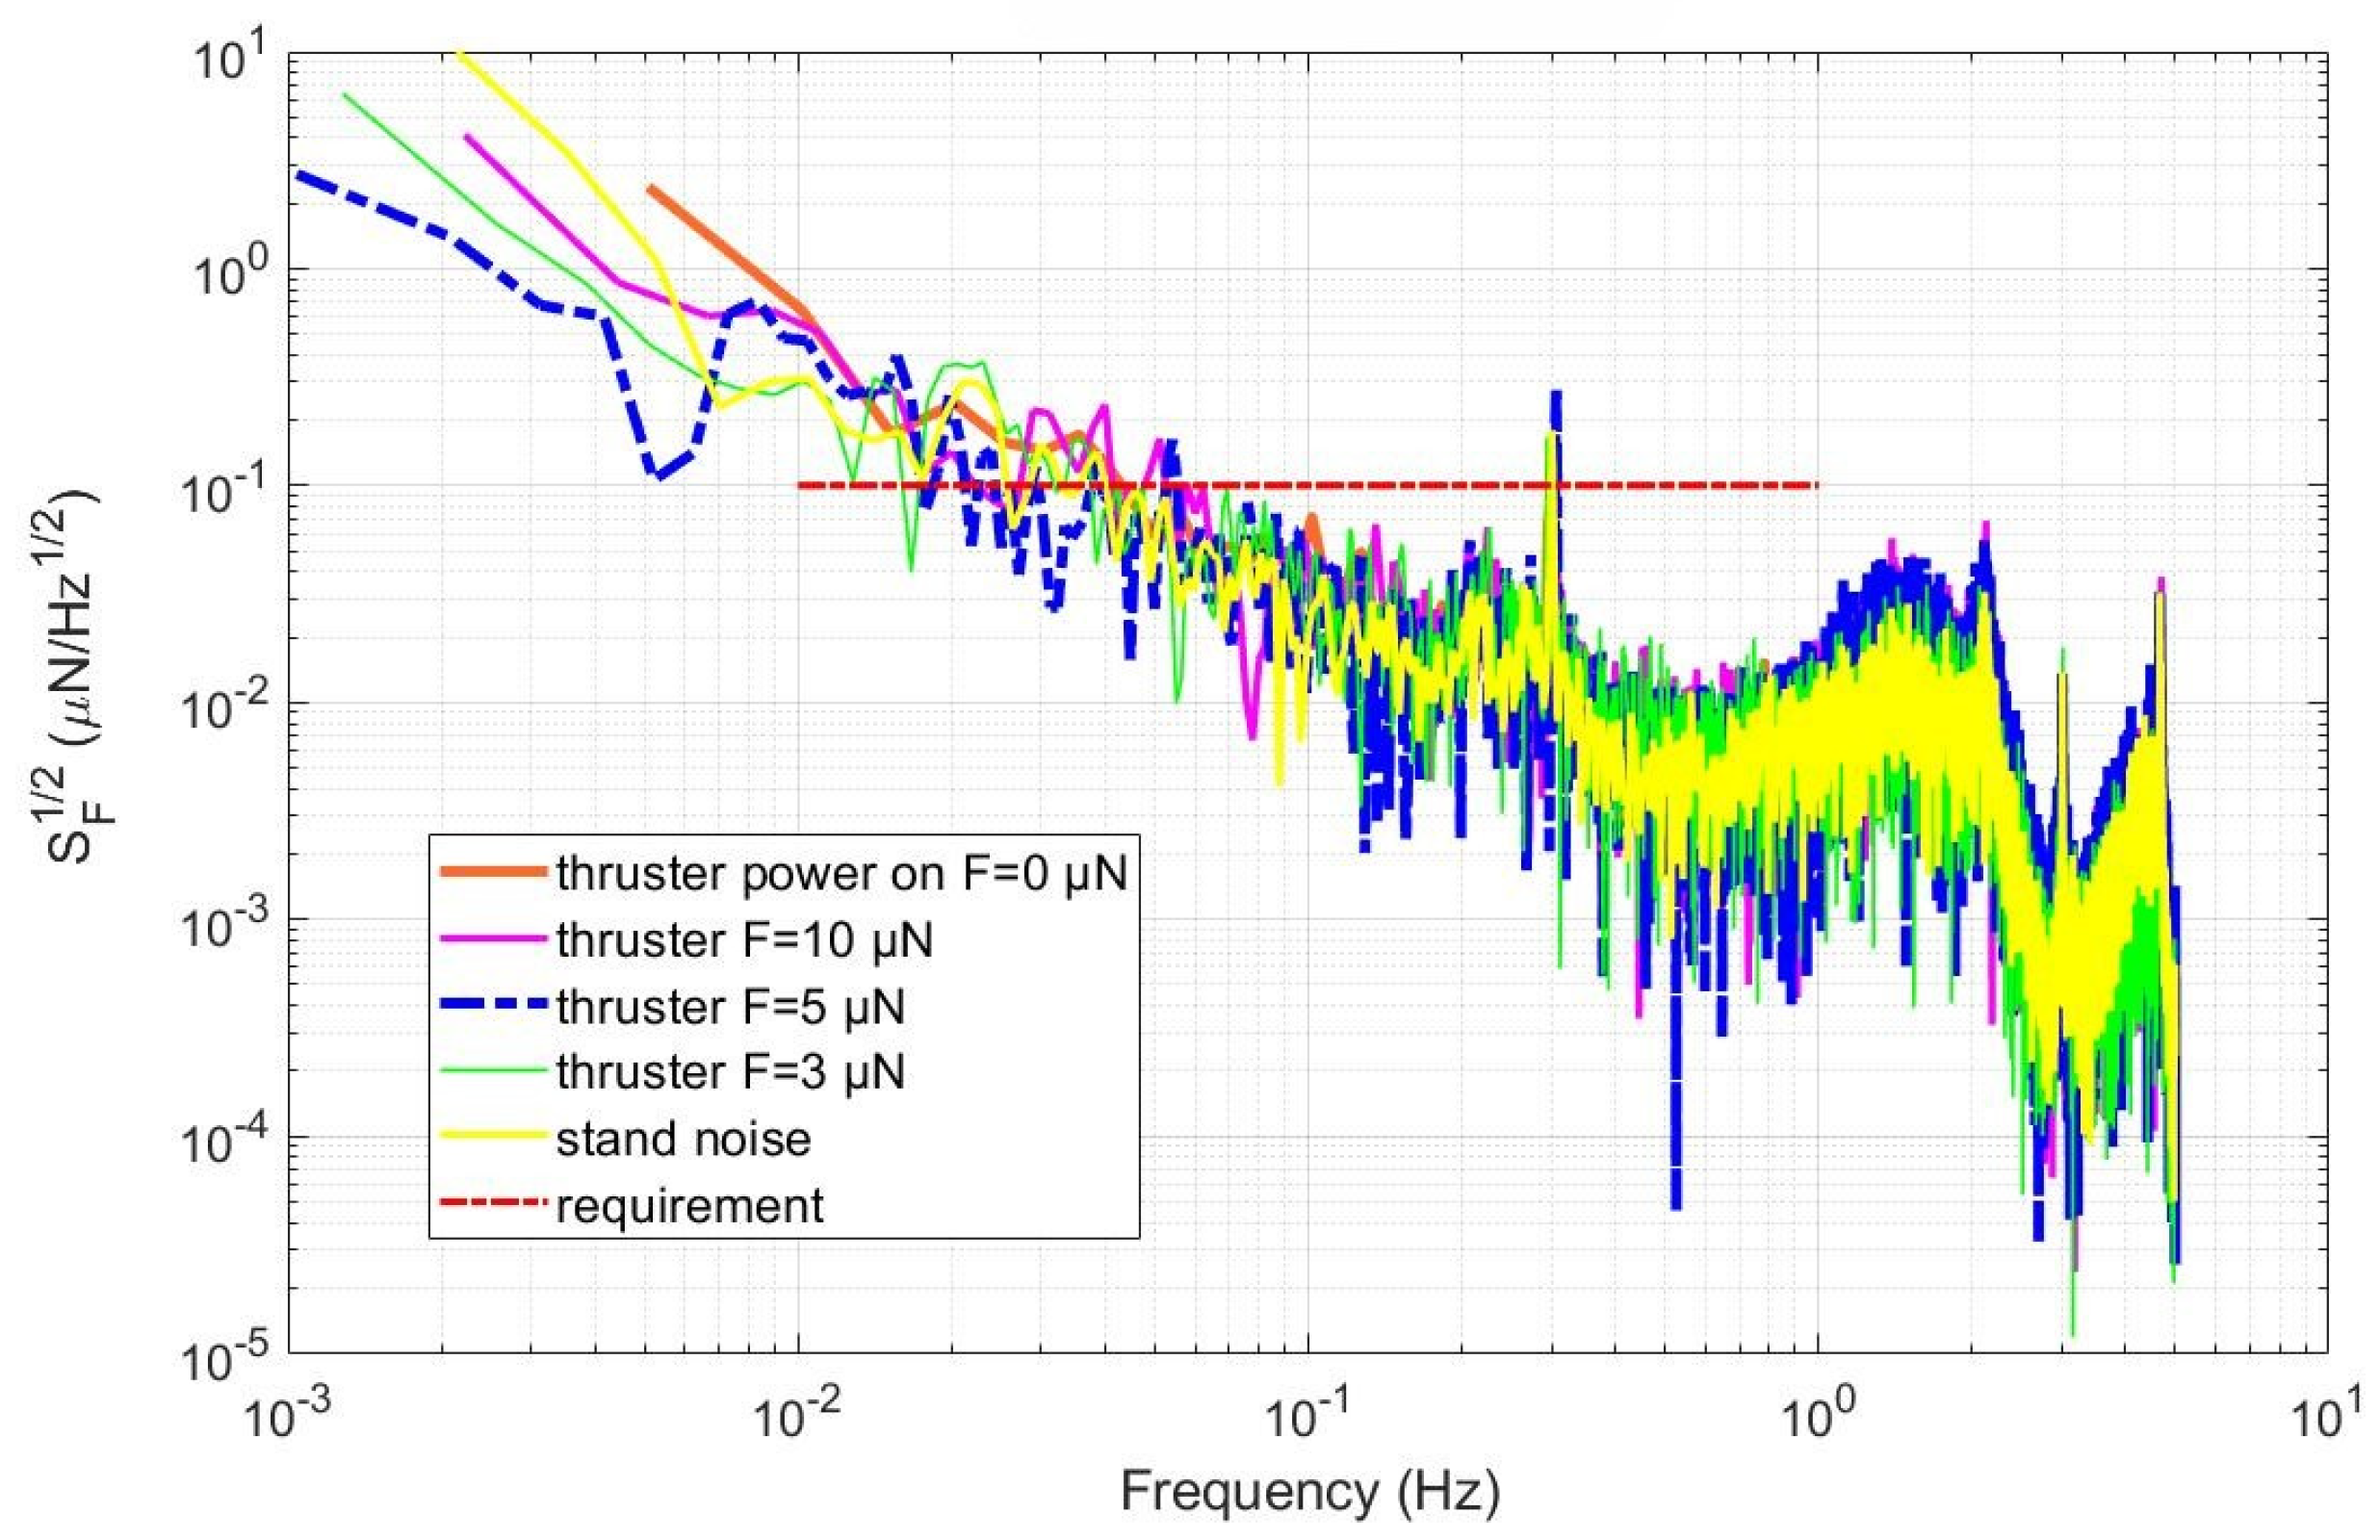
As a high-precision propulsion device, the design objective of the micro-Newton cold gas thruster is to achieve a wide range of thrust adjustments while ensuring high resolution and accuracy under the micro-Newton low-thrust output state. This is critical to meet the noise reduction requirements of spacecraft for complex space missions. During the experiment, a finely controlled small flow was input to the thruster, and the force frame results show that the output resolution in the small flow mode reached 0.1 μN.
Figure 11 shows in detail the thrust characteristics of the micro-Newton cold gas thruster, as the flow rate varied in steps of 0.2 μg/s and 0.3 μg/s. The initial flow rate of this test was set at 2 μg/s, and then the flow rate was stepped up and down in increments of 0.2 μg/s and 0.3 μg/s, enabling a comprehensive examination of the thrust response of the thruster at a high flow rate resolution.
It can clearly be seen in the figure that the flow sensor and displacement sensor of the thruster achieved the set accuracy, and the thrust test bench also detected the thrust change with this accuracy. When the flow rate changed by 0.2 μg/s, the resolution reached 0.1 μN. This result demonstrates that the thruster performed well in flow control accuracy and thrust output sensitivity and could sense and respond to small flow changes, thereby achieving precise adjustment of the corresponding thrust. The measurement accuracy of the force frame itself was also excellent, and it detected small thrust changes of 0.1 μN.

4.3. Thrust Noise

Figure 12 shows the thrust noise power spectrum density measured under different constant thrust conditions, covering various working conditions, such as thrust of 3 μN, 5 μN, 10 μN, as well the thruster being on but not given flow. It can be seen in the figure that under these different working conditions, the level of thrust noise was roughly equivalent to the standard noise level of the experimental environment, and both were of the same order of magnitude, showing that under normal thrust conditions, the thrust noise did not increase abnormally.
The frequency band of main concern is from 10−3 Hz to 1Hz. The band above 0.1 Hz had only one frequency point, 0.3 Hz, where the shear noise exceeded the set requirement threshold of 0.1 μN/Hz1/2. This frequency point corresponds to an oscillation period of approximately 3.3 s. In this case, the possible cause was the fluctuation in the flow rate. Rapid changes in the flow rate produce high-frequency disturbances, which are directly transferred to the thrust output and manifest themselves as high-frequency thrust noise. During the long-term operation of the thruster, due to the influence of various internal factors and the external environment, its performance may drift slowly. This drift will be reflected in the low-frequency fluctuation of the thrust, thereby affecting the stability of the thrust.
To further reduce thrust noise and improve thrust stability, the two key factors of voltage fluctuation and flow fluctuation can be optimized. For example, by adopting a more stable power supply system, the voltage can be precisely regulated to reduce the voltage fluctuation. At the same time, the flow control system can be optimized, and high-precision flow sensors and advanced control algorithms can be used to achieve precise control of the flow, thus reducing the flow fluctuation. To address the problem of drift in thruster performance, the monitoring and maintenance of the thruster can be strengthened, the performance of the thruster can be regularly calibrated and adjusted regularly, and problems that may cause performance drift can be detected and resolved on time to ensure that the thruster is always in a good operating state. By implementing these measures, it is expected that the thrust noise can be controlled at a lower level and meet more stringent performance requirements.

5. Conclusions

This paper details an cold gas thruster integrated with multiple sensors, including a flow sensor, a pressure sensor, and a displacement sensor. The thruster can achieve a maximum thrust of 1300 μN, and the resolution can reach up to 0.1 μN.
The good results of the high-precision displacement sensor reflect the excellent performance of the thruster in terms of flow control accuracy and thrust output sensitivity. The measurement accuracy of the force frame itself is also excellent, capable of detecting very small thrust changes of 0.1 μN. The thrust noise level of the actuator is good, comparable to the experimental environment standard noise. Only 0.3 Hz point noise exceeds the threshold in the frequency band above 0.1 Hz, which is presumably caused by flow fluctuations. The low-frequency fluctuations are mainly due to the drift of the operating state of the thruster. These results can provide some assistance for the application of cold gas thrusters in drag-free control systems.

Author Contributions

Conceptualization, S.L., Y.L. and X.L.; methodology, S.L. and Y.G.; formal analysis, S.L., H.T. and Y.G.; investigation, S.L., X.W. and G.M.; resources, X.W. and H.T.; data curation, H.T., G.M. and X.F.; writing—original draft preparation, S.L., Y.G. and H.T.; writing—review and editing, S.L., Y.G. and X.L.; visualization, J.L. and X.F.; supervision, Y.G.; project administration, Y.L.; and funding acquisition, Y.L. and X.W. All authors have read and agreed to the published version of the manuscript.

Funding

This research was funded by the National Key R&D Program of China (2020YFC2201100) and the National Natural Science Foundation of China (U21B2074, 42474236).

Data Availability Statement

The data generated in this study are available upon reasonable request from the corresponding authors.

Conflicts of Interest

The authors declare no conflict of interest.

References

  1. Marie, J.; Cordero, F.; Milligan, D.; Ecale, E.; Tatry, P. In-orbit experience of the Gaia and LISA Pathfinder cold gas micro-propulsion systems. In Space Operations: Inspiring Humankind’s Future; Springer: Cham, Switzerland, 2019; pp. 551–574. [Google Scholar]
  2. Lienart, T. First in-flight observations of the Cold Gas Propulsion System for CNES’Microscope spacecraft. In Proceedings of the 53rd AIAA/SAE/ASEE Joint Propulsion Conference, Atlanta, GA, USA, 10–12 July 2017; p. 4947. [Google Scholar]
  3. Bacchetta, A.; Saponara, M.; Torasso, A.; Criado, G.S.; Girouart, B. The Euclid AOCS science mode design. CEAS Space J. 2015, 7, 71–85. [Google Scholar] [CrossRef]
  4. Luo, J.; Bai, Y.; Cai, L.; Cao, B.; Chen, W.-M.; Chen, Y.; Cheng, D.-C.; Ding, Y.-W.; Duan, H.-Z.; Gou, X.; et al. The first round result from the TianQin-1 satellite. Class. Quantum Gravity 2020, 37, 185013. [Google Scholar] [CrossRef]
  5. Hu, W.; Wu, Y. The Taiji Program in Space for gravitational wave physics and the nature of Gravity. Natl. Sci. Rev. 2017, 4, 685–686. [Google Scholar] [CrossRef]
  6. Schleicher, A.; Ziegler, T.; Schubert, R.; Brandt, N.; Bergner, P.; Johann, U.; Fichter, W.; Grzymisch, J. In-orbit performance of the LISA Pathfinder drag-free and attitude control system. CEAS Space J. 2018, 10, 471–485. [Google Scholar] [CrossRef]
  7. Köhler, J.; Bejhed, J.; Kratz, H.; Bruhn, F.; Lindberg, U.; Hjort, K.; Stenmark, L. A hybrid cold gas micro thruster system for spacecraft. Sens. Actuators A Phys. 2002, 97, 587–598. [Google Scholar] [CrossRef]
  8. Ranjan, R.; Chou, S.K.; Riaz, F.; Karthikeyan, K. Cold gas micro propulsion development for satellite application. Energy Procedia 2017, 143, 754–761. [Google Scholar] [CrossRef]
  9. Wiktor, P.; Jafry, Y.; DeBra, D. On orbit thruster calibration with applications to Gravity Probe B. In Automatic Control in Aerospace 1992, Proceedings of the 12th IFAC Symposium, Ottobrunn, Germany, 7–11 September 1992; Pergamon: Oxford, UK, 1993; pp. 525–530. [Google Scholar]
  10. Everitt, C.; Muhlfelder, B.; DeBra, D.; Parkinson, B.W.; Turneaure, J.P.; Silbergleit, A.S.; Acworth, E.B.; Adams, M.; Adler, R.; Bencze, W.J.; et al. The Gravity Probe B test of general relativity. Class. Quantum Gravity 2015, 32, 224001. [Google Scholar] [CrossRef]
  11. DeBra, D.; Bencze, W.; Everitt, C.; VandenBeukel, J.; Kirschenbaum, J. Proportional helium thrusters for Gravity Probe B. Class. Quantum Gravity 2015, 32, 224016. [Google Scholar] [CrossRef]
  12. Matticari, G.; Noci, G.; Siciliano, P.; Colangelo, G.; Schmidt, R. Cold gas micro propulsion prototype for very fine spacecraft attitude/position control. In Proceedings of the 42nd AIAA/ASME/SAE/ASEE Joint Propulsion Conference & Exhibit, Sacramento, CA, USA, 9–12 July 2006; p. 4872. [Google Scholar]
  13. Sarritzu, A.; Pasini, A. Performance comparison of green propulsion systems for future Orbital Transfer Vehicles. Acta Astronaut. 2024, 217, 100–115. [Google Scholar] [CrossRef]
  14. Luo, J.; Chen, L.; Duan, H.; Gong, Y.-G.; Hu, S.; Ji, J.; Liu, Q.; Mei, J.; Milyukov, V.; Sazhin, M.; et al. TianQin: A space-borne gravitational wave detector. Class. Quantum Gravity 2016, 33, 035010. [Google Scholar] [CrossRef]
  15. Milyukov, V. TianQin space-based gravitational wave detector: Key technologies and current state of implementation. Astron. Rep. 2020, 64, 1067–1077. [Google Scholar] [CrossRef]
  16. Wei, Y.; Yan, H.; Liu, X.; Yu, Y.; Geng, J.; Chen, T.; Fu, T.; Su, G.; Hu, Y.; Han, D. The view of micropropulsion technology for China’s advanced small platforms in deep space. Space Sci. Technol. 2022, 2022, 9769713. [Google Scholar] [CrossRef]
  17. Hu, S.; Zhang, H.; Zhou, W.; Xu, H.; Li, Q.; Li, Z.; Yang, S.Q.; Liu, J.P. Micronewton Cold Gas Thruster Based on Silicon-Etched Two-Dimensional Nozzles. AIAA J. 2024, 62, 3418–3423. [Google Scholar] [CrossRef]
  18. Packan, D.; Jarrige, J.; Thobois, P.; Blanchard, C.; Elias, P.Q.; Fallerini, L.; Noci, G. Micronewton balance measurements at Onera and application to the GAIA Mission. IEPC Pap. 2013, 418, 2013. [Google Scholar]
  19. Jarrige, J.; Thobois, P.; Blanchard, C.; Elias, P.-Q.; Packan, D.; Fallerini, L.; Noci, G. Thrust measurements of the Gaia mission flight-model cold gas thrusters. J. Propuls. Power 2014, 30, 934–943. [Google Scholar] [CrossRef]
  20. Wang, C.; Guan, C.; Liu, X.; Wang, X.; Li, F.; Yu, X. Dynamic-force extraction for micro-propulsion testing: Theory and experimental validation. Rev. Sci. Instrum. 2018, 89, 115110. [Google Scholar] [CrossRef] [PubMed]
  21. Xu, H.; Gao, Y.; Mao, Q.; Ye, L.-W.; Hu, Z.-K.; Zhang, K.; Song, P.; Li, Q. A compound pendulum for thrust measurement of micro-Newton thruster. Rev. Sci. Instrum. 2022, 93, 064501. [Google Scholar] [CrossRef]
  22. Xu, H.; Mao, Q.; Gao, Y.; Wei, L.; Ding, Y.; Tu, H.; Song, P.; Hu, Z.; Li, Q. A newly designed decoupling method for micro-Newton thrust measurement. Rev. Sci. Instrum. 2023, 94, 014504. [Google Scholar] [CrossRef]
  23. Zou, S.; Cheng, Z.; Zhang, X.; Wang, G.; Liu, H.; Yang, Z.; Zhong, Y.; Liu, J.; Tu, L.; Yang, S.; et al. Ground-vibration suppression by a matched center of mass for microthrust testing in spaceborne gravitational-wave detection. Phys. Rev. Appl. 2023, 19, 024040. [Google Scholar] [CrossRef]
  24. Tu, H.; Sun, H.; Liu, K.; Cui, Q.; Zhu, Z.; Jiao, X.; Dong, Q.; Liu, L. Investigating the repeatability error in thrust measurement on a pendulum-based stand. Measurement 2024, 238, 115397. [Google Scholar] [CrossRef]
  25. Tu, H.; Cui, Q.; Sun, H.; Liu, K.; Liu, L. An integrated weak thrust stand based on vertical pendulum and its performance characteristics. Chin. Space Sci. Technol. 2024, 44, 154–163. (In Chinese) [Google Scholar]
  26. Hernando, J.; Sánchez-Rojas, J.; Schmid, U.; Ababneh, A.; Marchand, G.; Seidel, H. Characterization and displacement control of low surface-stress AlN-based piezoelectric micro-resonators. Microsyst. Technol. 2010, 16, 855–861. [Google Scholar] [CrossRef]
  27. Bouchilloux, P.; Le, L.; Lhermet, N.; Patient, G.; Claeyssen, F.; Lang, M. Application of amplified piezoelectric actuators to the construction of gas valves. In Proceedings of the Smart Structures and Materials 2003: Industrial and Commercial Applications of Smart Structures Technologies, San Diego, CA, USA, 4–6 March 2003; SPIE: Bellingham, WA, USA, 2003; Volume 5054, pp. 309–319. [Google Scholar]
  28. Motoo, K.; Toda, N.; Arai, F.; Fukuda, T.; Matsuno, T.; Kikuta, K.; Hirano, S.-I. Tailor-made multilayer piezoelectric actuator having large displacements and forces. Nippon Kikai Gakkai Ronbunshu C Hen/Trans. Jpn. Soc. Mech. Eng. Part C 2006, 72, 3302–3309. [Google Scholar] [CrossRef]
  29. Zhang, Q.; Wang, H.; Cross, L. Piezoelectric tubes and tubular composites for actuator and sensor applications. J. Mater. Sci. 1993, 28, 3962–3968. [Google Scholar] [CrossRef]
  30. Austin, E.; Ananthasayanam, B. Piezoelectric actuation of a compliant semi-infinite beam. In Proceedings of the Smart Structures and Materials 2004: Modeling, Signal Processing, and Control, San Diego, CA, USA, 14–18 March 2004; SPIE: Bellingham, WA, USA, 2004; Volume 5383, pp. 39–47. [Google Scholar]
  31. Zhang, H.; Duan, B.; Wu, L.; Hua, Z.; Bao, Z.; Guo, N.; Ye, Y.; DeLuca, L.T.; Shen, R. Development of a steady-state microthrust measurement stand for microspacecrafts. Measurement 2021, 178, 109357. [Google Scholar] [CrossRef]
  32. Wang, A.; Wu, H.; Tang, H.; Liu, Y.; Liang, X. Development and testing of a new thrust stand for micro-thrust measurement in vacuum conditions. Vacuum 2013, 91, 35–40. [Google Scholar] [CrossRef]
  33. Cui, H.; Li, X. A novel design method for the micro-thrust measurement system. Measurement 2023, 221, 113543. [Google Scholar] [CrossRef]
  34. Zhang, H.; Li, D.; Li, H. Development of a cantilever beam thrust stand for electric propulsion thrusters. Rev. Sci. Instrum. 2020, 91, 115104. [Google Scholar] [CrossRef]
Figure 1. Diagram of needle valve nozzle and nozzle throat.
Aerospace 12 00210 g001
Figure 2. Structural diagram (a) and photograph (b) of thruster.
Aerospace 12 00210 g002
Figure 3. Schematic diagram of the control algorithm principle.
Aerospace 12 00210 g003
Figure 4. Thrust test bench principle (a) and installation diagram (b).
Aerospace 12 00210 g004
Figure 5. Schematic diagram of gravity calibration principle.
Aerospace 12 00210 g005
Figure 6. Bench calibration curve.
Aerospace 12 00210 g006
Figure 7. High-thrust test (1200 μN), corresponding to flow of 2200 μg/s.
Aerospace 12 00210 g007
Figure 8. Thrust–flow comparison chart in the flow range of 150 μg/s to 550 μg/s.
Aerospace 12 00210 g008
Figure 9. Experimental results and linear fitting diagram of thrust and flow rate.
Aerospace 12 00210 g009
Figure 10. Experimental results and linear fitting diagram of thrust and displacement.
Aerospace 12 00210 g010
Figure 11. Flow rate step change diagram (flow rate started at 2ug/s and changed by 0.2 μg/s/step and 0.3 μg/s/step).
Aerospace 12 00210 g011
Figure 12. Thrust noise power spectrum density under different conditions.
Aerospace 12 00210 g012
Disclaimer/Publisher’s Note: The statements, opinions and data contained in all publications are solely those of the individual author(s) and contributor(s) and not of MDPI and/or the editor(s). MDPI and/or the editor(s) disclaim responsibility for any injury to people or property resulting from any ideas, methods, instructions or products referred to in the content.

