Article

Multibody Analysis of Lever-Spring Landing Gear with Elastomer Shock Absorbers: Modelling, Simulations and Drop Tests

1
State Key Laboratory of Precision Manufacturing for Extreme Service Performance, Central South University, Changsha 410083, China
2
National Enterprise R&D Centre, Sunward Intelligent Equipment Co., Ltd., Changsha 410100, China
3
Hunan Huayu Aviation Technology Co., Ltd., Zhuzhou 412002, China
4
School of Mechanical & Electrical Engineering, Changsha University, Changsha 410022, China
*
Authors to whom correspondence should be addressed.
Aerospace 2025, 12(5), 367; https://doi.org/10.3390/aerospace12050367
Submission received: 6 March 2025 / Revised: 22 April 2025 / Accepted: 22 April 2025 / Published: 23 April 2025
(This article belongs to the Section Aeronautics)

Abstract

:
This study investigates the ground reaction force of lever-spring landing gear (LSLG) equipped with compressible elastomer shock absorbers (ESA) during the landing process. First, a numerical dynamic model of the LSLG was developed in MATLAB/Simulink, revealing that runway roughness exerts a negligible influence on the ground reaction force during landing. The load characteristics established fundamental references for subsequent FEA-based structural design. Furthermore, an FEA model integrating the LSLG and the aircraft was developed with parameters calibrated for elastic units. The multibody dynamics simulation (MBDS) quantified the vertical ground reaction force and the structural stresses of LSLG, demonstrating two critical relationships: (1) the overload coefficient correlated with the sinking velocity yet exhibits no correlation with aircraft mass and (2) the peak of oscillating force attenuated faster with heavier landing weight at higher sinking velocities. A nonlinear multi-variables function was fitted to predict the maximum vertical ground reaction force. Subsequently, experimental validation via a landing gear drop test (LGDT) showed a maximum error of 8.39% between the results of the LGDT and the MBDS, confirming the accuracy of simulation and the fitting surface function for force prediction. The study further validates the feasibility and reliability of using the MBDS to model and study the LSLG with ESAs.

1. Introduction

The landing gear system, airframe and power plant are the three key components of the aircraft [1], and the responsibility of the landing gear is to ensure the safety and comfort during take-off and landing [2,3]. The shock absorber of landing gear is very significant to the buffering performance and safety of the aircraft [4]. This is to accommodate both rough and smooth landings that result from various forces acting upon it, and the most influential force is along the vertical direction.
The oleo-pneumatic shock absorber (OPSA) and the solid spring shock absorber (SSSA) are applied to most general aviation aircrafts. In the OPSA, the huge kinetic energy of shock is dissipated by the friction of liquid through small holes in the piston structures, resulting in remarkable shock absorption efficiency up to 90% or even higher [5]. The OPSA has been greatly developed and deeply studied. Double-chamber buffer systems demonstrate enhanced vibration attenuation capabilities during critical landing phases and prolonged taxiing operations [6]. The optimisation of the structures, such as the torque link and the retractable mechanism, improves the performance and reduces the weight of the landing gear with OPSA [7]. However, due to the high cost associated with manufacturing and maintaining complex structures, the OPSA is suitable for more severe shock conditions in larger aircraft.
The research object of this study is the landing gear of smaller and lighter general aircraft with operating speeds around 260 km/h. The SSSA, usually just a flexible leaf-spring leg, is more popular for this kind of aircraft because of its simple and easy-to-manufacture structure. Although such landing gear is generally unretractable, the drag effect is relatively small because of the low operating speed. The absence of a retraction mechanism greatly reduces the weight of the structure, thereby reducing fuel consumption. However, the shock absorption efficiency of SSSA is only 50% [8], limiting its application scope. Adding elastomers with super-elastic properties to assist shock absorption has great potential to improve the efficiency of shock absorption.

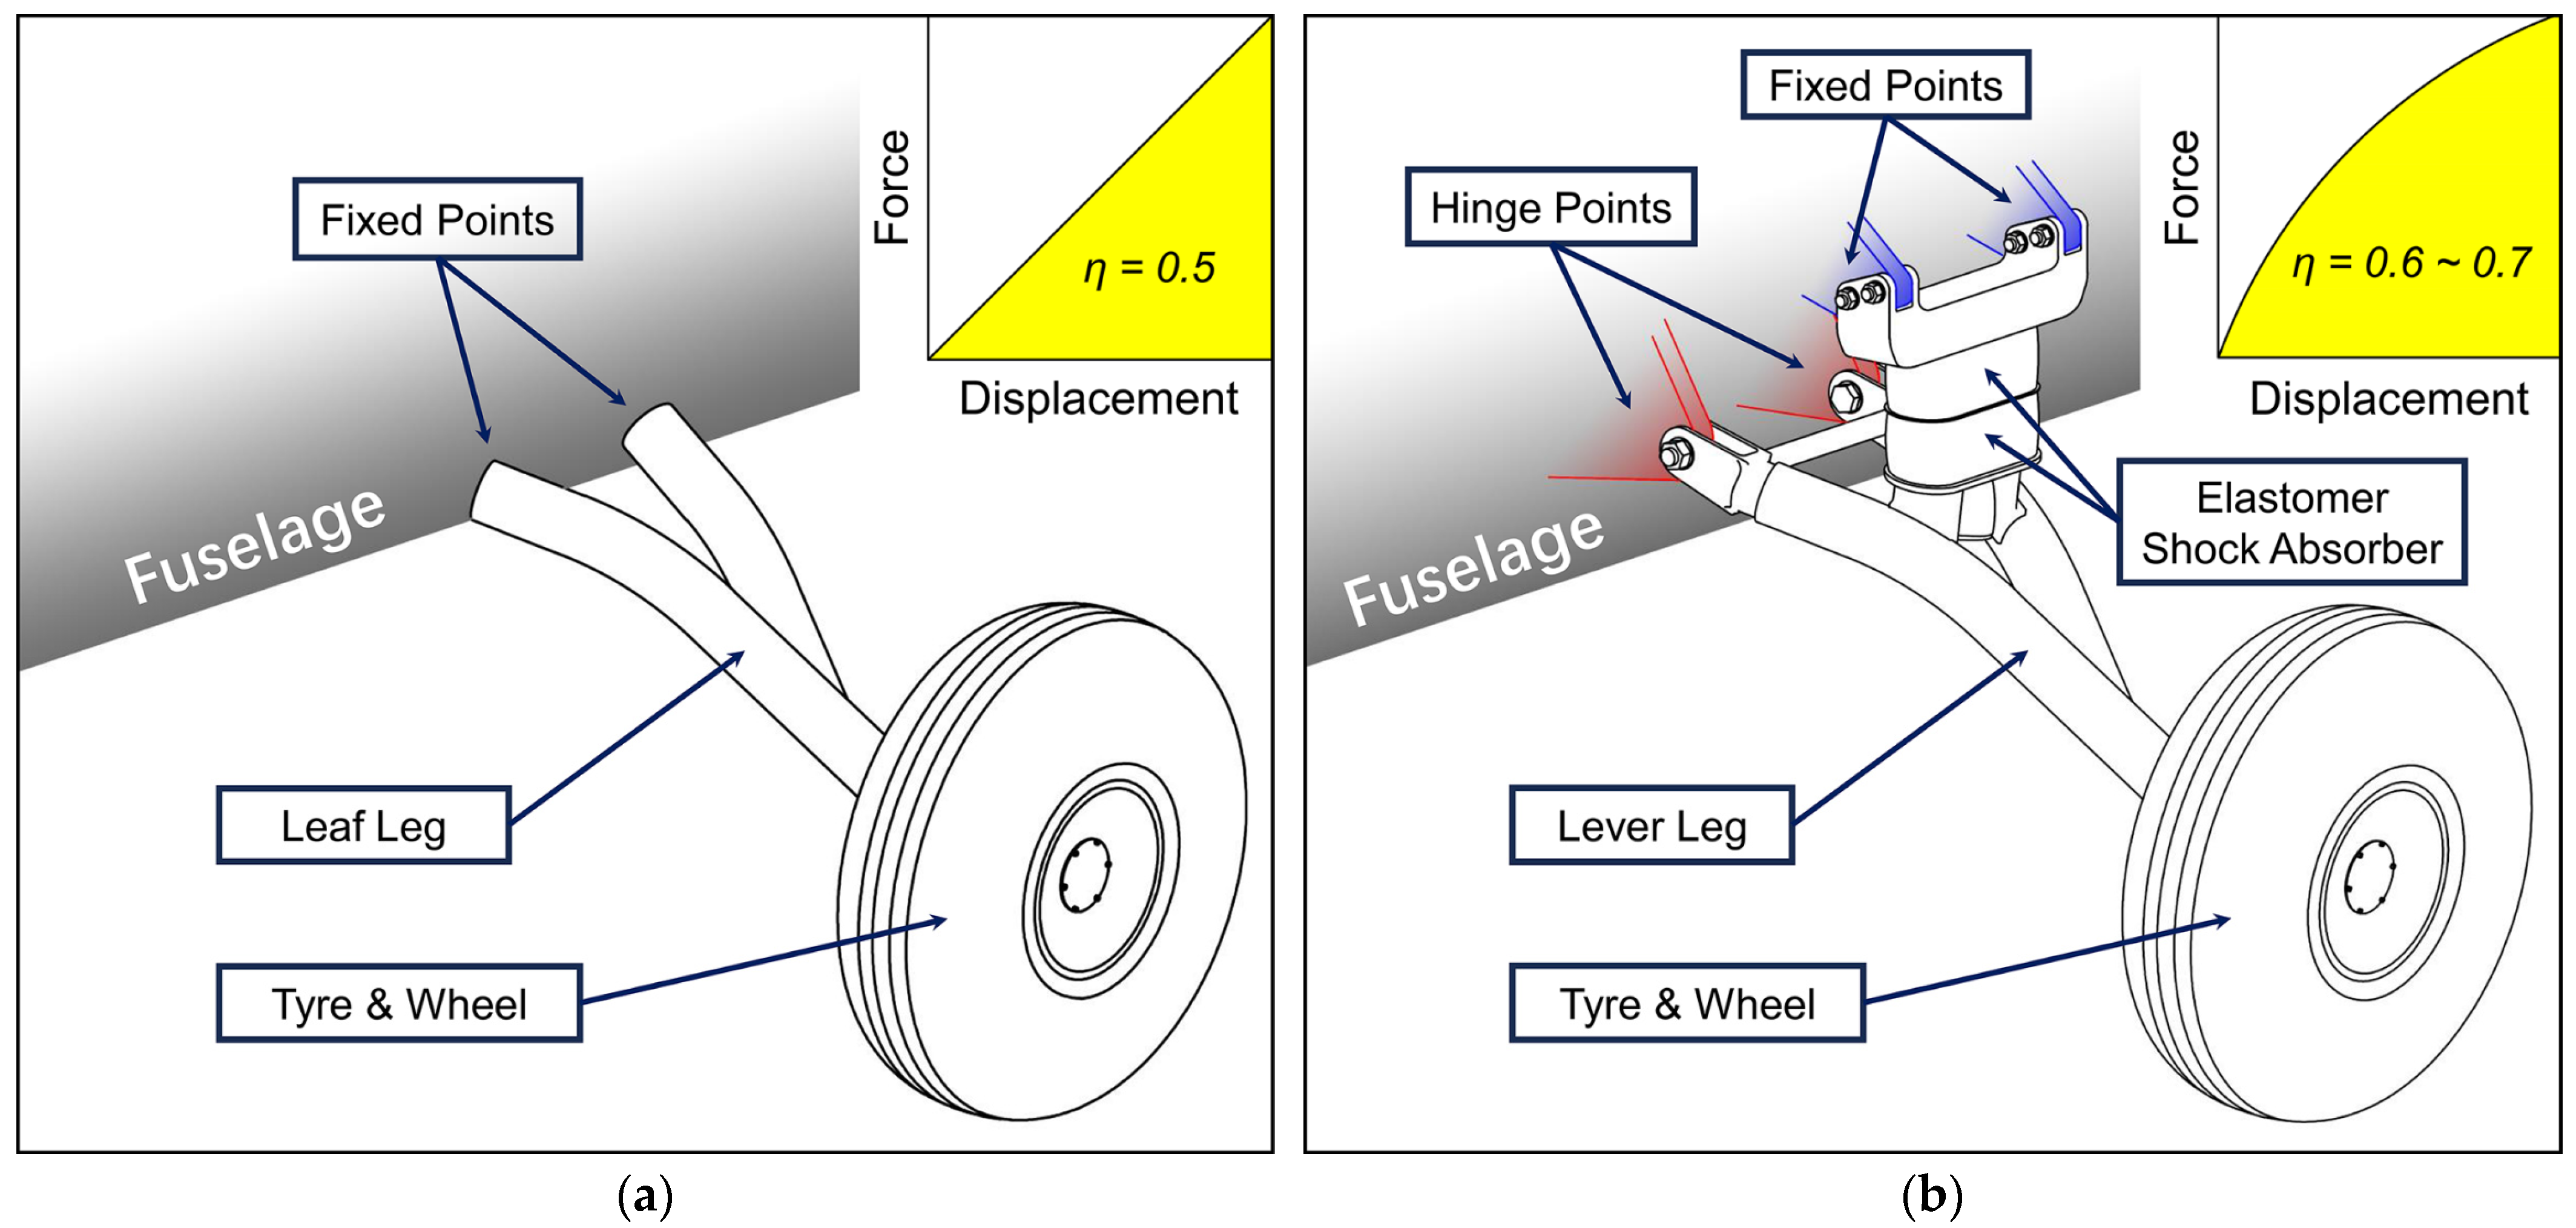
1.1. Lever-Spring Landing Gear

Figure 1a shows the landing gear with a leaf spring made of metal or composite materials, which is the major form of the main landing gear with SSSA. It absorbs the shock energy by the deformation of the fixed leg in line with Hooke’s Law, causing the high probability of bounces during landing. The efficiency of the leaf spring is represented by the ratio of the area under the curve of force change with displacement in Figure 1a, which cannot meet the buffering performance requirements of heavier general aviation aircrafts.
An easy solution to increase the buffering efficiency is to add the elastic elements as a separate buffering device to the leg, making it into the lever-spring landing gear (LSLG), as shown in Figure 1b. Normally, such elastic elements can be stretchable bungees or compressible elastomers that help the landing gear to achieve a shock absorption efficiency from 60% to 70% [8]. The LSLG equipped with a compressible elastomer shock absorber (ESA) is very suitable for heavier general aviation aircrafts, because it is not only easier to maintain than the OPSA but also better at buffering performance than the simple leaf-spring landing gear. When the lower surface of the tyre is subjected to the vertical ground reaction force, the assembly of the wheel and leg will rotate upward around the hinge points, thereby compressing the ESAs. The huge impact kinetic energy will be dissipated in the process of continuously compressing the ESAs. The DHC-6 Twin Otter manufactured by Viking Air Company (Victoria, BC, Canada) is the aircraft using LSLG with ESAs. The excellent landing performance with complex runways (concrete, grass, sand, ice, etc.) has made it so it is still being produced since the 1960s.
Traditional leaf-spring landing gear with flexible legs has been utilised widely and studied deeply. Xue et al. [9] used the reduced modal datum to describe the elastic deformation, which was a linear approximate of the flexible leaf spring, and established the drop system of the leaf-spring landing gear of a small UAV. Li et al. [10] used a genetic algorithm to optimise the weight of leaf-spring landing gear with glass fibre unidirectional prepreg and proved the effectiveness of the proposed two-stage optimisation method by static experiment verification. Zhang et al. [11] revealed the influence of weave patterns on the tensile properties of 3D woven composite leaf-spring landing gear by experiment and numerical simulation, and the multiscale model was established to predict the mechanical properties of landing gear.
However, the LSLG with ESA similar to the former but with higher buffering performance has not yet been studied deeply. In 2019, Hidayat et al. [12] used Adams software to simulate the drop test of the LSLG and conducted the physical drop test to determine the best stiffness of the compressible ESA and the best tyre pressure. Although elastic bungees are widely employed as auxiliary buffering components in landing gear systems of light aircrafts, scholarly research in this domain remains conspicuously absent. Current research is limited to bungee-assisted launch mechanisms for unmanned aerial vehicles (UAVs), with no substantive studies related to their shock absorption applications on landing gear [13,14].
With the development of material science, Gonca et al. [15] proposed a cylindrical ESA with variable stiffness by the hard sides stop method, and Ding et al. [16] introduced an adaptive elastic foundation composed of magnetorheological elastomer (MRE) for vibration reduction and frequency modulation. These indicate that the elastomers with variable stiffness have great potential in shock absorption under uncertain conditions [17], and it is feasible to be equipped on the LSLG to self-adapt to the landing conditions, which is also the area that the research team of authors will continue to study in the future.
Nowadays, elastomers such as rubber and polyurethane have been used as shock absorbers for automobiles, motorcycles [18], high-speed railways [19], elevator chassis [20], etc., but the theoretical and experimental studies for aircraft landing gear with elastomer shock absorbers (ESAs) are still too few.

1.2. Modern Methods in Landing Gear Research

The landing gear is a constantly developing field with the new applications of materials, control technologies, tests and simulation methods [21]. The simulation and experimental research on the dynamics of landing gear system contribute to the optimisation of the structural design and shock absorbers [22]. The landing gear drop test (LGDT) is utilised to verify the accuracy of the simulation results and ensure the reliability and safety of its structure [23,24]. Such tests are also crucial for aircraft design and certification under aviation regulations of different nations. With the development of computer technologies, virtual testing via multibody dynamic simulation (MBDS) is utilised to simulate the landing process, offering a cheaper and faster way for engineers to find potential problems before physical manufacture and tests [25]. Diogo et al. [26] collected information on how to simulate aircraft interaction with traffic-dependent energy harvesting systems, including landing gear, and verified which software can address the proposed simulation.
Until now, except for the research of Hidayat et al. [12], there is little research using virtual simulation to explore LSLG. However, it is very typical to use finite element analysis (FEA) to simulate the motion of other types of landing gear. Pagani et al. [27] built an FEA model of composite leaf-spring landing gear and analysed its motion with an MBDS. The relationship between the geometry and material characteristics of the composite landing gear and the force on the fuselage was illustrated, which can be used for future design and developments of landing gear systems. Liu et al. [28] conducted enhanced MBDS research on an OPSA landing gear, considering the structural flexibility and bearing support by adopting flexible multi-bodies modelling and rigid-flex coupling contacts. Pagani et al. [29] built a physical model of the legged landing gear of a space lander and the surface of a celestial body through the MBDS with a dedicated control system and analysed the terminal descent phase of a space lander on a celestial body.
As a result, although there are limited theoretical studies and direct simulation/experimental research on aircraft using LSLG with ESAs, the abovementioned research methods can still serve as references. Theoretical modelling of LSLG remains challenging due to its complex multibody dynamics system that includes flexible steel tube legs, tyres and ESA with hysteretic and hyperelastic properties. Since LSLG and corresponding aircraft are currently in use and require upgrades, research based on numerical dynamics models, MBDS and physical LGDT is essential.

1.3. Research Objectives and Novelties

The study object of this paper is an LSLG equipped with compressible ESAs (Figure 1b), which is designed to be installed to an unmanned light cargo aircraft as its main landing gear. The maximum take-off weight of this aircraft is 7.5 tons, which means that this aircraft is under civil aviation regulations CCAR part 23 and FAR part 23 according to CCAR §23.3(d) and FAR §23.3(d) [30,31]. The following aspects were innovatively studied:
  • A numerical dynamic model of the LSLG with ESA considering the uneven runway surface based on band-limited white noise (BLWN) was developed and simulated with MATLAB/Simulink R2024b;
  • An FEA model of the LSLG was built, with detailed calibrations of the tyre and ESA, followed by MBDS to analyse stress distribution and parameter sensitivity;
  • The LSLG with ESA was manufactured and tested on the LGDT rig, and the accuracies of a numerical dynamic model and the MBDS were validated and compared.

2. Numerical Modelling of Lever Spring Landing Gear

As shown in Figure 2, based on the lever-spring landing gear (LSLG) using elastomer shock absorbers (ESAs), a simplified dynamic system is built with some reasonable assumptions. The ESA is responsible for shock energy absorption through large deformation, whose stiffness is much less than the stiffness of the steel leg; hence, the lever leg is simplified as a rigid straight rod. The gravity centre (GC) of the leg measured is very close to the ESA; hence, the GC is assumed to be located directly below the ESA. The ESA and the tyre are built with a parallel spring damping model, respectively. The counterweight (M) is half of the landing weight of the aircraft, and only vertical movement is allowed. The angle between the leg and the horizontal direction is θ, and the change in θ during the working cycle is small and can be ignored.

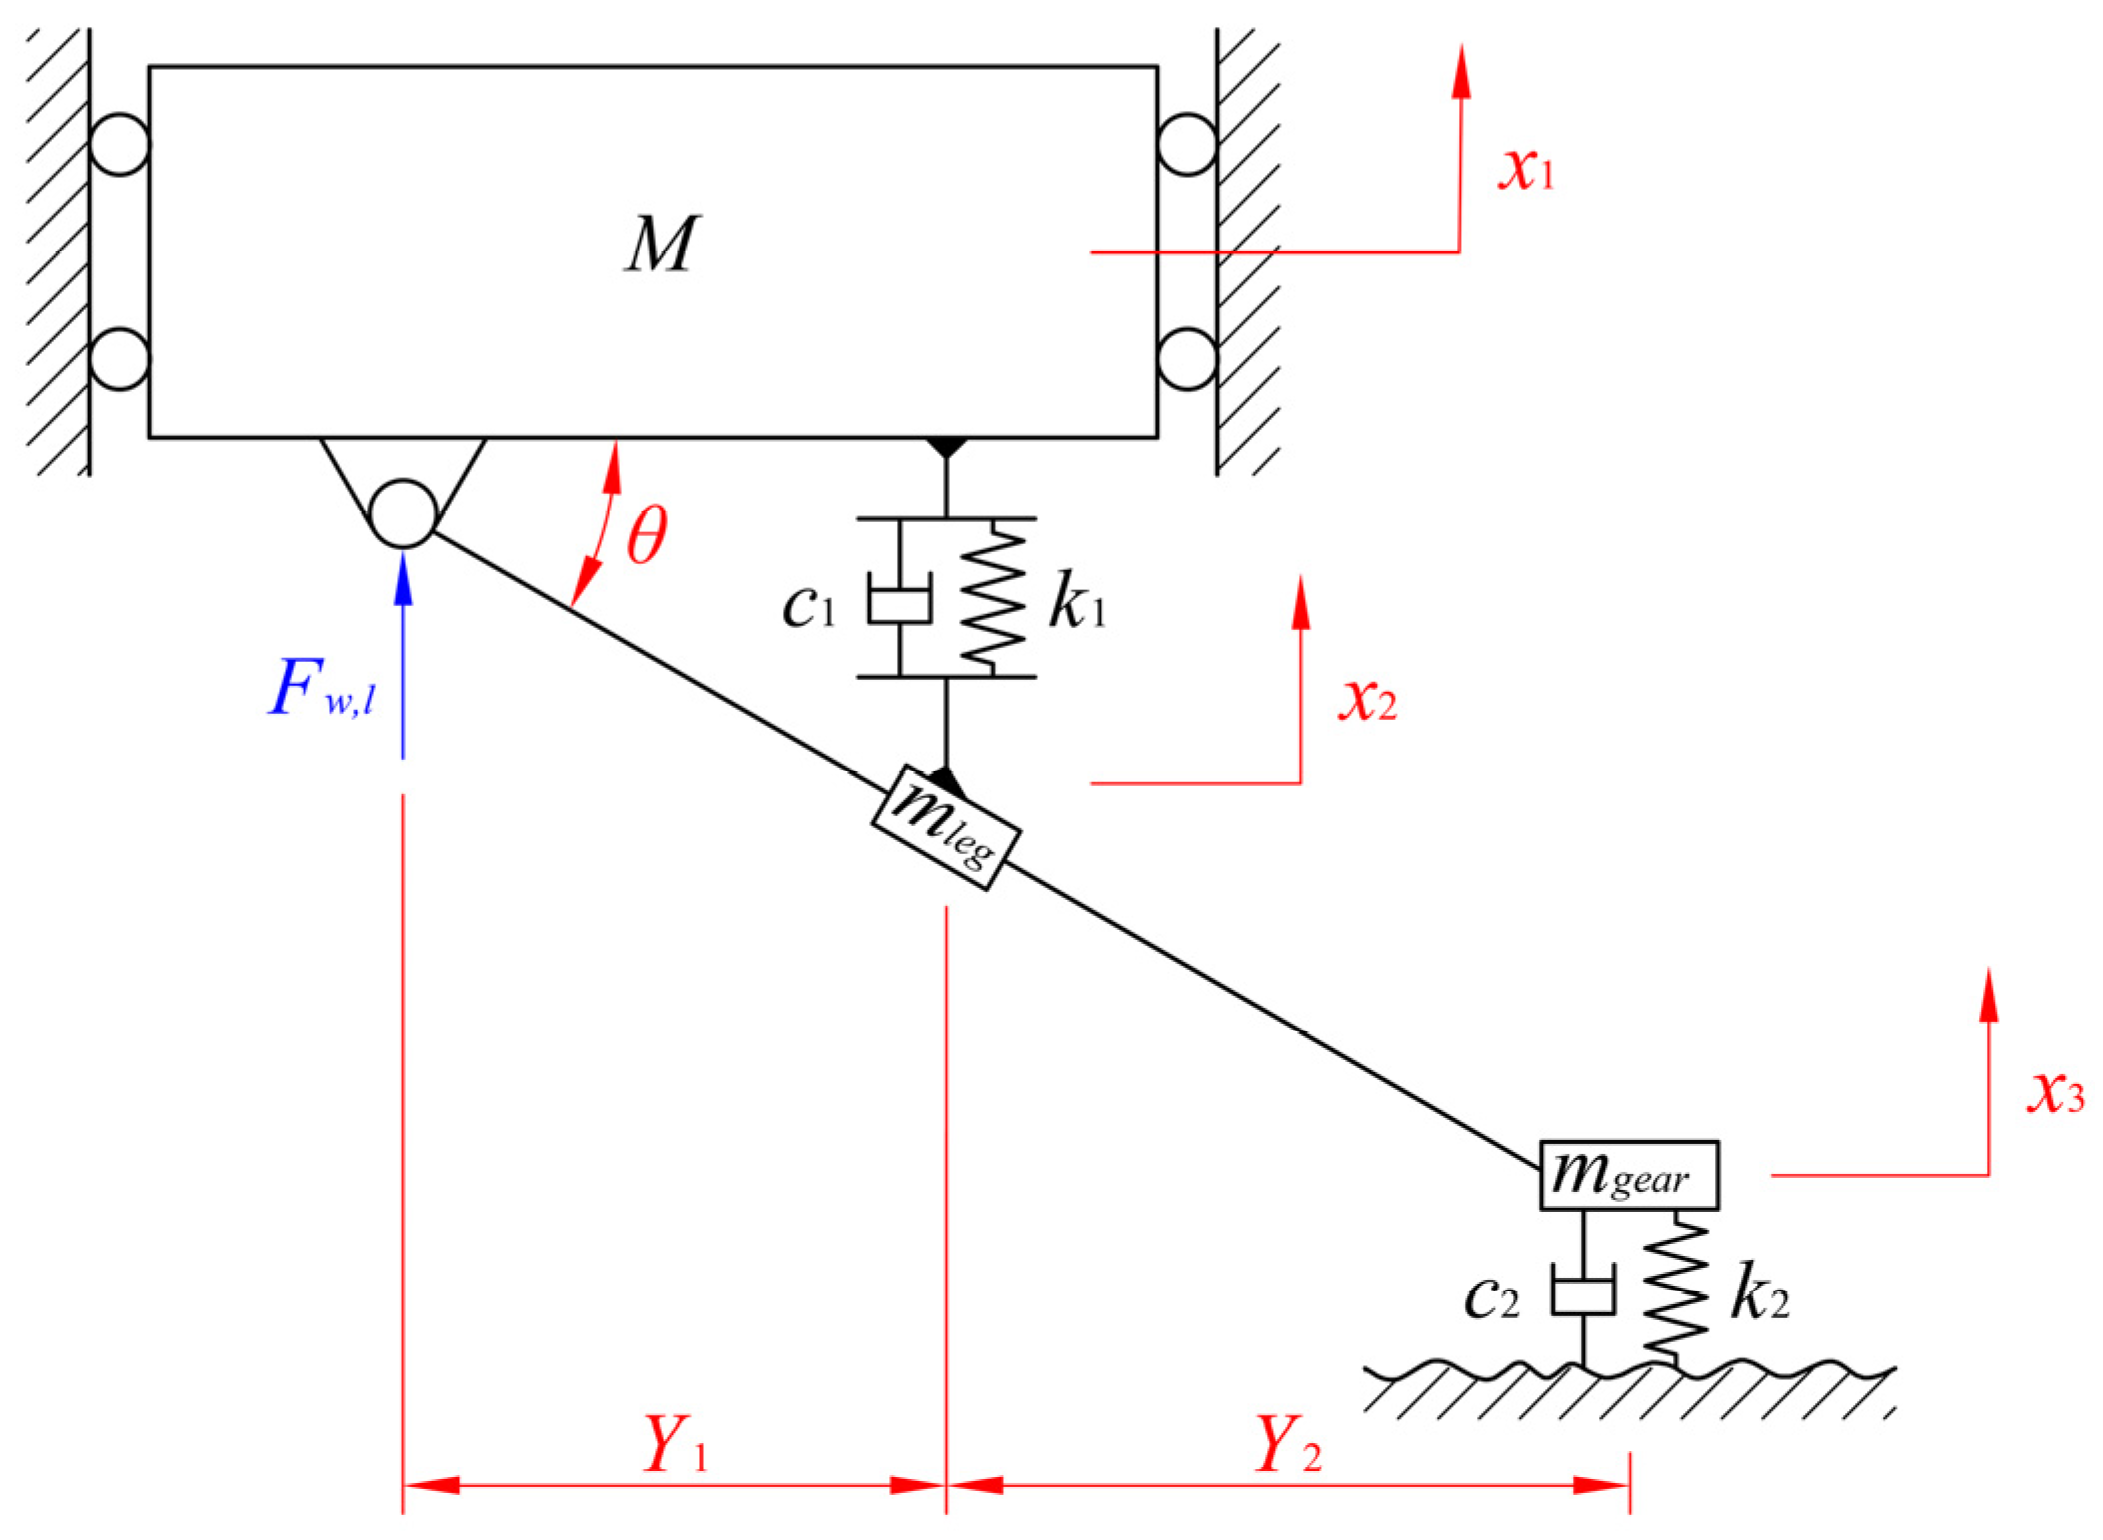
2.1. Dynamic Equations

Taking the GC of the lever leg as the rotation centre, the torque balance equation of lever leg can be obtained as follows:
F t y r e m g e a r g Y 2 F w , l Y 1 = J l e g θ ¨
where θ ¨ is the angular acceleration of rotation of the leg. Ignoring the rotation and angular velocity since it hardly changed, Equation (1) can be simplified as follows:
F w , l F t y r e m g e a r g = Y 2 Y 1
where Wgear is the mass weight of the gear (only the tyre and wheel); Fw,l is the force between the counterweight and the lever leg at the hinge point; and Ftyre is the force between the ground and the tyre, which can be written as follows:
F t y r e = k 2 x t x 3 + c 2 x ˙ t x ˙ 3
where x(t) and x ˙ t are the uneven runway excitations; k2 and c2 are the stiffness and damping of the tyre, respectively; and FESA is the force between the upper and the lower surfaces of the ESA, which can be written as follows:
F E S A = k 1 x 2 x 1 + c 1 x ˙ 2 x ˙ 1
where k1 and c1 are the stiffness and damping of the ESA, respectively.
Subsequently, the dynamics equation of the counterweight along the vertical direction can be written as follows:
M x ¨ 1 = F E S A M g + L F w , l = F E S A 1 C L M g F t y r e m g e a r g Y 2 Y 1
where L is the lift force; CL is the lift coefficient and is usually considered 2/3 according to FAR §23.725(b) and CCAR §23.725(b) [30,31]. The dynamics equation of the lever leg along the vertical direction can be written as follows:
m l e g x ¨ 2 = F E S A m l e g g + F t y r e m g e a r g + F w , l = F E S A m l e g g + F t y r e m g e a r g Y 2 Y 1 + 1
Considering the whole LSLG along the vertical direction, the ground reaction force on the tyre should be equal to the sum of the external forces on all the masses:
F t y r e = M x ¨ 1 g + m l e g x ¨ 2 g + m g e a r x ¨ 3 g
Rearranging the above Equation (7) into the same form as the previous two equations, the dynamic equation for the gear can be obtained as follows:
m g e a r x ¨ 3 = F t y r e + M + m l e g + m g e a r g M x ¨ 1 m l e g x ¨ 2

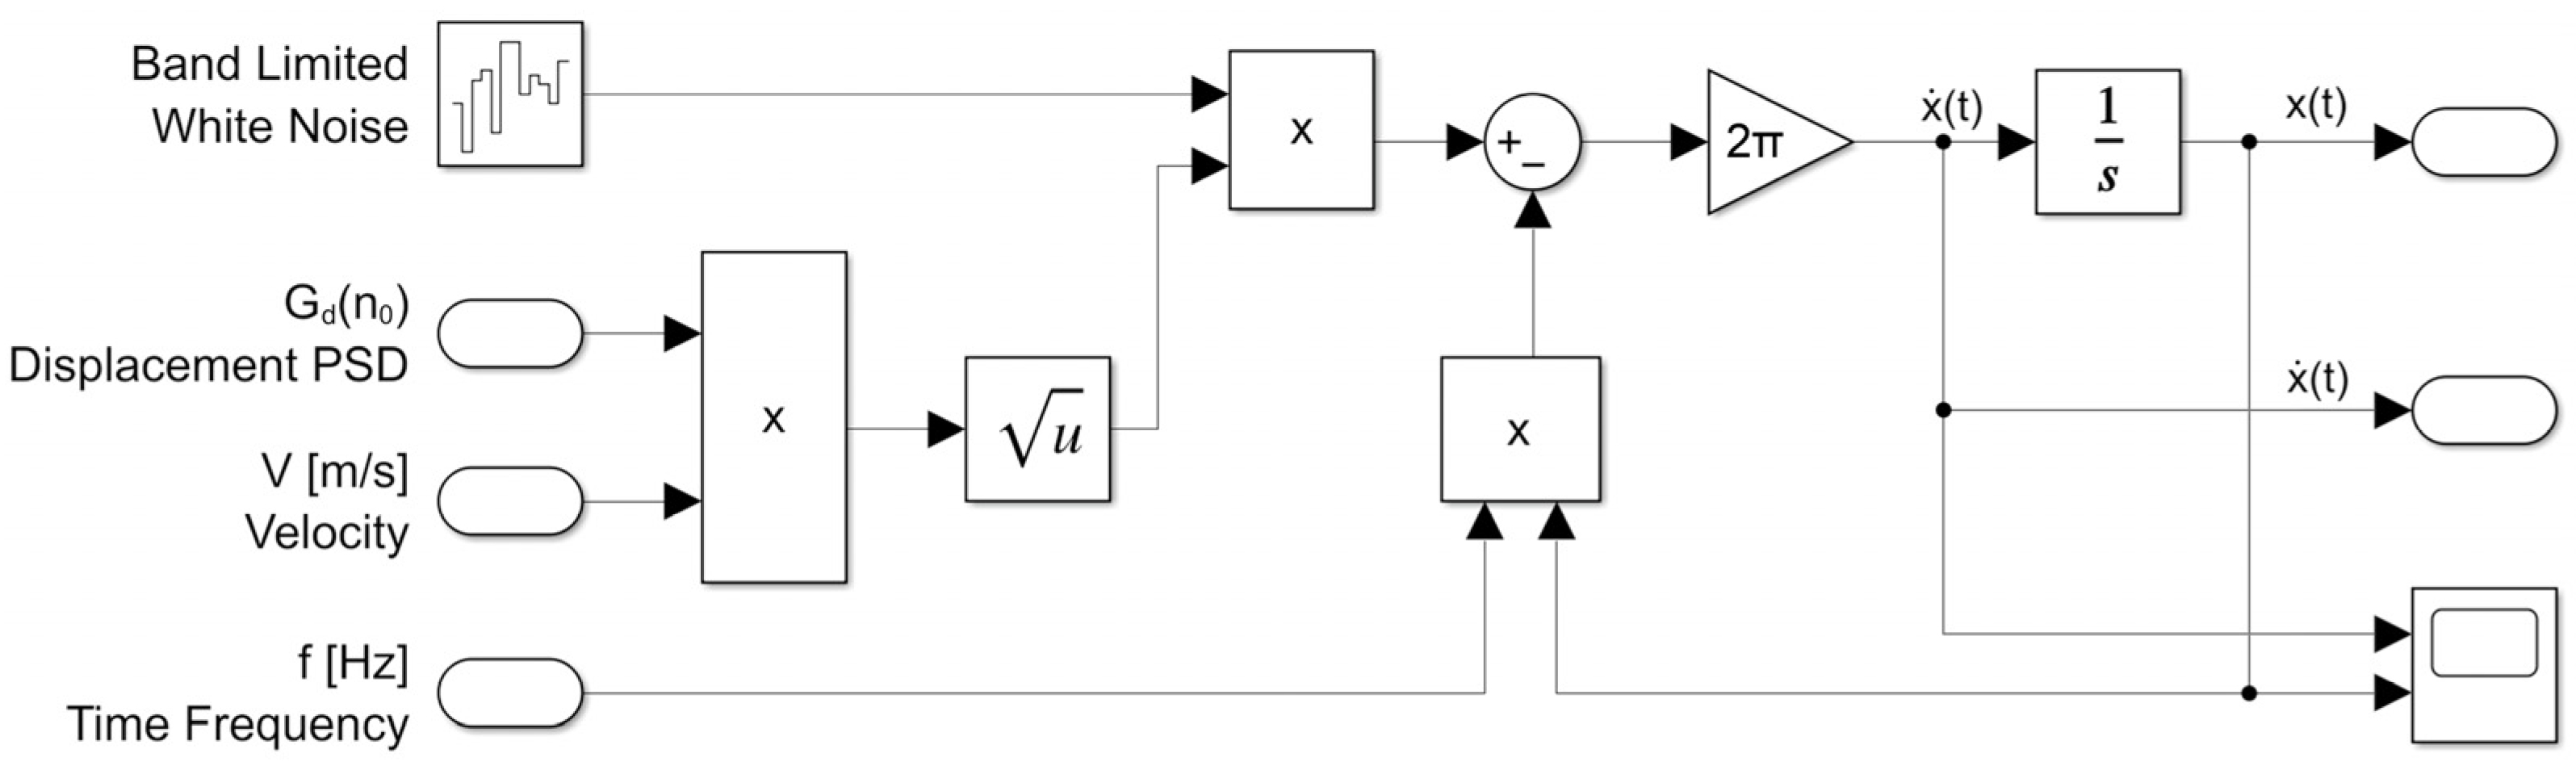
2.2. Modelling of Uneven Runway

The two frequently utilised methods to model the unevenness of airport runways are as follows: 1. the data of runway 28R of San Francisco Airport before resurfacing according to the Advisory Circular of FAA [32] and 2. establishing the stochastic runway surface excitation model with first-order filtering ban-limited white noise (BLWN). This study uses the second method and references ISO 8608:2016 (Mechanical vibration—Road surface profiles—Reporting of measured data) [33,34]. The fitting expression of power spectral density (PSD) of road surface can be written as follows:
x ˙ t = 2 π w t G d n 0 V f x t
where x(t) is the displacement of uneven runway excitation; f = 0.1 Hz is the time frequency; V = 120 km/h = 33.3 m/s is the average forward velocity while touching down; w(t) is the BLWN signal; and Gd(n0) = 64 × 10−6 m3 is the average value of displacement PSD for level B surface according to [34]. As shown in Figure 3, the MATLAB/Simulink model was built to obtain the uneven runway excitation x(t).
Figure 4 shows the simulation results in the form of displacement and velocity of the uneven runway excitation, which will be utilised as the inputs of Simulink model of the LSLG.

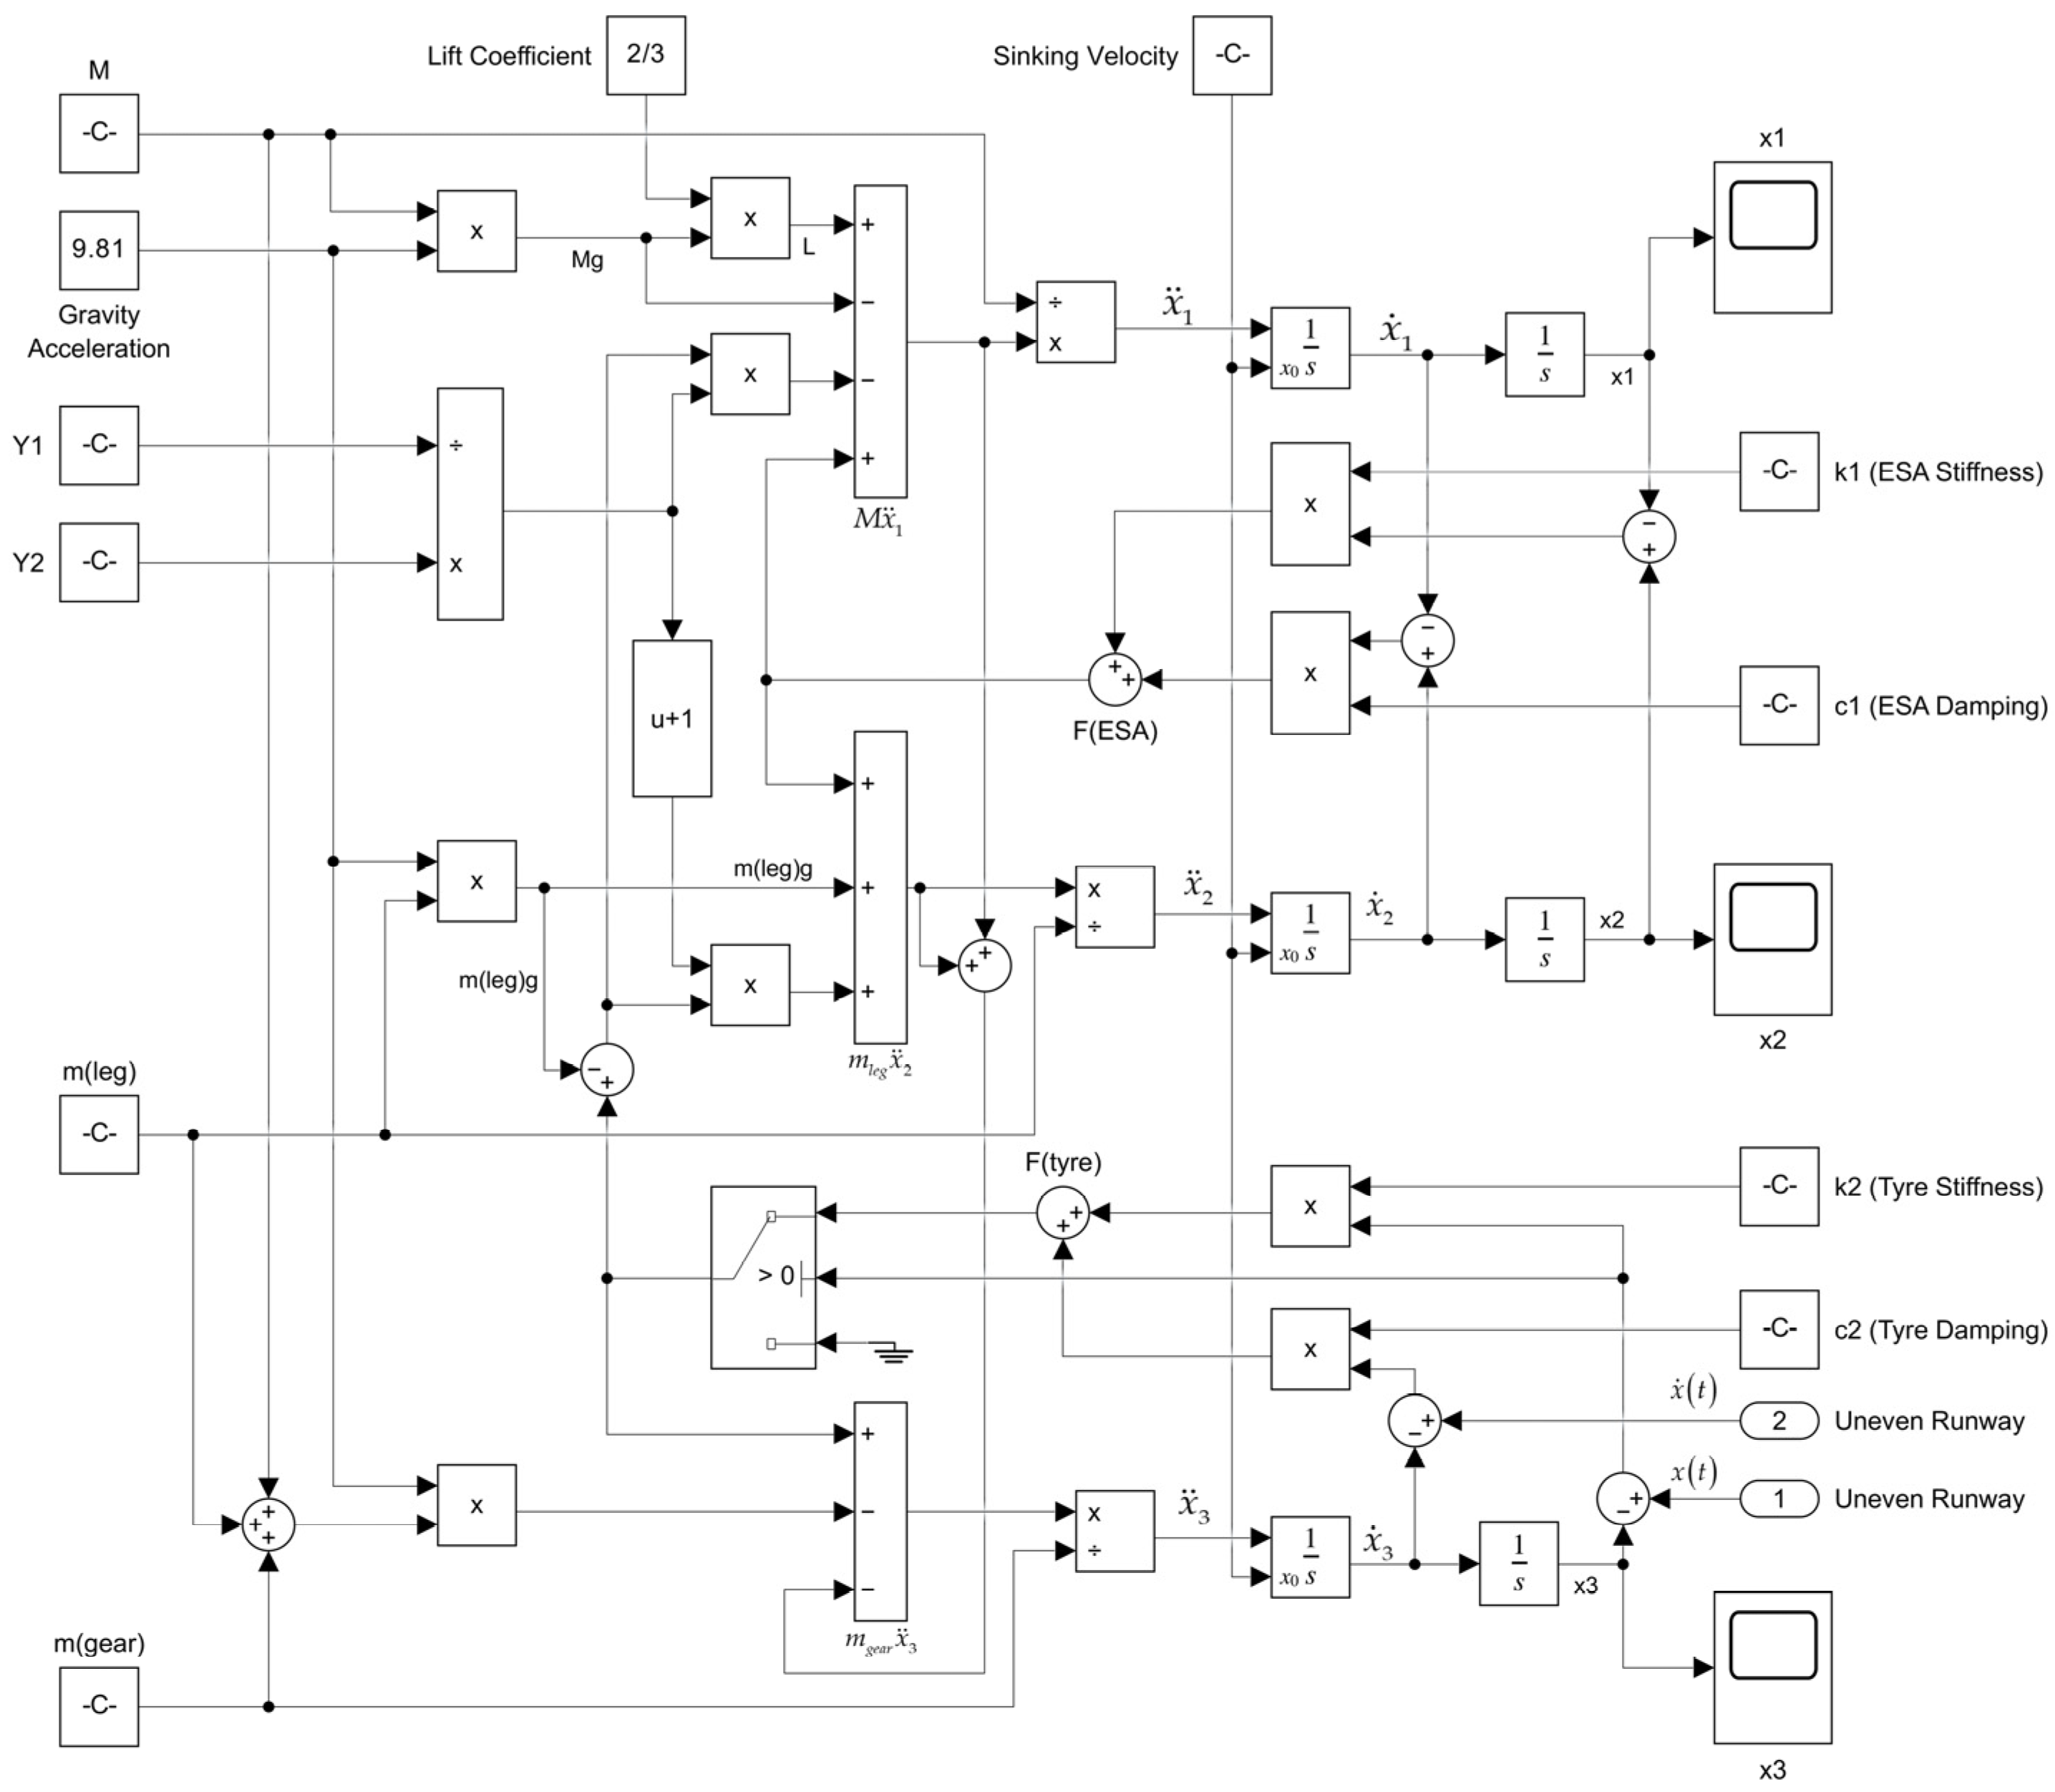
2.3. Simulink Model of LSLG

As shown in Figure 5, the Simulink model of LSLG according to the differential equations of motion (5) (6) (8) is established. The sinking velocity (Vsink) is defined as the vertical descent rate at touchdown, which is set as the initial velocity of the three masses in the Simulink model. According to CCAR §23.473(d) and FAR §23.473(d) [30,31], Vsink does not need to exceed 3.0 m/s in the modelling or test. At time 0 s, the displacements of all masses remain 0 mm, and the tyre is tangent to the ground without compression. The uneven runway excitation functions introduced in Section 2.2 are used as inputs to this model. The damping of ESA is temporarily assumed to be c1 = 618,000 N·s/m, which is tentative based on the method proposed by T. Rapp et al. [35]. Other inherent parameters in the model are shown in Table 1.

2.4. Results of Simulink Simulation

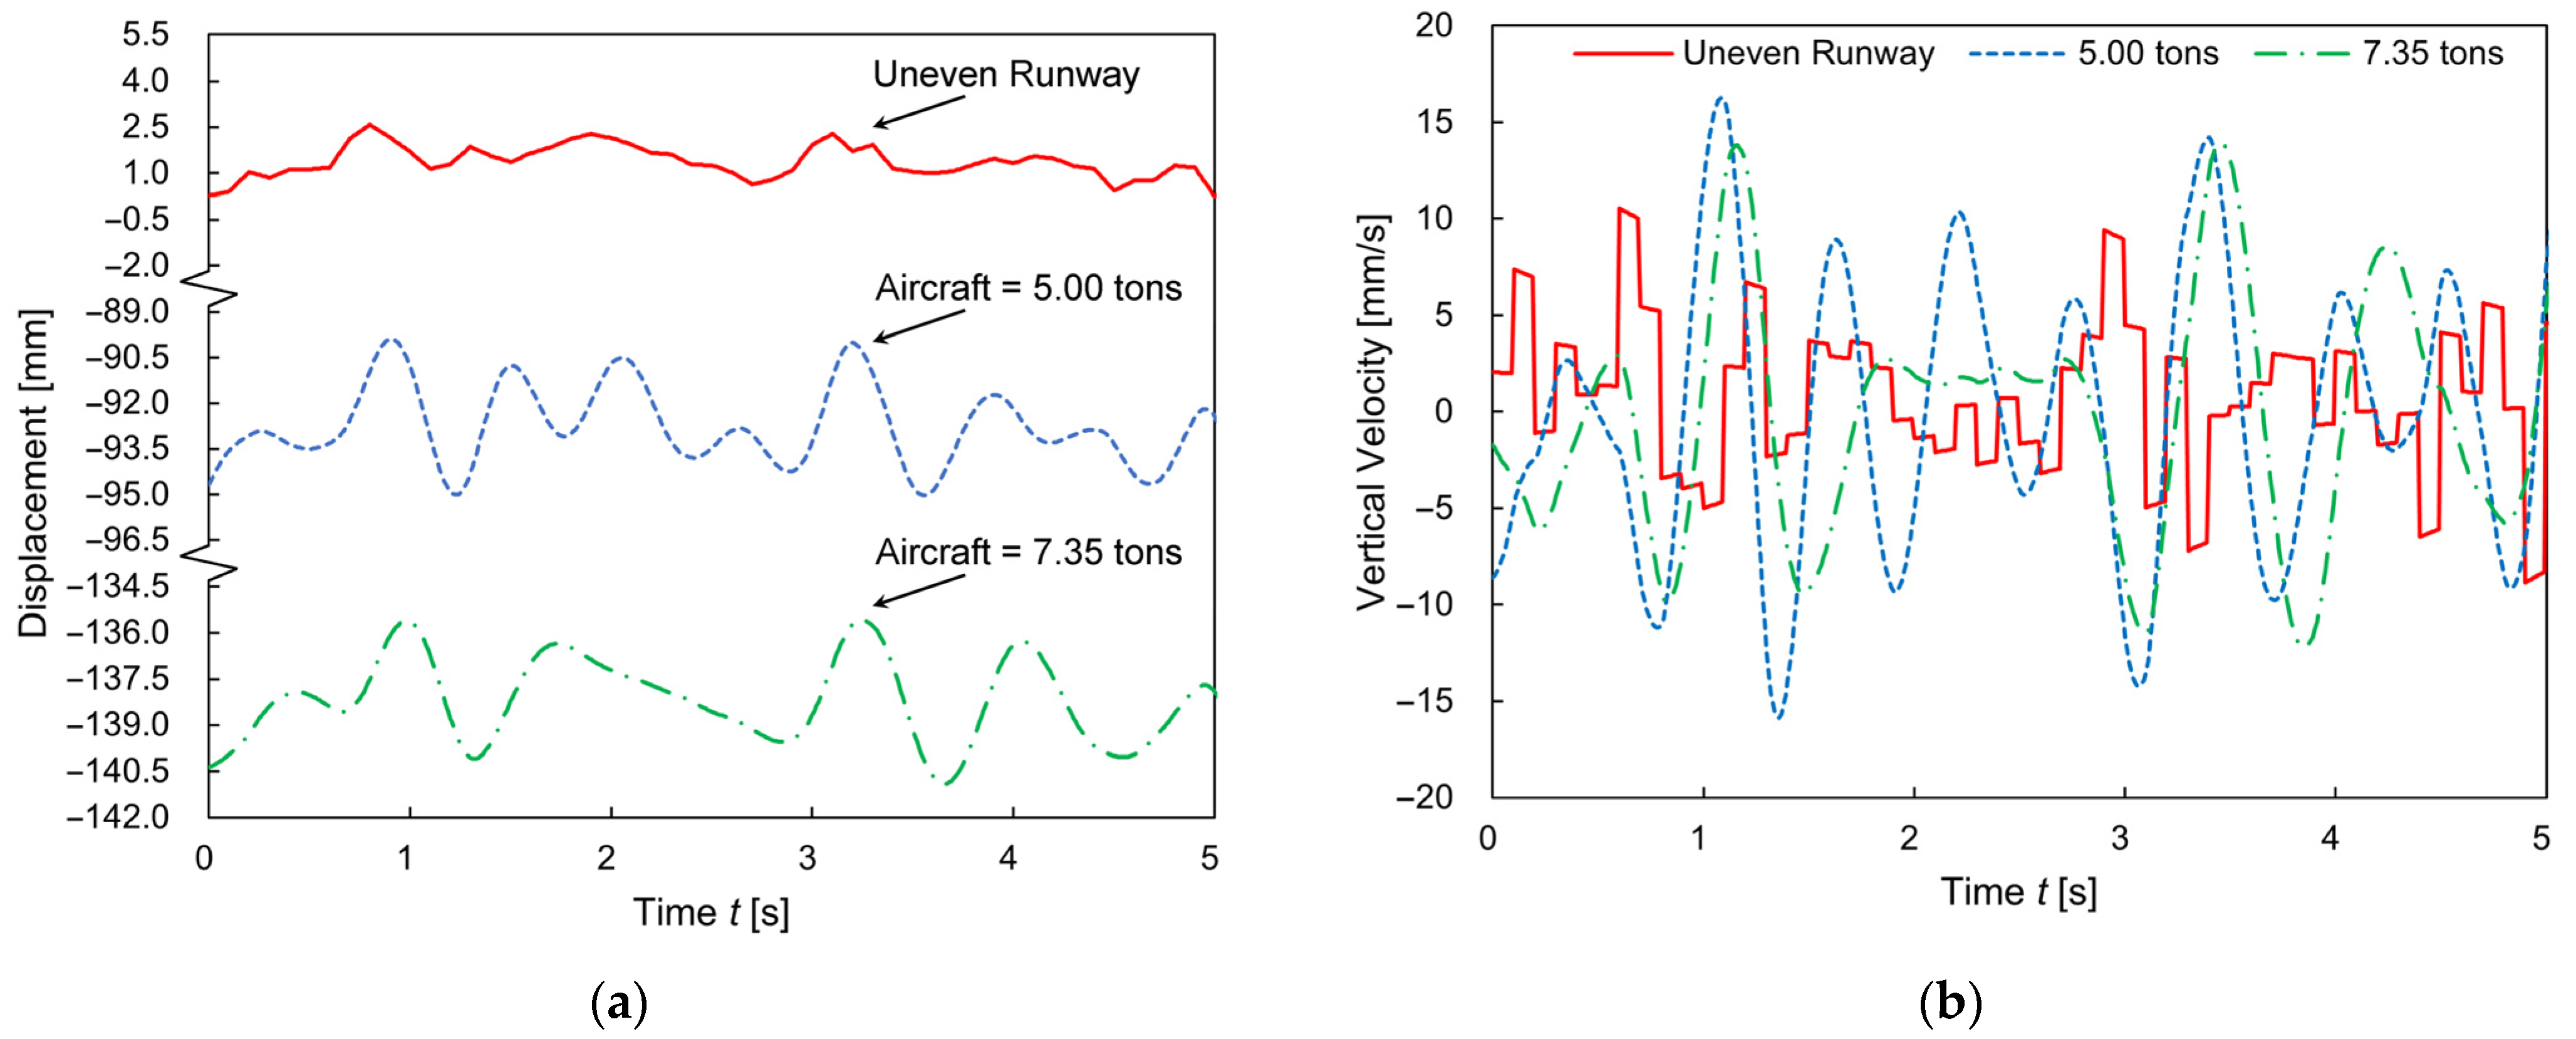
2.4.1. Taxiing at High Velocity

Initially, the dynamic of the aircraft taxiing phase without vertical drop shock is analysed. The initial Vsink is set to 0 m/s. Through dynamics simulation conducted in Simulink, the time-history curves of vertical displacement and velocity of the counterweight are obtained (Figure 6). The proportions of displacement ordinates in Figure 6a are consistent for ease of comparison. The curve amplitudes of displacement and velocity increase to about 5 mm and 32 mm/s, respectively, meaning that the shock absorption system of LSLG cannot suppress the amplitude as efficiently as the oleo-pneumatic shock absorber (OPSA) and the semi-active control shock absorber. However, the sudden changes of displacement and speed from the uneven runway are isolated, improving the comfort for the payloads or passengers. These results indicate that the Simulink model of the LSLG on the uneven runway is effective, and the landing process can be further considered.

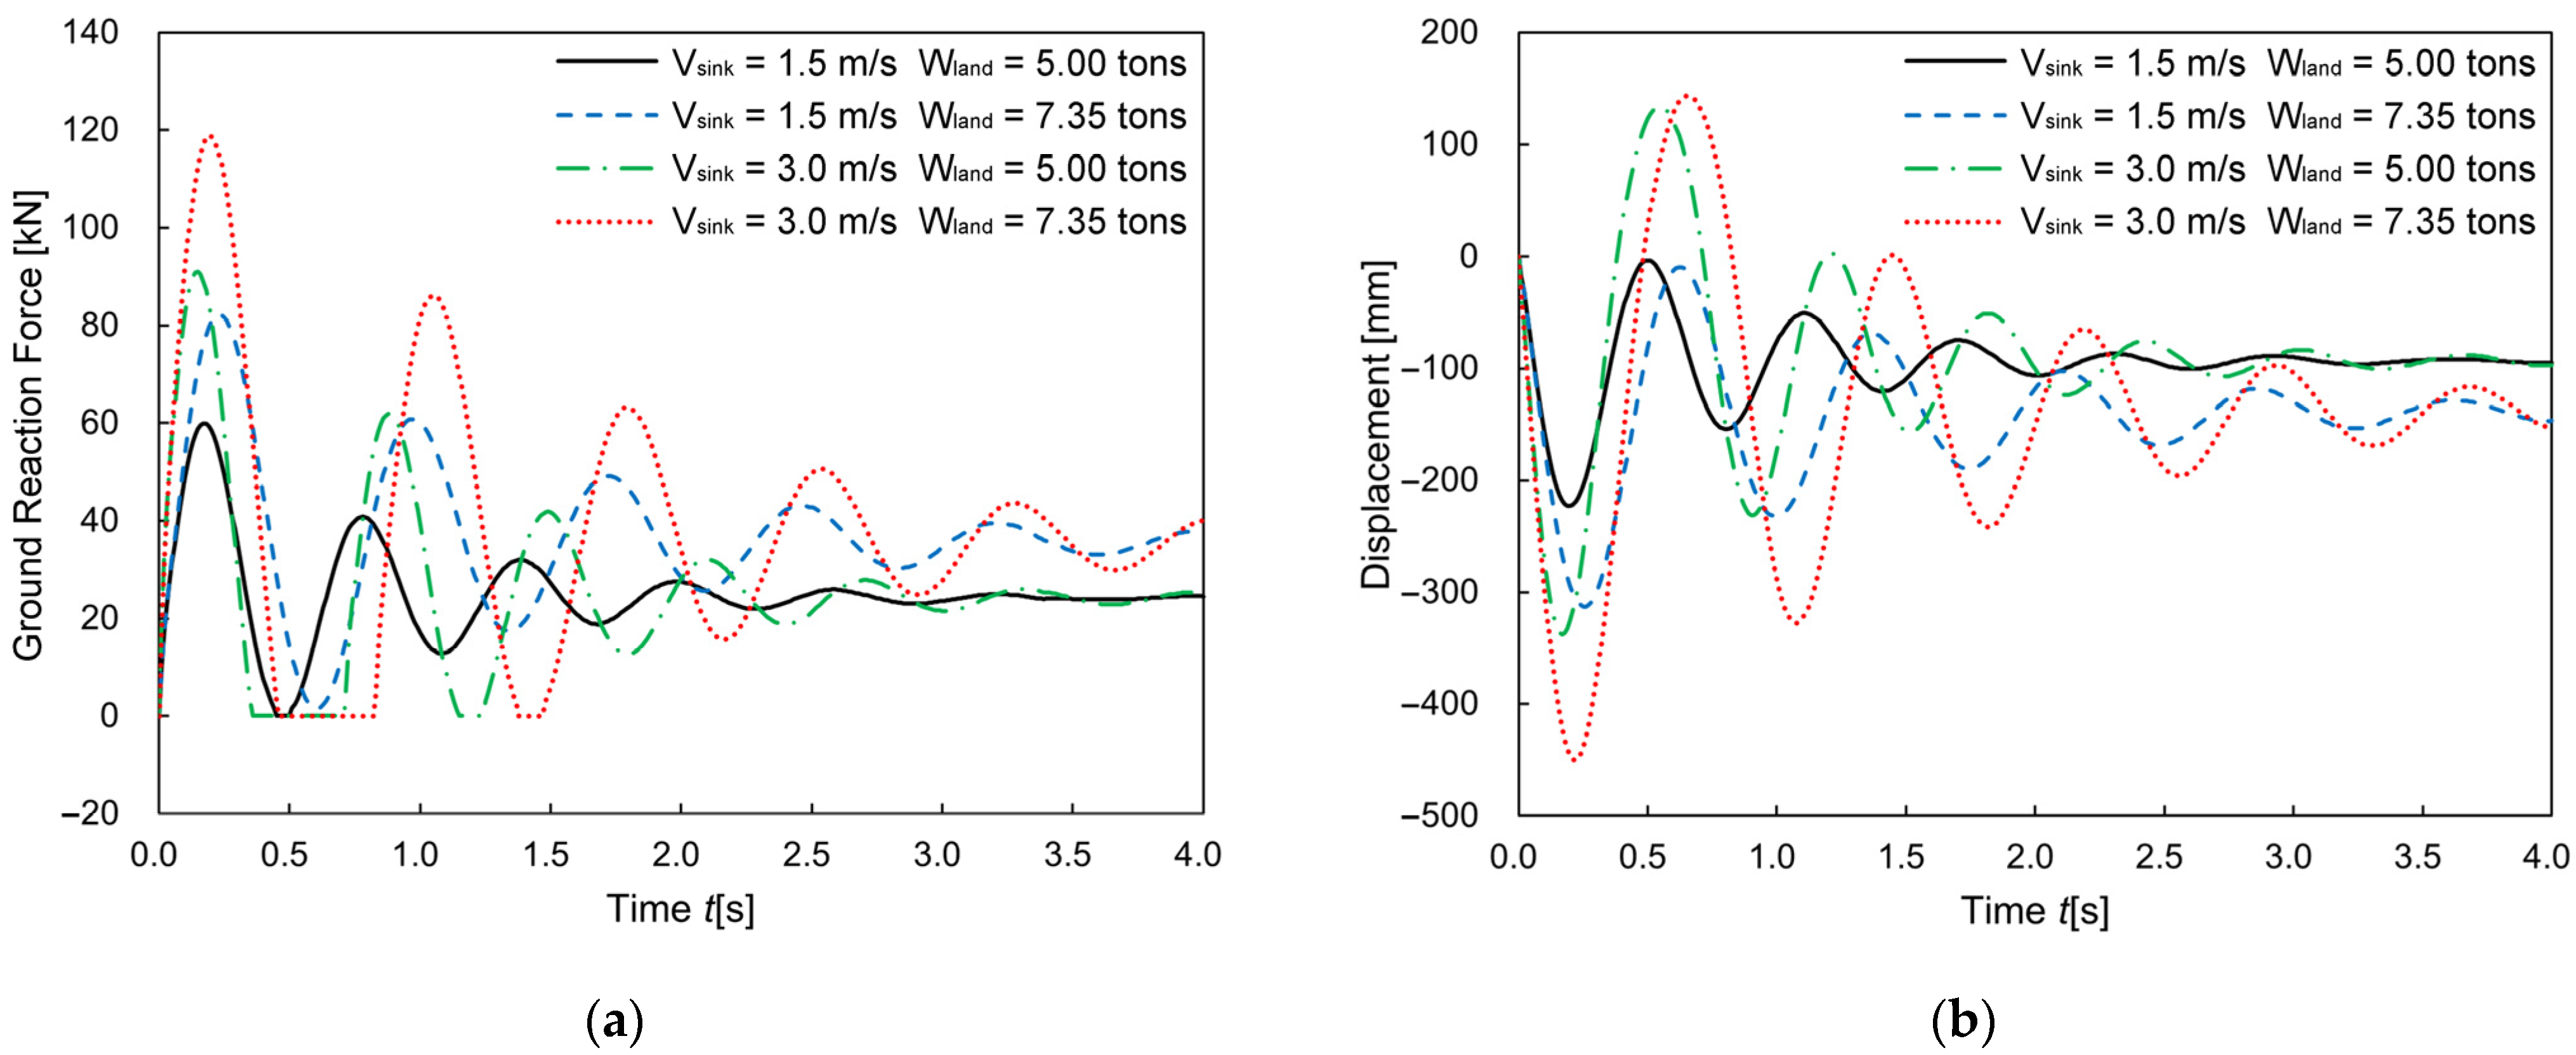
2.4.2. Landing Process

For different values of final vertical landing velocity (Vsink) and different landing weight (Wland), the time-history curves of vertical ground reaction force (Fground) and counterweight displacement are obtained (Figure 7). With the maximum Wland and the maximum Vsink, the Fground reaches a peak of 120 kN at about 0.2 s. The value of Fground is never less than zero, and the zero value indicates that the bounce has occurred. In this study, Vsink for normal landing will not exceed 1.5 m/s, and the bounce occurs if this value is exceeded. The peak amplitudes of Fground demonstrate a strong correlation with Vsink while remaining independent of Wland.
The above models and analysis provide the referenced critical shock forces for the LSLG design. Bounce height during landing primarily depends on the sinking velocity (Vsink) but remains independent of aircraft landing weight (Wland). The smooth response curves indicate that runway unevenness has minimal impact on landing shock characteristics.

3. Multibody Dynamics Simulation of Landing Process

Most of the landing gear, including lever-spring landing gear (LSLG), are classic multibody systems composed of rigid components and flexible components; hence, the multibody dynamics simulation (MBDS) is suitable for investigation of transient shock and buffering behaviours of landing gear. In this research, the CATIA P3 V5 R21 software was employed for structural modelling. The Ansys LS-DYNA 2022 R1, a powerful MBDS software, was conducted for the landing gear drop simulation.

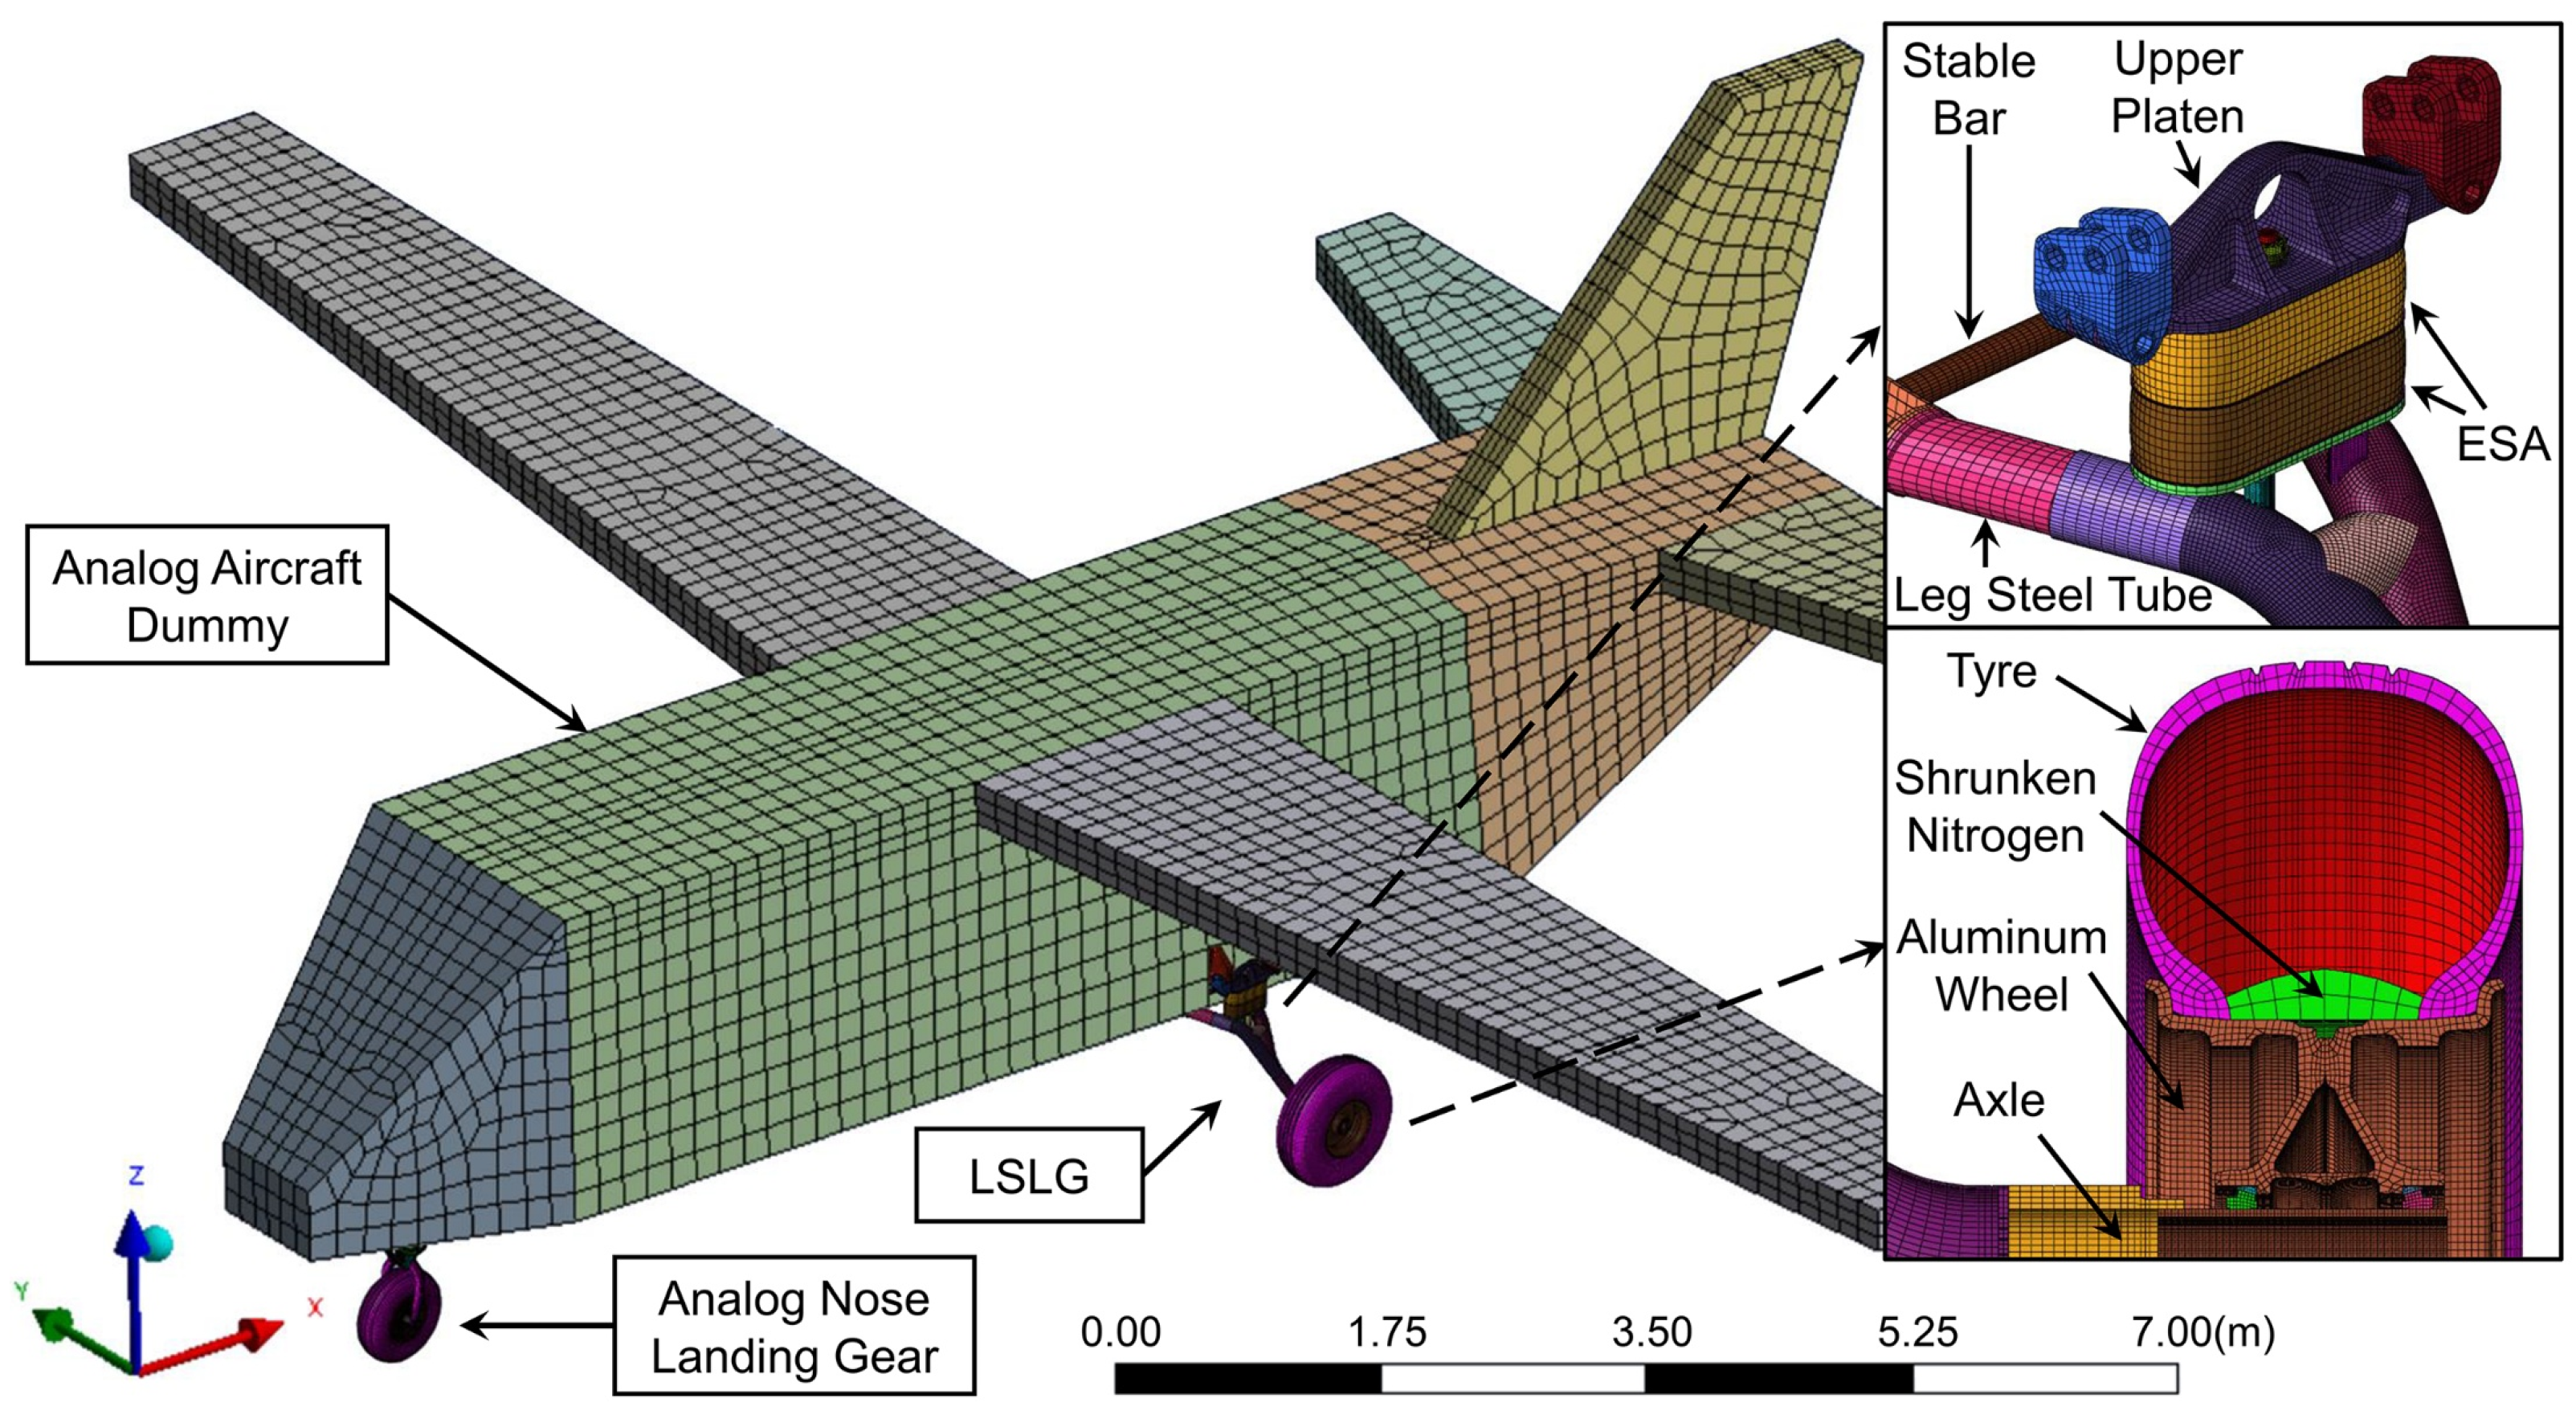
3.1. Structural Modelling and Meshing

An overall structure model of the aircraft including simplified fuselage, simplified planes and landing gears (both the simplified nose landing gear and LSLG as the main landing gear) was created. This was to obtain a vertical ground reaction force (Fground) that is closer to the real situation, which is also one of the novelties. As shown in Figure 8, aircraft components other than the landing gear system were represented by shell elements. The local meshing of the LSLG and tyre basically utilised the hexahedral elements with average sizes of 8 mm. The tyre was set to be just in contact with the ground without compression. The contact between the tyre and the rigid ground was established with a friction coefficient of 0.8 according to the requirements of CCAR §23.511(a) and FAR §23.511(a) [30,31], while the remaining components had contact with each other using double-sided or binding methods.

3.2. Calibration of Elastic Components
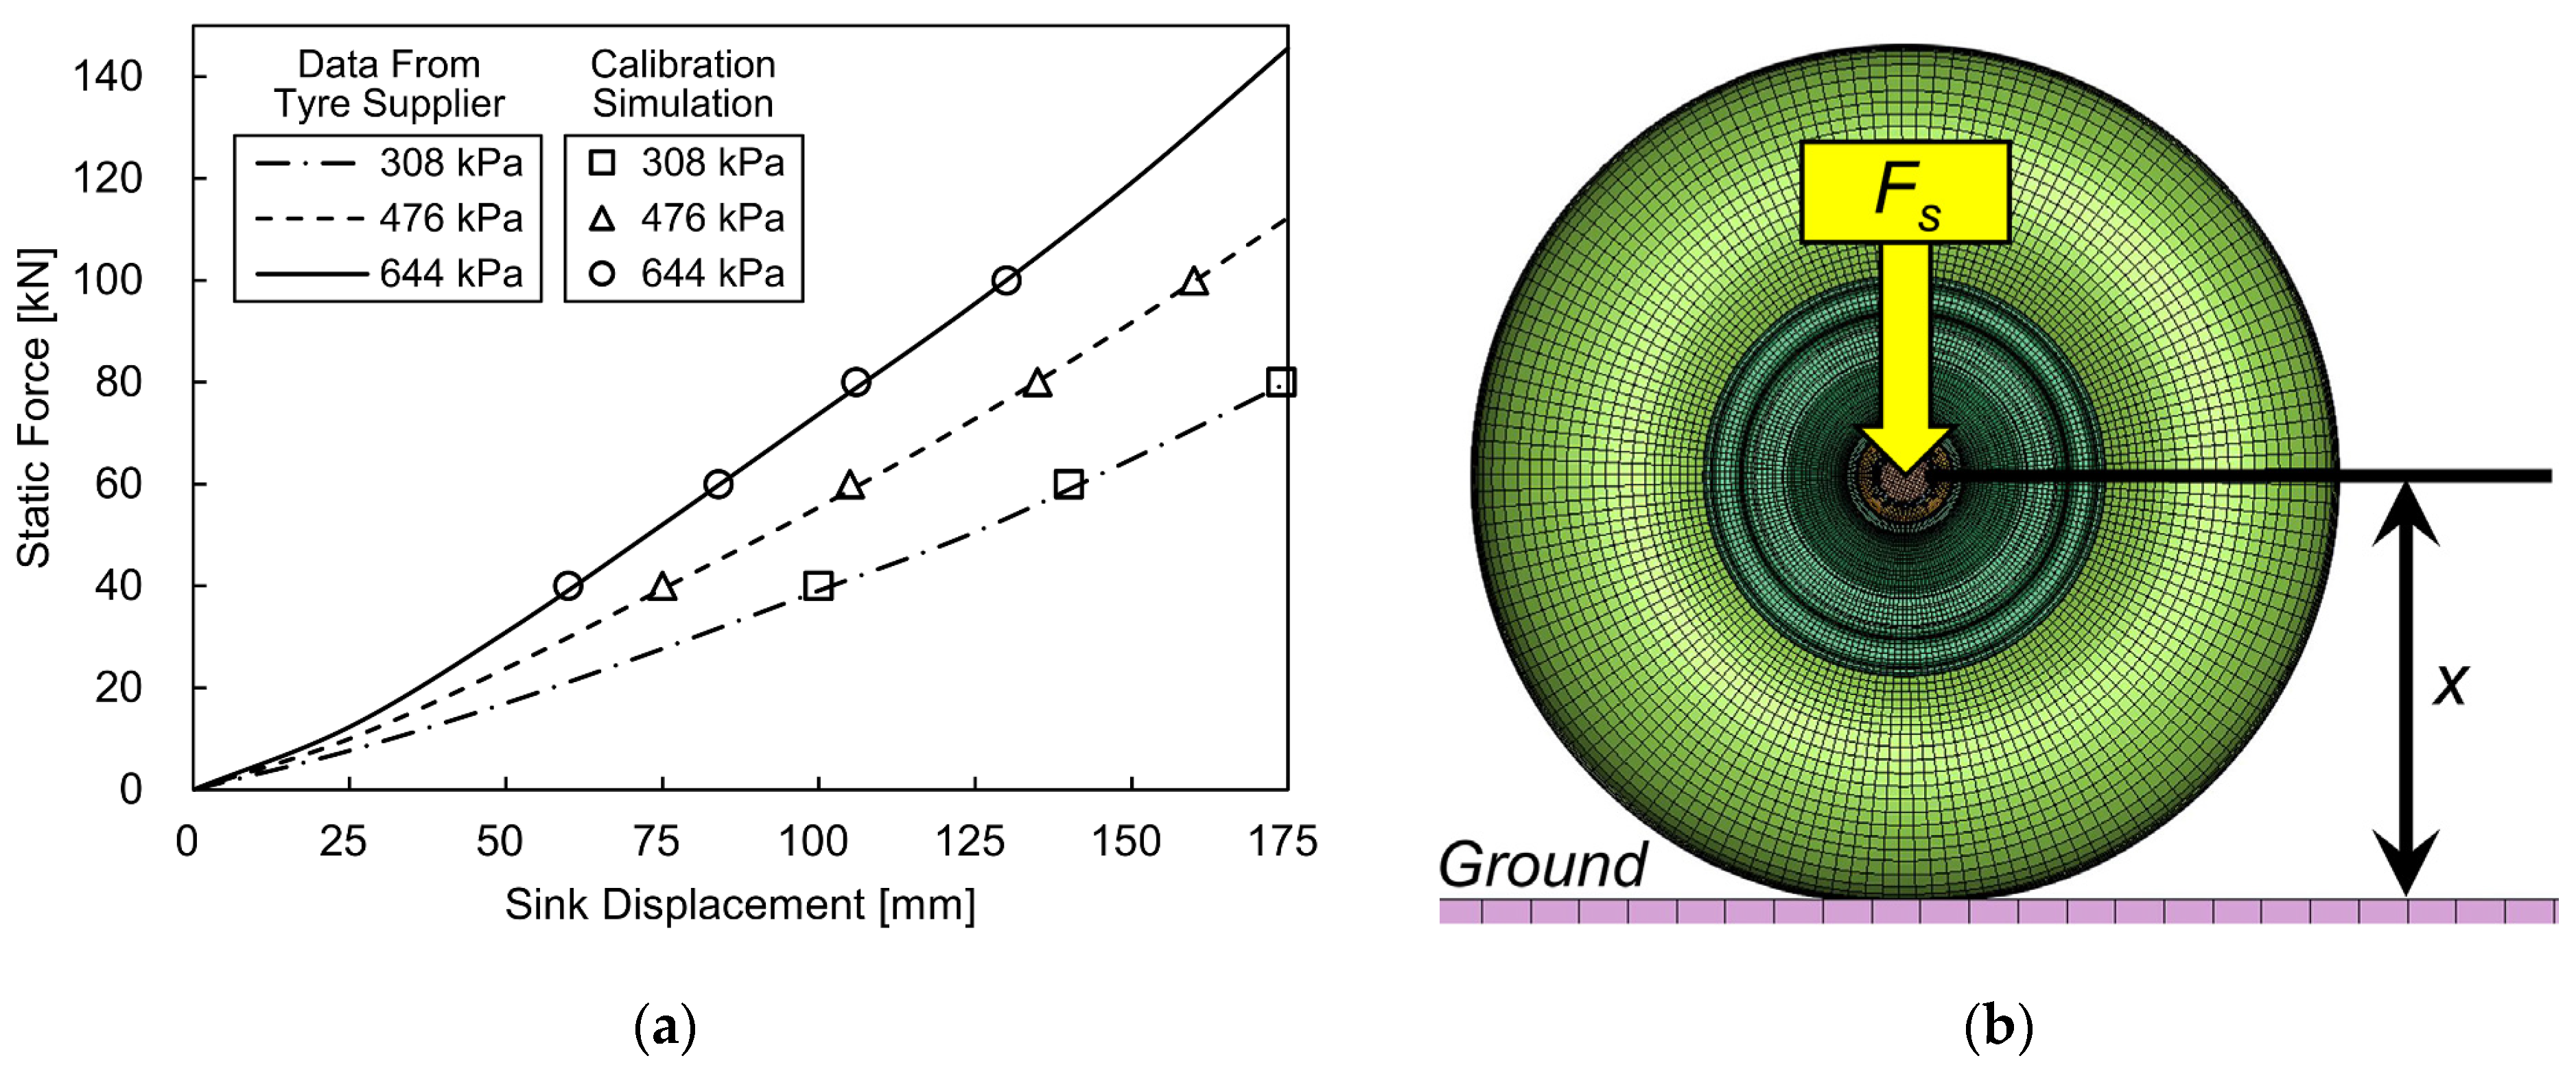
Both ESAs and tyres are made of elastic materials, whose mechanical performances are affected by temperature and strain rate. According to Justyna et al. [36], the storage modulus of elastic materials changes by less than 15% in the normal temperature range (−20 °C to 60 °C) that the objective aircraft of this study will operate in. The study in Section 2.4.2 shows that the ESA reaches its first peak compressive strain value (designed maximum: 50%) in about 0.2 s, which means that its strain rate is below 2.5 s−1. In the medium strain rate range (10−2 to 102 s−1), the ratio of stress relaxation time to loading time is less than 0.1, and the viscoelastic hysteresis effect can be ignored. Therefore, in this paper, the influences of temperature and strain rate on tyre and ESA performance parameters were reasonably ignored. The simulation model was further calibrated as follows.

3.2.1. Tyre

A tubeless aircraft tyre with a diameter of 890 mm and a width of 300 mm was installed on the LSLG, which were supplied by Lanyu Aviation Tyre Company (Guilin, China). In the MBDS, the tyre was made of an isotropic rubber material described with the Mooney–Rivlin two-parameter hyperelastic model [37]:
W = C 10 I 1 3 + C 01 I 2 3 + 1 D 1 J 1 2
where W is the strain energy; I1 and I2 are the tensile tensor invariants; J is the volume ratio; C10 and C01 are the material constants; and D1 is the coefficient representing the material’s resistance to compression.
In the modelling of the tyre, a shrunken rotary volume (Vs) representing the nitrogen (N2) was created, which was much smaller than the initial space inside the tyre (Vt). For ideal gas, the state equation relating the pressure to the internal specific energy is as follows [38]:
P = γ - 1 ρ e
where P is the gas pressure, γ is the adiabatic index of gas, ρ is the gas density, and e is the internal specific energy of gas. Since γ and e are constants, the ratio of tyre pressure (Pt) to atmosphere pressure (Pa) equals the ratio of the density of N2 in the tyre (ρt) to the density of N2 under atmosphere pressure (ρa):
P t P a = ρ t ρ a
The designed rated tyre pressure of main landing gear is Pt = 450 kPa. Since Pa = 101.325 kPa and ρa = 1.25 kg/m3, the ρt = 5.55 kg/m3 can be easily figured out through Equation (12).
In the simulation model, the product of the set value for the density of N2 (ρs) and the shrunken volume (Vs) is equal to the product of the desired value for the density of N2 (ρt) and the initial volume (Vt), because of the law of mass conservation:
ρ s V s = ρ t V t
In this way, we can easily adjust the tyre pressure (Pt) by setting the density of the shrunken volume of N2 (ρs). The contact between the shrunken volume for N2 and the inwall of the inner space of tyre was built. When the simulation commenced, the shrunken N2 filled the space inside the tyre immediately, establishing a real tyre pressure environment.
The curves in Figure 9a represent the relationship between the static force and the sink displacement of the tyre under three different inflation pressures, of which the data were obtained by the tyre supplier through experiments. Static structural analysis was conducted in Ansys to calibrate and validate the tyre model in simulations. As shown in Figure 9b, static forces (Fs) of 40, 60, 80, and 100 kN were applied to the axle of the gear FEA model with the same tyre pressures provided by the tyre supplier. The resulting sinking displacements (Δx) corresponding to different Fs values were then recorded and labelled with hollow points in Figure 9a. By minorly adjusting the parameters in the Mooney–Rivlin two-parameter model that describe the material property of tyre, the hollow points basically coincide with the experimental curves from the tyre supplier, meaning that the tyre model was properly settled. The parameters used in the Mooney–Rivlin 2 model are listed in Table 2 of Section 3.3.

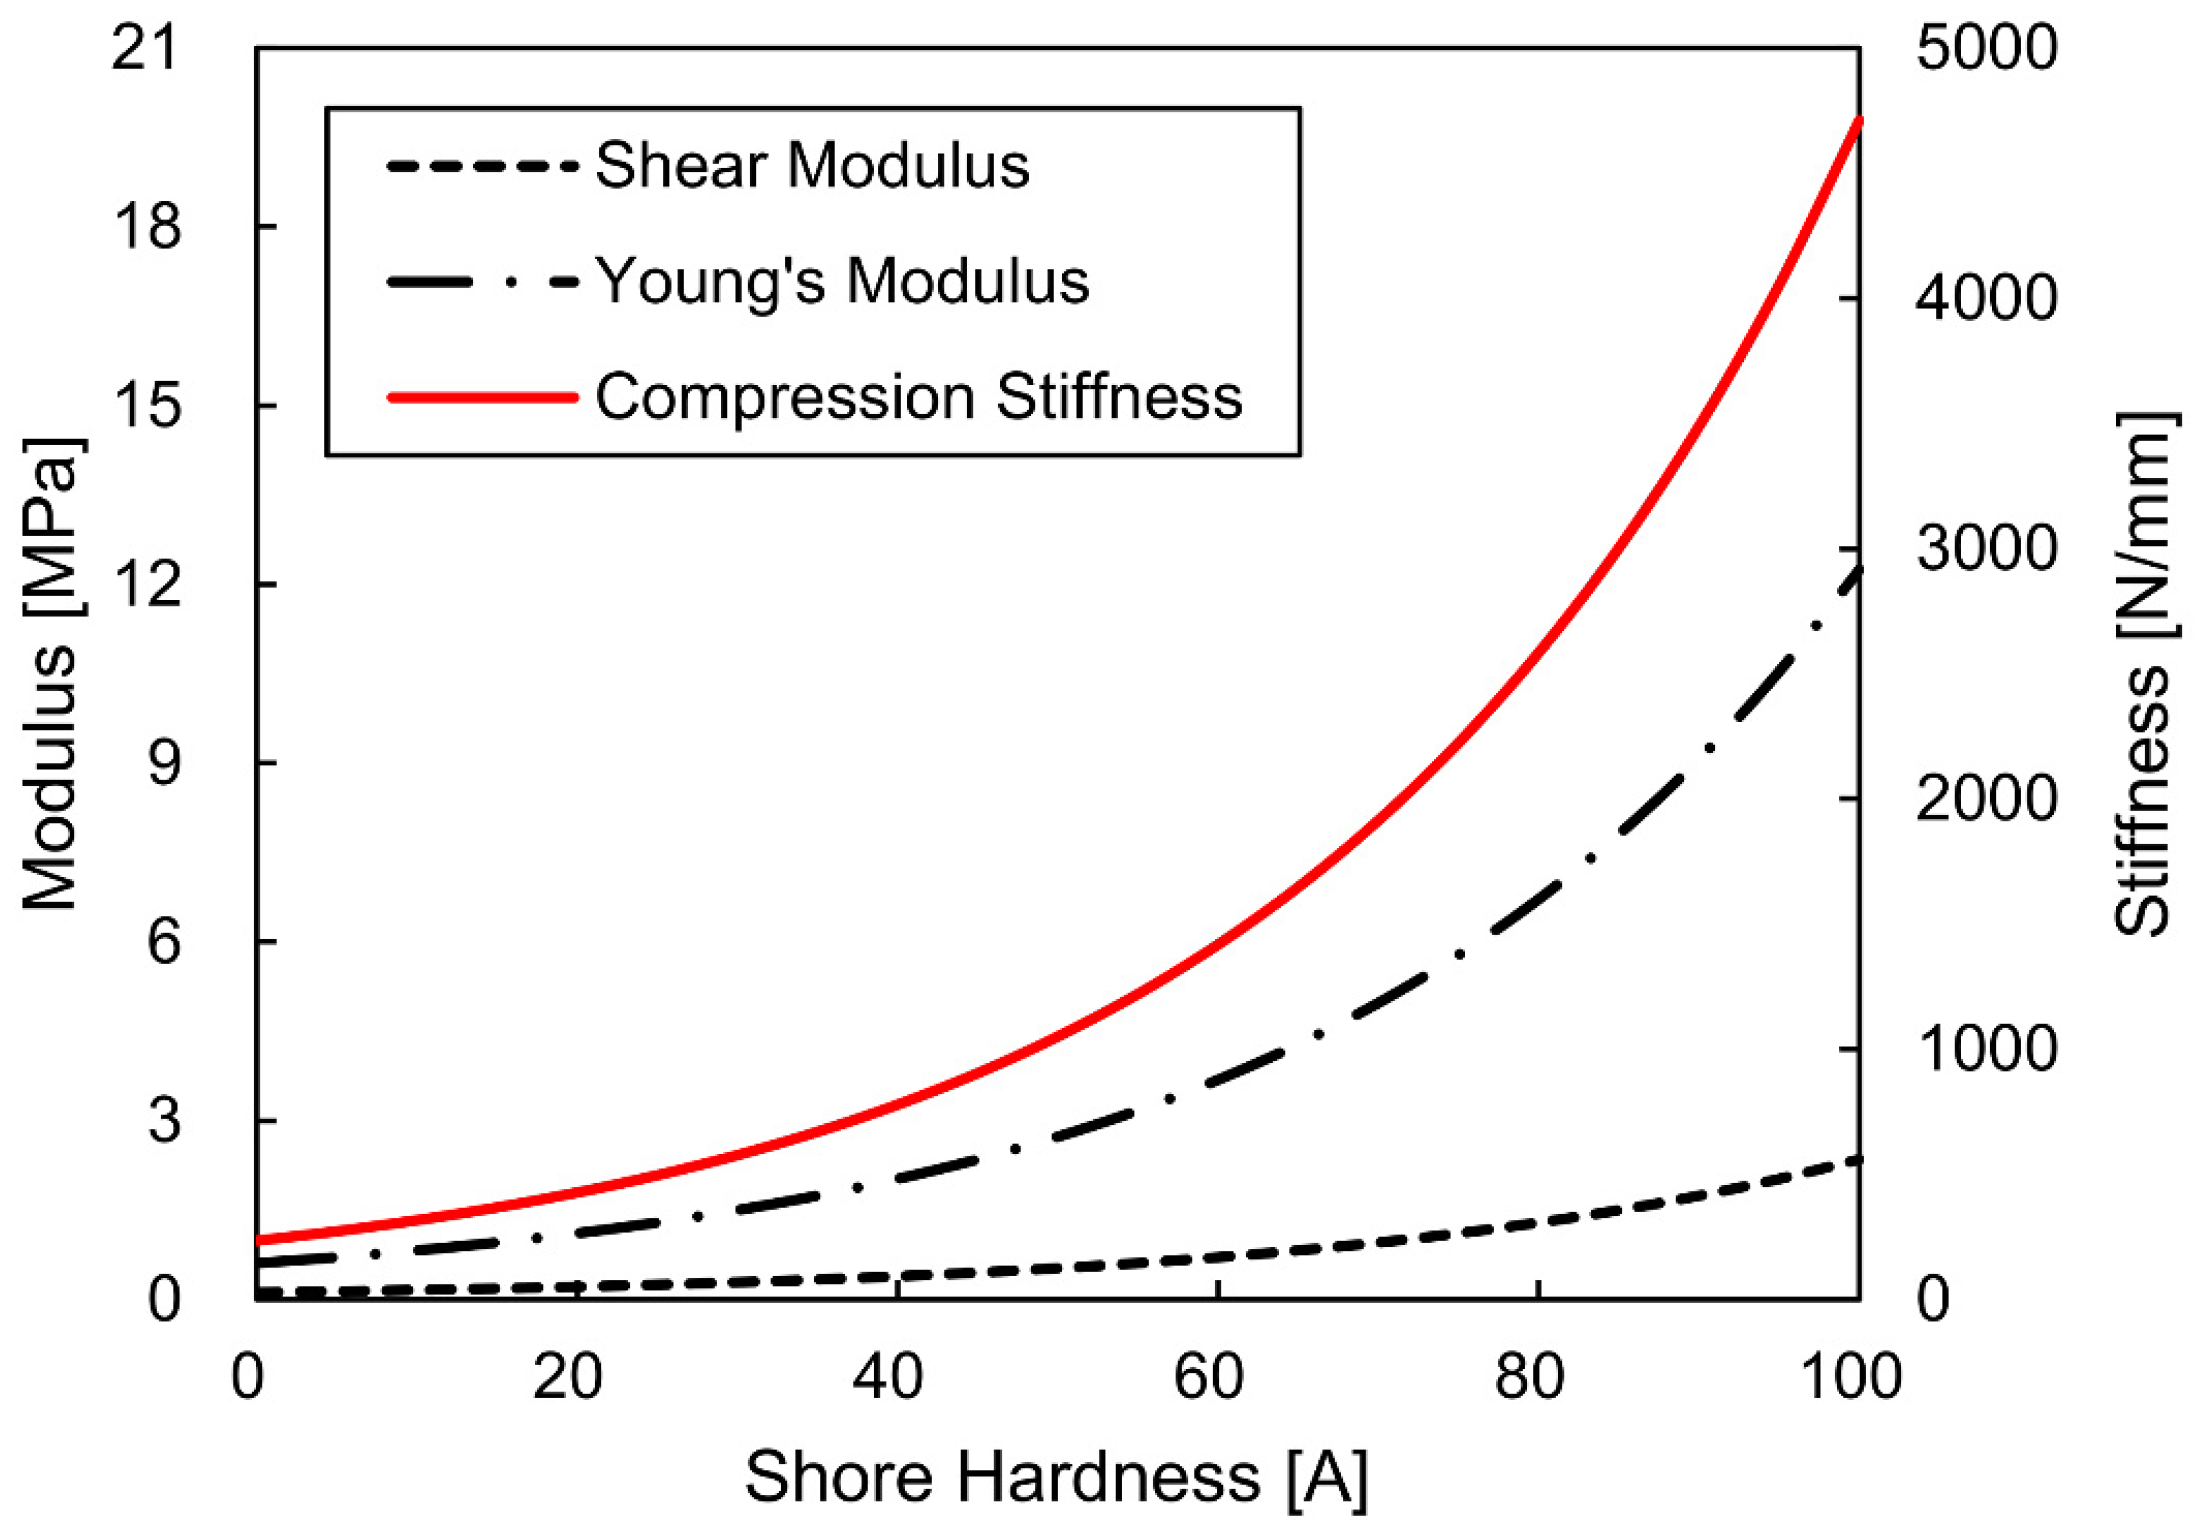
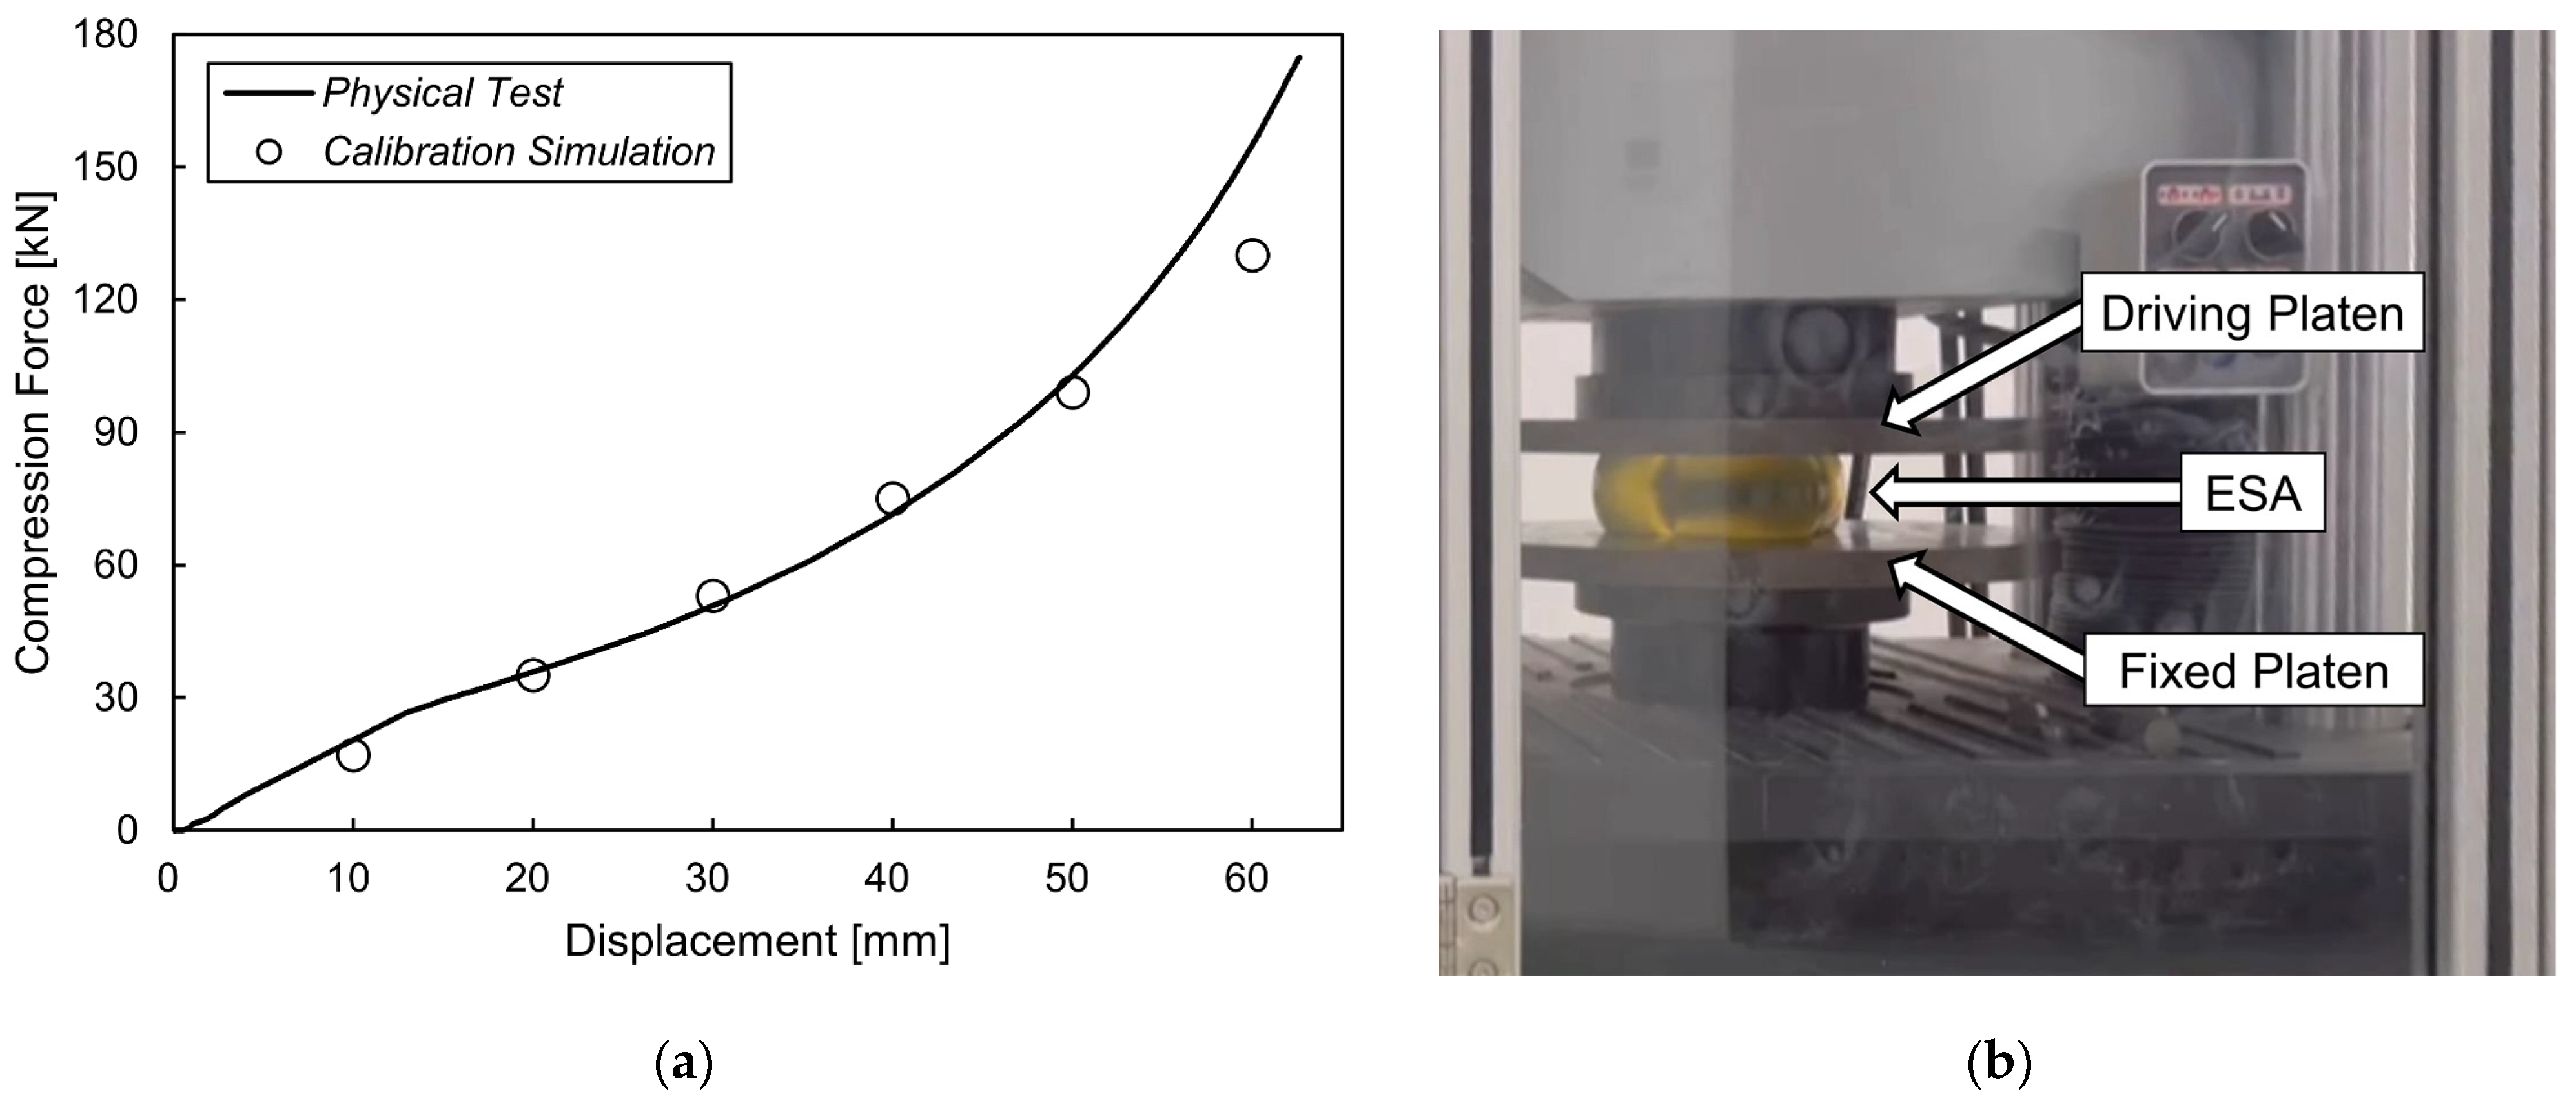
3.2.2. Elastomer Shock Absorber

An elastomer shock absorber (ESA) made of polyurethane plays an important role in the shock absorption of LSLG. At the microscopic level, the shear modulus (G) of polyurethane mainly depends on the hardness and does not change significantly with the categories. In the range of use, the relationship between shear modulus (G) and Shore hardness (HA) can be represented with the following empirical formula [39]:
G = 0.117 e 0.03 H A   M P a
Young’s modulus in the compression state (EC) of the elastomer working under compression mode is significantly affected with its shape and structure size. Generally, the relationship between EC and G of elastomer is as follows:
E C = i G
where i is the influence coefficient of the geometric shape, which can be obtained by the following equation in the case of a rectangular shape [39]:
i = 3.6 1 + 2.22 S 2
where S is the ratio of the bearing area to the free area of the rectangular elastomer, which can be obtained by the following:
S = a b 2 a + b h
where a, b and h are the length, width and height of rectangular elastomer, respectively. The compression stiffness (KC) of the rectangular elastomer spring can be calculated as follows:
K C = E C a b h
The cross section of the objective elastomer in this article is in “capsule shape” (Aerospace 12 00367 i001). Based on the principle of cross-section equivalent, a and b are equivalent to the following:
a = π n 4 + m b = n
where m and n are the length and width of the rectangular part of the capsule shape, respectively. In this article, m = 200 mm, n = 128 mm and h = 100 mm. Substituting m, n and h into Equations (16), (17) and (19), we can obtain a = 300.53 mm, b = 128 mm and i = 5.210.
Then, Young’s modulus (EC) and the compression stiffness (KC) can be written as follows:
E C = 0.6096 e 0.03 H A   M P a
K C = 234.5 e 0.03 H A   N / mm
Figure 10 shows G, EC and KC changing with the Shore hardness of the elastomer used for the ESA. Essentially, all three of the variables increase exponentially with the Shore hardness.
The Shore hardness of the elastomer used for the ESA is 65A, hence it is easy to obtain G = 0.822 MPa, EC = 4.284 MPa and KC = 1648 N/mm from Equations (14), (20) and (21), respectively. The above data and the density of polyurethane (ρESA) are utilised to create the FEA model of the ESA with isotropic elastic properties, and they are listed in Table 2 of Section 3.3.
The static structural analysis in Ansys was utilised for ESA calibration. The lower surface of the ESA was restrained, and the upper surface was applied with uniform static forces (q) in different levels of total compression force (FC). The displacement at certain compression forces was obtained and labelled with several hollow points in Figure 11a. As shown in Figure 11b, the physical ESA with a Shore hardness of 65A was manufactured and tested on the statics force test rig, of which the data were plotted with a continuous curve in Figure 11a as well.
By minorly adjusting the density of polyurethane (ρESA), the data of the calibration simulation is very well matched with those of the physical compression test in the working range of displacement (0~40 mm). Moreover, the curve shows a linear trend with a slope of about 1720 N/mm in this range, which is very close to the theoretical value of 1648 N/mm (error 4.2%). After displacement of 40 mm, the compression force change with displacement in the physical compression test increases a little faster than those in the simulation, because the simulated ESA was assumed to be a linear material with fixed moduli and without a compression reinforcement effect. Overall, the parameters settings of the ESA material are proven to be accurate and reliable and are introduced into the MBDS as material properties.

3.3. Summary of Parameters Setting

Table 2 shows the summary of the parameters setting in the MBDS. Thirty repetitions of landing simulation under different sinking velocities (Vsink) from 0.5 m/s to 3.0 m/s and different aircraft landing weights (Wland) from 5.0 tons to 7.35 tons were conducted. The initial angle of attack of the aircraft model was set to 5° for a normal landing, and thus the main landing gears would hit the ground first. The whole FEA model was put into a gravity acceleration field of 9.8 m/s2. By adjusting the material densities of the front part and back parts of the aircraft body, Wland and the position of the gravity centre (GC) were easily changed to the desired values.
Table 2. Summary of parameters settings in the MBDS.
CategoriesItemParameter/SelectRemarks
GravityGravity acceleration9.8 m/s2
Gravity centre0.8 m before MLG
1.5 m beyond ground
Aircraft weight5.0~7.35 tonsIncrease by 0.5 ton
Average meshing sizeAnalog aircraft dummy100 mmShell elements
LSLG8 mmHexahedral elements
Aircraft stateSinking velocity0.5~3.0 m/sIncrease by 0.5 m/s
Initial angle of attack5 degrees
Tyre
(Mooney–Rivlin 2)
Initial tyre pressure (Pt)450 kPaSee Section 3.2.1.
Shrunken N2 density (ρt)5.55 kg/m3
Material density (ρtyre)1060 kg/m3
Material constant C102.30 MPa
Material constant C010.58 MPa
Incompressibility D10 MPa−1
ESA
(Isotropic elasticity)
Shore hardness (HA)65 ASee Section 3.2.2.
Material density (ρESA)1230 kg/m3
Shear modulus (G)0.822 MPa
Young’s modulus (EC)4.284 MPa
Compression stiffness (KC)1648 N/mm
Metallic componentsLeg steel tube40CrNiMo (4340)Refer to [40,41]
for material properties
All bearingsGCr15 (E52100)
Fuselage connector35CrMoA (4135)
Fasteners, sleeves, mandril30CrMnSiA (4130)
Wheel rimAlMg1SiCu (AA6061)
Upper/Lower platensAlZn5.5MgCu (AA7075)
OtherFriction coefficient0.8Only between ground and tyre
The material properties of the elastic components, including tyres and ESAs, were settled according to Section 3.2 to achieve the real usage parameters of aircraft. Metallic components were adopted in an isotropic plastic model (Mat Piecewise Linear Plasticity). The absolute value error caused by the material compression strengthening coefficient was disregarded, as it did not significantly affect the simulation results.

3.4. Results of MBDS

3.4.1. Stress Generated on Structures

For the most severe landing condition with the desired maximum landing weight (WL = 7.35 tons) and the desired maximum sinking velocity (Vsink = 3.0 m/s), Figure 12 shows the stress generated on LSLG and its key components in partial views. As shown in Figure 12b, the maximum effective stress on the critical steel tube leg is 894.1 MPa, which is smaller than the yield stress of 40CrNiMo/4340 (over 1000 MPa) that is utilised to produce the leg. Stresses generated on other key components including the upper platen and the lower platen are also far smaller than the yield stress of their producing materials.
The maximum overload coefficient under this most severe condition is 3.10 g (illustrated in detail in Figure 13d), which is larger than the minimum designed value of 2.67 g that the structures should undertake as specified in CCAR §23.473(g) and FAR §23.473(g) [30,31]. In addition, at this stage, no excessive stress or plastic deformation occurs, proving that the transient shock caused by the most severe condition is considered safe. It also improves the possibility of one-time success of the physical manufacturing and landing gear test in the following.

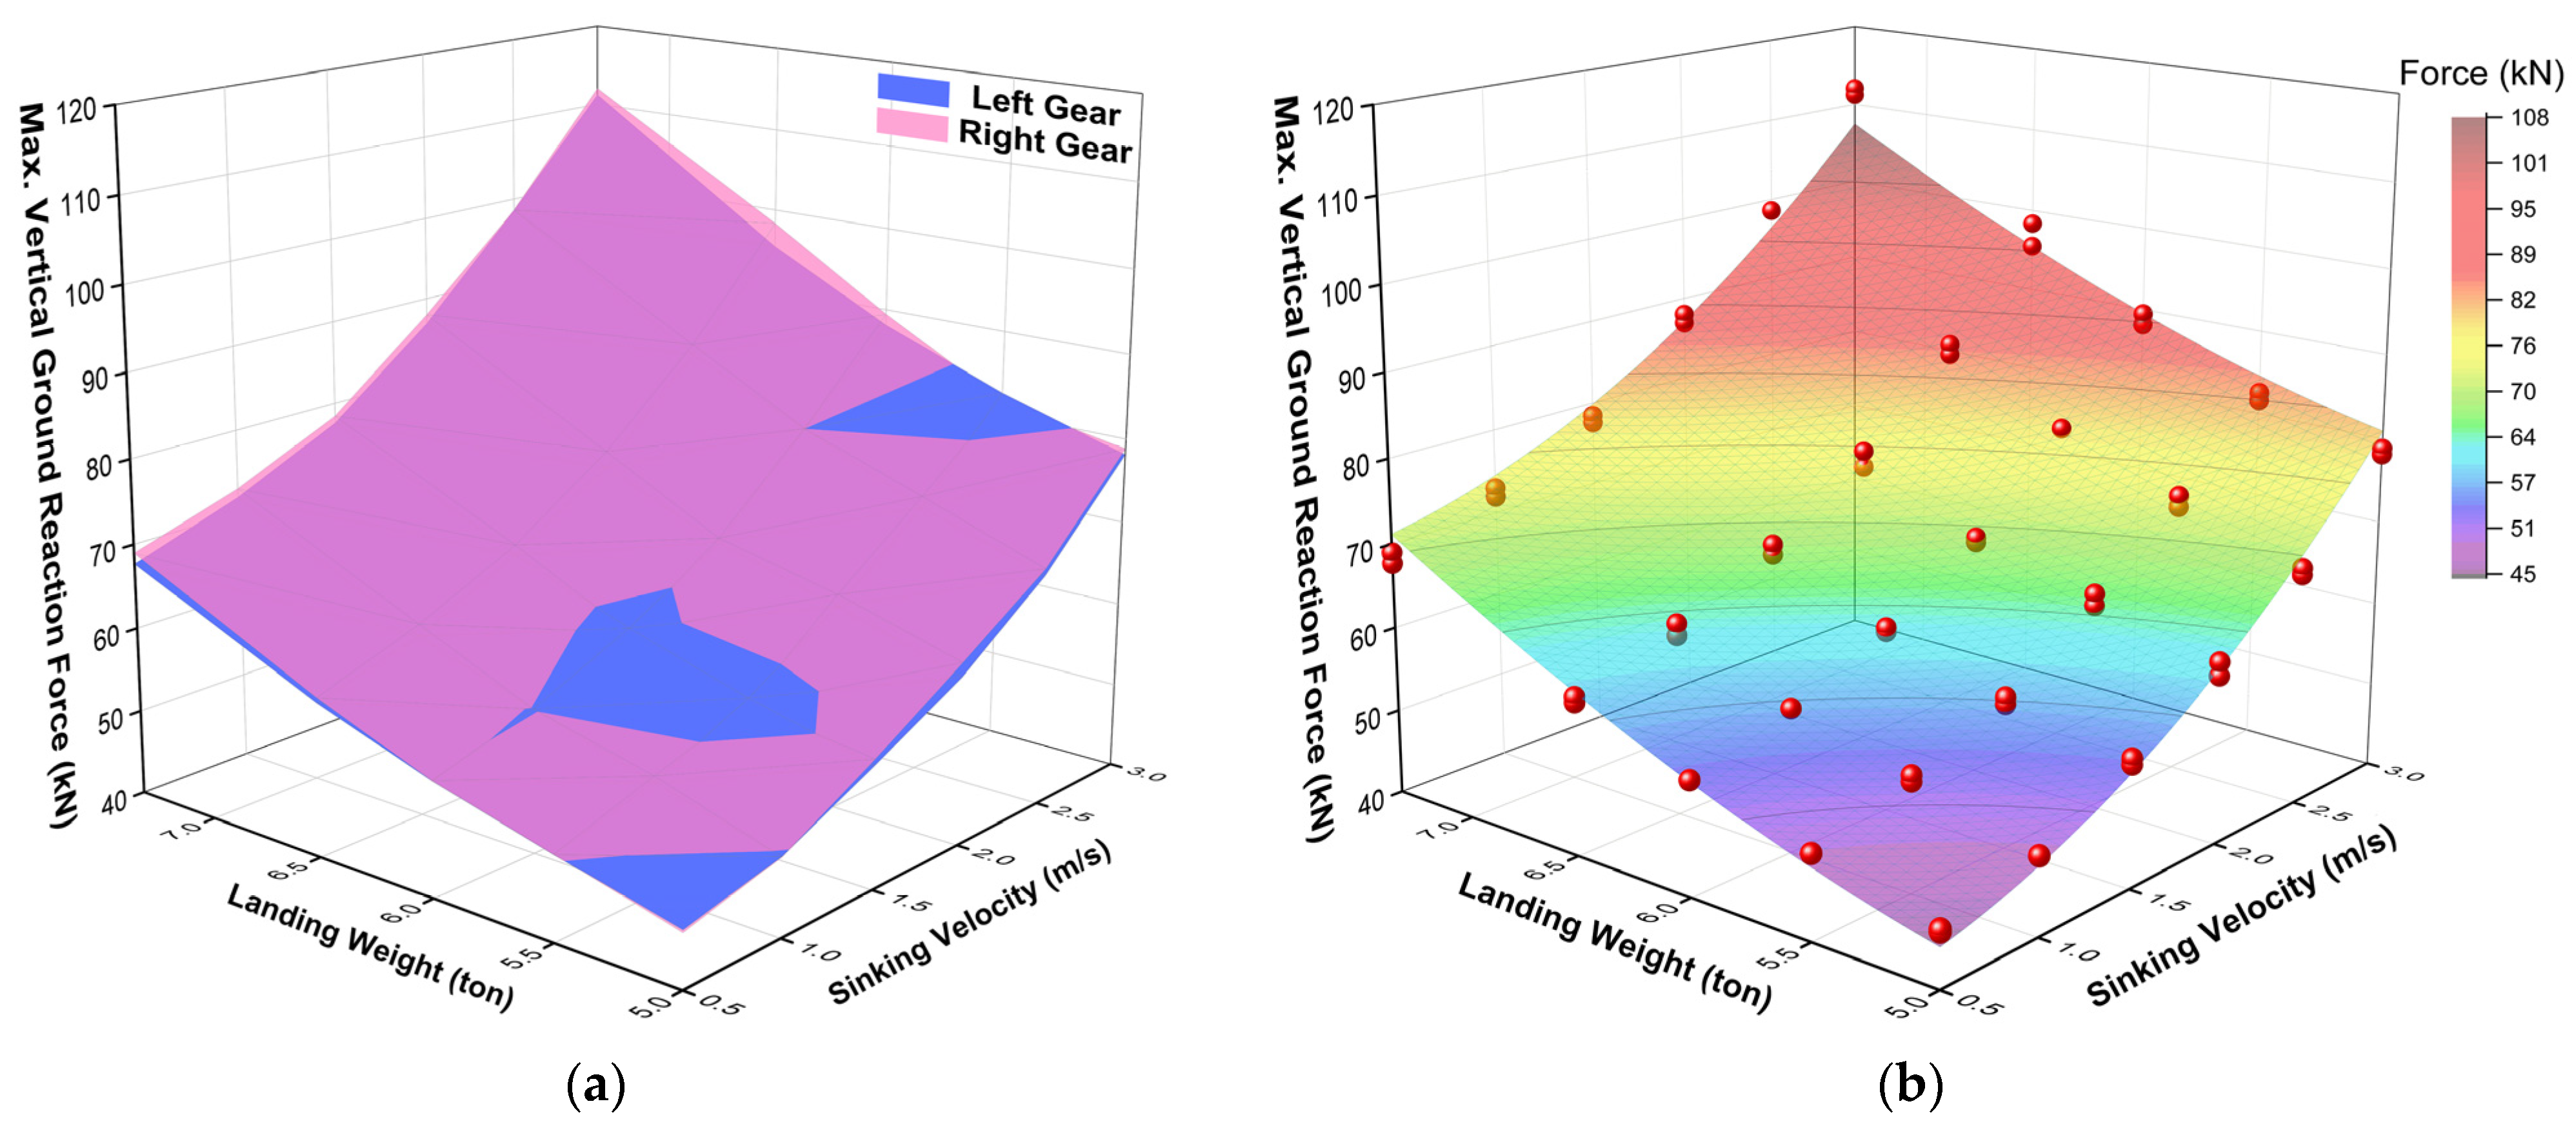
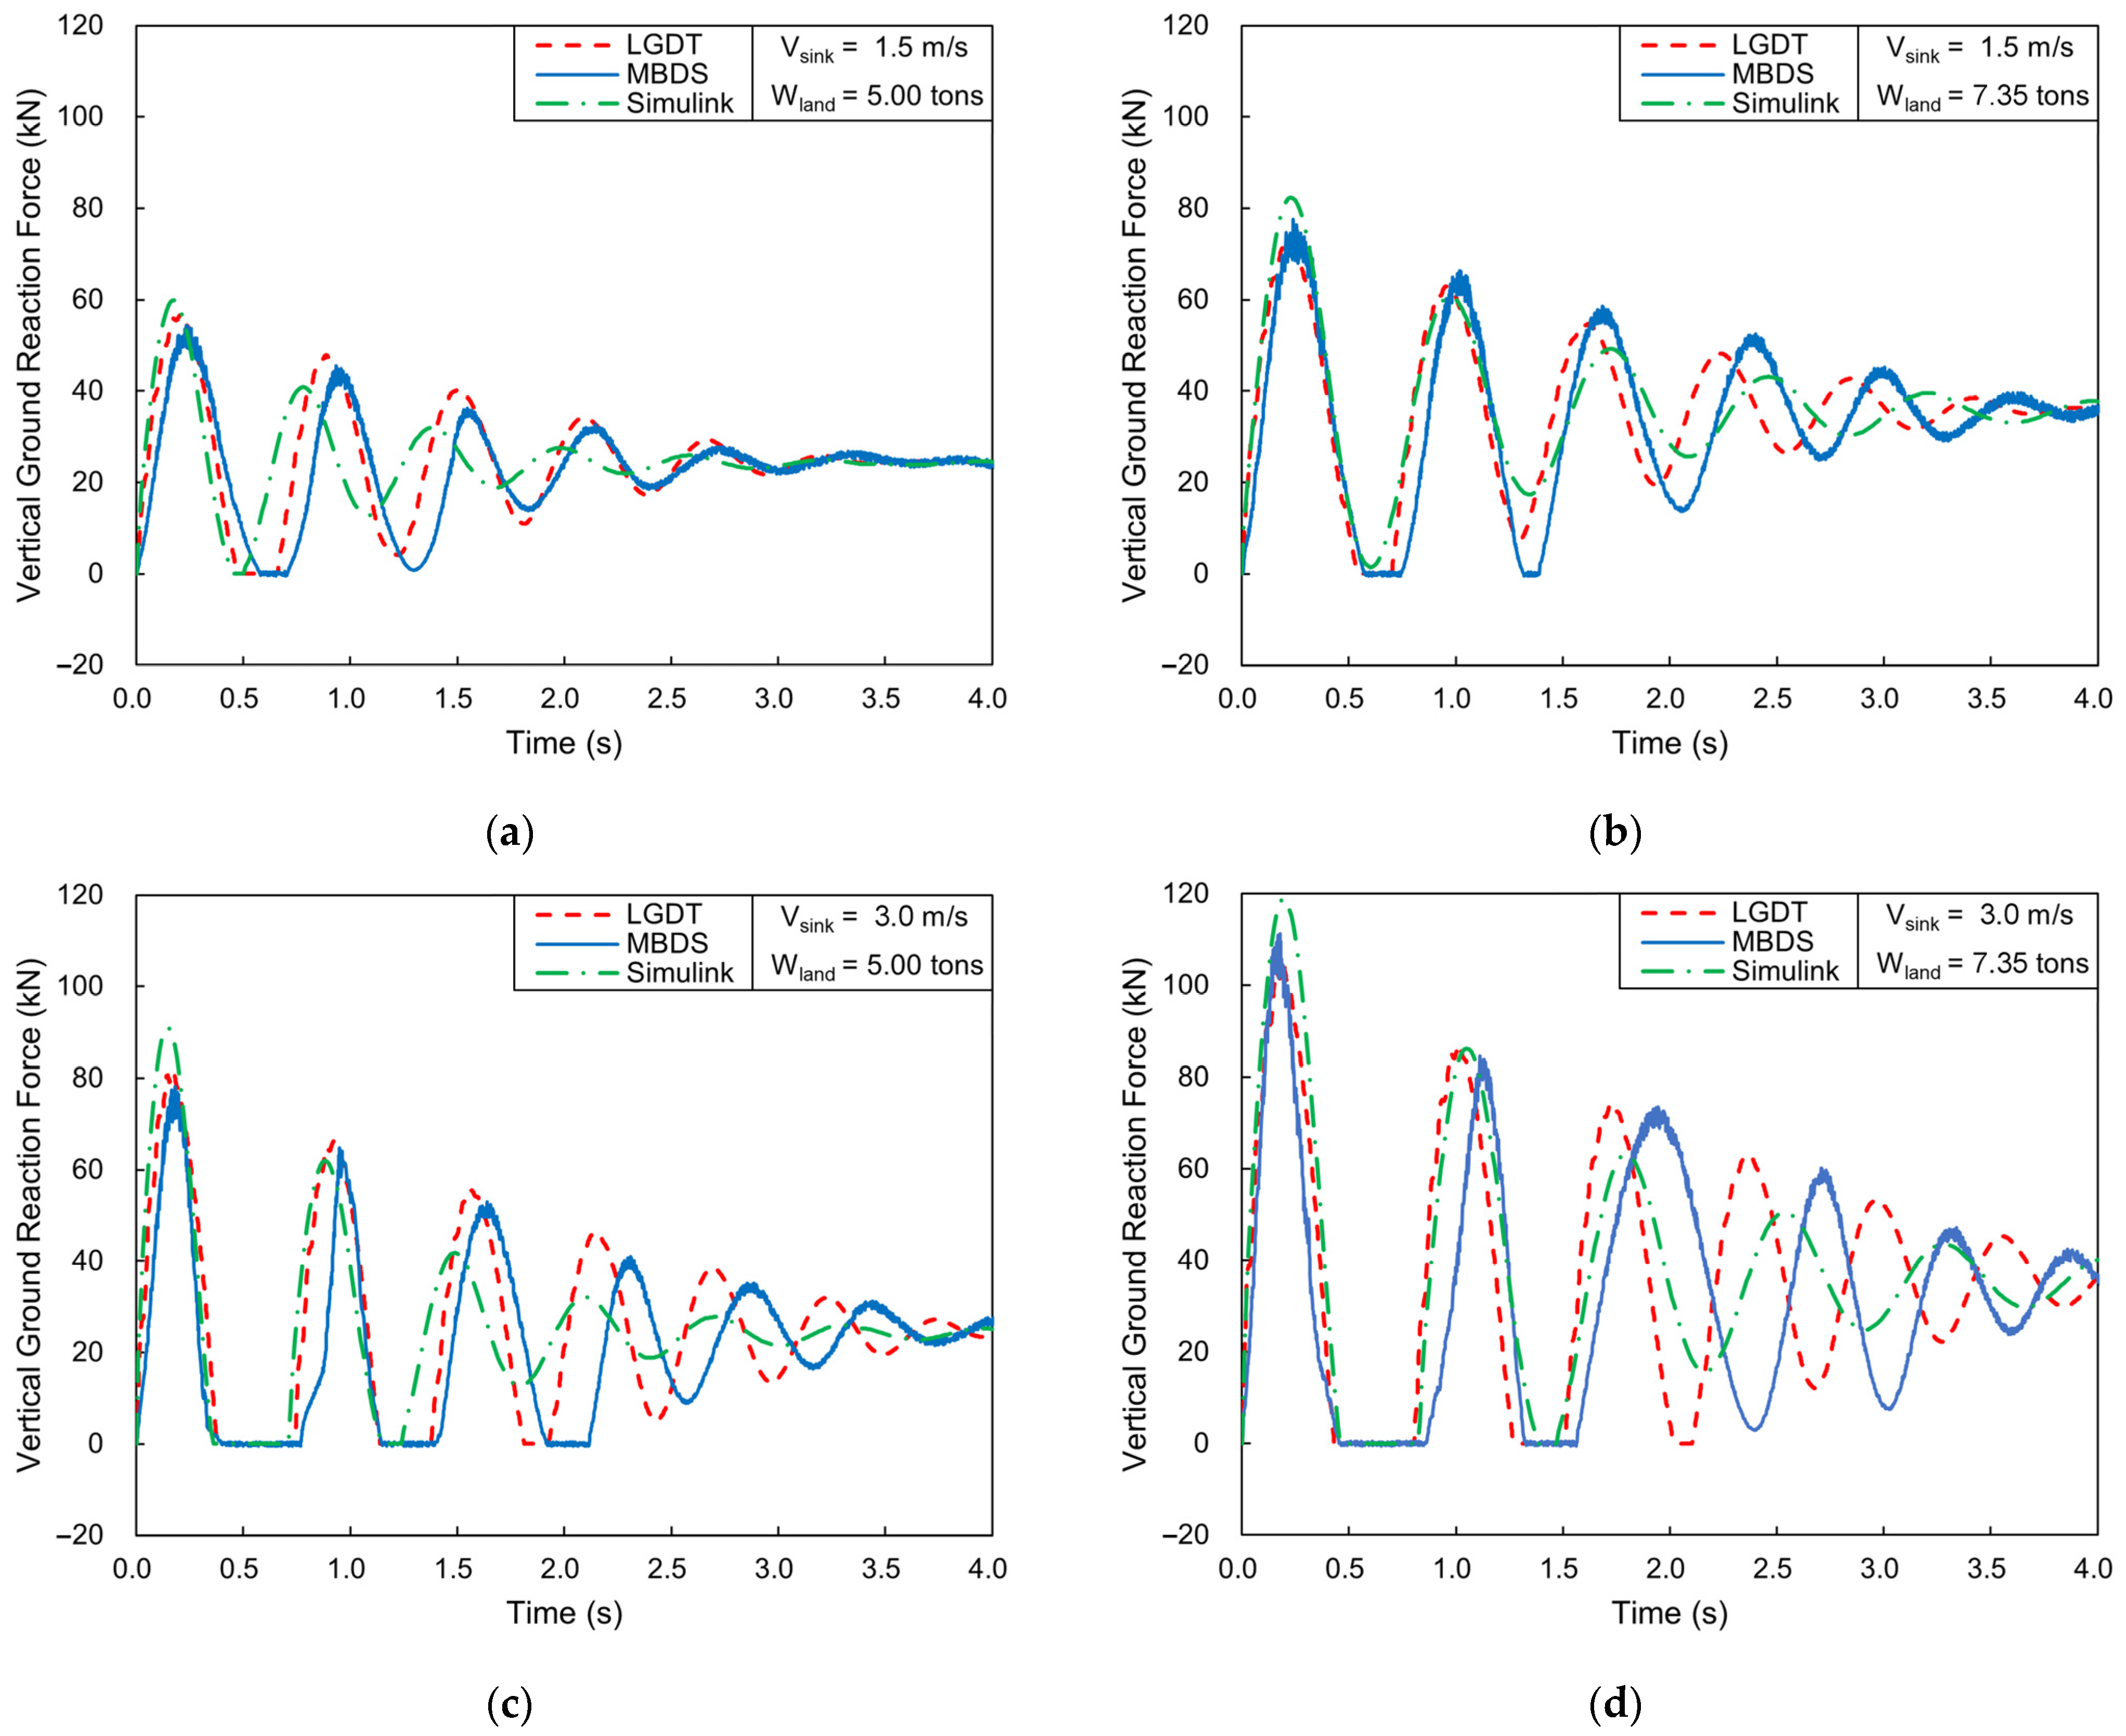
3.4.2. Vertical Ground Reaction Force

During the landing process, the vertical ground reaction force (Fground) from the runway has a huge impact on the safety of the aircraft structure. When the simulation is completed, the time-history curves of the Fground and stress distribution can be obtained. Figure 13 shows the time-history curves of Fground under the four boundary conditions, all of which exhibit the form of simple harmonic oscillation followed by convergence. Generally, the peak values of Fground on both sides of the LSLG and their changing trends are coincident, indicating that the aircraft is basically in a balanced state during the landing process in the MBDS. The values of Fground at the first two peaks are labelled on the curves. The overload coefficient is typically expressed as a multiple of gravitational acceleration (g), which can be calculated by summing the forces acting on both landing gears and dividing by the landing weight.
Apparently, the landing weight has almost no effect on the overload coefficient, but the overload coefficient has an obvious positive correlation with the sinking velocity (Vsink) of aircraft. From the comparison between Figure 13a,b, it can be seen that when Vsink is maintained at 1.5 m/s, the attenuation rate of the peak value of Fground is almost constant and is scarcely related to the aircraft landing weight. From the comparison between Figure 13c,d, it is seen that when Vsink is maintained at 3.5 m/s, the attenuation rate of the peak value of Fground increases significantly with the heavier landing weight. This shows that the greater the sinking velocity, the faster the attenuation of the oscillation during the landing process.
The simulated maximum Fground values under 30 different conditions are plotted in Figure 14, where the Fground values of the left gear and right gear are almost the same. The magnitude of the maximum Fground is positively correlated with the landing weight and the sinking velocity.
To numerically analyse and predict how the maximum vertical ground reaction force (Fground) changes with sinking velocity (Vsink) and landing weight (Wland), the nonlinear surface fitting (NSF) method is conducted to describe the surface composed of data sets of MBDS (MBDS-NSF):
F G , M B D S = A B W L v S + C
W L = W L W L 2 W L 3 v f = v S v S 2 v S 3
where WL is the column matrix containing landing weights with power numbers, vs is the column matrix containing sinking velocities with power numbers, A and B are constant matrices and C is a constant. Arbitrary conditions of Wland and Vsink can be substituted into this function to predict a particular maximum Fground. As shown in Figure 14b, a total of 60 numerical points roughly form a smooth and regular surface. The NSF module in Origin 2024 software was utilised to obtain A and B and C as follows:
A = 42.77 6.846 0.2634 B = 0.3938 4.281 0.07878 C = 118.93
The coefficient of determination (R2) ranged from 0 (worst) to 1 (perfect) and is utilised to evaluate the goodness of fitting, which can be calculated by the following:
R 2 = 1 RSS TSS
where RSS is the sum of the squared residuals, and TSS is the total sum of squares. The R2 of the NSF function (22) automatically output by the software is 0.9893, meaning that the function is well fitted.
The NSF function provides a practical way to predict maximum Fground under conditions excluded in simulations. These predictions will be compared with landing gear drop test (LGDT) results to validate simulation accuracy and reliability.

4. Landing Gear Drop Test

Generally, the landing gear drop test (LGDT) is a simpler way to evaluate the landing gear system and prove its compliance demonstration for airworthiness. According to aviation regulations FAR-23.725(a) and CCAR-23.725(a), the LGDT must be conducted with a complete aircraft or separate landing gear in the correct position. In this study, the LGDT with separate landing gear is conducted, because the drop tests with complete aircraft are complex and risky.

4.1. Establishment of LGDT Rig

The LGDT rig is composed of columns, a hanging basket, counterweights, several sensors, etc. (Figure 15). The LSLG is fixed to the basket, which can vertically slide in the track composed of four columns. The friction can be ignored because of the rollers settled at the corners of the basket. The LSLG structure, basket and counterweights (if any) make up the drop body. Counterweights are added and fixed above the basket to make the whole drop body achieve the desired weight. A hoist and pulley assembly are settled on the top of the test rig, which can raise the drop body to the desired height. Four retractable lock latches are placed on the side surface of the hanger to hook the drop body. Several uniform wood sticks are utilised as scale marks to confirm that the drop body has been lifted to the intended height for drop.
When the LGDT started, the lock latches were retracted by the motor inside the hanger, suddenly releasing the drop body. The test data acquisition system was triggered before the landing gear hit the force measuring platform. The time-history curves of force signals were recorded after the drop shock. The specific technical parameters of the LGDT rig are shown in Table 3.

4.2. Calculation and Settings of Parameters

According to the civil aviation regulations of FAR §23.725(b) and CCAR §23.725(b) [30,31], the drop body weight in the LGDT is equal to the static force exerted on the objective landing gear when the aircraft is at horizontal attitude (the nose gear is spaced from the ground). Hence, ignoring the effect of lift force, the drop body weight of the single main landing gear in LGDT is equal to half of the aircraft landing weight; those values are shown in Table 4.
The release height to achieve the sinking velocity of 0.5~3.0 m/s can be calculated by the formula of free fall; the results are shown in Table 5.

4.3. Implementing Steps

Having finished the calculations according to the above formulas, the LGDT can be conducted in the following steps:
  • Assembling the LSLG with ESA under the basket;
  • Adding counterweights above the basket to achieve the effective weight of the drop body;
  • Lifting the drop body to the predetermined release height;
  • Releasing the drop body, meanwhile collecting the objective data through the sensors;
  • Checking carefully if the structures of the LSLG have any damage or abnormal deformation.

4.4. Results of LGDT

The time-history curves of the vertical ground reaction force (Fground) under the four boundary conditions were recorded after the LGDTs, which were plotted in Figure 16 and compared with the results of the MBDS and Simulink simulation for the numerical model. Note that the MBDS results presented here were obtained with a simplified model of the aircraft body, which is represented as a vertically movable mass. This eliminates modelling discrepancies between simulations and physical tests, enabling direct comparison of results.
Apparently, the shapes and changing trends in the LGDT, MBDS and Simulink simulation are basically the same in the first two buffering cycles. The first peaks of the time-history curves obtained from LGDT and MBDS basically coincide at around 0.2 s. The maximum Fground of the Simulink results is slightly larger than those of the former two (error < 10%), while the amplitudes of its oscillation curves decrease faster. When the landing weight is lighter, Simulink results oscillate faster than LGDT results, while MBDS results oscillate slower than LGDT results. When the landing weight is heavier, the oscillation frequencies of MBDS results and Simulink results are lower than those of LGDT. These lead to the phase difference up to 0.1 cycle between the results of the LGDT, MBDS and Simulink simulation of the numerical model, which has little effect on the evaluation of the buffering performance of the landing gear.
By focusing on the maximum ground vertical reaction force (Fground) that is not affected by model differences, a direct comparison between the MBDS with the aircraft model and the separate LGDT is feasible. Figure 17 shows the maximum Fground under 30 different conditions obtained from the Simulink simulation for the numerical dynamic model, the LGDT and the NSF function surface obtained from MBDS (MBDS-NSF), respectively. Figure 17a compares the results of the LGDT and Simulink simulation, indicating that the proposed numerical dynamic model has a good predictive performance under lower sinking velocity and lighter landing weight, which is the more common operating condition. However, under the condition of higher sinking velocity and heavier landing weight, the predicted value of the numerical dynamic model is up to 13.6% larger than the result of the LGDT. The LSLG structure designed using predicted values for limit working conditions maintains a safety margin and meets safety criteria.
Figure 17b compares the results of LGDT and MBDS-NSF. The intersection of the surfaces generally exists at a range of Wland from 5.5 to 6.0 tons, which is also the most common landing weight of the objective aircraft. In other words, the accuracy of the simulation is the highest in this range. When Wland is heavier, the maximum Fground obtained from the MBDS-NSF is slightly larger than the maximum Fground measured from the LGDT. The relative error at this stage is up to 8.39%, and the average error is 1.72%, which are within a reasonable range and in line with the conservative principle. The sinking velocity has less effect on the prediction accuracy, and the larger sinking velocity is better for prediction accuracy. The above results and analysis indicate that the MBDS-NSF method for predicting the maximum ground reaction force is highly effective and suggest that the prior simulation work is highly reliable.

5. Limitations and Conclusions

5.1. Limitations

5.1.1. Elastic Materials

The simplified spring damping model was utilised for the elastomer shock absorber (ESA) and tyre in the numerical dynamic modelling, possibly leading to errors in the Simulink simulation results under some working conditions. In future studies, more complex hyperelastic models such as the Bouc–Wen model and the Maxwell model can be conducted to simulate the damping and hysteresis characteristics more realistically.
Meanwhile, the ESA was regarded as a linear material in the FEA modelling, so it only had small nonlinear properties due to possible side spreading, but without hysteresis properties. In future studies, dynamic impact tests can be conducted to calibrate the ESA, and long-term data acquisition can be carried out to obtain more realistic nonlinear and hysteresis characteristics.

5.1.2. Landing Conditions

Aircrafts in the real world are landed under a variety of complicated conditions, including crosswind landing, tail-strike landing, single wheel landing, etc., caused by meteorological conditions or operation errors. The airworthiness regulations [30,31] set some limit test requirements for landing gear in these conditions, such as the following: FAR §23.485(c) and CCAR §23.485(c) require that a single main landing gear be able to withstand a positive side force not exceeding 0.83 times the aircraft’s gravity during crosswind landing; FAR §23.483 and CCAR §23.483 require that a single main landing gear in the case of single-wheel landing be able to withstand the same ground reaction force on a single landing gear in the case of horizontal landing.
The numerical dynamic model will be very complicated if the mentioned conditions are considered, and the nonlinear lateral damping elements need to be added. In future studies, the realisation by the supplementary settings in multibody dynamic simulation (MBDS) is possible, but it is difficult to verify the equivalence with the drop test of single landing gear. A multi-degree-of-freedom (MDOF) coupled drop test rig must be built, and then the entire aircraft drop test can be conducted.

5.2. Conclusions

This paper focuses on multibody modelling and simulation for lever-spring landing gear (LSLG) with a compressible elastomer shock absorber (ESA), and the following studies have been done:
  • A numerical dynamic model of the LSLG with ESA considering the uneven runway surface effect was established and verified with MATLAB/Simulink.
  • The high-fidelity virtual FEA model of the LSLG and the aircraft dummy were built, with tyre and ESA calibrations to ensure the credibility of modelling. The vertical ground reaction forces and the stresses on the LGDT across landing conditions were analysed using multibody dynamics simulation (MBDS), showing the feasibility and safety of the physical landing gear drop test (LGDT).
  • The sensitivities of key parameters were analysed. Results showed that the overload coefficient is only related to the sinking velocity and is unrelated to the aircraft landing weight. The influence of weight on the peak force attenuation rate increases significantly at higher sinking velocity.
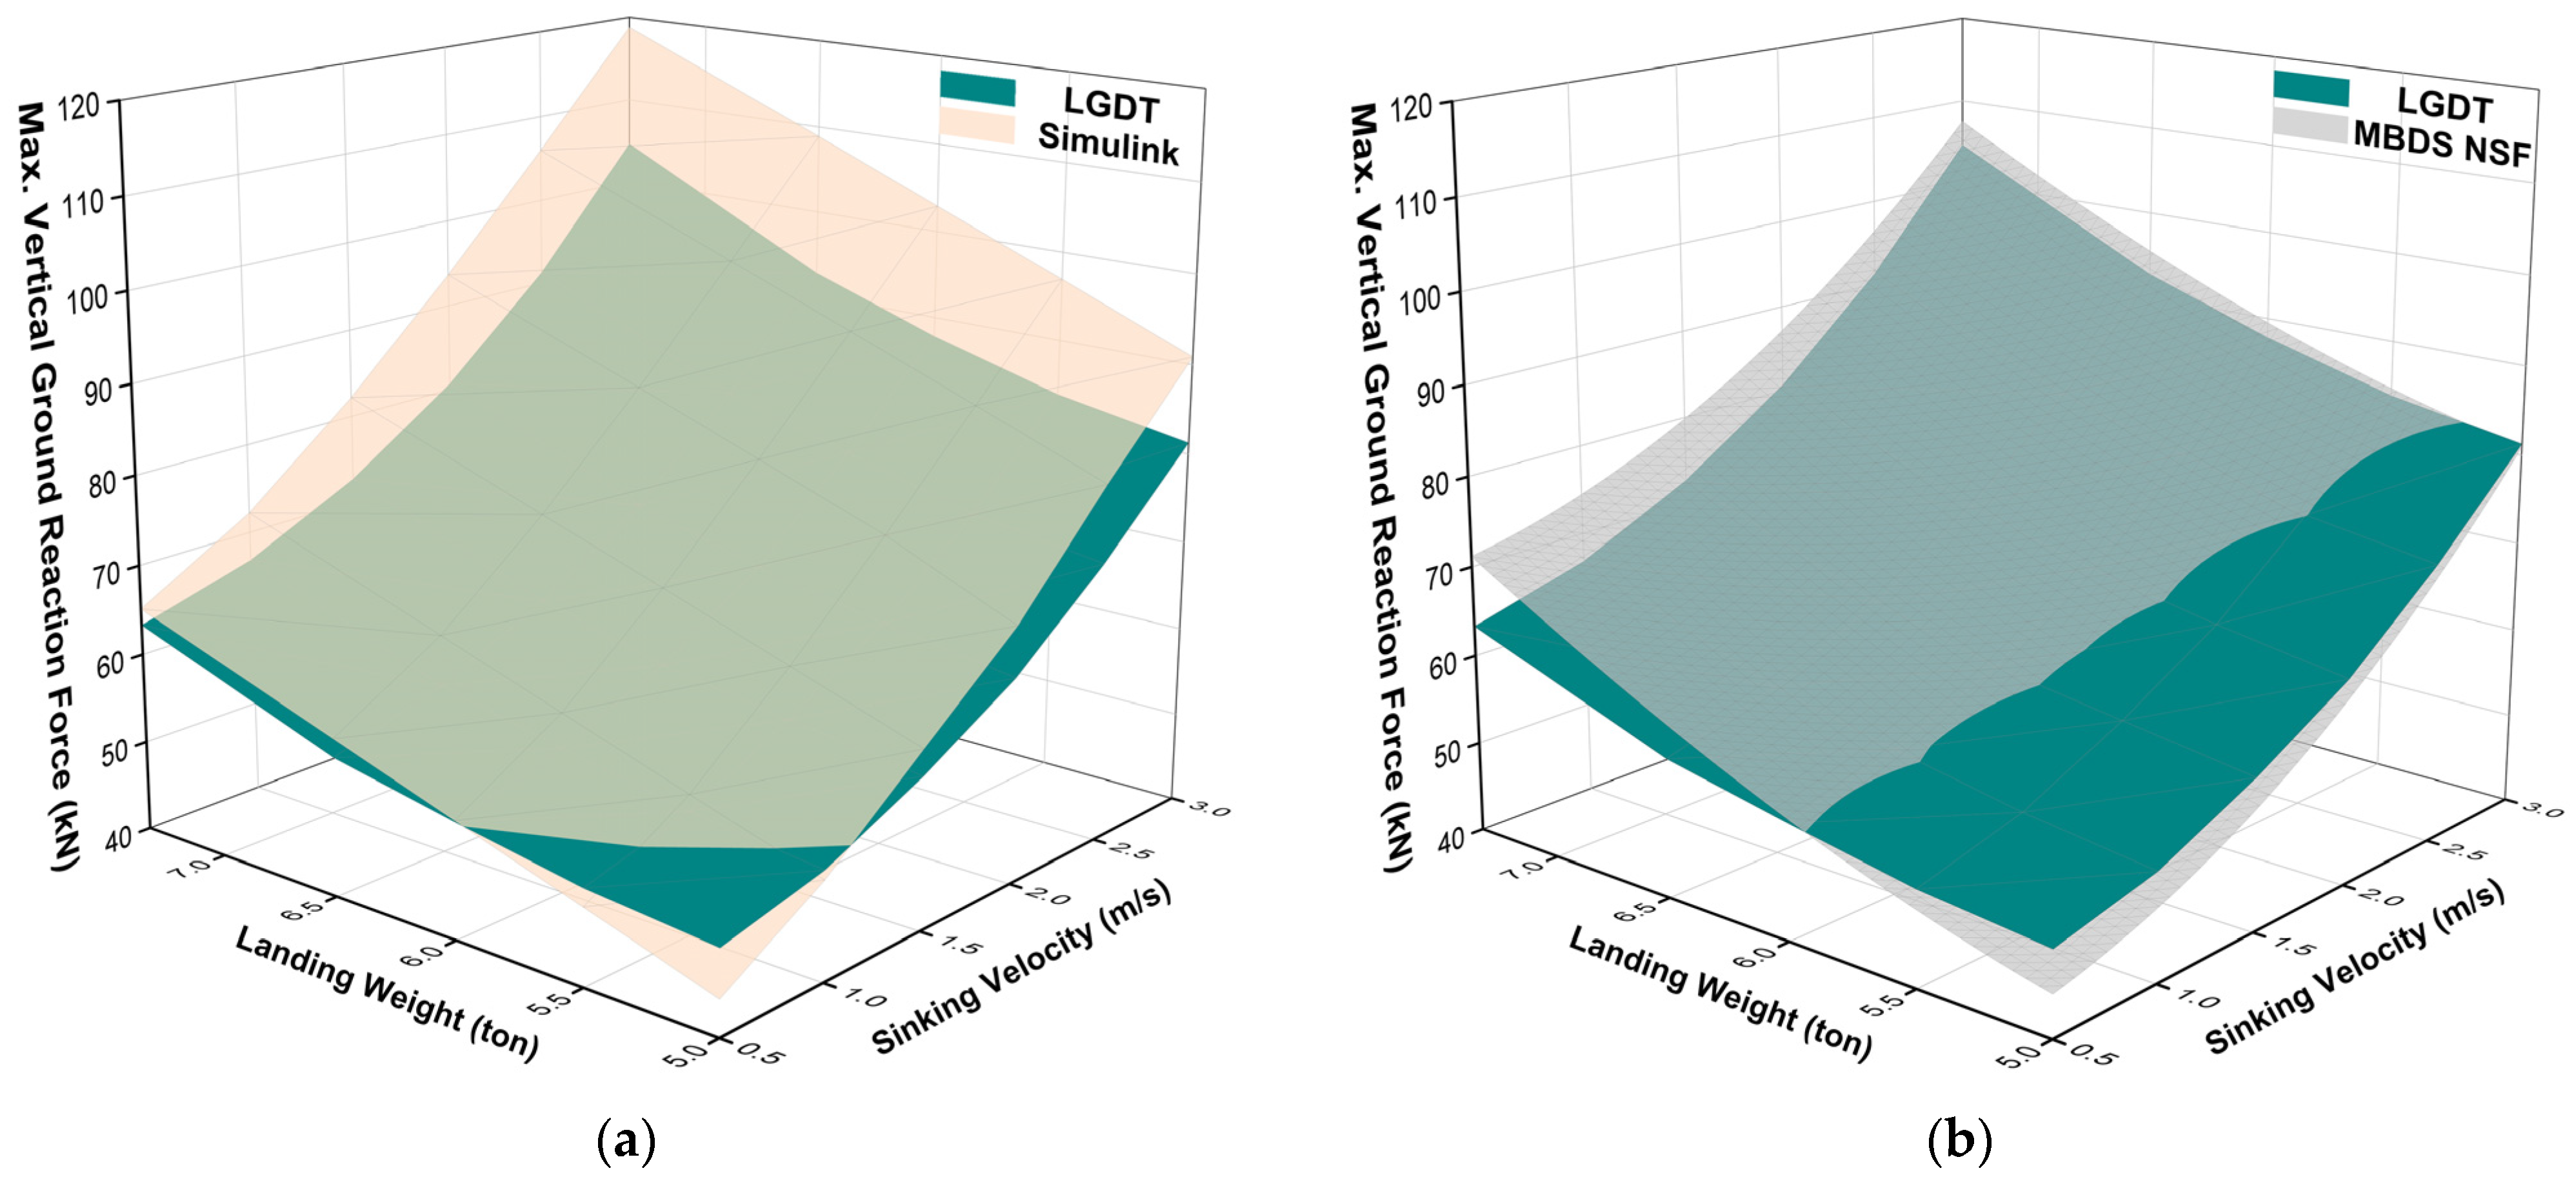
  • MBDS-derived maximum ground reaction forces under different landing conditions were fitted with a nonlinear surface function (NSF), providing real-time prediction capability.
  • The maximum vertical ground reaction force obtained from MBDS-NSF and numerical dynamic simulation were compared with the experimental results. The result of the numerical model simulation is slightly larger than the experimental value, and the maximum error is 13.6%. The oscillation frequency of the LGDT results is slightly larger than those of the MBDS results. The maximum error is 8.39%, and the average error is 1.72%, proving the accuracy and reliability of the simulation.
In conclusion, this paper uses numerical dynamic modelling, MBDS and LGDT methods to deeply study the buffering performance of the LSLA with ESAs, providing a reference method for its buffering performance characterisation in future research.

Author Contributions

Conceptualisation, F.L. and X.Z.; methodology, F.L. and J.Z.; software, J.C. and Z.P.; formal analysis, F.L. and J.C.; resources, J.Z. and X.Z.; data curation, J.C. and X.Z.; writing—original draft preparation, F.L.; writing—review and editing, J.Z., Z.P. and F.L.; supervision, J.Z.; project administration, X.Z. and J.Z. All authors have read and agreed to the published version of the manuscript.

Funding

This research was funded by: Special Funding Programme for Hunan Innovative Province Construction, grant number 2021GK1020; Nature Science Foundation of Hunan Province, grant number 2023JJ50024; Central South University Postgraduate Industry-Academia Collaborative Innovation Project, grant number 2024XQLH0097. This research was also funded by: Central South University Postgraduate Scientific Research Practice Project (Independent Exploration), project name Research on the Dynamics and Buffering Performance of Aircraft Landing Gear Based on Shock Absorption of Variable Stiffness Elastomers.

Data Availability Statement

Data are available from the authors on request.

Acknowledgments

The authors gratefully acknowledgement the foundation and technical support by Central South University and Hunan Huayu Aviation Technology Co., Ltd. in support of this work.

Conflicts of Interest

Author Jianxin Zhu was employed by the company Sunward Intelligent Equipment Co., Ltd. Author Xiangfu Zou was employed by the company Sunward Intelligent Equipment Co., Ltd. and Hunan Huayu Aviation Technology Co., Ltd. The remaining authors declare that the research was conducted in the absence of any commercial or financial relationships that could be construed as a potential conflict of interest.

Abbreviations

The following abbreviations are used in this manuscript:
CCARChina Civil Aviation Regulation
BLWNband-limited white noise
ESAelastomer shock absorber
FARFederal Aviation Regulation (USA)
FEAfinite element analysis
GCgravity centre
LGDTlanding gear drop test
LSLGlever-spring landing gear
MBDSmultibody dynamics simulation
MREmagnetorheological elastomer
NSFnonlinear surface fitting
OPSAoleo-pneumatic shock absorber
SSSPsolid spring shock absorber
UAVunmanned aerial vehicle

References

  1. Guida, M.; Marulo, F.; Abrate, S. Advances in crash dynamics for aircraft safety. Prog. Aerosp. Sci. 2018, 98, 106–123. [Google Scholar] [CrossRef]
  2. Jiang, Y.; Feng, G.; Liu, P.; Yuan, L.; Ding, J.; Jiang, B. Evaluation of Joint Clearance Effects on the Shimmy of Nose Landing Gear. Aerospace 2023, 10, 722. [Google Scholar] [CrossRef]
  3. Liu, J.; Tan, Y. Safety evaluation of the power system of electric vertical take-off and landing vehicles with different configurations. J. Harbin Eng. Univ. 2024, 45, 339–348. [Google Scholar] [CrossRef]
  4. Raouf, I.; Kumar, P.; Cheon, Y.; Tanveer, M.; Jo, S.; Kim, H.S. Advances in Prognostics and Health Management for Aircraft Landing Gear—Progress, Challenges, and Future Possibilities. Int. J. Precis. Eng. Manuf.–Green Technol. 2024, 12, 301–320. [Google Scholar] [CrossRef]
  5. Silva, P.A.S.F.; Al-Shabab, S.A.A.; Tsoutsanis, P.; Skote, M. Study of Orifice Design on Oleo-Pneumatic Shock Absorber. Fluids 2024, 9, 108. [Google Scholar] [CrossRef]
  6. Yan, S.; Xue, P.; Liu, L.; Zahran, M.S. Optimization of landing gear under consideration of vibration comfort for civil aircraft. Aircr. Eng. Aerosp. Technol. 2024, 96, 378–386. [Google Scholar] [CrossRef]
  7. Wishwakarma, S.N.; Telore, K.K.; Purandare, V.V.; Waichal, G.C.; Pagar, P.K.R. Optimization of Landing Gear Mechanism using Generative Design. Int. J. Res. Appl. Sci. Eng. Technol. 2023, 11, 1931–1938. [Google Scholar] [CrossRef]
  8. Gudmundsson, S. Chapter 13: The Anatomy of the Landing Gear. In General Aviation Aircraft Design: Applied Methods and Procedures, 1st ed.; Butterworth-Heinemann; Elsevier: Amsterdam, The Netherlands, 2014. [Google Scholar]
  9. Xue, Z.; Li, M.; Li, Y.; Jia, H. A Simplified Flexible Multibody Dynamics for a Main Landing Gear with Flexible Leaf Spring. Shock Vib. 2014, 2014, 1–10. [Google Scholar] [CrossRef]
  10. Li, D.; Fan, Z.; Zhang, Y.; Zang, J.; Yang, F. Optimum design and experiment of composite leaf spring landing gear for electric aircraft. Chin. J. Aeronaut. 2020, 33, 2649–2659. [Google Scholar] [CrossRef]
  11. Zhang, Y.; Tong, J.; Guo, Q.; Guo, J.; Liu, X.; Chen, L. Hierarchical multiscale analysis for 3D woven composite leaf spring landing gear. Thin Wall. Struct. 2023, 189, 110913. [Google Scholar] [CrossRef]
  12. Hidayat, D.; Lstiyanto, J.; Marta, A.; Hidayat, K.; Sumarsono, D.A. Effect of Rubber Damper Stiffness and Tire Pressure to Reduce Ground Reaction Load Factor on Main Landing Gear Using Multi-Body Simulation (MBS) Rigid Model. J. Teknol. Dirgant. 2019, 17, 123–128. [Google Scholar] [CrossRef]
  13. Mardiyanto, R.; Kuswidiastuti, D.; Hutagalung, R.J.; Aulia, A.F.; Nugroho, P.D. Bungee Cord-based Unmanned Aerial Vehicle (UAV) Launcher With Trajectory Prediction. Int. J. Innov. Comput. I 2024, 20, 1199–1214. [Google Scholar] [CrossRef]
  14. Müller, J.; Elhashash, M.; Gollnick, V. Electrical Launch Catapult and Landing Decelerator for Fixed-Wing Airborne Wind Energy Systems. Energies 2022, 15, 2502. [Google Scholar] [CrossRef]
  15. Gonca, V.; Shvab, J. Design of elastomeric shock absorbers with variable stiffness. J. Vibroeng. 2010, 12, 347–354. [Google Scholar]
  16. Ding, W.; Wang, L.; Chen, Z.; Ao, H.; Yan, H. An Adaptive Elastic Support Seat-Based Magnetorheological Elastomer for Human Body Vibration Reduction. Materials 2024, 17, 3330. [Google Scholar] [CrossRef]
  17. Xu, Z.; Wu, H.; Wang, Q.; Jiang, S.; Yi, L.; Wang, J. Study on movement mechanism of magnetic particles in silicone rubber-based magnetorheological elastomers with viscosity change. J. Magn. Magn. Mater. 2020, 494, 165793. [Google Scholar] [CrossRef]
  18. Mann, V.; Dechwayukul, C.; Thongruang, W.; Srewaradachpisal, S.; Kaewpradit, P.; Kaew Apichai, W.; Bui, H. Design and Fabrication a Lightweight Spring Made of Natural Rubber for a Motorcycle’s Shock Absorber. Int. J. Automot. Mech. Eng. 2020, 17, 7758–7770. [Google Scholar] [CrossRef]
  19. Tiwari, V.; Sharma, S.C.; Harsha, S.P. Ride comfort analysis of high-speed rail vehicle using laminated rubber isolator based secondary suspension. Veh. Syst. Dyn. 2023, 61, 2689–2715. [Google Scholar] [CrossRef]
  20. Giagopoulos, D.; Arailopoulos, A.; Chatziparasidis, I. Optimal Modeling of an Elevator Chassis under Crash Scenario Based on Characterization and Validation of the Hyperelastic Material of Its Shock Absorber System. Appl. Mech. 2022, 3, 227–243. [Google Scholar] [CrossRef]
  21. Mustashin, M.S.; Rahmani, M.; Behdinan, K. Experimental characterization of a novel nose landing gear shimmy damper using a small-scale test rig. Aerosp. Sci. Technol. 2021, 112, 106625. [Google Scholar] [CrossRef]
  22. Zhu, X.; Wu, Y.; Yang, Y.; Pang, Y.; Ling, H.; Zhang, D. Real-time risk assessment of aircraft landing based on finite element-virtual prototype-machine learning co-simulation on wet runways. Int. J. Transp. Sci. Technol. 2024, 13, 77–79. [Google Scholar] [CrossRef]
  23. Fang, W.; Zhu, L.; Wang, Y. Landing Performance Study for Four Wheels Twin Tandem Landing Gear Based on Drop Test. Aerospace 2022, 9, 334. [Google Scholar] [CrossRef]
  24. Jinadu, A.; Olayemi, O.A.; Tijani, Q.; Salaudeen, A. Characterization of Boeing 777 Nose Landing Gear to Better Withstand Rough Landing. Int. J. Eng. Res. Afr. 2023, 66, 75–90. [Google Scholar] [CrossRef]
  25. Kang, B.; Jo, B.; Kim, B.; Hwang, J.; Choi, S. Linear and Nonlinear Models for Drop Simulation of an Aircraft Landing Gear System with MR Dampers. Actuators 2023, 12, 287. [Google Scholar] [CrossRef]
  26. Correia, D.; Ferreira, A. Aircrafts On-Ground Dynamics Models and Simulation Software: State-of-the-Art. Sustainability 2021, 13, 9147. [Google Scholar] [CrossRef]
  27. Pagani, A.; Augello, R.; Governale, G.; Viglietti, A. Drop Test Simulations of Composite Leaf Spring Landing Gears. Aerotec. Missili Spaz. 2019, 98, 63–74. [Google Scholar] [CrossRef]
  28. Liu, W.; Wang, Y. Improved Multi-Body Dynamic Simulation of Landing Gear Drop Test Incorporating Structural Flexibility and Bearing Contact. Aerospace 2024, 11, 543. [Google Scholar] [CrossRef]
  29. Pagani, A.; Azzara, R.; Augello, R.; Carrera, E. Multibody simulation and descent control of a space lander. Adv. Aircr. Spacecr. Sc. 2020, 7, 91–113. [Google Scholar] [CrossRef]
  30. Federal Aviation Administration. Airworthiness Standards: Normal Category Airplanes. In CFR Part 23; Federal Aviation Administration: Washington, DC, USA, 2024. [Google Scholar]
  31. Civil Aviation Administration of China. Airworthiness Standards: Normal Category Airplanes. In CCAR-23-R4, R4ed.; Civil Aviation Administration of China: Beijing, China, 2022. [Google Scholar]
  32. Federal Aviation Administration. Advisory Circular 25.491-1: Taxi, Takeoff and Landing Roll Design Loads; Federal Aviation Administration: Washington, DC, USA, 2000.
  33. ISO 8608:2016; Mechanical Vibration—Road Surface Profiles—Reporting of Measured Data. 2nd ed. International Organization for Standardization Publishing: Geneva, Switzerland, 2016.
  34. GBT 7031-2005; Mechanical Vibration—Road Surface Profiles—Reporting of Measured Data. The General Administration of Quality Supervision, Inspection and Quarantine of the People’s Republic of China: Beijing, China, 2005.
  35. Rapp, T.; Jacobs, G.; Berroth, J.; Guenther, J. Determining Dynamic Properties of Elastomer-Dampers by Means of Impact Testing. Exp. Mech. 2022, 62, 823–836. [Google Scholar] [CrossRef]
  36. Sokolska, J.; Ptak, A. Abrasive and Erosive Wear Behavior of Elastomeric Polyurethane Coatings: Effect of Grain Size. Coatings 2024, 14, 1611. [Google Scholar] [CrossRef]
  37. Yan, J.; Zhang, Z.; Man, J.; Sun, J.; Zhen, R.; Liu, X. Parameter Identification of the Mooney–Rivlin Model for Rubber Mounts Subject to Multiaxial Load. J. Vib. Eng. Technol. 2025, 13, 42. [Google Scholar] [CrossRef]
  38. Mizerski, K.A. The Equations of Hydrodynamics (Chapter 1). In Foundations of Convection with Density Stratification; Springer International Publishing AG: Cham, Switzerland, 2021; pp. 1–20. [Google Scholar]
  39. Cheng, D. Handbook of Mechanical Design (Book III), 6th ed.; Chemical Industry Press: Beijing, China, 2017; pp. 12–164. [Google Scholar]
  40. Cheng, D. Handbook of Mechanical Design (Book I), 6th ed.; Chemical Industry Press: Beijing, China, 2017; pp. 3–22. [Google Scholar]
  41. Federal Aviation Administration. Metallic Materials Properties Development and Standardization (MMPDS-05), 5th ed.; Federal Aviation Administration: Washington, DC, USA, 2010.
Figure 1. Two popular categories of buffering methods for main landing gear with solid springs and their efficiencies: (a) Leaf-spring landing gear with fixed leg; (b) Lever-spring landing gear with elastomer shock absorbers.
Aerospace 12 00367 g001
Figure 2. Simplified dynamic model of LSLG.
Aerospace 12 00367 g002
Figure 3. Simulink model for uneven runway excitation.
Aerospace 12 00367 g003
Figure 4. The uneven runway excitation generated with BLWN: (a) Displacement excitation; (b) Velocity excitation.
Aerospace 12 00367 g004
Figure 5. Simulink model for LSLG.
Aerospace 12 00367 g005
Figure 6. Kinematic responses when taxiing on uneven runway: (a) Displacement excitation of uneven runway surface, aircraft weighted 5.00 tons and aircraft weighted 7.35 tons; (b) Velocity excitation of uneven runway surface, aircraft weighted 5.00 tons and aircraft weighted 7.35 tons.
Aerospace 12 00367 g006
Figure 7. Dynamic responses when landing on uneven runway: (a) Vertical ground reaction force; (b) Displacement of counterweight.
Aerospace 12 00367 g007
Figure 8. FEA model meshing of aircraft body and LSLG with ESAs.
Aerospace 12 00367 g008
Figure 9. Calibration of tyre FEA model: (a) Comparison of sink displacement versus static force of tyre between experimental data from supplier and calibration simulation; (b) The definition of static force loaded at gear axle and the generated sink displacement.
Aerospace 12 00367 g009
Figure 10. The moduli and stiffness of elastomers in the compression state changing with the Shore hardness.
Aerospace 12 00367 g010
Figure 11. Calibration of elastomer FEA model: (a) Comparison of displacement versus compression force of ESA between physical compression test and calibration simulation; (b) The physical compression test to obtain the compression property of ESA.
Aerospace 12 00367 g011
Figure 12. Stress generated on LSLG obtained from MBDS (Wland = 7.35 tons; Vsink = 3.0 m/s): (a) Front to back view; (b) Partial view at leg steel tube; (c) Partial view at upper platen; (d) Partial view at lower platen.
Aerospace 12 00367 g012
Figure 13. Time-history curves of the vertical ground reaction force obtained from MBDS: (a) Vsink = 1.5 m/s, Wland = 5.00 tons; (b) Vsink = 1.5 m/s, Wland = 7.35 tons; (c) Vsink = 3.0 m/s, Wland = 5.00 tons; (d) Vsink = 3.0 m/s, Wland = 7.35 tons.
Aerospace 12 00367 g013
Figure 14. The maximum vertical ground reaction force under different conditions: (a) At left landing gear and right landing gear; (b) The fitting curve surface.
Aerospace 12 00367 g014
Figure 15. The illustration of the LGDT rig established and utilised in this study.
Aerospace 12 00367 g015
Figure 16. Time-history curves of the vertical ground reaction force recorded from the LGDT and the comparison with the results of MBDS and Simulink simulation for the numerical model: (a) Vsink = 1.5 m/s, Wland = 5.00 tons; (b) Vsink = 1.5 m/s, Wland = 7.35 tons; (c) Vsink = 3.0 m/s, Wland = 5.00 tons; (d) Vsink = 3.0 m/s, Wland = 7.35 tons.
Aerospace 12 00367 g016
Figure 17. The maximum vertical ground reaction force under different conditions: (a) Comparison between LGDT and Simulink simulation for numerical dynamic model; (b) Comparison between LGDT and MBDS-NSF method.
Aerospace 12 00367 g017
Table 1. Summary of parameters settings in the Simulink model.
ObjectsItem/SymbolParameter/SelectRemarks
ESAStiffness/k11,648,000 N/mSee Section 3.2.2
Damping/c11648 N·s/mTemporarily
TyreStiffness/k2693,900 N/mFrom supplier
Damping/c27000 N·s/mFrom supplier
Sinking velocitySinking velocity/Vsink−1.5 m/sNormal landing condition
−3.0 m/sLimited landing condition
Counterweight
Half   weight   of   aircraft without   landing   gears
Weight/M2400 kgCorrespond to minimum
landing weight—5.00 tons
3575 kgCorrespond to maximum
landing weight—7.35 tons
Gear
(wheel and tyre)
Weight/mgear66 kgPhysical measurement
Steel tube legWeight/mleg43 kgPhysical measurement
Dimension/Y10.401 m
Dimension/Y10.724 m
Table 3. The specifications of the LGDT rig.
SpecificationsNumerical ValueUnits
Dimensions1.6 × 1.6 × 4.0m
Power of hoist10kW
Max. lifting weight of hoist5000kg
Mass per counterweight100kg
Max. range of force sensors100kN
Sampling frequency of force sensors2000Hz
Table 4. The setting of drop body weight in LGDT.
Aircraft Weight (Ton)5.005.506.006.507.35
Drop Body Weight (ton)2.502.753.003.253.68
Table 5. The setting of sinking velocity in LGDT.
Sinking Velocity (m/s)0.51.01.52.02.53.0
Release Height (mm)1351115204319459
Disclaimer/Publisher’s Note: The statements, opinions and data contained in all publications are solely those of the individual author(s) and contributor(s) and not of MDPI and/or the editor(s). MDPI and/or the editor(s) disclaim responsibility for any injury to people or property resulting from any ideas, methods, instructions or products referred to in the content.

