Abstract
Flying cars are an important vehicle for future urban air mobility. Mainstream flying cars predominantly adopt the e-VTOL-like configuration. Unlike traditional aircraft, these flying cars must be operated by a single pilot. The corresponding hybrid ground-flight control scheme remains immature, with only a few reliability analyses focused on flight safety. Based on the single-pilot operation (SPO) concept, this paper designs a hybrid control scheme for e-VTOL-like flying cars and proposes a restricted driving mode for the the take-off and landing stages and an autonomous driving mode for the cruising stage, respectively. Taking the landing phase as an example, a fault mode analysis and fault tree analysis are conducted for the restricted driving mode, focusing on factors that are sensitive to flight safety. A fault probability analysis is performed of the landing control unit in the restricted driving mode. The calculated probability of the top event occurring is 1.98 × 10⁻⁸ per flight, which proves the feasibility of the design meets the safety requirements. This study provides a foundation for a safety assessment of driving modes in future designs of flying cars.
1. Introduction
In recent years, with the increasing severity of urban traffic congestion, flying cars, as a new mode of transportation, have gradually gained widespread attention [1]. Unlike traditional aircraft, flying cars possess both ground driving and aerial flying capabilities, typically employing vertical take-off and landing (VTOL) technology, which allows them to operate in urban environments without the need for long runways. This unique feature makes them particularly suitable for urban air mobility (UAM), aiming to alleviate urban traffic pressure and improve travel efficiency. Flying cars are expected to significantly enhance short-distance transportation within cities, offering a seamless integration with ground transportation systems. In a broader context, flying cars are also a key component of advanced air mobility (AAM), which encompasses a wide range of air transportation solutions, including UAVs and aerial cargo transport, with the potential to enable inter-city travel in the future.
Electric vertical take-off and landing (eVTOL) aircraft are generally considered the mainstream form of future low-altitude urban transportation. Numerous e-VTOL-like flying cars have emerged. Rotorcraft configuration (represented by PAL-V’s Liberty and EHang’s EH216S [2]), as seen in Figure 1 and Figure 2, can achieve vertical take-off and landing but have lower flight speeds, a shorter range, and higher noise compared to fixed-wing models. While preserving the long-endurance and high-speed performance of fixed-wing configuration aircraft as much as possible, the tilt-rotor configuration (represented by Joby) enables VTOL and efficient cruising, though it suffers from complex mechanical systems and a difficult flight control design. The compound-wing configuration (represented by V2000CG) balances vertical take-off and high-speed cruising, but has a complex structure and aerodynamic layout, which places high demands on the power system and causes interference between the rotors.
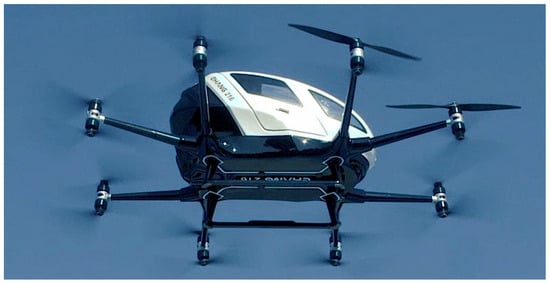
Figure 1.
A real view of the EHang 216 UAM aircraft during a flight test [2].

Figure 2.
PAL-V Liberty Sport from outside with extended rotor and propeller [2].
Unlike the three mainstream flying car configurations, the flying car design studied in this paper integrates both ground and flight modes, featuring a unique folding fixed-wing and tilt-rotor hybrid configuration that enables vertical take-off and landing (VTOL). This configuration is intended to support versatile urban mobility across both terrestrial and aerial environments. It is important to note that this study does not propose a definitive design solution for a flying car; rather, it focuses on identifying key functional requirements. A subsequent safety analysis is conducted based on representative flight modes derived from these functional needs. Research by Boy, G A [3], has shown that a single pilot can achieve the same level of system safety during the operation of a flying car. The use of a single-pilot crew in flying cars to increase the effective passenger capacity has become a necessity.
National Aeronautics and Space Administration (NASA) [4,5] and European Aviation Safety Agency (EASA) [6] have already conducted research on the SPO concept and its operational modes. However, designd of single-pilot cockpits for commercial aircraft are still lacking, and aircraft models adapted to the SPO mode need to be redesigned [7]. This paper presents an innovative conceptual design for the cockpit of flying cars operating under the SPO condition, aiming to achieve land and flight mode functionalities through a simplified hardware configuration.
Currently, the research on flying car control modes mainly focuses on autonomous driving technology. Liu [8] has designed a dual-mode trajectory tracking algorithm to achieve precise trajectory control of flying cars under complex operating conditions. Pan and co-authors [9] have designed four driving modes for flying cars but have not conducted a safety analysis.
Scholars from the University of Bedfordshire in the UK applied an improved FTA/FHA method to NASA’s N3-X demonstrator to identify external failure modes, proving that the FTA/FHA method is suitable for the initial design process of civil aircraft [10]. However, the application of FTA/FHA methods in safety analyses of flying cars is still limited.
Statistics show that although the approach and landing phase only accounts for 4% of the operating time of civil aircraft, 60% of aviation accidents occur during this phase [11]. Therefore, a safety analysis of the landing phase will be the focus of this study.
This paper proposes a flying car driving mode design based on SPO, and systematically evaluates the safety of its landing control phase through functional hazard analysis (FHA) and fault tree analysis (FTA), aiming to provide new ideas and methods for the research and development of flying cars.
2. Methodology
2.1. Functional Hazard Analysis (FHA)
Functional Hazard Analysis (FHA) is a systematic safety assessment method defined in industry standards such as SAE ARP4761 [12]. It focuses on identifying and evaluating the consequences of functional failures within an airborne system, particularly their potential to compromise flight safety or system integrity. FHA typically follows a top-down methodology: starting from high-level functions, the analysis progressively decomposes them into subsystems and components, assigning severity classifications (e.g., minor, major, hazardous, catastrophic) to the potential consequences of their failures.
In this study, FHA is applied to the conceptual design of a hybrid-mode flying car operating under the single-pilot operation (SPO) paradigm. Given the dual-mode nature of the vehicle (ground and flight) and its unique tilt-rotor architecture, the analysis focuses on flight-critical functions during the approach and landing phases—such as control actuation, obstacle detection, and energy supply. The selection of these functions for FHA is guided by their criticality under autonomous or pilot-assisted descent and their strong coupling with the safety objectives of the restricted landing mode. This approach ensures that the subsequent fault tree modeling is rooted in functional risk prioritization rather than arbitrary component failure assumptions.
2.2. Fault Tree Analysis (FTA)
Fault tree analysis (FTA) is a top-down, deductive failure analysis method used to identify the root causes of system-level failures. It constructs a logical diagram using gates such as AND and OR to represent the causal relationships between basic events (component-level failures) and the top event (system-level failure).
For example, assuming a simple fault tree containing only two basic events, the failure probability of the top event can be calculated as follows:
and denote the probability of the top event occurring via an OR or AND gate, respectively; and represent the occurrence probabilities of the two basic events. These equations assume the basic events are independent and follow standard Boolean algebra for reliability evaluation.
The method for determining the failure probabilities of these basic events is further detailed in Section 4.3, which describes a hybrid approach based on reference data, engineering assumptions, and scenario adaptation. The corresponding parameter adjustment logic is illustrated in Figure 12, and will be elaborated through application in the case study.
2.3. Monte Carlo Simulation
Monte Carlo Simulation is a statistical method based on random sampling to estimate the probability of failure events or performance metrics. In the safety analysis of flying cars, Monte Carlo simulations were used to assess the combination probabilities of multiple failure events and evaluate the overall system reliability.
where N is the number of simulations, Xi is the i-th sampled value, and f(Xi) is the function evaluated at the i-th sample.
2.4. Basic Event Probability Adaptation Methodology
- (1)
- System Differences and Adaptation Rationale
The components in the conceptual flying car design are not fully identical to those in conventional civil aircraft. Flying cars—especially those with an e-VTOL-like architecture—tend to have simplified, lightweight, and hybridized systems, operating over shorter flight durations and lower altitudes. Therefore, while the research referred to failure rates from civil aircraft systems (primarily from Refs. [13,14,15]), it explicitly adapted these rates using a structured engineering rationale tailored to the vehicle design.
- (2)
- Parameter Adjustment Methodology
There is a stepwise adaptation workflow in Figure 12 that converts failure data from the literature into probabilities applicable to the flying car context. This process includes the following:
- Unit Conversion: Rates, originally per flight hour, are scaled to per flight rates using typical UAM mission durations (e.g., 10–20 min).
- Redundancy Adjustment: Components with high redundancy in commercial aircraft (e.g., triplex flight computers) are assumed to be simplex in single-pilot flying cars, increasing the effective probability.
- Structural Simplification: Rates are reduced where the design employs fewer moving parts, shorter mission profiles, or advanced health monitoring.
- Engineering Estimates: For components lacking public data (e.g., obstacle detection unit), failure rates are derived from analogous domains such as automotive ADAS systems or UAV performance databases.
- (3)
- Expanded Failure Probability Table with Engineering Justification
Table 3 includes a detailed rationale for each basic event probability, indicating whether the value was directly taken from the literature or adapted through engineering logic. Each entry now clearly states the following:
- The original failure rate and source (when available).
- The method of adaptation (e.g., reduced flight time, lack of redundancy, mechanical simplification).
- The final probability used in the fault tree analysis.
An example is provided as follows:
- The failure rate for the flight computer (X9) is adapted from triplex systems in airliners to a simplex architecture in the design, increasing its failure probability from 2 × 10⁻⁸ to 6.47 × 10⁻⁹ per flight.
- The propeller failure rate (X14) is downscaled from civil aircraft data to reflect the lower blade speed and higher redundancy in multirotor configurations.
- The backup system failure (X11) is derived from UAV redundancy systems and reflects the probability that both primary and backup fail to activate in the architecture.
3. SPO-Based Control Mode Design
3.1. Conceptual Design of the Cockpit Layout
This paper presents the conceptual design of the cockpit hardware for flying cars, as shown in Figure 3.
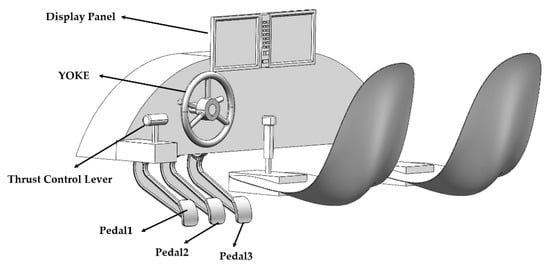
Figure 3.
Conceptual design of cockpit hardware.
As shown in Figure 3, there are three pedals in the cockpit. From left to right, facing the forward direction of the flying car, they are Pedal 1, Pedal 2, and Pedal 3. Each pedal is equipped with a triplex sensor array. The triplex sensor array operates independently to ensure redundancy and continuous sensor input. Each sensor in the array performs its function without relying on the others, enhancing system reliability by mitigating the risk of failure in case one sensor malfunctions. This independent operation is crucial for maintaining accurate data during critical flight and driving phases. The pedals convert the driver’s actions into electrical signals, which are input into the central control computer. After processing, the signals are output to various actuators to control the flying car.
The cockpit design in this study draws extensively from existing aircraft designs, incorporating elements that are well-established in the aviation industry, as shown in Figure 4 and Figure 5. This ensures that the HMI is intuitive and adaptable to the specific requirements of both flight and ground modes. The system is designed to be flexible, with the cockpit interface balancing the need for complex flight controls and the simpler operational demands of ground driving. As a result, the pilot’s adaptation process is relatively short, reducing the learning curve and easing the transition between modes.
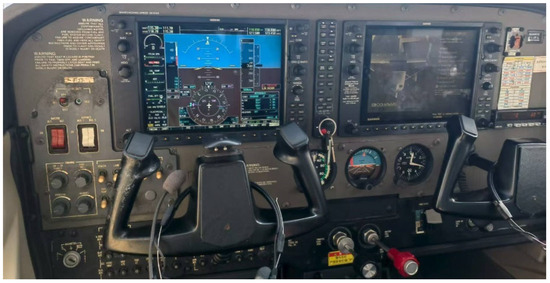
Figure 4.
Cockpit design for Cessna 172.
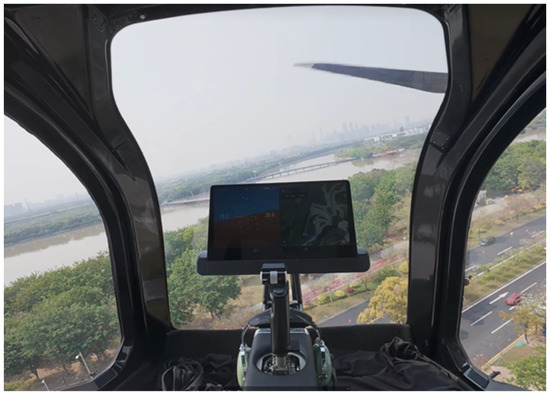
Figure 5.
Cockpit design for Xpeng ARIDGE.
The functional design diagram of the cockpit pedals and yoke is shown in Figure 6. It is important to note that the driving mode discussed in this paper encompasses both ground mode and flight mode, reflecting the dual-mode operational nature of flying cars. The illustrated design aims to ensure effective control and mode switching across both driving domains.
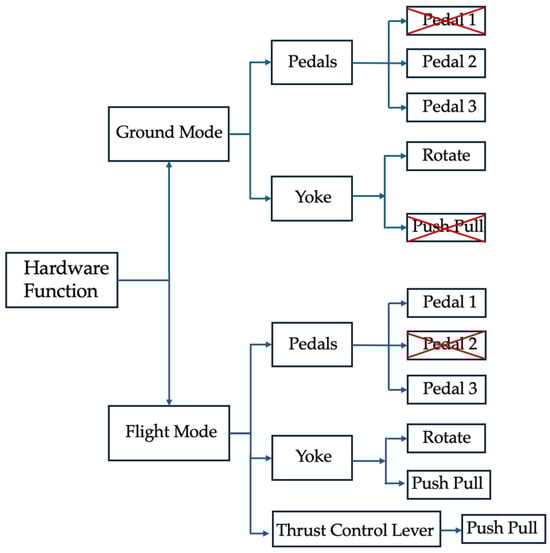
Figure 6.
Functional design of cockpit hardware.
In the ground mode, Pedal 2 is the brake, Pedal 3 is the accelerator, and the central control computer shields the signal from Pedal 1. When the driver depresses Pedal 2, the processed electrical signal controls the brake pump pressure for braking deceleration. Depressing Pedal 3 results in an electrical signal that controls the rotor motor speed for ground acceleration.
To better understand the hybrid driving and flight control logic of flying cars, it is necessary to review the basic flight control axes. The pitch refers to the nose-up or nose-down rotation of the vehicle around the lateral axis. The yaw denotes the rotation around the vertical axis, and the roll refers to the rotation around the longitudinal axis.
In the flight mode, Pedal 1 is the left rudder, Pedal 3 is the right rudder, and the central control computer shields the signal from Pedal 2. When the driver depresses Pedal 1, the central control computer processes the pedal travel signal and calculates the target yaw rate for the flying car. This drives the rudder and causes differential propeller speed to achieve yaw control. Specifically, by increasing the speed of one diagonal rotor while decreasing the speed of the opposite diagonal rotor, an imbalance in rotor torque is created, enabling the flying car to yaw left. When the driver depresses Pedal 3, the same process is applied to achieve right yaw control.
The thrust control lever is used only in flight mode for controlling the rotor power. Pushing the lever forward increases motor thrust, while pulling it backward reduces thrust.
As shown in Figure 6, the yoke is designed to operate in two distinct modes. The longitudinal axis locking mechanism enables automobile-like steering behavior in ground mode and fixed-wing aircraft-like control in flight mode. In ground mode, the yoke’s longitudinal axis is locked, allowing only rotational motion about the vertical axis. This motion corresponds to steering the front wheels left or right, analogous to conventional automotive control. In flight mode, the longitudinal axis is unlocked, enabling full pitch and roll control: pushing or pulling the yoke induces elevator deflection to change the pitch angle, while rotating the yoke clockwise or counterclockwise controls the ailerons to manage roll.
While this mode-switching mechanism simplifies the transition between driving and flying states, it may introduce potential mode confusion—a well-documented concern in human factors engineering. To address this, the proposed design incorporates several human–machine interface (HMI) safety principles. First, the current control mode is continuously displayed on the display panel, ensuring that the pilot maintains clear and immediate situational awareness. Second, before switching from ground mode to flight mode, the system requires the pilot to perform a full-range control surface check while the vehicle remains stationary. This procedure not only verifies the mechanical integrity of the control surfaces to prevent blockage or abnormal resistance but also allows the pilot to become reacquainted with the flight control logic in advance. These design considerations promote mode visibility, control consistency, and operational readiness, thereby reducing the risk of mode confusion and supporting the proposed configuration as a safe and viable baseline for further refinement.
3.2. Hybrid Driving Mode Design
This paper adopts the single-pilot operation concept to design a hybrid driving mode for flying cars, as shown in Figure 7. The hybrid drive mode design includes a ground mode and a flight mode.
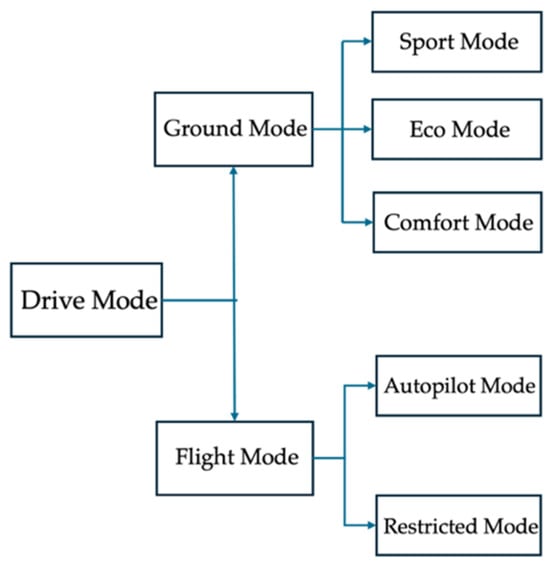
Figure 7.
Hybrid driving mode design.
The single-pilot operation driving mode design includes flight mode organization, flight mission coordination, and human–machine interaction decision-making [16,17], and can be divided into two major parts: the ground mode and the flight mode. The functions of the ground mode are shown in Table 1.

Table 1.
Ground mode functions.
In Comfort Mode, the throttle pedal power mapping curve is flattened, which means that the relationship between the pedal’s position and the engine’s power output becomes more linear and less sensitive. This adjustment reduces the acceleration response, ensuring a smoother transition between pedal inputs and vehicle behavior. This contributes to an overall more comfortable driving experience, making it more suitable for leisurely driving and reducing fatigue on long trips.
The flight mode of the flying car consists of the Restricted Mode and Autopilot Mode, with specific functions outlined as follows.
Restricted Mode is used during critical flight phases (take-off, landing, and flights below the safe altitude). In this mode, the flying car is directly controlled by the pilot, with the system only providing overspeed protection and obstacle avoidance. For fixed-wing flying cars, overspeed protection involves limiting the flight speed to be above the stall speed and below the maximum structural cruising speed. For rotorcraft flying cars, the flight speed is limited to below the maximum structural cruising speed. When the flying car exceeds the speed limit, the system will automatically adjust the engine power output. When the distance between the flying car and an obstacle is less than the set safe distance, the system will automatically intervene and take corresponding obstacle avoidance actions. This enhances the safety of the flying car.
For passenger comfort, referring to the Airbus A320 FCOM regulations regarding manual cabin pressure control, the driving system was designed with a climb rate envelope limitation. For example, when the flying car changes altitude, it follows the civil aviation passenger aircraft’s cabin altitude change rate restrictions: the climb rate should not exceed 152.4 m/min (500 ft/min) and the descent rate should not exceed 91.44 m/min (300 ft/min) [18]. This is to prevent passengers from experiencing ear discomfort, such as pressure buildup or “popping ears” due to excessive pressure differences between the inner and outer ear during ascent or descent. However, these improvements in comfort are carefully balanced with the requirement to maintain stringent safety standards, ensuring that no compromise to safety occurs during the flight.
Autopilot Mode is used during the cruising phase of a flight. The pilot is responsible for monitoring the flying car’s operational status, inputting target navigation parameters (such as altitude, speed, heading, and navigation station information), and specifying the destination. The Autopilot module, under the protection of the driving system, autonomously handles trajectory planning, attitude control, and obstacle avoidance, ensuring that the aircraft completes the scheduled flight mission safely and stably. This driving mode reduces the pilot’s workload and minimizes the likelihood of unsafe incidents caused by pilot fatigue and errors [19].
4. Landing Control Reliability Modeling and Analysis
4.1. Fault Mode Analysis Based on FHA (Functional Hazard Analysis)
Since the approach and landing phase is the stage with the highest incidence of aviation accidents [11], a focused safety analysis of the landing phase of the flying car in flight mode was conducted. The restricted mode provides critical overspeed protection and obstacle avoidance warning functions during key flight phases. This chapter takes the restricted driving mode and its landing control unit in the flight mode as examples, applying both FHA (Functional Hazard Analysis) and FTA (Fault Tree Analysis) methods for a safety analysis of the driving mode design.
With reference to the guidelines and methods of the SAE ARP4761 civil aircraft systems and the equipment safety assessment process, the following definitions for impact levels are provided:
- (1)
- Catastrophic Fault: Leads to the destruction of the flying car and/or multiple fatalities, requiring a failure probability of less than 10−9 per flight hour.
- (2)
- Hazardous Fault: Poses a significant risk to the safety of the flying car or personnel, requiring a failure probability of less than 10−7 per flight hour.
- (3)
- Major Fault: Significantly increases the workload of the crew or has a significant impact on mission completion, requiring a failure probability of less than 10−6 per flight hour.
- (4)
- Minor Fault: Slightly increases workload with minor impact on mission completion.
- (5)
- No Safety Effect: No impact on safety.
The flying car’s restricted driving mode system was taken as the object of analysis for a System Function Hazard Analysis (SFHA), and the corresponding system function hazard analysis report table [20] is provided, as shown in Table 2.
Table 2.
Restricted Mode FHA [20].
It is truth that factors like altitude, speed, and environment will play a role in real-world applications; however, for the scope of this study, the fault status-based approach is adequate and provides a methodology for safety risk assessments during critical flight phases. In the future, further development of the risks related to altitude, speed and environment will be conducted.
In the current study, risk factors were considered without developing a detailed wind resistance evaluation due to the variability in aircraft designs. For a more comprehensive analysis of environmental factors like wind gusts, future work could incorporate the methodologies outlined in the standard GBT 38930-2020, “Requirements and Test Methods of Wind Resistance for Civil Small and Light Unmanned Aircraft Systems” [21].
4.2. Fault Tree Modeling of the Restricted Mode
This study takes the landing control unit in the restricted driving mode of a flying car as an example for fault tree analysis, aiming to assess whether this driving mode meets safety standards. Before constructing the fault tree, the functions and structure of the system should first be determined, and the failure modes should be analyzed. The landing system control unit is specifically used in the restricted driving mode to control the landing site and approach process, functioning as a unit for manual control. Under the operation of a highly skilled pilot, the flying car can achieve safe and precision flight landing control for the designated approach to the descent profile and landing site [22].
In the restricted mode, there are built-in protective functions, such as speed limits and obstacle avoidance, to ensure safety during these critical flight phases. From a control logic perspective, the pilot’s inputs in this mode do not directly influence the actuators (such as motor speeds or control surface deflections). Instead, the pilot’s commands are sent to the flight control computer, which processes these inputs and translates them into the necessary actuator commands.
For example, the control stick movement in this mode essentially represents a height command; the flight control system then calculates the actuator inputs required to achieve the target height. Within this control loop, there are additional layers of stability enhancement, obstacle avoidance, and speed limit functions that operate in parallel to ensure safe and stable flight operations.
This approach enables a balance between pilot involvement and automated flight control, reducing the risks associated with proximity to hazards while maintaining flexibility in pilot oversight.
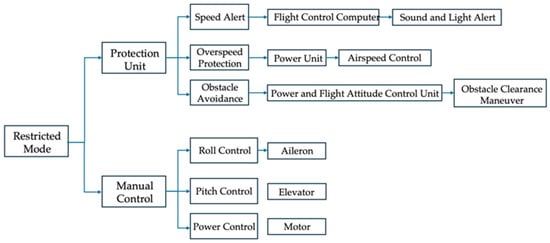
Figure 8.
Functional implementation of restricted mode.
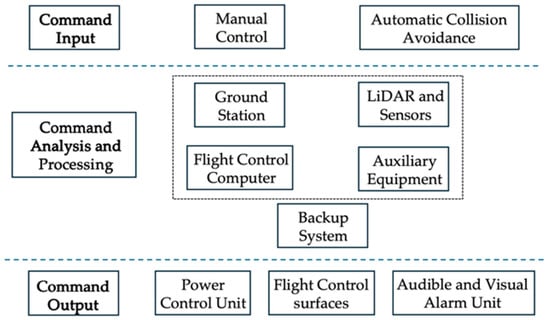
Figure 9.
Landing control unit structure.
As shown in Figure 9, the landing control unit consists of three main parts—Command Input, Command Analysis and Processing, and Command Output—with a backup system included in the Command Analysis and Processing part as a redundancy [23,24]. These three parts correspond to the three intermediate events in the first level of the fault tree, and subsequent middle- and lower-level failure events can be further branched from this.
In the flying car design, the landing phase occurs entirely under flight mode, specifically leveraging eVTOL capabilities.
During this stage, fuel pump and battery systems are responsible for powering either combustion-based lift units or electric rotors, depending on the hybrid propulsion configuration. The failure of either could lead to insufficient thrust or power instability during descent.
LiDAR sensors are deployed for ground proximity detection and obstacle avoidance, which are especially important for urban landing scenarios with a complex terrain or rooftop pads.
The generator provides backup electric power, and the flight computer performs critical control logic to maintain the vehicle attitude and descent rate.
These components are therefore directly involved in ensuring a safe, stabilized landing takes place, and their failures are relevant to the fault tree analysis presented below.
Based on the structure of the landing control unit in Figure 9, a fault tree is constructed for the landing control unit, as shown in Figure 10. The fault tree for the backup system failure is shown in Figure 11.
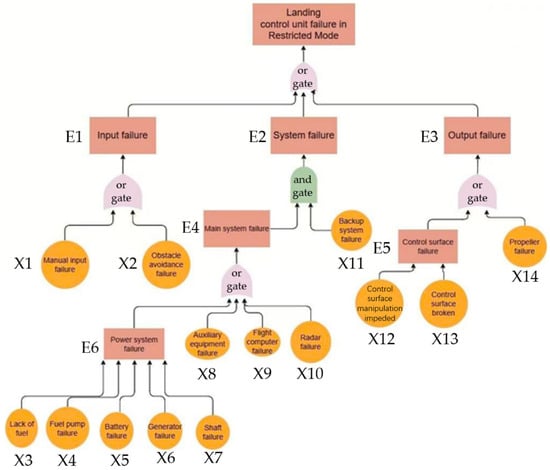
Figure 10.
Fault tree for the landing control unit.
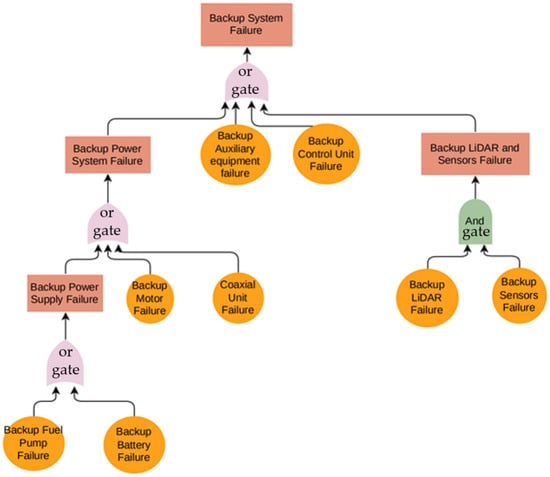
Figure 11.
Fault tree for backup system failure.
In the fault tree, the And Gate suggests that the output event will occur only when all input events happen simultaneously. The Or Gate suggests that the output event will occur when any one of the input events occurs. The orange rectangular box represents an intermediate event. The yellow circular box represents a basic event.
Any failure—“input failure, system failure, or output failure”—could potentially lead to the failure of the landing control unit, so these three factors are treated as intermediate events in the first layer of the fault tree, transmitted to the top event via an OR gate.
For input failure, any event occurring that corresponds to either manual input failure or obstacle avoidance input failure will lead to input failure.
System failure will only occur when both the main system and the backup system fail simultaneously, so an AND gate is used to connect them.
The main system consists of a power system, auxiliary equipment, a flight computer, and a radar. Any failure in any of these components will cause a main system failure, so OR gates are used to connect them.
Within the power system, any event occurring regarding a lack of fuel, fuel pump failure, battery failure, generator failure, or shaft failure will cause a power system failure, so OR gates are used to connect these factors.
Regarding output failure, any event occurring in either the control surface or the propeller will lead to output failure, so OR gates are used to connect them. Both control surface manipulation being impeded and control surface breakage will lead to control surface failure, so OR gates are used to connect these.
Specifically, the failure mode involving complete fuel exhaustion is assumed to be extremely rare and mitigated at the vehicle management system level, which includes energy monitoring and pre-warning functions. The fault tree does account for events like power system failure, but the restricted mode requires at least minimal residual power to operate, such as control surface actuation being maintained and attitude stabilization occurring during descent.
In future work, the research will focus on extending the restricted mode definition to include energy-aware emergency landing logic, such as autorotation or gliding behavior for applicable platforms, and further define the minimum power thresholds for controlled descent.
Any failure in “Backup Power System, Backup Auxiliary Equipment, Backup Control Unit, Backup LiDAR and Sensors“ could lead to a Backup System failure, so these four factors are treated as intermediate events in the first layer of the fault tree and are transmitted to the top event via an OR gate. For the Backup Power System, any event occurring that leads to Backup Power Supply failure, Backup Motor failure, or Coaxial Unit failure will lead to Backup Power System failure, so OR gates are used to connect them.
For Backup Power Supply, any event occurring that leads to either backup Fuel Pump failure or Backup Battery failure will lead to Backup Power Supply failure, so OR gates are used to connect them.
For Backup LiDAR and Sensors, the system will only fail when both the backup LiDAR and Backup Sensors fail simultaneously, so an AND gate is used to connect them. To improve environmental perception during low-altitude operations, especially in the restricted landing mode, a LiDAR sensor is integrated to provide precise obstacle detection. This enhances the vehicle’s ability to avoid nearby structures or hazards during landing, particularly when vision sensors or GNSS signals are compromised.
4.3. Fault Tree Analysis of the Restricted Mode
By comprehensively referring to the order of magnitude of failure probabilities for relevant systems in civil aircraft [13,14,15], and based on the results of the Preliminary System Safety Assessment (PSSA), approximate occurrence probabilities for each basic event were determined, as shown in Table 3.
Table 3.
Probability of basic events [13,14,15].
These studies provide detailed failure mode and rate data for aircraft systems that are functionally similar to those in the conceptual flying car model. Since the system does not replicate certified civil aircraft configurations, the failure rates were not directly copied but carefully adapted through functional equivalence, adjusted for differences in redundancy, operational cycles, and mission profile.
The stepwise adaptation workflow in Figure 12 represents the methodology used to convert failure data from the literature into probabilities applicable to the flying car context.
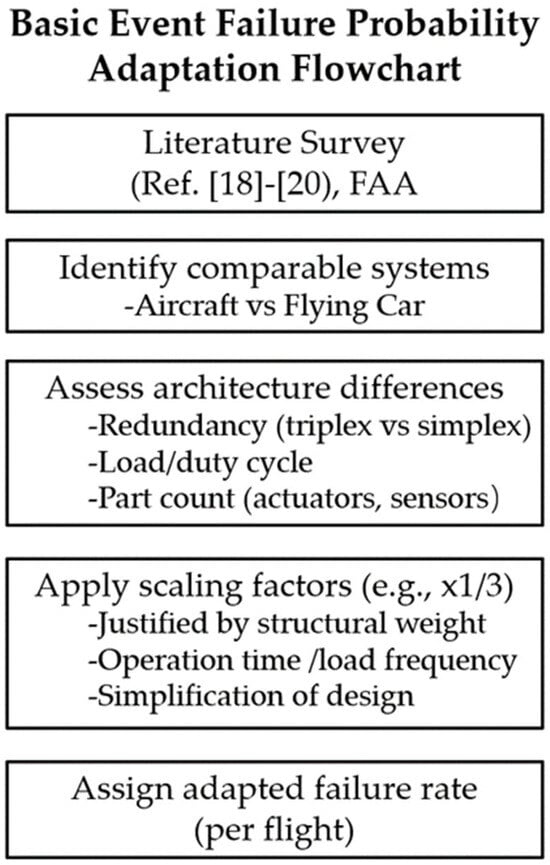
Figure 12.
Basic event probability adaptation flowchart [13,23,24].
According to the principles of the Fussell–Vesely downward algorithm and Boolean logic operations, the minimum cut sets were obtained: {X1}, {X2}, {X3, X11}, {X4, X11}, {X5, X11}, {X6, X11}, {X7, X11}, {X8, X11}, {X9, X11}, {X10, X11}, {X12}, {X13}, {X14}. By referring to the probabilities of each basic event, the occurrence probability of the top event and those of the intermediate events were calculated using Formula (4). In the fault tree, the calculation for the OR gate uses a sum, while the calculation for the AND gate uses a product. For the fault tree in Figure 10, let us assume the probability of the top event occurring is PE. The results are presented in Table 4.
Table 4.
Occurrence probabilities of the fault tree top event and intermediate events.
The calculation shows that the probability of the top event occurring is approximately 1.98 × 10⁻⁸ per flight, which meets the probability requirement for manual control failure in the landing phase restricted mode system (2.8 × 10⁻⁷ per flight).
5. Numerical Validation and Analysis of Influencing Factors
5.1. Structural Importance Evaluation
For any basic events X1,…,Xn, each event has only two possible states—“occurred” and “not occurred”—which can be defined as 1 and 0, respectively. When the state of one node is determined, the remaining n − 1 nodes have 2n−1 possible combinations. Therefore, for the k-th basic event Xk among n basic events, the structural importance Iφ(k) can be calculated using Formula (5):
In Formula (5), ∑φ(1kx) represents the number of scenarios in which the basic event Xk and the top event occur simultaneously (i.e., failures caused by the occurrence of this basic event), while ∑φ(0kx) represents the number of scenarios in which the basic event Xk does not occur but the top event still occurs (i.e., failures caused by other basic events).
The structural importance of basic events in the fault tree are presented in Table 5.
Table 5.
Structural importance of basic events.
According to the structural importance calculation results, the events “manual input failure”, “obstacle avoidance failure”, “control surface manipulation impeded”, “control surface broken”, and “propeller failure” exhibit a relatively high structural importance. The results indicate that meticulous pre-flight inspections of the control surfaces and propellers are crucial for ensuring flight safety. In this context, the effectiveness of overspeed protection and obstacle avoidance functions under the restricted mode is further emphasized, reinforcing the rationale and necessity of the restricted mode’s functional design.
5.2. Numerical Validation
To verify the accuracy of the quantitative analysis and calculation of the top event and intermediate event probabilities in the fault tree, this study conducted 1010 simulation experiments based on Monte-Carlo simulation. A comparison of the simulation results and the theoretical calculation results is shown in Table 6.
Table 6.
Comparison between Monte-Carlo simulation and theoretical calculation results.
Several factors may contribute to the difference between theoretical probabilities and the Monte Carlo simulation results, particularly for low-probability or composite events. Although both methods generally yield results of the same order of magnitude, notable relative deviations are observed in events such as “control surface failure” (E5, 12.6%) and “main system failure” (E4, 11.1%). These differences stem from three main factors: the statistical noise inherent to finite-run simulations, meaning that E2 with <10−16 probability may yield zero counts; threshold sensitivity, where composite events like E5 involve multiple failure modes with varying detectability in simulation logic; modeling discrepancies, where the simulation accounts for time-dependent or cascading behaviors, unlike the static assumptions in analytical cut set analyses. To reduce such inconsistencies, the research increased the number of simulation runs from 108 to 1010. Despite localized deviations, the overall agreement at the top event level (7.6% difference) supports the theoretical model as a conservative and valid tool for system reliability estimation.
6. Conclusions
This paper presents a hybrid control scheme for eVTOL-like flying cars based on the SPO concept, innovatively proposing a cockpit hardware design applicable to both driving and flying modes. A restricted driving mode tailored for take-off and landing phases and an autonomous driving mode designed for the cruise phase are introduced. In accordance with the SAE ARP4761 industry standard, a Functional Hazard Assessment (FHA) was conducted of the designed driving modes, discussing potential fault types and hazard levels, and specifying fault probability requirements.
Taking the landing phase as an example, a fault mode analysis (FMA) and fault tree analysis (FTA) were performed of the restricted driving mode, with particular attention to factors sensitive to flight safety. A fault probability analysis of the landing control unit under the restricted driving mode was carried out. The results indicate that the design meets the safety requirements, preliminarily validating the feasibility of the proposed scheme. A Boolean logic compilation of the fault trees was implemented, and the results were cross-verified between Monte-Carlo simulation and theoretical probability calculations. This study provides methodological and procedural references for the safety evaluation of future flying car driving mode designs.
At present, there is no fully developed digital model of the flying car, which presents a limitation in the fault analysis. The basic events in the fault analysis are still relatively complex, being described at the subsystem level. To improve the accuracy and depth of future analyses, the research will break down these events into more fundamental component-level failure events. This would allow for a more granular understanding of potential system failures and enhance the robustness of safety assessments.
Future research may focus on safety verification under complex flight scenarios and further redundancy design for flying cars. Additionally, an optimization of the flight control systems to mitigate human operational errors should be pursued to enhance both safety and practicality. With ongoing technological advancements, flying cars are expected to be integrated into daily life soon, contributing to the development of a low-altitude economy and opening new avenues for global economic growth.
Author Contributions
Conceptualization, W.Z. and Y.M. methodology, J.L. validation, H.P. writing—original draft preparation, J.L. writing—review and editing, Y.M. funding acquisition, Y.M. All authors have read and agreed to the published version of the manuscript.
Funding
This research was funded by Zhiyuan Laboratory Open Fund, grant number ZYL2024014.
Data Availability Statement
The datasets used in this research are not publicly available, as they originate from proprietary airline operations protected by confidentiality agreements. Therefore, access to the data cannot be granted.
Conflicts of Interest
The authors declare no conflicts of interest. The funders had no role in the design of the study; in the collection, analyses, or interpretation of data; in the writing of the manuscript; or in the decision to publish the results.
References
- Kasliwal, A.; Furbush, N.J.; Gawron, J.H.; McBride, J.R.; Wallington, T.J.; De Kleine, R.D.; Kim, H.C.; Keoleian, G.A. Role of flying cars in sustainable mobility. Nat. Commun. 2019, 10, 1555. [Google Scholar] [CrossRef] [PubMed]
- Marzouk, O.A. Urban air mobility and flying cars: Overview, examples, prospects, drawbacks, and solutions. Open Eng. 2022, 12, 662–679. [Google Scholar] [CrossRef]
- Boy, G.A. Requirements for single pilot operations in commercial aviation: A first high-level cognitive function analysis. In Proceedings of the Complex Systems Design and Management Conference, Paris, France, 12–14 November 2014; pp. 227–234. [Google Scholar]
- Myers, P.L.; Starr, A.W. Single Pilot Operations IN Commercial Cockpits: Background, Challenges, and Options. J. Intell. Robot. Syst. 2021, 102, 19. [Google Scholar] [CrossRef]
- Comerford, D.; Brandt, S.L.; Lachter, J.B.; Wu, S.C.; Mogford, R.H.; Battiste, V.; Johnson, W.W. NASA’s single-pilot operations technical interchange meeting: Proceedings and findings. In Proceedings of the Technical Interchange Meeting, Moffet Field, CA, USA, 10–12 April 2012. [Google Scholar]
- European Commission. Advanced Cockpit for Reduction of Stress and Workload (ACROSS). EU FP7 Project No. 314501, 2012–2015. Available online: https://cordis.europa.eu/project/id/314501 (accessed on 5 August 2025).
- Driscoll, K.R.; Roy, A.; Ponchak, D.S.; Downey, A.N. Cyber safety and security for reduced crew operations (RCO). In Proceedings of the 2017 IEEE Aerospace Conference, Big Sky, MT, USA, 4–11 March 2017; pp. 1–15. [Google Scholar] [CrossRef]
- Liu, M.; Li, D.; Lv, Y.; Guo, H.; Cao, Y.; Liu, Q. Towards safety: A dual-mode tracking control on roads for the flying automobile with limited preview information. In Proceedings of the 2024 8th CAA International Conference on Vehicular Control and Intelligence (CVCI), Chongqing, China, 25–27 October 2024; pp. 1–7. [Google Scholar] [CrossRef]
- Pan, G.; Alouini, M.-S. Flying Car Transportation System: Advances, Techniques, and Challenges. IEEE Access 2021, 9, 24586–24603. [Google Scholar] [CrossRef]
- Li, T.; Ye, B.; Wang, D.; Cao, H. A Preliminary Research on Zonal Safety Analysis Method for Aircraft Complex Systems by Using Virtual Reality and Augmented Reality. In Complex Systems Design & Management; Springer: Cham, Switzerland, 2021. [Google Scholar] [CrossRef]
- Elisabeth, M. Airplanes Statistical Summary of Commercial Jet Airplane Accidents Worldwide Operations 1959–2005; Boeing Company: Seattle, WA, USA, 2006. [Google Scholar]
- SAE ARP4761; Guidelines and Methods for Conducting the Safety Assessment Process on Civil Airborne Systems and Equipment. Available online: https://www.sae.org/standards/content/arp4761/ (accessed on 5 August 2025).
- Ke, Y.; Li, Y.; Cao, Y.; Zhang, X. Research on model-based safety analysis of flight control system. Syst. Eng. Electron. 2021, 43, 3259–3265. [Google Scholar] [CrossRef]
- Lu, Z.; Zhong, L.; Haijing, S.; Li, D.; Yuting, W.; Jia, Z. Safety analysis for fly-by-wire system based on fault injection model. Chin. J. Aeronaut. 2023, 44, 327329. [Google Scholar] [CrossRef]
- Wang, K.; Xuan, Y.; Tian, H. Research on System Safety Analysis of Aircraft Based on Dynamic FaultTree. In Proceedings of the 9th Youth Science and Technology Forum of the Chinese Society of Aeronautics and Astronautics, Xi’an, China, 17–19 November 2020; pp. 933–948. [Google Scholar]
- Dong, L.; Chen, H.; Chen, X.; Zhao, C. Distributed multi-agent coalition task allocation strategy for single pilot operation mode based on DQN. Chin. J. Aeronaut. 2023, 44, 180–195. [Google Scholar]
- Zhang, J.; Zeng, R. Mode Design and Test for Commercial Aircraft Single-pilot Operations. Aeronaut. Sci. Technol. 2020, 31, 42–49. [Google Scholar] [CrossRef]
- Airbus. Flight Crew Operating Manual for the A320; Airbus: Toulouse, France, 2018; pp. 10–14. [Google Scholar]
- Chen, Y.; Luo, Y.; Wang, M.; Zhong, K.; Xiao, G.; Wang, G. An efficient algorithm to mine maximal differential biclusters for single pilot operations task synthesis safety analysis. Chin. J. Aeronaut. 2022, 35, 400–418. [Google Scholar] [CrossRef]
- Ke, R. Research on the Safety Analysis Method of Aircraft Fly-By-Wire Systems. Master’s Thesis, Civil Aviation University of China, Tianjin, China, 2009. [Google Scholar]
- GB/T 38930-2020; Requirements and Test Methods of the Capability of Wind Resistance for Civil Small and Light Unmanned Aircraft System. Standards Office-Peoples Republic of China: Beijing, China, 2020.
- Song, K.; Yeo, H.; Moon, J.-H. Approach control concepts and optimal vertiport airspace design for Urban Air Mobility (UAM) operation. Int. J. Aeronaut. Space Sci. 2021, 22, 982–994. [Google Scholar] [CrossRef]
- Yang, C.; Gao, J. Reliability Analysis of UAV Based on Fault Tree Analysis. Environ. Technol. 2022, 40, 122–126. [Google Scholar]
- Xu, W.; Zhang, Y. Design and Implementation of Safety Analysis Tool Based on Avionics System Architecture Model. J. Comput. Sci. Technol. 2016, 43, 536–541. [Google Scholar]


Disclaimer/Publisher’s Note: The statements, opinions and data contained in all publications are solely those of the individual author(s) and contributor(s) and not of MDPI and/or the editor(s). MDPI and/or the editor(s) disclaim responsibility for any injury to people or property resulting from any ideas, methods, instructions or products referred to in the content. |
© 2025 by the authors. Licensee MDPI, Basel, Switzerland. This article is an open access article distributed under the terms and conditions of the Creative Commons Attribution (CC BY) license (https://creativecommons.org/licenses/by/4.0/).