Abstract
Traditional anti-icing/de-icing systems, i.e., thermal and pneumatic, in most cases require a power consumption not always allowable in small aircraft. Therefore, the use of passive systems, able to delay the ice formation, or reduce the ice adhesion strength once formed, with no additional energy consumption, can be considered as the most promising solution to solve the problem of the ice formation, most of all, for small aircraft. In some cases, the combination of a traditional icing protection system (electrical, pneumatic, and thermal) and the passive coatings can be considered as a strategic instrument to reduce the energy consumption. The effort of the present work was to develop a superhydrophobic coating, able to reduce the surface free energy (SFE) and the work of adhesion (WA) of substrates, by a simplified and non-expensive method. The developed coating, applied as a common paint with an aerograph, is able to reduce the SFE of substrates by 99% and the WA by 94%. The effects of both chemistry and surface morphology on the wettability of surfaces were also studied. In the reference samples, the higher the roughness, the lower the SFE and the WA. In coated samples with roughness ranging from 0.4 and 3 µm no relevant variations in water contact angle, nor in SFE and WA were observed.
1. Introduction
Typically, the presence of tiny pieces of ice or supercooled liquid water in the clouds, which remain liquid below zero and suddenly turn to ice after the impact with the aircraft surfaces, are the main sources of ice deposition during a flight. The presence of ice on surfaces alters the airflow over the wing and tail, and then reduces the lift force that keeps the plane in the air. This potentially causes aerodynamic stall, a condition that can lead to a temporary loss of control of the aircraft. In order to prevent or reduce the ice formation or alternatively to remove the ice once it was formed, anti-icing and de-icing systems are usually adopted. Currently the thermal and pneumatic types represent the most largely employed systems. In details, the thermal system melts the ice accretion or prevents the ice from forming by the application of heat on the protected surface of the wing. The heat is generated by the hot air “bled” off the jet engine into piccolo tubes routed through wings, tail surfaces, and engine inlets. The spent bleed air is then exhausted through holes in the lower surface of the wing. Similarly, the electro-thermal systems use resistive circuits buried in the airframe structure to generate heat when a current is applied. The heat can be generated continuously to protect the aircraft from icing (anti-ice mode), or intermittently to shed ice as it accretes on key surfaces (de-ice), the latter being generally preferred due to the lower power consumption. Instead, the pneumatic de-ice boot consists of a rubber sheet bonded to the leading edge of the airfoil: when the ice builds up on the leading edge, an engine-driven pneumatic pump inflates the rubber boots, and then the ice is cracked and should fall off the leading edge of the wing. Additionally, some innovative systems are being developed, e.g., the electro-mechanical de-icing systems which use a mechanical force, generated for instance by actuators, to knock the ice off the flight surface, or the weeping wing system, which releases a glycol-based chemical onto the wing surface through small orifices which causes the detachment of ice. However, these methods can be inefficient, environmentally unfavorable, expensive and time consuming [1]. Thus, it would be advantageous if surfaces could passively prevent the ice formation and facilitate ice removal. In this contest, the superhydrophobic coatings, applied as usual paint, owing to their extraordinary water repellency, and not requiring additional energy consumption, can be viewed as excellent candidates for icephobicity in this area [2,3]. This is because, ultrahigh θrec, typical of nanostructured superhydrophobic surfaces, means low ice adhesion strength [4,5]. Subsequently, if supercooled liquid water freezes when it impacts the solid surface of an aircraft, the resulting ice can be shed, taking advantage of external forces, such as aerodynamic forces, to overcome ice-surface adhesion forces [6]. Evidently, the efficiency of these coatings as an anti-icing passive method largely depends on the different scenarios in which the ice may form [1]. In some cases, therefore, a combination of a traditional icing protection system and the superhydrophobic coatings could be seen as a strategic instrument able to assure a high efficiency in a wide range of environmental conditions.
In the last decade, a huge body of literature concerning the development of superhydrophobic and icephobic coatings able to delay the ice formation [7], or reduce the ice adhesion strength once formed, has been produced [8,9,10,11,12,13,14,15]. A shared strategy is to create surfaces with low surface free energy and, contemporary, micro-nanoscopic rough structures. In this regard, it was found that the icing probability was reduced to zero with particle diameters ranging between about 30 and 70 nm [16]. Some authors achieved this goal by using etching and/or high temperatures [9,11], or complex fabrication techniques [12,13,14,15,16,17], which are often limited by the substrate type and geometry that can be successfully coated [18].
The effort of the present work was to develop a superhydrophobic coating for metallic substrates with a simplified and non-expensive method, which could be employed as a usual paint able to prevent/reduce the formation of ice, especially on small aircraft [19]. The newly formulated superhydrophobic coating consists of nanostructured layers able to generate hierarchical micro/nano-structured roughness, and reduce the surface free energy, which as previously declared, are the two main factors useful to making a superhydrophobic surface. The effect of the substrates’ roughness on the surface properties of coated and uncoated samples was also studied, and then correlated to the wettability of samples, in order to identify and separate the morphological and the chemical contributions.
This work is being developed in the framework of the Clean Sky 2 ongoing SAT-AM (More Affordable Small Aircraft Manufacturing) project, whose main goal is the investigation of new technologies for a future small aircraft able to fly with low fuel consumption, low noise levels and needing low quantities of raw material in its life cycle. The reference vehicle for this project is the M28 designed and manufactured by Consortium Partner Polskie Zakłady Lotnicze (PZL), Mielec (PL). It is a commuter category 19 passenger, twin-engine high-wing cantilever monoplane of all-metal structure, with twin vertical tails and a robust tricycle non-retractable landing gear, featuring a steerable nose wheel to provide for operation from short, unprepared runways where hot or high-altitude conditions may exist. The M28 is best suited for passenger and/or cargo transportation and is certified under EU CS-23 and USA FAR 23 requirements.
2. Materials and Methods
The developed superhydrophobic coating was prepared starting from the formulation described in a previous work [19] and slightly modified in order to improve its durability. In this regard, other details about the performed changes cannot be disseminated in this manuscript. Once prepared, several layers of the developed coating were applied with an aerograph on substrates representative of the M28 air intake. The dehumidified air was pressured at three bar; whereas the other application parameters, such as the layers’ number, the curing temperature and the distance between the aerograph and samples were optimized in order to guarantee uniformity in the coating’s thickness and weight.
The substrate samples, 5 × 5 cm2 in dimensions, made of stainless steel 12H18N10T (same composition of the M28 air intake), and having roughness ranging from 0.7 to 4.6 µm, were provided by METROL (a partner of the Clean Sky project). The effect of the substrate roughness on the final properties of the coating in terms of wettability and adhesion of the coating on the substrate were studied.
Roughness of substrates before and after the application of the coating was measured by employing a SAMA SA6260 surface roughness meter. Roughness measures, performed according to the ISO 4288 [20], were reported as Ra, which represents the arithmetic average of the absolute values of the profile height deviations from the mean line. ID samples was correlated to the correspondent roughness values in Table 1.

Table 1.
ID samples with roughness ranging between 0.7 and 4.6 µm.
Contact angles (CA) were calculated according to Young’s equation [21] (see Figure 1):
where θ is the contact angle, and are the liquid and solid surface free energy, respectively, whereas is the solid/liquid interfacial free energy. The schematic illustration of the equilibrium among involved forces according to the Young equation is shown in Figure 1.
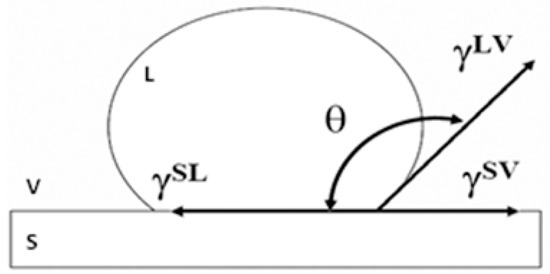
Figure 1.
Schematic illustration of an ink drop on a solid substrate with the surface free energy and the contact angle as described by Young’s equation [21].
The contact angle measurements were performed at room temperature in compliance with the ASTM D7490–13 [22] standard, using water (H2O) and diiodomethane (CH2I2). The Surface Free Energy (SFE) was calculated according to the Owens Wendt (OW) method [23,24], for which the surface energy of a solid is the sum of two components, a dispersive and a polar one. The dispersive component theoretically accounts for the Van der Waals and other non-site specific interactions between the surface and the applied liquid, whereas the polar component accounts for the dipole-dipole, dipole-induced dipole, hydrogen bonding, and other site-specific interactions [25]. The polar and dispersive components of the reference liquids are listed in Table 2. Tests were carried out by depositing ten drops of 3 µL of each liquid on the sample surface.
Table 2.
Surface tension components of the reference liquids [26].
According to the OW method [23], the interfacial solid/liquid energy can be evaluated as:
which, combined with the Young equations, gives the following:
Therefore, the polar () and dispersive () components of the solid SFE are given as solution of the following non-linear system:
where , , , and , are the SFE components of the two reference liquids and the corresponding contact angles between the solid and the liquids, respectively.
Although the SFE’s components can be known through the literature (Table 2), the contact angles have to be experimentally evaluated through several measures. That determines a stochastic nature of the contact angles and therefore of the solutions of the equation system (4).
So, to assess the SFE problem, a third reference liquid, i.e., the Formamide (HCONH2), was introduced in order to reformulate the initial problem in terms of the following nonlinear programming problem:
where a Gaussian distribution of the contact angles was assumed in order to statistically characterize them through the mean value (, , ) and the standard deviation ().
The stated optimization problem allowed determining the contact angles that identify the SFE components, which minimize the third Equation (5), taking into account the measure variability and the constitutive Equations (4) of the considered liquids.
Applying the described method to the reference liquids reported in Table 2, the constraints (5a) were linearized simplifying the complexity of the problem that has been solved in Matlab/Simulink environment. The developed Matlab tool provides (as output) the values of the three best contact angles , along with the values of the polar and dispersive components of the solid’s SFE.
As an additional crosscheck, the determined optimal contact angles, namely, , instead of the mean values of the experimentally measured angles measured with Water and Diiodomethane, were introduced in the widespread linearized equations [19,20,21,22,23,24,25,26]:
and the required polar and dispersive components of the solid SFE, were obtained as the graphic solution of the equations system (6) through the intercept point between the two straight line ( and ) identified by the following angular coefficients and points:
Once calculated the polar and dispersive components, the required solid SFE was assessed, as:
whereas the Work of Adhesion (WA) can be calculated as:
or equally as:
Finally, the Surface Polarity (SP) was calculated as:
The Young Equation (1) is valid for smooth surfaces or substrate having very low roughness, but when the roughness is too high to be neglected, the equation should be corrected taking into account the actual surface morphology. Two different models can be useful to describe the wetting of textured surfaces, i.e., the Wenzel and Cassie–Baxter (Figure 2a,b respectively) models. In details, the Wenzel model [27,28] proposed a correction factor “r” for contact angle on rough surfaces, which is equal to the ratio of rough interfacial area over flat interfacial area under the droplet. Substituting the roughness ratio factor ”r” in the Young’s Equation (1), one can obtain the Wenzel’s equation [28], i.e.,
where θ* and θ are the contact angles of a droplet on a rough surface and on the corresponding smooth surface, respectively. Wenzel’s model assumes no air-trapping under droplet, which may not necessary be true.
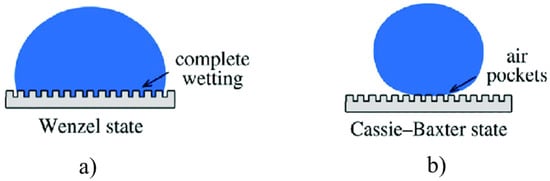
Figure 2.
(a) Wenzel and (b) Cassie–Baxter models useful to describe the wetting of textured surfaces.
On the contrary, the Cassie–Baxter model [29] allows to estimating the contact angle on rough surface with air-trapping, through the following equation:
where φS is the area ratio of liquid-air interface to the whole interface; θ* and θ are the contact angles with and without considering air-trapping.
Cutting and tape test were carried out, according to the ASTM D 3359-09 standard [30], by making a grid incision with a specific cutter on the coated samples and then by applying an adhesive tape to cover the cut area. The test adhesive was vigorously removed and the involved area was inspected. According to the ASTM D 3359-09 [29], the test passes if the area involved in detached flakes of coating at intersections is less than 15%.
Sample morphology, measurements of nanoparticle size and of coating thickness, were carried out using a field emission SEM Tescan Mira3 (Tescan Orsay Holding, Brno-Kohoutovice, Czech). Samples were observed in as-realized conditions, without metallization on the observed surface.
Surface 3D morphology and the corresponding roughness were assessed by using the laser profilometer Ametek Talyscan 150. The scanning area for 3D surface reconstruction was 40 × 40 mm2 (800 profiles with 5 microns resolution), acquired with a scanning velocity of 10,500 microns/s.
3. Results and Discussion
3.1. Substrates’ Roughness of Substrates
Roughness of substrates measured with the SAMA SA6260 surface roughness meter, before and after the application of the coating, were compared in Figure 3. It highlights that, in general, the application of the coating reduces the original roughness. This especially for samples 1–6, for which the values of the coated samples’ roughness vary in the range 0.4–0.6 µm, in spite of the substrates’ roughness ranging from 0.7 to 1.5 µm, whereas, for samples 7–9, the application of the coating reduces the original roughness from 4–4.5 to about 3 µm.
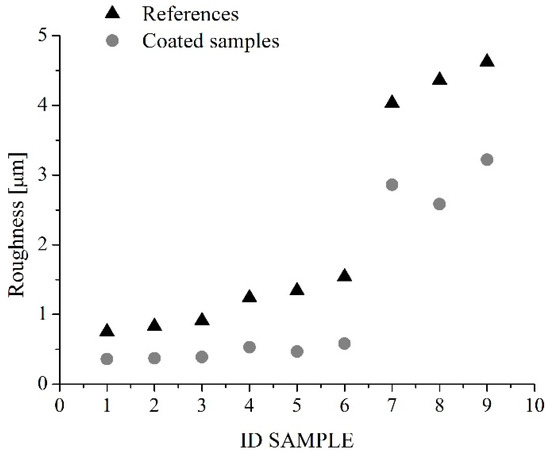
Figure 3.
Roughness values of samples before (triangles) and after (circles) the application of the coating.
3.2. Application of Coating
The aerograph setting parameters were varied and optimized in order to guarantee uniformity in terms of thickness and weight of the applied coating. Here, as an example, two different setting parameters, labelled as Procedure 1 and Procedure 2, are described; the corresponding schematics are shown in Figure 4. They differ mostly in the samples orientation with respect to the aerograph spray and in the drying temperature, whereas the layers’ number, the coating formulation, and the substrates were the same. After the application, measures of contact angle with water at room temperature were carried out. It was found that Procedure 1 is able to produce samples with contact angle of 124°, whereas Procedure 2 gives surfaces with a water contact angle of 155° (Figure 5). This difference is probably due to the different morphologies because of the diverse application procedures.
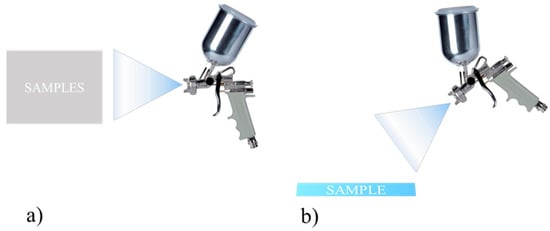
Figure 4.
Schematic drawing of deposition process according to (a) Procedure 1 and (b) Procedure 2.
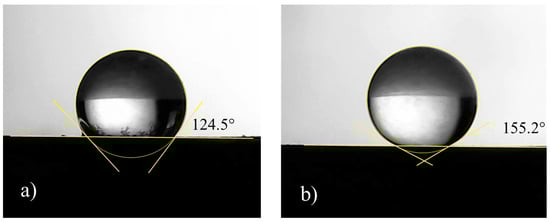
Figure 5.
Pictures related to the water contact angle of coated samples prepared according to (a) Procedure 1 and (b) Procedure 2.
Procedure 1
- Vertical samples
- Drying at room temperature
- Distance between samples and aerograph = 10 cm
- P = 3 bar; hole size = 1.5 mm
Procedure 2
- Horizontal Samples
- Aerograph at 45° wrt the samples
- Drying at 75 °C of each layer of coating for 10 min
- Distance between samples and aerograph = 15 cm
- P = 3 bar; hole size = 1.5 mm;
Hence, Procedure 2 was adopted to apply three layers of the developed coating on sample 1–9 with dimensions of 5 × 5 cm2. The Samples were weighed before and after the application of the coating, in order to assess a rough estimation of the coating’s specific weight, which was plotted as a function of the sample roughness in Figure 6. It was found that the coating’s specific weight was about 11 ± 1 g/m2.
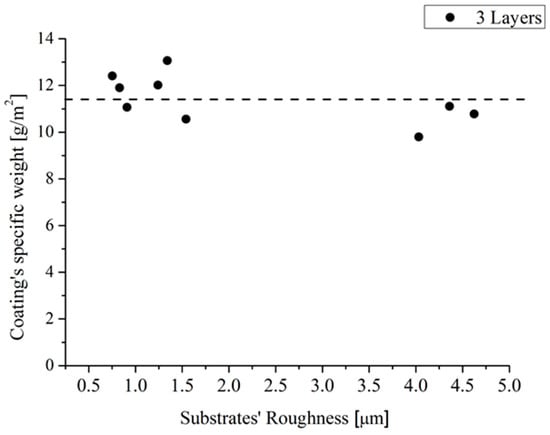
Figure 6.
The coating’s specific weight as a function of the substrates’ roughness.
SEM cross-section images of sample 2 (Ra = 0.8 µm) and sample 7 (Ra = 4 µm), employed to measure the coating’s thickness, are shown in Figure 7a,b, respectively. It seems that the two samples display some differences in both coating thickness and morphology. Sample 7 in Figure 7b, in fact, has a coating thickness higher than sample 2 shown in Figure 7b (see values in Table 3), with a mean value of 190 µm vs. 127 µm. Moreover, sample 7 coating appears to be more uniform in thickness and morphology than the sample 2 coating, and with less amount of large and localized voids. Hence, it seems that the roughness is able to improve the coating’s uniformity.
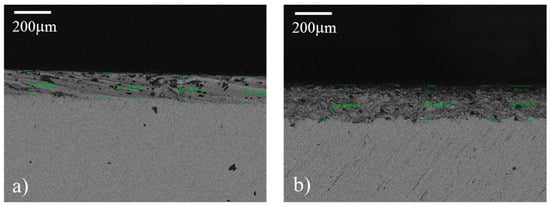
Figure 7.
SEM images acquired in cross-section mode of samples 2 (a) and 7 (b). Some measured thicknesses are reported.
Table 3.
Coating’s thickness measured by the SEM acquired in cross section mode.
3.3. Contact Angle Measurements
The measures of the contact angles acquired with H2O and CH2I2 were reported as function of the substrate roughness in Figure 8 and Figure 9, respectively. Some representative drop pictures caught during the measures were overlapped. It should be noted that, for the reference samples, the water contact angle is almost constant with a substrate roughness up to 1.8 µm beyond that, as expected [31], it increases as the roughness increases, reaching a value of about 100–115° for the highest value of measured roughness, i.e., 4.6 µm. The increasing of the contact angles with the roughness of metallic substrates can be ascribed to the changes in morphology. Other authors [31,32] also observed this behavior with maximum values of the achieved contact angles at about 120 °C [31]. Indeed, it was found that in order to achieve higher values of contact angles without modifying the surface chemistry, it is necessary to scale down the surface roughness into the sub-micron range, by creating specific and regular pillar-like structures having circular, square, triangle, crossed or fractal-like shapes [33]. On the contrary, the combination of substrate roughness and low SFE can be seen as a synergic approach able to achieve contact angle mean value of 158° (Figure 8). Additionally, it was also found that both the original and the actual sample roughness (Figure 3 and Figure 8) do not affect the achieved contact angle, since, in spite of the roughness value, the contact angle value does not change.
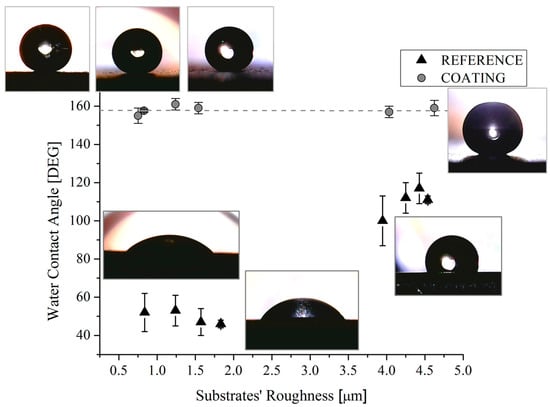
Figure 8.
Water contact angles of reference and coated samples as a function of the substrates’ roughness. Corresponding pictures are also shown.
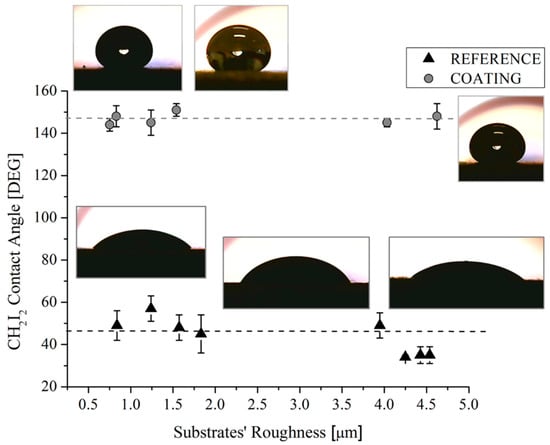
Figure 9.
CH2I2 contact angles of reference and coated samples as a function of the substrates’ roughness. Corresponding pictures are also shown.
The same uniformity in the achieved values of the contact angles was observed for measurements performed with CH2I2 in coated samples (Figure 9). Here, the mean value of the contact angles in coated samples is 148°, regardless of the substrates (0.7–4.6 µm) and the actual roughness (0.3–3.2 µm) of the samples.
3.4. Surface Free Energy and Work of Adhesion
The solid SFE and the WA of both uncoated and coated samples were plotted in Figure 10a,b, respectively, as a function of the substrates’ roughness.
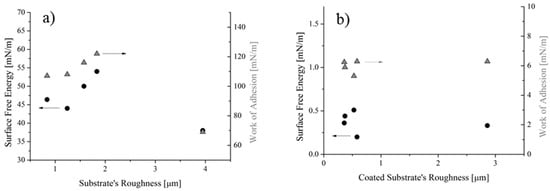
Figure 10.
SFE and WA of the uncoated (a) and coated (b) samples as a function of the roughness.
It was found that the solid SFE of the reference samples varies between 44 and 54 mN/m, for roughness values ranging from 0.7 to 2 µm, whereas for roughness of 4 µm the SFE becomes 38 mN/m (Figure 10a). Similarly, the WA varies between 108 and 122 mN/m, assuming a value of 69 mN/m for the sample at 4 µm in roughness. For samples having roughness higher than 4 µm, results cannot be achieved without taking into account the actual surface roughness, e.g., through Equations (12) and (13), or more complex relationship, i.e., those described in ref. [33]. Indeed, it was found that roughness higher than 4 µm the Equations’ system (4) did not give a solution, so no intersection of the two curves can be observed in graphs of Figure 11b. On the contrary, for lower values of the contact angles, the Equation system (4) reached solutions, as shown in Figure 11a as an example.
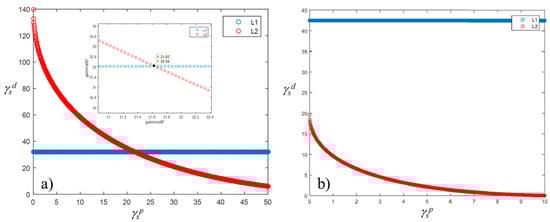
Figure 11.
Graphical solution of the SFE equations’ system with (a) and without (b) solution.
The authors decided not to further investigate samples at high values of roughness, since values higher than 4 µm are out of interest for aeronautical applications.
On the other hand, the flat trend for SFE and WA was seen for coated samples (Figure 10b), since all values scatter around 0.38 mN/m for the SFE and around 6.1 mN/m for the WA. This result reflects the uniformity of the water contact angle values measured in spite of the original and actual roughness values: the latter changing between 0.3 and 3 m (Figure 3). These trends can be better highlighted if results are reported as a function of the solid SFE (Figure 12). For the reference samples (Figure 12a), it was found that, as expected, the higher the contact angle, the lower the SFE and the WA. Since this result was achieved by varying the roughness of substrates alone, it can be concluded that it can be ascribed to the surface morphology (MORPHOLOGICAL EFFECT). On the contrary, for coated samples, no changes in terms of water contact angle and WA, along with almost no variations in the solid SFE (Figure 12b) can be observed, in spite of the actual roughness of substrates. Therefore, it should be concluded that, for the analyzed samples, the chemical modification of the surfaces prevails on the morphological aspect (CHEMICAL EFFECT).
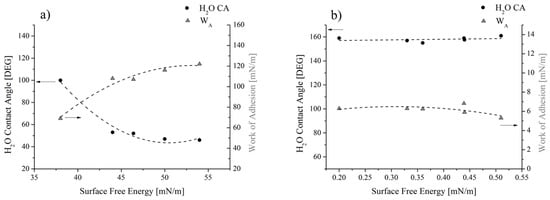
Figure 12.
Water contact angle and WA as a function of (a) the surface free energy for the reference and (b) the coated samples.
The geometrical and chemical effects on the wettability of surfaces were also observed by Kam et al. [31]. They found that the maximum contact angle achieved with nano-microstructured metallic surfaces was 110°, whereas the combination of the surface geometry and its chemical modification with silanes allowed to additionally modify the wettability of surfaces, since the contact angles reached values higher than 140°.
Finally, in Figure 13 the polar and dispersive components of the surface free energy, and the WA assessed for the reference and the coated samples were compared. It highlights that the WA was reduced by 94%, the solid SFE by 99%, and the SP by 100%, since after the application of the coating, it changes from 34 to 0%.
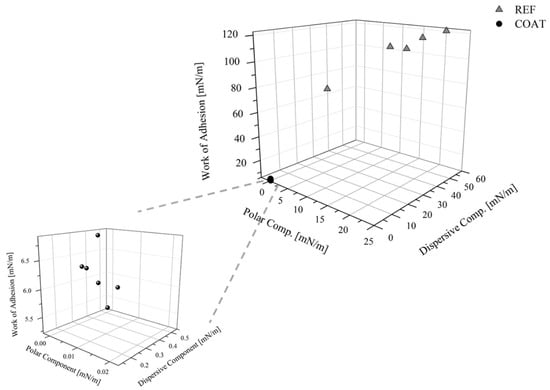
Figure 13.
Polar and dispersive components of the SFE and the WA for the references and the coated samples.
3.5. 3D samples’ Morphology
The SEM images of coated samples 2 and 7 (Table 1), acquired at different magnifications (125–500,000×) are displayed in Figure 14 and Figure 15, respectively. It highlights that at the lowest magnification (125×), both samples exhibit characteristic sponge-like structures [15,19,32,34,35,36], with the formation of air pockets, which enhance the superhydrophobicity. Samples differ in the density of the sponge-like structures. In fact, it appears that sample 7, having higher roughness (i.e., 2.8 µm) generates air pockets that are more densely packed than the less rough sample 2 (Ra = 0.4 µm). In spite of this difference, both samples exhibit contact angles of 158° (see Figure 8). At the highest magnification (500,000×) (Figure 14 and Figure 15), the hierarchical micro- and nano-structures appears, highlighting for both samples the dimension of the nanoparticles employed to formulate the coating, namely, about 30 nm in diameter. Therefore, in spite of the intrinsic roughness and the macroscopic density of the sponge-like structure, the generated air pockets made of multiscale roughness (micro- and nano-meter in dimension) guarantee the superhydrophobicity, i.e., contact angles of 158°.
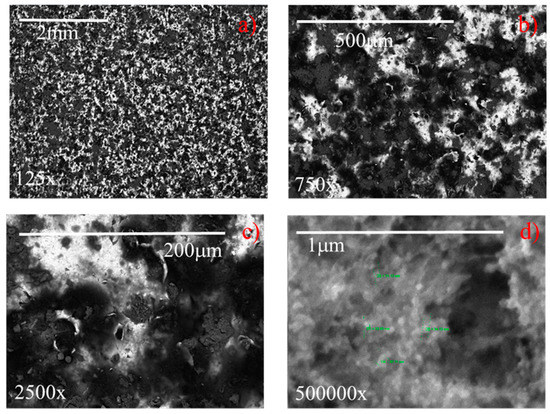
Figure 14.
SEM images at different magnifications of a sample having an original roughness of sample 2 (a) 125×, (b) 750×, (c) 2500×, (d) 500,000×.
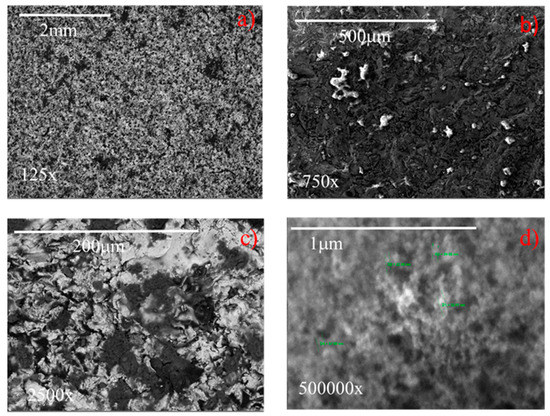
Figure 15.
SEM images at different magnifications of a sample having an original roughness of sample 7 (a) 125×, (b) 750×, (c) 2500×, (d) 500,000×.
The surface 3D profilometry of coated samples 2 and 7, having actual roughness of 0.4 and 2.8 µm, respectively, were reported in Figure 16a,b; whereas Figure 16c,d show the corresponding references, having roughness of 0.8 and 4.0 µm, respectively. In the insert, the pictures representative of the water contact angles were also shown. It highlights that all samples exhibit a macroscopic needle-like morphology deriving from the specific textured roughness, and there are no differences in the needle-like morphology [36] for each series of samples (compare Figure 16a with Figure 16c, and Figure 16b with Figure 16d). The reference with low roughness (see Figure 16c) does not exhibit the Cassie state, the surface area in contact with the water droplet is high, and consequently the water contact angle is low (50°). When the reference roughness increases to about 4 µm (see Figure 16d), the relative distance between the surface irregularities and the related height allow the contact angle to increase to 115°. The increase of the water contact angle due to the increased roughness alone can be ascribed to the MORPHOLOGICAL EFFECT. By comparing coated samples with the corresponding references, it highlights that, although the needle-like morphology and the corresponding roughness do not change, the water contact angle increases from 50° and 115°, respectively, to 158°, as a consequence of the chemical modification of the surface (CHEMICAL EFFECT). Finally, by comparing the two coated samples (see Figure 16a,b), it must be noticed that, in spite of the different actual roughness, i.e., 0.4 and 2.8 µm, for the samples 2 and 7, respectively, both of them exhibit the same water contact angle, namely, 158°. Hence, in conclusion, it seems that the chemical effect prevails on the morphological effect.
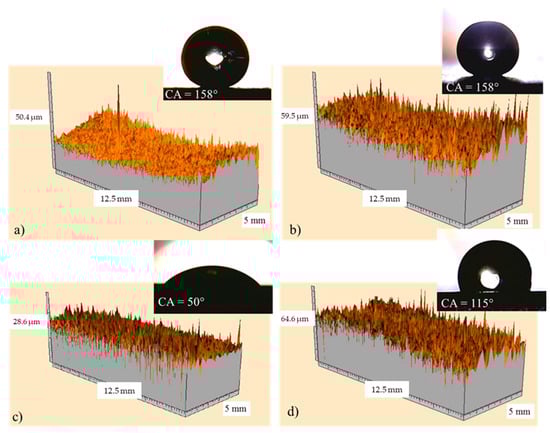
Figure 16.
Surface 3D profilometry obtained with the laser for coated sample 2 (a) and sample 7 (b); in (c) and (d) the corresponding references were also reported. In the insert, the pictures representative of the related water contact angles are shown.
3.6. Cutting and Tape Test
Figure 17 shows images related to the cutting and tape test performed on coated sample 7. In detail, Figure 17a shows the picture after the cut and Figure 17b shows magnification of the surface after the test. The shape of the water droplet in Figure 17c highlights that the superhydrophobicity was preserved after the test too. It must be noted that, according to the ASTM D 3359-09 [30], the test was passed, since quite no detached flakes of coating could be observed. This result was classified as 5B [30].
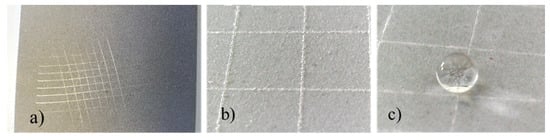
Figure 17.
Cutting and tape test results on coated sample 7, (a) surface cut, (b) surface magnification, (c) surface wettability after test.
3.7. Low Temperature Wettability
A preliminary test about the wettability at low temperature of the developed coating was performed by freezing (at −27 °C) a few water droplets placed on both reference and coated sample 2 (pictures in Figure 18). It is interesting to note that the shape of the water droplets, and then of the wettability, does not change with freezing, and consequently, the coated samples display a reduced surface area in contact with the substrate if compared with the reference.
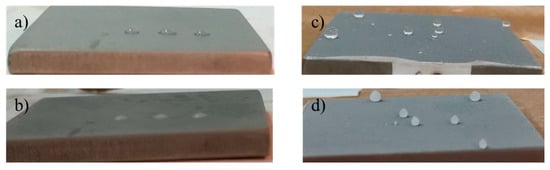
Figure 18.
Pictures of samples acquired at −27 °C. Reference with water droplet before (a) and after (b) the icing at −27 °C; coated sample with water droplets before (c) and after (d) the icing at −27 °C.
4. Conclusions
In the present work, the authors studied the wettability of a new developed superhydrophobic coating applied with a layer-by-layer approach as a common aeronautical livery, that can be potentially employed as a passive anti-icing system for aeronautical applications.
It was found that the wettability of the uncoated samples decreases as the roughness increases achieving a value of about 115° for Ra = 4 µm. The increase of the water contact angle due to the increased roughness alone can be ascribed to the morphology changes (MORPHOLOGICAL EFFECT). Instead, high values of contact angle, i.e., about 158°, were achieved only after the application of the coating, regardless of the substrate roughness, ranging from 0.4 to 3 µm (CHEMICAL EFFECT), so highlighting that the chemical modifications prevail on the substrate morphology.
The coating’s application reduced the SFE and WA by 99% and 94%, respectively, with respect to the reference. Finally, a preliminary test about the wettability of the developed coating at low temperatures showed that the reduced wettability of coated samples was preserved also at −27 °C. In this regard, future research will be addressed to characterize the developed coating in severe environmental conditions simulating real flights.
Author Contributions
Conceptualization, F.P.; Data curation, F.P.; Formal analysis, F.P.; Funding acquisition, L.D.P.; Investigation, F.P., D.D. and F.M.; Methodology, F.P.; Project administration, A.C. and L.D.P.; Software, G.C.; Supervision, F.P. All authors have read and agreed to the published version of the manuscript.
Funding
This research was funded by H2020 Clean Sky 2 Framework (CS2), 807083—AIRFRAME ITD (GAM AIR 2018), Topic Identification Code: JTI-CS2-2015-CPW02-AIR-02-07, project number and acronym: 699757/SAT-AM (More Affordable Small Aircraft Manufacturing) and “The APC was funded by H2020 Clean Sky 2 Framework.
Acknowledgments
Giovanni Pucci (Sapienza University of Rome, Italy) is kindly acknowledged for his technical support.
Conflicts of Interest
The authors declare no conflict of interest.
References
- Kreder, M.J.; Alvarenga, J.; Kim, P.; Aizenberg, J. Design of Anti-Icing Surfaces: Smooth, Textured or Slippery? Nat. Rev. Mater. 2016, 1, 15003–15039. [Google Scholar] [CrossRef]
- Lv, J.; Song, Y.; Jiang, L.; Wang, J. Bio-inspired strategies for anti-icing. ACS Nano 2014, 8, 3152–3169. [Google Scholar] [CrossRef] [PubMed]
- Schutzius, T.M.; Jung, S.; Maitra, T.; Eberle, P.; Antonini, C.; Stamatopoulos, C.; Poulikakos, D. Physics of Icing and Rational Design of Surfaces with Extraordinary Icephobicity. Langmuir 2015, 31, 4807–4821. [Google Scholar] [CrossRef] [PubMed]
- Meuler, A.J.; Smith, J.D.; Varanasi, K.K.; Mabry, J.M.; McKinley, G.H.; Cohen, R.E. Relationship between water wettability and ice adhesion. ACS Appl. Mater. Intefaces 2010, 2, 3100–3110. [Google Scholar] [CrossRef] [PubMed]
- Golovin, K.; Kobaku, S.; Lee, D.; Di Loreto, E.; Mabry, J.; Tuteja, A. Designing durable icephobic surfaces. Sci. Adv. 2016, 2, e1501496. [Google Scholar] [CrossRef]
- Antonini, C.; Innocenti, M.; Horn, T.; Marengo, M.; Amirfazli, A. Understanding the effect of superhydrophobic coatings on energy reduction in anti-icing systems. Cold Reg. Sci. Technol. 2011, 67, 58–67. [Google Scholar] [CrossRef]
- Alizadeh, A.; Yamada, M.; Li, R.; Shang, W.; Otta, S.; Zhong, S.; Ge, L.; Dhinojwala, A.; Conway, K.R.; Bahadur, V.; et al. Dynamics of Ice Nucleation on Water Repellent Surfaces. Langmuir 2012, 28, 3180–3186. [Google Scholar] [CrossRef]
- Simpson, J.T.; Hunter, S.R.; Aytug, T. Superhydrophobic materials and coatings: A review. Rep. Prog. Phys. 2015, 78, 086501–086515. [Google Scholar] [CrossRef]
- Lin, Y.; Chen, H.; Wang, G.; Liu, A. Recent Progress in Preparation and Anti-Icing Applications of Superhydrophobic Coatings. Coatings 2018, 8, 208. [Google Scholar] [CrossRef]
- Fresnais, J.; Chapel, J.P.; Benyahia, L.; Poncin-Epaillard, F. Plasma-treated superhydrophobic polyethylene surfaces: Fabrication, wetting and dewetting properties. J. Adhes. Sci. Technol. 2009, 23, 447–467. [Google Scholar] [CrossRef]
- Hikita, M.; Tanaka, K.; Nakamura, T.; Kajiyama, T.; Takahara, A. Super-liquid repellent surfaces prepared by colloidal silica nanoparticles covered with fluoroalkyl groups. Langmuir 2005, 21, 7299–7302. [Google Scholar] [CrossRef] [PubMed]
- Yang, H.T.; Jiang, P. Self-cleaning diffractive macroporous films by doctor blade coating. Langmuir 2010, 26, 12598–12604. [Google Scholar] [CrossRef] [PubMed]
- Bravo, J.; Zhai, L.; Wu, Z.Z.; Cohen, R.E.; Rubner, M.F. Transparent superhydrophobic films based on silica nanoparticles. Langmuir 2007, 23, 7293–7298. [Google Scholar] [CrossRef] [PubMed]
- Asadollahi, S.; Farzaneh, M.; Stafford, L. On the Icephobic Behavior of Organosilicon-Based Surface Structures Developed Through Atmospheric Pressure Plasma Deposition in Nitrogen Plasma. Coatings 2019, 9, 679. [Google Scholar] [CrossRef]
- Liu, J.; Janjua, Z.A.; Roe, M.; Xu, F.; Turnbull, B.; Choi, K.S.; Hou, X. Super-Hydrophobic/Icephobic Coatings Based on Silica Nanoparticles Modified by Self-Assembled Monolayers. Nanomaterials 2016, 6, 232. [Google Scholar] [CrossRef]
- Cao, L.; Jones, A.K.; Sikka, V.K.; Wu, J.; Gao, D. Anti-icing superhydrophobic coatings. Langmuir 2009, 25, 12444–12448. [Google Scholar] [CrossRef]
- Kustas, F.M.; Kustas, A.B.; Williams, T.S.; Hicks, R. Fabrication of Superhydrophobic and Icephobic Coatings by Nanolayered Coating Method. U.S. Patent Application 20190127841 A1, 19 September 2019. [Google Scholar]
- Furstner, R.; Barthlott, W.; Neinhuis, C.; Walzel, P. Wetting and self-cleaning properties of artificial superhydrophobic surfaces. Langmuir 2005, 21, 956–961. [Google Scholar] [CrossRef]
- Piscitelli, F.; Tescione, F.; Mazzola, L.; Bruno, G.; Lavorgna, M. On a simplified method to produce hydrophobic coatings for aeronautical applications. Appl. Surf. Sci. 2019, 472, 71–81. [Google Scholar] [CrossRef]
- ISO 4288—Geometrical Product Specifications (GPS)–Surface Texture: Profile Method–Rules and Procedures for the Assessment of Surface Texture; International Organization for Standardization: Geneva, Switzerland, 1996.
- Young, T. An Essay on the Cohesion of Fluids. Philos. Trans. R. Soc. Lond. 1805, 95, 65–87. [Google Scholar] [CrossRef]
- D7490-13 Standard Test Method for Measurement of the Surface Tension of Solid Coatings, Substrates and Pigments using Contact Angle Measurements. American Society for Testing and Materials: Conshohocken, PA, USA, 7 January 2013.
- Owens, D.K.; Wendt, R.C. Estimation of the surface free energy of polymers. Appl. Surf. Sci. 1969, 13, 1741–1747. [Google Scholar] [CrossRef]
- Żenkiewicz, M. Methods for the calculation of surface free energy of solids. J. Achiev. Mater. Manuf. Eng. 2007, 24, 137–145. [Google Scholar]
- Rudawska, A.; Jacniacka, E. Analysis of Determining SFE Uncertainty with the Owens-Wendt method. Int. J. Adhes. Adhes. 2009, 29, 451–457. [Google Scholar] [CrossRef]
- Models for Surface Free Energy Calculation. Available online: https://www.kruss.de/fileadmin/user_upload/website/literature/kruss-tn306-en.pdf (accessed on 26 December 2019).
- Wenzel, R.N. Resistance of Solid Surfaces to Wetting by Water. Ind. Eng. Chem. Res. 1936, 28, 988–994. [Google Scholar] [CrossRef]
- Banerjee, S. Simple derivation of Young, Wenzel and Cassie–Baxter equations and its interpretations. arXiv 2008, arXiv:0808.1460. [Google Scholar]
- Cassie, A.B.D.; Baxter, S. Wettability of porous surfaces. Trans. Faraday Soc. 1944, 40, 546–551. [Google Scholar] [CrossRef]
- ASTM D3359–09 Standard Test Methods for Measuring Adhesion by Tape Test; ASTM: West Conshohocken, PA, USA, 2009.
- Kam, D.H.; Bhattacharya, S.; Mazumder, J. Control of the wetting properties of an AISI 316L stainless steel surface by femtosecond laser induced surface modification. J. Micromech. Microeng. 2012, 22, 105019. [Google Scholar] [CrossRef]
- Yang, C.; Tartaglino, U.; Persson, B.N.J. Influence of Surface Roughness on Superhydrophobicity. Phys. Rev. Lett. 2006, 97, 116103. [Google Scholar] [CrossRef]
- Zheng, Q.; Lu, C. Size effect of surface roughness to Superhydrophobicity. Procedia IUTAM 2014, 10, 462–475. [Google Scholar] [CrossRef]
- Lai, Y.K.; Chen, Z.; Lin, C.J. Recent Progress on the Superhydrophobic Surfaces with Special Adhesion: From Natural to Biomimetic to Functional. J. Nanoeng. Nanomanuf. 2011, 1, 1–17. [Google Scholar] [CrossRef]
- Amigoni, S.; de Givenchy, E.T.; Dufay, M.; Guittard, F. Covalent Layer-by-Layer Assembled Superhydrophobic Organic−Inorganic Hybrid Films. Langmuir 2009, 25, 11073–11077. [Google Scholar] [CrossRef]
- Farhadi, S.; Farzaneh, M.; Kulinich, S.A. Anti-icing performance of superhydrophobic surfaces. Appl. Surf. Sci. 2011, 257, 6264–6269. [Google Scholar] [CrossRef]


© 2020 by the authors. Licensee MDPI, Basel, Switzerland. This article is an open access article distributed under the terms and conditions of the Creative Commons Attribution (CC BY) license (http://creativecommons.org/licenses/by/4.0/).