Abstract
Nowadays, aircraft safety is based on different systems and four of them share the same data-link protocol: Secondary Surveillance Radar, Automatic Dependent Surveillance System, Traffic Collision Avoidance System, and Traffic Information System use the Mode S protocol to send and receive information. This protocol does not provide any kind of authentication, making some of these applications vulnerable to cyberattacks. In this paper, an intrusion detection mechanism based on transmitter Radio Frequency (RF) fingerprinting is proposed to distinguish between legitimate messages and fake ones. The proposed transmitter signature is described and an intrusion detection algorithm is developed and evaluated in case of different intrusion configurations, also with the use of real recorded data. The results show that it is possible to detect the presence of fake messages with a high probability of detection and very low probability of false alarm.
1. Introduction
Nowadays, air traffic safety is based on different systems and four of them share the same data-link protocol derived from the original Secondary Surveillance Radar (SSR). SSRs are Air Traffic Control (ATC) systems used to obtain the identity and altitude of cooperative airplanes and, together with the Primary Radars, allow a safe air-traffic flow. The ground-based radar interrogates any aircraft in its antenna beam requiring identity and/or altitude (SSR Mode A and Mode C interrogations) and the aircraft, equipped with a transponder, replies with messages (called replies) containing the requested information. The SSR protocol evolution in the years has introduced some important modifications such as selective interrogation (called Mode S interrogation) and unique identification codes for each aircraft (called ICAO Address) [1,2].
This evolution also allowed the implementation of new services such as Automatic Dependent Surveillance System (ADS-B), Traffic Collision Avoidance System (TCAS), and Traffic Information System (TIS-B); all these systems use the Secondary Surveillance Radar (SSR) Mode S protocol to send and receive information [1,2,3,4,5].
ADS-B is used for air traffic surveillance and exploits the on-board derived positional data to transmit the aircraft position to close airplanes and ground stations; TCAS exploits the Mode S messages to exchange information between close aircraft to avoid collisions; and TIS-B is an ADS-B gap-filler that broadcasts aircraft information (usually radar derived) to other aircraft (see Figure 1).
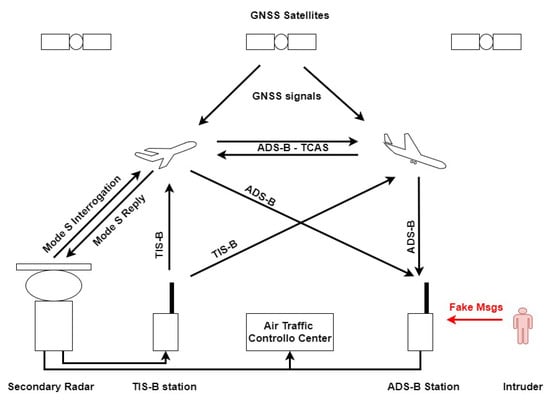
Figure 1.
Secondary Surveillance Radar (SSR) Modes, Automatic Dependent Surveillance System (ADS-B), Traffic Information System (TIS-B), and Traffic Collision Avoidance System (TCAS) block diagram. Intruder is also shown.
ADS-B is considered one of the pillars of the Future Air Traffic Systems [4,5] and, nowadays, more than 80% of the commercial aircraft are equipped with ADS-B hardware [6].
In these surveillance systems, the airplanes periodically transmit their own information (identity, position, velocity, etc.) without any interrogation (the messages, similar to the SSR replies, are called Mode S squitters). Any ADS-B receiving station can receive the aircraft messages to produce a clear air traffic situation awareness of its coverage area without using expensive radar equipment. Typically with this approach, the station can use a low-cost L-band receiver equipped with an omnidirectional antenna reaching better performance than a classical radar system in terms of coverage, position accuracy, and renewal time. On the other hand, the ADS-B has also some weaknesses:
- It is a dependent system, the aircraft information (such as the aircraft position) are derived on board (from the navigation unit) and not independently computed by the surveillance system;
- The channel throughput is limited due to the channel congestion, and the random access to the channel produces a high rate of packet collision (called garbling) when the number of aircraft increases;
- The Mode S protocol was introduced in the 1980s, when security and cyberattacks were not as common as today, and it does not offer any encryption and authentication technique. Since the communication happens without any interrogation and with omnidirectional antenna, anyone can send false data (e.g., ghost aircraft in false positions) in any moment and from any direction;
- Last, but not least, the channel can be jammed: a high-power noise can be transmitted on the channel to reduce the capability of the receivers to decode legitimate messages (up to total denial of the service).
To mitigate the risk of being dependent on the on-board computed positional data, some mitigations were proposed; for example, using independent localization such as Multilateration [7,8], Location Verification [9], or station clock tracking [10]. Concerning the channel throughput and the jamming mitigation, the authors proposed many solutions in the past, exploiting frequency super-resolution or source separations techniques [11,12,13,14]. Many other security aspects were evaluated in other works [15,16,17,18,19], and some works propose the introduction of an authentication scheme in the Mode S protocol [20,21,22]. These latter proposals need a deep modification of the Mode S protocol that can have a big impact on the channel throughput for the transmission of authentication information.
Moreover, in the case of spoofing, it can be used either to flood the channel or to inject fake data into the channel; for example, representing fake airplanes. In case of flooding, the attack could be easily detected by the use of conformance checks (for example, a message rate conformance monitor) and then one of the previously mentioned source separation algorithm could be used to separate the legitimate messages from the ones coming from the spoofer. In case of a smart spoofer that injects a small quantity of well-formatted coherent data (such as fake aircraft following a fake trajectory), the detection of the attack can be very difficult.
This work will focus on this latter case, where the lack of authentication of the SSR Mode S messages could allow the following possible types of cyberattacks:
- Intrusion-1: The on-board navigation unit can be replaced with a fake one reporting false information;
- Intrusion-2: An intruder can transmit false information on the channel with an unauthorized transmitter, producing false information on the controller/pilot display.
In these two cases, the receiving stations can receive false information without any ability to detect the intrusion. We will focus on the possibility of taking a fingerprint of the aircraft transmitter and exploiting it to detect fake messages sent from an attacker that uses a different transmitter. This is possible because the signals generated from each transponder cannot be easily replicated, since they are produced with a specific hardware that is subjected to some tolerances (also related to randomness in the manufacturing process such as, for example, the presence of analog components in the transmission chain, clock stability, etc.), aging or different time versions of the transmitter Hardware (HW) and Software (SW) [23,24,25,26].
Signatures based on different Radio Frequency (RF) signal features can be found in the received signals and used to find out the origin of the messages. It follows that by creating a database of aircraft/transponders containing their transponder signatures, it is possible to check if the incoming signals belong to the expected aircraft or not.
In some previous works (for example in [27,28]), the possibility to classify the aircraft Mode S transponders with respect to the time series of the transmitted messages or by the use of phase transient and carrier frequency are investigated. Moreover, in [29,30], the carrier phase pattern along the message is used for transponder classification by the use of Neural Networks or K-NN classifiers. In the latter, different approaches to extract the signature are also compared: single-message fingerprint or group-message fingerprint.
Finally, the Cumulative Distribution Function (CDF) of the carrier frequencies measured on consecutive messages could also be considered peculiar for transponders, as shown in [31]. The main result of all these works was that they showed it is possible to distinguish between different transponder groups using RF fingerprinting, while using low-cost hardware.
Moreover, in [31], a set of these features (phase along the message, carrier frequency distribution, and time series) was proposed for the intrusion detection, exploiting a simple distance-based outlier detection algorithm.
Summarizing these mentioned works, the Mode S data link format is shown in Figure 2 and the Pulse Position Modulation (PPM) implies that, neglecting the preamble, the data-block is always composed of pulses with different time positions to encode the information to be transmitted (i.e., Manchester coding) [2,3].
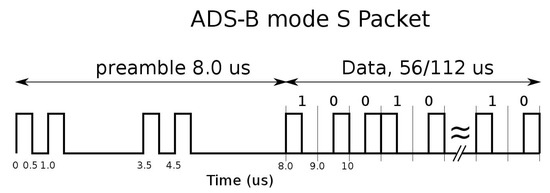
Figure 2.
ADS-B/Mode S reply format.
It follows that the transmitted signal (considering only the data-block, to simplify the notation) can be represented as
where
In the previous equations, is the carrier frequency equal to 1090 MHz, is the allowed jitter of the carrier frequency, is the phase of the carrier. represents the transmitted 112 pulses sequence, is the message amplitude, is the bits sequence to be transmitted (composed of ), T is the pulse width, and is a function that represents the real shape of the transmitted pulse as generated from the transmitter and compliant with the recommendations. Assuming to have a 1090-MHz coherent receiver with a sampling period of , in the presence of Additive White Gaussian Noise (AWGN), the received signal can be expressed as follows:
and
where represents the noise, is the sampling time, and is the Doppler frequency due to the aircraft/station relative velocity. represents the received amplitude behaviour and represents the shapes of the received pulses that can be corrupted by the propagation (the propagation delay has been assumed equal to zero to simplify the notation). Having the samples of the received signal, it is possible to estimate some of the message features:
- The residual carrier frequency (it can be estimated using any kind of frequency estimator, for example, finding the maximum value of the Discrete Fourier Transform of the received signal). Notice that the maximum Doppler frequency (considering an aircraft flying at 250 m/s) is lower than 1 kHz and the maximum frequency resolution that can be obtained using the Mode S signals is inversely proportional to its duration, that is, s) kHz. In this condition, we can expect that the Doppler shift can be neglected with respect to the transmitter frequency offset ( MHz).
- The carrier phase along the message. It can be estimated by estimating 112 different phase values , one for each pulse of the ADS-B message using a Maximum Likelihood Estimator, as shown in [29]. The second-grade best-fitting polynomial, , of this sequence can be derived for each message.
- Time of Arrival of each message [27].
In [29], the authors have already done a measurement campaign to evaluate carrier phase along messages as a transmitter feature, discovering that at least seven different types of transmitter are commonly used.
Finally, a group of N consecutive messages coming from the same aircraft can be used to produce the transponder signature composed from the following:
- Carrier phase features: , , , , , and , where are defined as before and and represent the mean and the standard deviation;
- Carrier frequency features: , , , , ;
- Time features: observing the Time Difference of Arrival (TDOA) histogram of the messages in the sample, the following parameters can be defined: , number of bins composing the distribution; mean distance between consecutive bins; , number of selected bins with zero/not zero occurrences [27].
In [31], a vector containing all these 14 parameters was considered as the transponder signature and an outlier detection algorithm based on the z-score was proposed. This preliminary solution gave promising results, showing that intruder detection is possible, but obtaining performance lower than expected.
In the author’s opinion, this happens because in that work some strong assumptions were done on statistical proprieties of the features, that are (a) the features were assumed to be stationary in time (short and long term); (b) the features distributions were overestimated using a Gaussian distribution.
The aims of this work are a better investigation of the features’ properties (and their selection) and the removal of these two strong hypotheses. A new intrusion detection algorithm, based on a Machine Learning approach, is then proposed and evaluated. Finally, a measurement campaign and trials with real data are presented.
The main improvement with respect to the previous works is that the combination of the new signature and the new detection algorithm is able to operate in the case of non-Gaussian features and nonstationary process, improving by one order of magnitude the overall performance in terms of probability of false alarm (fixing the probability of detection).
2. Features Analysis and Selection
To better investigate the previously proposed features and to verify their statistical properties, a measurement campaign was done on February 2018 using a simple Mode S receiver.
The receiver was based on an RTL-SDR HW [32,33] equipped with an omnidirectional antenna which was able to sample and store the I,Q signal samples of the received messages (with a sampling frequency of 2 Msps and 8-bit resolution). The recorder data were used to derive all the features previously mentioned, and messages coming from 1104 different transponders were recorded for 24 h.
First of all, a long-term observation of the features was done and some preliminary improvements were implemented. The frequency feature set was reconsidered to have less conservative conditions, and the minimum and maximum values of the frequency samples were replaced with the 20th and 80th percentiles of the frequency distribution, obtaining more stable features.
Moreover, observing the collected time features, it was found that they could be unstable since they are highly correlated with the receiver HW. For example, in the case of low-cost HW, the high rate of lost messages could strongly affect the TDOA distribution, reducing the features’ performance.
An improved signature, replacing the mentioned frequency features and discarding the time ones, was defined:
These new features were extracted and tested using the Kolmogorov–Smirnov (KS), Anderson and Darling (A-D), and Lilliefors Gaussian Tests [34], fixing a significance level of .
In Table 1, the percentage of Gaussian-distributed features (features that pass the test with respect to the total number of extracted features) is reported. It can be noted that most of the features cannot be considered Gaussian-distributed. It follows that, using a Gaussian shape to overlay these distributions (also in the case of overestimated parameters) could, in some cases, produce big errors, especially in the tails of the distributions. The same measurement campaign was also exploited to check the transponder’s stationarity and, also in this case, the assumption results were too restrictive. Many airplanes showed periodical changes in their signatures. An example is reported in Figure 3, where the phase patterns of consecutive messages are reported (the six phase features are extracted from these patterns). For this particular transponder, the phase pattern switches between three (almost interleaved) patterns: one quadratic and the other two broken-linear (as classified in [29]).

Table 1.
Gaussian Test. Percentage of Gaussian distributed features.
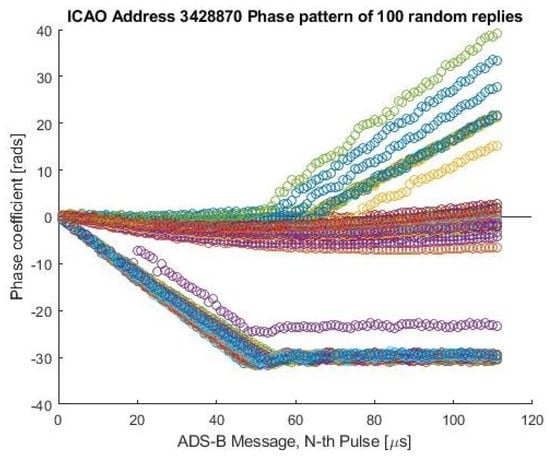
Figure 3.
Example of Nonstationary Transponder. Phase patterns of consecutive messages of the same transponder. Different colors represent different message phase patterns of the same transponder.
It follows that, for this particular aircraft, the distributions for some features will be nonstationary (for short time observation), changing time-by-time or (for long-term observation) multimodal. This effect was observed for several transponders with different rates of occurrence, and similar effects were also found in features related to the carrier frequency.
Finding the reasons of this effect is out of the scope of this work but, in the author’s opinion, they must be searched on the transponder/airplane peculiarities. For example, different HWs could be used by the aircraft to transmit their messages (using redundant HW is common in safety applications and, moreover, on the airplanes two ADS-B antenna must be installed and used in interleaved mode—one on the top and one on the bottom of the aircraft).
In the next section, a new detection algorithm is proposed, able to (a) work also in the case of no stationary signature (in particular with aircraft having different signatures in time), (b) work without any assumption on the feature distributions, and (c) work without any knowledge about the intruder and the intruder features.
3. Intrusion Attack Detection Algorithm
A block diagram of the proposed method is reported in Figure 4. The method uses the vector , containing all the described features obtained with a group of consecutive messages of the airplane as signature of an aircraft transponder.
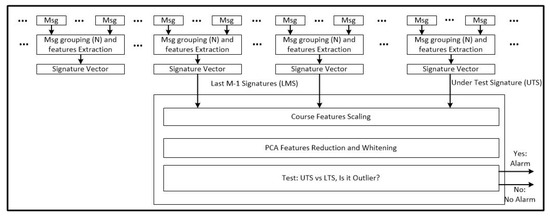
Figure 4.
ADS-B signal features extraction block diagram.
Every N messages from the same aircraft, a new signature can be extracted. The signatures of each aircraft are continuously derived from the stream of incoming messages. A sliding window can be used to collect the last M signatures (M could be fixed or can be dynamically changed to include all the hysterical data). M should be large enough to have a representative sample of the aircraft signatures but also small enough to reduce the processing time, the memory load, and to account for the slow time variation of the signatures (due to the aging of the transponders). Its order of magnitude could be some days of data.
The last incoming signature (lets call it Signature Under Test—SUT) is also added to the set of signatures and a classical preprocessing (feature scaling, selection, and whitening) is applied. This processing structure is able to create a database of signatures for each aircraft.
In more detail, let us define the vector
as the signature of the aircraft for the time , obtained by observing N messages coming from the aircraft.
The time series represents the signatures of the same airplane in the time. Using a sliding window, this time series can collect the last signatures representing the transponder, this sequence of vector can be stacked in the matrix :
Afterward, for the new incoming signature , it is possible to test if it is an outlier with respect to .
The incoming SUT is also stacked in , obtaining a new matrix and, after a coarse data-scaling (mean-normalization), the Principal Component Analysis is applied to obtain a new sequence of orthogonal features :
where is the matrix containing the principal component coefficients, also known as loadings, for the data matrix , each column of contains coefficients for one principal component, and the columns are in descending order of component variance; is the principal component score matrix. The latter is the representation of in the principal component space, the rows of correspond to the observations, and the columns correspond to the components.
The number of features can be reduced dropping the ones having low loadings and a reduced dimension is obtained.
Last, whitening (dividing each feature for the relative standard deviation) is applied, obtaining a new matrix, .
In this new feature space, it is expected to have one or more clusters representing the aircraft and, if the last column of (the SUT) of the matrix is not part of these clusters, an alarm should be raised.
In other words, after this preprocessing, an outlier detection algorithm should be applied and, if the SUT is classified as outlier, an alarm shall be raised revealing the intrusion.
As stated before, the outlier detection algorithm shall be able to identify an outlier without knowing the number of clusters that represent the aircraft and without having any information about the features distribution in the clusters.
A two-stage approach is proposed here to identify the outliers.
First of all, the SUT K-Nearest Neighbors [35] are extracted from the matrix , obtaining K different signatures , again, stacked in a matrix .
In normal condition, it is possible to assume that the K-Nearest Neighbors will be all in the same cluster.
Having these K signatures, the euclidean distances from the SUT signature can be computed, obtaining a vector of K distances , where
In the same way, the mutual distances between the k columns of can also be computed, obtaining a vector of dimension :
Using this approach, if the SUT is close to a cluster, the and vectors should have similar distributions; otherwise, it can be considered an outlier. It follows that the second stage of the outlier detection algorithm should be a test on the distribution of the two vectors of distances and . The two-samples Kolmogorov–Smirnov test is proposed, avoiding the use of any a priori information about the signature distributions and any hypothesis on their type of distribution [34].
To perform the two-sample KS test, the two cumulative distribution functions and are computed and the p-value of the KS test is calculated and compared with a threshold [34].
If the obtained p-value is smaller than a given threshold, the under-test signature is considered an outlier; otherwise, it is considered as part of one of the clusters, or in general similar to the other signatures (see Algorithm 1 for a detailed description of the algorithm steps).
Similar approaches are used for radar target detection in unknown noise or clutter—for example in [36,37], exploiting the Ordered Statistic of the noise/clutter; or in [38], where the comparison of CDFs is proposed for outlier detection in nonstationary process.
In Figure 5, an example of the application of the proposed method is reported. In Figure 5a, the last 1000 signatures for a given aircraft are shown (only the first three principal components are shown). It is clear that this particular aircraft is represented by more clusters, also having different densities. The black bold “+” represents the under-test signature (in case of legitimate aircraft) and the red “+” represent the K-NN signatures. In Figure 5b, the CDF for the distances ( and ) are reported. The other two parts of the figure, (c) and (d), show the same quantities but in the case of an intrusion. In this case, the incoming signature is relative to another aircraft.
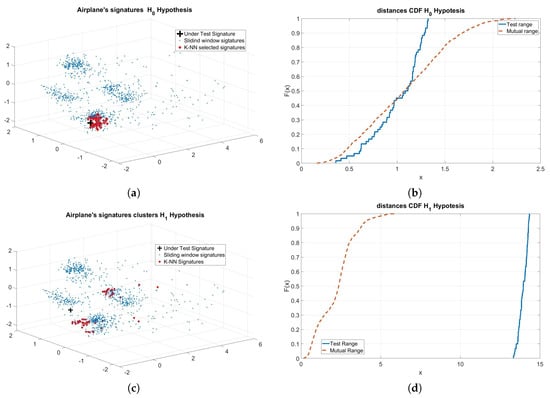
Figure 5.
Example of application of the proposed method. (a) hypothesis, intruder not present: clusters of signatures representing the aircraft, + is the incoming signature, bold points represent the K-NN signatures; (b) and Cumulative Distribution Function (CDF); (c) hypothesis, intruder present: clusters of signatures representing the aircraft, + is the incoming signature from intruder, bold points represent the K-NN signatures; (d) and CDF.
It is clear that in the latter case the two CDF are totally different, returning totally different p-values. Fixing a threshold for this parameter, the former CDFs will pass the K-S test and the latter one will not pass it.
| Algorithm 1: Intruder Detection Algorithm |
 |
4. Performance Evaluation with Real Data
An evaluation of the performance of the proposed approach using real data was done and described hereafter.
The evaluation was based on a measurements campaign that was done between day 337 and day 345 of 2018, collecting about 45-million messages from 2942 aircraft.
A simple receiver composed of a Software Defined Receiver running over a Raspberry Pi equipped with a modified Digital Video Broadcasting-Terrestrial (DVB-T) dongle and an omnidirectional ADS-B antenna [32,33,39] was used. The HW allowed the reception of the ADS-B messages and the storing of the relative signal samples (I and Q samples, 8-bit resolution, 2 MSps).
Two scenarios were evaluated:
- (Scenario 1). An intruder in a coverage area where the legitimate aircraft is not present (intruder can be an aircraft with a fake or manipulated transponder or a nonauthorized ground transmitter);
- (Scenario 2). An intruder in a coverage area where the emulated aircraft is also present.
The second type of attack is more difficult to contrast since the extracted signatures are derived from both the legitimate and the fake messages.
The algorithm was evaluated, computing the Probability of False Alarm (the probability to have an alarm in case of legitimate signals) and the Probability of Detection (the probability to have an alarm in case of a real attack) and comparing the so-called Receiver Operating Characteristics (ROC) for different values of the threshold for the p-value of the KS-Test.
Different sliding window sizes (M) and different values of K (K-NN parameter) were also tested. Finally, the computed results were compared with the ones obtained using the approach proposed in [31].
To compute the Probability of False Alarm, the recorded messages were assumed to be legitimate and the number of alarms over the number of tests was computed. To compute the Probability of Detection, the presence of an intruder was emulated by randomly selecting a signature coming from another aircraft; the number of alarms over the number of tests was then computed.
In the first scenario, all the messages used to extract the SUT came from the randomly selected aircraft; in the second scenario, 50% of the messages came from the legitimated transmitter and the other 50% came from the randomly selected aircraft.
Results for the first scenario, varying M and K, are reported in Figure 6; all the signatures were computed using consecutive ADS-B messages.
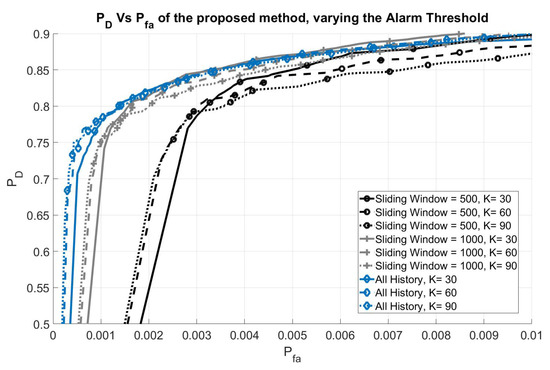
Figure 6.
Performance of the proposed method (Scenario 1) varying the alarm threshold.
Each point of each ROC curve represents the couple obtained for a given threshold on the p-value of the KS test. Each curve was obtained for a different configuration of parameters M and K.
These curves show that it is possible to reach, at the same time, a very low probability of false alarm and a high probability of detecting the intruder. In general, the curves move to the left, increasing the size of the sliding windows (M) or the values of K, with a small down-sliding effect. This means that by increasing the history, the performance in term of Probability of False Alarm increase (the region of main interest of the curve is near the elbow, where it is possible to obtain low and high at the same time).
In more detail, when increasing the value of K, a more representative sample of the airplane signatures will be selected for the outlier test, thus improving the performance of the test—especially in terms of , this can be seen in the figure, referring to the curve with the same history window size. On the other hand, it will also produce a small reduction in performance over the elbow of the curve, in term of .
Concerning the history window size (M), as mentioned before, by increasing the size of this window, the performance of the algorithm improves but it also means an increase of the required computational capability. In fact, the major steps of the algorithm have different computational complexities that depend on the different algorithm parameters: the K-NN search has a complexity of , the computation of distance vectors has a complexity that depends on the computation of all the possible combinations of distances in a sample of K points—that is, more or less, —and finally, the KS test complexity can be approximated with the complexity of the sorting algorithm used to estimate the distribution functions of the distances, . This means that, for , the computational load of the algorithm linearly grows with M, this is also confirmed by some trials done varying the history window size of the algorithm and measuring its execution time, see Figure 7. In the author’s opinion, having M on the order of thousand could be more than enough. Finally, concerning the value of N, the main constraint is the algorithm update time; the larger N is, the larger the algorithm update time is. In addition, in principle, choosing larger value for N improves the meaningfulness and the stability of the signatures, and only a small impact on the overall algorithm performance was found for higher values. In the author’s opinion, using , that means about 25 s of renewal time, could be the right trade-off.
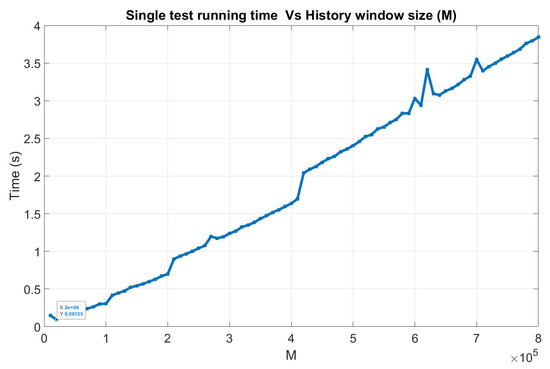
Figure 7.
Algorithm running time varying the size of the history window. This example is computed running the proposed algorithm implemented in Matlab on an Intel(R) Core(TM) i3-3220 CPU @3.30GHz.
Moreover, for this particular time-limited data-set, increasing M, the number of tests and the number of tested airplanes decreases due to the fixed size of the used recording (for example, for a window size of 500 signatures 362 aircraft were tested with a total number of tests equal to 400,677; on the other hand, for a size of 1000 signatures, the tests were 267,664 on 208 aircraft) reducing the significance level of the results. For this reason , , and are finally selected for a good trade-off between performance evaluation and significance of the results.
The comparison of the performance obtained with the method proposed in [31] is reported in Figure 8, where an evaluation for the second scenario is also represented (with the same values of M and K).
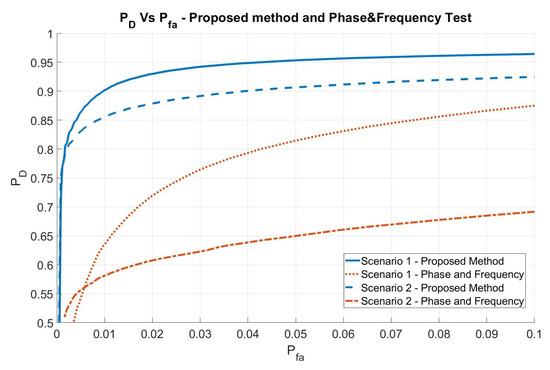
Figure 8.
Comparison of the proposed method performance with the performance obtained by the method proposed in [31].
Finally, Table 2 reports examples of results fixing two possible values of the probability of detection ( and ) and for different settings of K and M. In the table, the symbol “<” in the column is used when zero alarms are raised for all the tests; the reported values, in those cases, are the maximum resolution of the probability estimation process (1/(number of tests)). In general, the way of choosing the best couple of and on the ROC curve strictly depends on the application and, usually, when a security alarm shall be raised, it is preferred to fix the maximum value for the probability of false alarm accepting the corresponding probability of detection. This means, usually, staying below the elbow of the curves. For example, considering this particular dataset, a good solution could be working on the elbow of the curve for and and fixing the maximum probability of false alarm to , obtaining a probability of detection of about 0.75.
Table 2.
Result Comparison.
In general, the performance in terms of probability of false alarm are increased by at least an order of magnitude with respect to the method proposed in [31], namely, Phase and Frequency.
Moreover, for the more-demanding second scenario, the performance is close to that obtained in the first one, with a negligible performance reduction. On the contrary, the results obtained with the method proposed in [31] suffer a big degradation.
5. Discussion
The proposed method (together with the new aircraft signature) is capable of detecting a change in the signature of an aircraft, reaching a low probability of false alarm and a high detection probability. It is also able to detect attacks in which the spoofer does not flood the channel with a big number of messages, but injects only small quantities of messages representing one (or a small number of) aircraft.
Moreover, the proposed method is fully adaptive and does not need any kind of knowledge about the intruder signature and about the legitimate aircraft signature distribution. It is also capable of working in the case of multiple signatures for the same aircraft and in the case of legitimate aircraft and intruders that are inside the coverage area of the sensor at the same time, if the historical data are enough.
Concerning the method’s weaknesses, the fact that it uses the historical data to estimate the signature of a legitimate aircraft and that it uses the incoming signal to improve the knowledge about the aircraft, its performance is reduced in detecting very slow changes in the aircraft signature.
The method detects abrupt changes in the signatures, and an attack can be seen when it pop-up or for some following time instants; when a new cluster representing the intruder is formed, the ability to detect it goes to zero. The sensitivity to this phenomenon depends on various parameters such as the size of the sliding window (M), the size of the sample to extract the signatures (N), and also the selected value for K. In general, this dependency from historical and recent data is useful to take into account the aging of the devices and cannot be discarded, but in this particular case, it could be also exploited from a smart attacker to design a specific attack that slowly changes the signatures of a given aircraft and then starts to send fake data.
However, in the author’s opinion, this weakness can be drastically reduced with different approaches. For example, sharing the aircraft database between different stations or increasing the size of the sample used to compute the signature that, in general, increases the algorithm’s performance and also the robustness to slowly changing attacks.
Moreover, a mechanism to inhibit the insertion of fake information inside the aircraft database can help. This can be done with any kind of antimasking algorithm that, if an intruder is detected, stops updating the signature database. This method is commonly used in Radar applications [37].
Finally, in the author’s opinion, the solution is the use of “qualified” messages for database updating. For example, using only the messages confirmed by a secondary radar interrogation/reply process to update the data-base of signatures totally solves this problem.
6. Conclusions
This work shows that it is possible to identify an intrusion on a Mode S channel by the use of signatures extracted from the aircraft transmitted signals, stationarity and/or multisignature aircraft and without any knowledge about their signature distributions.
Finally, it must be noted that the proposed method uses features that can be extracted from the signals with very simple and low-cost receivers, and it was implemented with a signal processing add-on on low-cost Mode S receivers (below of 100$ of total cost).
Author Contributions
M.L. proposed the idea and gave the theoretical support, conceptualizations, and methodology, implemented part of the algorithm, and contributed to the algorithm evaluation. F.G. implemented the statistical tests and evaluated the signature properties, and contributed to the evaluation of the detection algorithm. All authors have read and agreed to the published version of the manuscript.
Funding
This research received no external funding.
Conflicts of Interest
The authors declare no conflict of interest.
Abbreviations
The following abbreviations are used in this manuscript:
| ADS-B | Automatic Dependent Surveillance—Broadcast |
| ATC | Air Traffic Control |
| AWGN | Additive White Gaussian Noise |
| CRC | Cyclic Redundancy Check |
| DB | Database |
| DVB-T | Digital Video Broadcasting-Terrestrial |
| ES | Extended Squitter |
| GPS | Global Positioning System |
| HW | Hardware |
| ICAO | International Civil Aviation Organization |
| IF | Intermediate Frequency |
| IFF | Identification Friend or Foe |
| NN | Neural Network |
| Detection Probability | |
| False Alarm Probability | |
| PPM | Pulse Position Modulation |
| RF | Radio Frequency |
| SDR | Software Defined Radio |
| SSR | Secondary Surveillance Radar |
| SW | Software |
| TCAS | Traffic Collision Avoidance System |
| TIS-B | Traffic Information Service - Broadcast |
References
- Stevens, M. Secondary Surveillance Radar; Artech House: Norwood, MA, USA, 1988. [Google Scholar]
- ICAO. Annex 10 to the Convention on International Civil Aviation Aeronautical Telecommunication; ICAO: Montreal, QC, Canada, 2014. [Google Scholar]
- RTCA Inc. Minimum Operational Performance Standards for 1090 MHz Extended Squitter Automatic Dependent Surveillance—Broadcast (ADS-B) and Traffic Information Services Broadcast (TIS-B). DO-260B with Corrigendum 1; RTCA: Washington, DC, USA, 2011. [Google Scholar]
- SESAR. Available online: http://www.sesarju.eu/ (accessed on 10 January 2020).
- NEXTGEN. Available online: https://www.faa.gov/nextgen/ (accessed on 10 January 2020).
- Strohmeier, M. Large-scale Analysis of Aircraft Transponder Data. IEEE Aerosp. Electron. Syst. Mag. 2017, 32, 42–44. [Google Scholar]
- Galati, G.; Leonardi, M.; Paciucci, V. Wide area surveillance using SSR mode S multilateration: Advantages and limitations. In Proceedings of the European Radar Conference, EURAD 2005, Paris, France, 3–4 October 2005; pp. 225–229. [Google Scholar]
- Mantilla-Gaviria, I.; Leonardi, M.; Galati, G.; Balbastre-tejodor, J. Localization algorithms for multilateration (MLAT) systems in airport surface surveillance. Signal Image Video Process. 2015, 9, 1549–1558. [Google Scholar] [CrossRef]
- Strohmeier, M.; Lenders, V.; Martinovic, I. Lightweight Location Verification in Air Traffic Surveillance Networks. In Proceedings of the 1st ACM Workshop on Cyber-Physical System Security (CPSS), Denver, CO, USA, October 2015. [Google Scholar]
- Leonardi, M. ADS-B Anomalies and Intrusions Detection by Sensor Clocks Tracking. IEEE Trans. Aerosp. Electron. Syst. 2019, 55, 2370–2381. [Google Scholar] [CrossRef]
- Leonardi, M.; Piracci, E.; Galati, G. ADS-B jamming mitigation: A solution based on a multichannel receiver. IEEE Aerosp. Electron. Syst. Mag. 2017, 32, 44–51. [Google Scholar] [CrossRef]
- Di Massa, G.; Costanzo, S.; Borgia, A.; Venneri, I.; Galati, G.; Leonardi, M.; Piracci, E. Multiple sources discrimination by array processing. In Proceedings of the 5th European Conference on Antennas and Propagation (EUCAP), Rome, Italy, 11–15 April 2011; pp. 620–622. [Google Scholar]
- Leonardi, M.; Maisano, M. Degarbling technique for low cost ADS-B receivers. In Proceedings of the 2019 IEEE 5th International Workshop on Metrology for AeroSpace (MetroAeroSpace), Torino, Italy, 19–21 June 2019; pp. 65–69. [Google Scholar] [CrossRef]
- Leonardi, M.; Piracci, E. ADS-B degarbling and jamming mitigation by the use of blind source separation. In Proceedings of the 2018 IEEE/AIAA 37th Digital Avionics Systems Conference (DASC), London, UK, 23–27 September 2018. [Google Scholar] [CrossRef]
- Strohmeier, M.; Lenders, V.; Martinovic, I. On the Security of the Automatic Dependent Surveillance-Broadcast Protocol. IEEE Commun. Surv. Tutor. 2015, 17, 1066–1087. [Google Scholar] [CrossRef]
- Leonardi, M.; Piracci, E.; Galati, G. ADS-B vulnerability to low cost jammers: Risk assessment and possible solutions. In Proceedings of the 2014 Tyrrhenian International Workshop on Digital Communications—Enhanced Surveillance of Aircraft and Vehicles (TIWDC/ESAV), Rome, Italy, 15–16 September 2014; pp. 41–46. [Google Scholar] [CrossRef]
- Butts, J.; McCallie, D.; Mills, R. Security analysis of the ADS-B implementation in the next generation air transportation system. Int. J. Crit. Infrastruct. Prot. 2011, 4, 78–87. [Google Scholar]
- Sampigethaya, K.; Poovendran, R. Visualization & assessment of ADS-B security for green ATM. In Proceedings of the AIAA/IEEE Digital Avionics Systems Conference, Salt Lake City, UT, USA, 3–7 October 2010. [Google Scholar]
- Strohmeier, M. Security in Next Generation Air Traffic Communication Networks. Ph.D. Thesis, University of Oxford, Oxford, UK, 2016. [Google Scholar]
- Berthier, P.; Fernandez, J.M.; Robert, J. SAT: Security in the air using Tesla. In Proceedings of the 2017 IEEE/AIAA 36th Digital Avionics Systems Conference (DASC), St. Petersburg, FL, USA, 17–21 September 2017; pp. 1–10. [Google Scholar] [CrossRef]
- Atanasov, A.; Chenane, R. Security Vulnerabilities in Next Generation Air Transportation System. Master’s Thesis, Department of Computer Science and Engineering, Chalmers University of Technology, Goteborg, Sweden, 2014. [Google Scholar]
- Haas, J.J.; Hua, Y.C.; Laberteaux, K.P. Real-world vanet security protocol performance. In Proceedings of the Global Telecommunications Conference, Honolulu, HI, USA, 30 November–4 December 2009. [Google Scholar]
- Ellis, K.; Serinken, N. Characteristics of Radio Transmitter Fingerprints. Radio Sci. 2001, 36, 585–597. [Google Scholar] [CrossRef]
- Knox, D.; Kunz, T. Secure Authentication in Wireless Sensor Networks Using RF Fingerprints. In Proceedings of the 2008 IEEE/IFIP International Conference on Embedded and Ubiquitous Computing, Shanghai, China, 17–20 December 2008. [Google Scholar]
- Kohno, T.; Broido, A.; Claffy, K.C. Remote physical device fingerprinting. IEEE Trans. Dependable Secur. Comput. 2005, 2, 93–108. [Google Scholar] [CrossRef]
- Zeng, K.; Govindan, K.; Mohapatra, P. Non-cryptographic authentication and identification in wireless networks [Security and Privacy in Emerging Wireless Networks]. IEEE Wirel. Commun. 2010, 10, 56–62. [Google Scholar] [CrossRef]
- Strohmeier, M.; Martinovic, I. On Passive Data Link Layer Fingerprinting of Aircraft Transponders. In Proceedings of the First ACM Workshop on Cyber-Physical Systems-Security and/or PrivaCy; York, A.N., Ed.; Association for Computing Machinery (ACM): New York, NY, USA, 2015. [Google Scholar] [CrossRef]
- Moser, D.; Leu, P.; Lenders, V.; Ranganathan, A.; Ricciato, F.; Capkun, S. Investigation of Multi-device Location Spoofing Attacks on Air Traffic Control and Possible Countermeasures. In ACM Conference on Mobile Computing and Networking; Association for Computing Machinery (ACM): New York, NY, USA, 2016. [Google Scholar]
- Leonardi, M.; Di Gregorio, L.; Di Fausto, D. Air Traffic Security: Aircraft Classification Using ADS-B Message’s Phase-Pattern. Aerospace 2017, 4, 51. [Google Scholar] [CrossRef]
- Leonardi, M.; Fausto, D.D. Secondary Surveillance Radar Transponders classification by RF fingerprinting. In Proceedings of the 2018 19th International Radar Symposium (IRS), Bonn, Germany, 20–22 June 2018; pp. 1–10. [Google Scholar] [CrossRef]
- Leonardi, M.; Fausto, D.D. ADS-B Signal Signature Extraction for Intrusion Detection in the Air Traffic Surveillance System. In Proceedings of the 2018 26th European Signal Processing Conference (EUSIPCO), Rome, Italy, 3–7 September 2018; pp. 2564–2568. [Google Scholar] [CrossRef]
- RTL-SDR.COM. Available online: www.rtl-sdr.com (accessed on 10 January 2020).
- Antirez-dump1090 Repository. Available online: https://github.com/antirez/dump1090 (accessed on 10 January 2020).
- Papoulis, A. Probability and Statistics; Prentice Hall: Upper Saddle River, NJ, USA, 1990. [Google Scholar]
- Mucherino, A.; Papajorgji, P.J.; Pardalos, P.M. k-Nearest Neighbor Classification. In Data Mining in Agriculture; Springer: New York, NY, USA, 2009; pp. 83–106. [Google Scholar] [CrossRef]
- Rohling, H. Ordered statistic CFAR technique—An overview. In Proceedings of the 2011 12th International Radar Symposium (IRS), Leipzig, Germany, 7–9 September 2011; pp. 631–638. [Google Scholar]
- Galati, G.; Leonardi, M.; Cavallin, A.; Pavan, G. Airport surveillance processing chain for high resolution radar. IEEE Trans. Aerosp. Electron. Syst. 2010, 46, 1522–1533. [Google Scholar] [CrossRef]
- Kirk Borne’s Homepage. Available online: http://kirkborne.net/papers/CIDU2010%20Borne-Vedachalam%20paper.pdf (accessed on 10 January 2020).
- Raspberry Pi. Available online: https://www.raspberrypi.org/ (accessed on 10 January 2020).


© 2020 by the authors. Licensee MDPI, Basel, Switzerland. This article is an open access article distributed under the terms and conditions of the Creative Commons Attribution (CC BY) license (http://creativecommons.org/licenses/by/4.0/).