Article

A Preliminary Investigation of Maintenance Contributions to Commercial Air Transport Accidents

1
Institute of Aviation Studies, The University of Management and Technology, Johar Town, Lahore, Punjab 54770, Pakistan
2
School of Engineering, RMIT University, Melbourne 3000, Australia
3
School of Engineering, Edith Cowan University, Joondalup 6027, Australia
4
School of Engineering and Information Technology, University of New South Wales, Canberra 2612, Australia
5
School of Tourism and Hospitality Management, Suan Dusit University, Bangkok 77110, Thailand
*
Author to whom correspondence should be addressed.
These authors contributed equally to this work.
Aerospace 2020, 7(9), 129; https://doi.org/10.3390/aerospace7090129
Submission received: 14 August 2020 / Revised: 25 August 2020 / Accepted: 26 August 2020 / Published: 2 September 2020

Abstract

:
Aircraft maintenance includes all the tasks needed to ensure an aircraft’s continuing airworthiness. Accidents that result from these maintenance activities can be used to assess safety. This research seeks to undertake a preliminary investigation of accidents that have maintenance contributions. An exploratory design was utilized, which commenced with a content analysis of the accidents with maintenance contributions (n = 35) in the official ICAO accident data set (N = 1277), followed by a quantitative ex-post facto study. Results showed that maintenance contributions are involved in 2.8 ± 0.9% of ICAO official accidents. Maintenance accidents were also found to be more likely to have one or more fatalities (20%), compared to all ICAO official accidents (14.7%). The number of accidents with maintenance contributions per year was also found to have reduced over the period of the study; this rate was statistically significantly greater than for all accidents (5%/year, relative to 2%/year). Results showed that aircraft between 10 and 20 years old were most commonly involved in accidents with maintenance contributions, while aircraft older than 18 years were more likely to result in a hull loss, and aircraft older than 34 years were more likely to result in a fatality.

Graphical Abstract

1. Introduction

Aircraft maintenance can be described as activities performed to maintain an aircraft in a serviceable and airworthy condition. ‘Maintenance’ includes activities involving component or aircraft repair, inspection, overhauling, troubleshooting, and modifications [1,2,3]. Aircraft maintenance is a critical task that is essential for warranting aviation safety in relation to the life-cycle of an aircraft [4,5,6]. Even though maintenance is regarded as one of aviation’s many high-risk areas due to its direct impact on aviation safety, it still has a considerable contribution in aircraft maintenance accident and incident occurrences [7,8,9,10]. Hobbs and Williamson [11] and Floyd [12] highlight the importance of understanding maintenance errors along with promoting a culture of identifying, reporting, and learning from maintenance errors for improving work quality and safety.
PeriyarSelvam, et al. [13] reports that maintenance costs typically make up between 10% and 20% of aircraft operational costs. The Airline Maintenance Cost Executive Commentary is published by International Air Transport Association’s Maintenance Cost Technical Group, contains annual data acquired from airlines around the world. These data are based on the airline’s maintenance cost data. Data collected from 54 airlines for 2018 shows that the airlines spent USD 69 billion on aircraft maintenance, repair, and overhaul. This represented approximately 9% of the total airline operational costs [14].
The general aim of this work is to help improve safety in scheduled commercial air transport; this will be achieved by understanding how accidents with maintenance contributions are unique in contrast to all other scheduled commercial air transport accidents. The knowledge gained from understanding these features of accidents with maintenance contributions will hopefully prevent further accidents, and hence, save lives and reduce the cost (both direct and indirect) to the aviation industry. The research questions addressed by this work include:
  • How many accidents in the ICAO official accident dataset are contributed to by maintenance factors, and by extension, what proportion of ICAO official accidents have a maintenance contribution? (RQ1)
  • How does the distribution of accidents that show a contribution from maintenance activities differ to all scheduled commercial air transport accidents, reported by ICAO? (RQ2)
  • Has the number of ‘official’ accidents with maintenance contributions reduced over time? (RQ3)
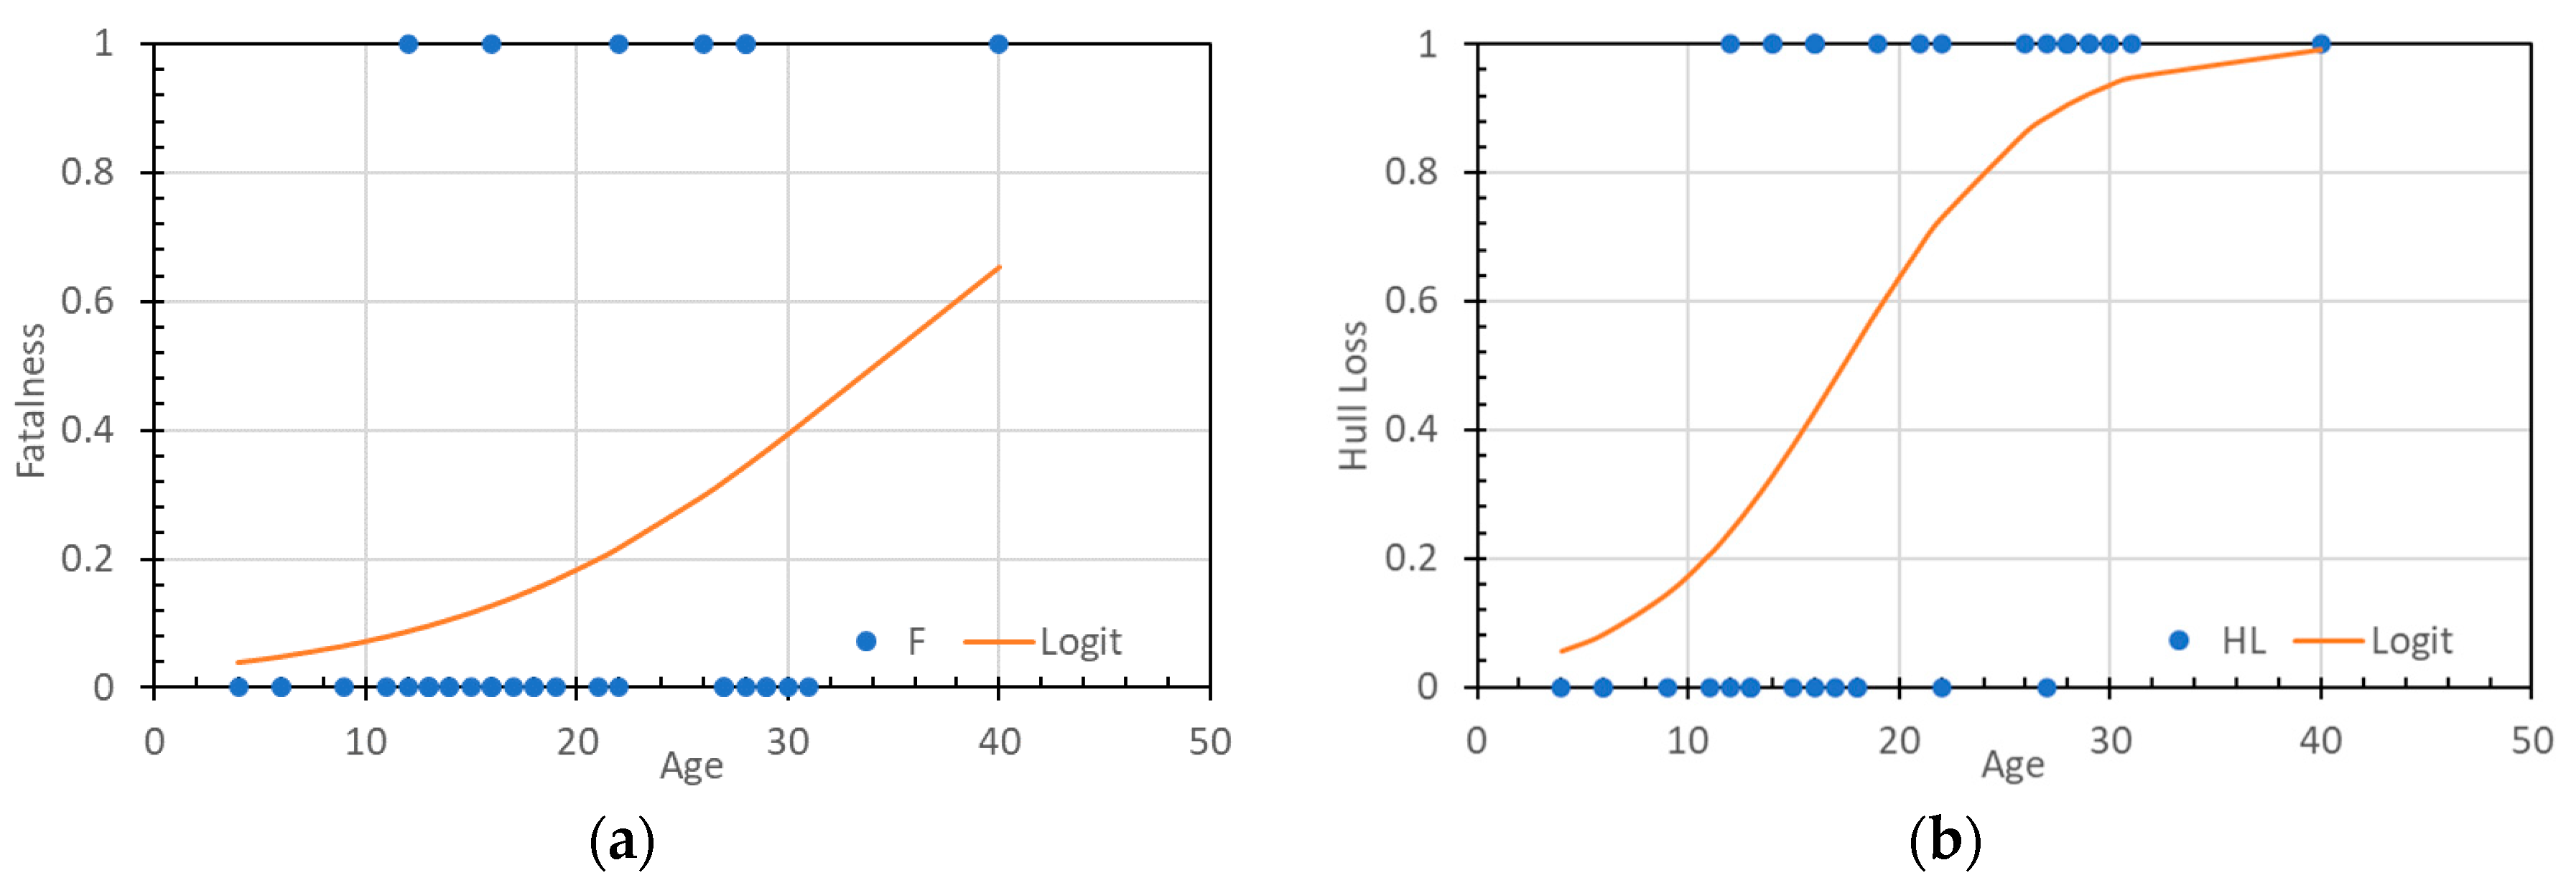
  • How does the age of an aircraft in an ‘official’ accident with maintenance contributions influence the outcome (fatalness and aircraft damage) of the occurrence? (RQ4)
In response to these research questions, the following research hypotheses were proposed:
  • There is currently no reported number for the proportion of accidents that have maintenance as a contributing factor. Estimates for air traffic management accidents are on the order of 8%, hence a similar single digit percentage would be reasonable to expect.
  • Accidents with maintenance contributions will show unique features in comparison to all aviation accidents; occurrences will typically be categorized as system component failures, and they will be more common in earlier phases of flight.
  • Given the short timeframe of the ICAO official accident dataset (since 2008), it is anticipated that the number of events will have remained constant over time, potentially with a slight reduction.
  • Older aircraft will be more likely to result in fatalities and hull losses.

2. Literature Review

2.1. Aircraft Maintenance Related Safety Occurrences in General Aviation

Nelson and Goldman [15] presented research on maintenance related accident investigations for general aviation aircrafts and home built aircrafts, reports for a period between 1983 and 2001 obtained from the National Transportation Safety Board (NTSB). All maintenance related accidents were divided into two databases one for amateur built aircraft and the other for GA. The databases were further analyzed as per human factors taxonomy of maintenance related casual factors. The reports were analyzed to establish the frequencies of fatalities and injuries, airframe time, phase of operation, and time since last inspection. The report further compared the taxonomy results of maintenance related casual factors for amateur built aircraft to general aviation maintenance related accidents. The research findings showed that the main cause of the maintenance related accidents in both amateur built aircraft and general aviation aircraft are due to installation of aircraft parts, at 32% and 17% respectively. Hence, maintenance considered as a causal accident factor, is approximately six times more likely to result in a fatal outcome in amateur built aircrafts as compared to general aircraft accidents.
Studies for analyzing maintenance related safety occurrences were carried out by Rashid et al. [16] and Saleh et al. [17]. The human factor analysis of both studies revealed that the most contributing factor towards maintenance incidents are associated with improper procedures being followed for inspections and installation of components, along with casual factors that are deeply rooted within the organizational and managerial levels. Rashid, Place, and Braithwaite [16] statistically and on a human factor basis analyzed 58 helicopter maintenance-induced safety occurrences. Data was acquired from incidents reports obtained from the Australia Transport Safety Bureau, TSB of Canada, CAA of New Zealand, the UK’s AAIB, and the USA’s NTSB. Saleh, Tikayat Ray, Zhang, and Churchwell [17], presented risk factor-based research findings focused on maintenance and inspection of helicopter accidents tracing the time for when the error was committed to the actual time when the accident took place. The study showed that about 31% of maintenance related accidents occurred within the first 10 flight hours. It also revealed that most of the preventive maintenance activities errors occurred due to nonconformance with published regulations or maintenance plans. The study recommended the providence of better training; emphasis on the development, use, and implementation of checklists; and strong awareness of the importance of safety along with isolation of workload from maintainers.

2.2. Aircraft Maintenance Related Safety Occurrences in Commercial Air Transport

Several studies have been conducted to understand the reasons behind maintenance related safety occurrences for promoting better safety culture in the commercial air transport sector. Research findings based on studies carried out by Suzuki et al. [18], Insley and Turkoglu [7] and Geibel et al. [19] revealed that the main causes of maintenance occurrences are due to inadequate maintenance procedures, lack of responsibility, and incorrect installations.
Insley and Turkoglu [7] presented a study based on enhancing the understanding of the safety critical functions related to the nature of aircraft maintenance-related accidents and serious incidents, between 2003 and 2017. For the selected time period it was found that runway excursions, air turnback’s, and on-ground gear-related events were the most common maintenance events while most of the system/component failures related to engine, landing gear, and flight controls. The data related to fatal accidents revealed collision events, engine-related events, and inadequate maintenance procedures were the most concerning maintenance factor. Similar results were observed by Suzuki, von Thaden, and Geibel [18] based on data collected for 1000 incidents centered on coordination problems in commercial aircraft maintenance from NASA’s Aviation Safety Report System (ARSR) for a period of two years from August 2004–July 2006. This study revealed that three problematic behaviors—not delivering information, sending wrong information, and lack of responsibility—are potential sources of impairment for safety procedures in aircraft maintenance. Geibel, von Thaden, and Suzuki [19], presented study results by analyzing issues that cause errors in airline maintenance. Technician qualifications, inspections, parts installation, contract maintenance issues, and log book documentation were the five main categories identified as high-profile performance-based error categories for the study based on 1000 incident reports identified for aircraft maintenance related issues from NASA ASRS for a time period from July 1997 through August 2006. The study concluded over that over 53% of the undesirable outcomes analyzed in the ASRS data were attributed to skill-based errors, such as slips, lapses, and perceptual errors, followed by routine violations (15%), and decision-making errors (9%).
A study based on the impact of human factors training for maintenance personnel to reduce maintenance incidents in the European Union and the United States was carried out by Reynolds et al. [20]. Data regarding the subject training was compared prior to the implementation of the human factors training, 1991–1998 and after the implementation of the subject training, 2000–2006. The study revealed that following the introduction of human factors training the mechanical incidents in the EU dropped from 33% to 22% while the percentage of mechanical incidents in the United States increased resulting in a significant statistical difference in rates for the US relative to the EU. Further a study conducted by Ng and Li [21] provides theoretically supported concepts aimed to provide assistance in analyzing aircraft maintenance incidents. The study investigated the causes of 109 aircraft maintenance incidents for which data was acquired from various airline companies. The results revealed that more than 60% of the aircraft maintenance tasks could be categorized as rule-based tasks as per the Rasmussen’s SRK framework while almost “50% of the incidents can be explained by well-known error types or work factors in the psychological literature”.

2.3. Aircraft Maintenance Related Safety Occurrences in Military Aviation

Human Factor Analysis and Classification System (HFACS) was used by Schmidt et al. [22] and Illankoon, Tretten, and Kumar [8] to analyze maintenance mishaps in military aviation. Schmidt, Schmorrow, and Figlock [22] carried out analyses of the influence of human factors on naval aviation maintenance mishaps. Information for a total of 470 maintenance related mishaps was gained from the Naval Safety Center’s Information Management Systems for the fiscal years, 1990–1997. The study revealed that supervisory, maintainer, and working latent conditions are present that can impact maintainers in the performance of their jobs. Illankoon, Tretten, and Kumar [8] analyzed data acquired from a fighter aircraft fleet looking for reported maintenance deviations over a period of 38 months beginning from January 2013, using HFAC-ME (Maintenance Extension) taxonomy to find and mark hidden causal factors. The study identifies attention, memory errors, inadequacy of processes, and documentation as key causal factors. The study also provides insight on how situational awareness (SA) interventions may contribute to the reduction of maintenance deviations while at the same time capture hidden causal factors.

2.4. Research Gap

There is a clear difference in specific results in the previous studies, along with similarities. These differences depending on data sets used and are likely real features of the corresponding populations. Previous work has looked at collections of all safety occurrences (accidents and incidents), subsets (just incidents etc.), and applications to specific segments of the aviation industry (GA, etc.). Given that the annual ICAO Safety Reports are published by the international body for air transport, it is important to understand accidents with maintenance contributions in this specific data set. Not only can statistically significant features be identified, trends over time can be analyzed to show how accidents with maintenance contributions in scheduled commercial air transport operations, utilizing large transport category aircraft, have evolved.

3. Materials and Methods

3.1. Research Design

This study utilized a mixed method approach, specifically an exploratory design, commencing with a qualitative content analysis to provide data for a quantitative ex-post facto study [23]. In this approach, the categorical data from the accidents with maintenance contributions were extracted, and then the narratives were coded further to generate additional categorical variables. Once the data was coded, it was then analyzed in an ex-post facto study, to analyze the distributions in comparison to all aviation accidents to assess if any observed differences were statistically significant.

3.2. Data Collection, Coding, and Cleaning

The primary source of data for this work was the set of ICAO official accidents [24]. This list of official accidents includes those used in the ICAO annual safety reports and is made up of all safety occurrences that are accidents, in a scheduled commercial operation, and investigated by the relevant national authority. Entries in the ICAO official accident dataset were cross referenced with the Aviation Safety Network (ASN) to provide narratives for the accidents with maintenance contributions. While the ASN database (provided by the Flight Safety Foundation [25]) includes maintenance as one of the contributing/causal factors (of which there are almost 100 cases), full text narrative searches of all entries in the ASN were undertaken. Advanced searches in both Google and Bing were conducted to the extent of the search engines, including omitted duplicates. The searches used criteria that limited the website searched (using “site:”, to the ASN database) and the title of the results (using “intitle:”, and “ASN Aircraft accident”). The additional search terms then used were “maintenance”, “mechanic”, “technician”, electrician”, “AME” (aircraft maintenance engineer), “LAME” (licensed aircraft maintenance engineer), “incorrect installation”, “incorrectly installed”, “inadequate inspection”, “airworthiness directive”, “service bulletin”, and “inadequate maintenance”. The general term “maintenance” was used last, as it returned the most results, and many of the cases were returned with the other more specific search terms, and hence if already selected were identifiable due to the hyperlink’s color change.
Using the details and narratives from the ASN, the 35 ICAO official accidents were coded with:
  • Maintenance issue,
  • Type of operation,
  • Operator’s business model,
  • Phase of flight (in which the maintenance issue first appeared)
  • Age (difference between year of the aircraft’s first flight and the year of the accident),
  • Accident category (A1 a hull loss, or A2 repairable), and
  • ICAO occurrence categories.
The maintenance issues used by ASN to code these accidents include:
  • Repair of previous damage,
  • Engine issue,
  • Failure to follow airworthiness directives or service bulletins,
  • Wrong or incorrect installation of parts, and
  • General issues (substandard practices etc).
The ICAO data already includes the number and type of engines. The range of mass categories used in the ICAO official accident dataset was insufficient, so a lookup-table was created for all the aircraft (1277, removing duplicates), including the weight (MTOW) and manufacturer (manufacturer was coded as the current active company responsible for the type, e.g., the DHC-8 is coded as Bombardier). These codes were then added to the records for all the accidents (not just the maintenance accidents). Another lookup-table was created for all the three-letter country codes, to give continent and ICAO region. These were used to code the region of the accident and the region of the operator.
The final data set utilized the downloaded spreadsheet from ICAO [24]. Additional columns were added to this spreadsheet; including: MTOW, manufacturer, the operator’s business model and the type of operation, the two regions (operator and occurrence), the phase of flight where the maintenance issue occurred, the date separated (day, month, and year), the year of first flight (and then the difference between that and year of accident giving the aircraft age), the identified maintenance issue (and associated system and sub-system), and the separated occurrence categories (downloaded as a single comma separated text string for each accident) giving a sample size of 60 due to the fact that accidents can be coded with multiple categories.

3.3. Data Analysis

3.3.1. Non-Parametric Analysis

For RQ2, given the small sample size, 35 accidents with maintenance contributions, testing was limited to utilizing Fisher’s exact test [26]. This type of testing with small sample sizes has previously been utilized in other post-accident analyses [27]; as with that work, Fisher’s exact tests were undertaken in MATLAB to determine the p-values. Specifically, in the testing of the various characteristics or features coded, the observed (O) data were the 35 accidents with maintenance contributions, while the expected (E) are those of the complete set of 1277 official accidents. The statistical hypotheses to be tested are given as
H0:   PO,n = PE,n
HA:   PO,n ≠ PE,n
where P is the proportion of the n’th category. That is, n separate Fisher’s exact tests were conducted.

3.3.2. Longitudinal Analysis

For RQ3, correlation was used to determine if any statistically significant trend existed over the 12 years of the study. Pearson’s correlation coefficient (r) is a measure of association between two interval or ratio variables. In this case, the number of accidents and the year. The statistical hypotheses to be tested are given as
H0:   r = 0
HA:   r ≠ 0
This test is assessing if there is an association between the number of accidents in each year and the year. A secondary question can be posed here, and that is, if the accident counts have reduced, has the rate of reduction for maintenance accidents reduced at the same rate or a different rate to all accidents? This requires two simple linear models
n all = α 1 + β 1 t
and
n m = α 2 + β 2 t
where α1 and β1 are the model coefficients to predict the count for all official ICAO accidents (nall), while α2 and β2 are the model coefficients to predict the counts for accidents with maintenance contributions (nm), and t is time in years. Assessing the difference in the rate of change requires a combined model, given as
n Δ = n m pn all = α 3 + β 3 t
where the new ‘dependent variable’ is given as the relative difference in the two accident groups (p is the proportion of all accidents which are maintenance related and approximately 35/1277). That is, multiplying nall by p gives a count relative to 35 instead of 1277, which means they are on the same scale. If this new count, or more correctly, the difference in the count (nΔ), diverges (β3 ≠ 0), then the rates are not equal (β1 ≠ β2). These can be expressed as
H0:   β3 = 0   or   β1 = β2
HA:   β3 ≠ 0   or   β1 ≠ β2
A subtle difference which needs to be mentioned is that since two dependent variables are being regressed against the independent variable, then the degrees of freedom are the number of observations (12) subtract 3, not the 2 associated with simple linear regression.
Logistic regression is needed to answer RQ4. This is because both fatalness and fate of the airframe (accident category) are both dichotomous variables (fatal or not, hull lost, or not), while the aircraft age is a continuous variable. Logistic regression is the ideal tool to measure association between a dichotomous dependent variable and a continuous independent variable. The statistical hypotheses to be tested are given as
H0:   β = 0
HA:   β ≠ 0
where β is the variable in the fitted logit function, that relates the continuous variable to the dichotomous output. The logit has the form,
π ( x ) = e α + β x 1 + e α + β x .
Here, π is the estimated probability of the dichotomous outcome at the given predictor level (x), in this case, age of the aircraft.

4. Non-Parametric Results and Analysis

4.1. Summary of Results

Table 1 shows the results for the Fisher’s exact tests comparing accidents with maintenance contributions to all accidents in the ICAO official accident data set. The characteristics that are statistically significant include region of occurrence (ROc), phase of flight (PoF), occurrence categories (OC), and manufacturer (Manu). The characteristics which were not statistically significant are the fatalness (Fat), region of operator (ROp), maximum takeoff mass (Mass), engine types (ET), and number of engines (nE). Table 2 shows the Fisher’s exact test results for those characteristics which were tested against a uniform expected distribution. Here, all but the operator’s business model (BM) were statistically significant; including, maintenance issue (MI), system/component issue (SC), the type of operation (Op), and the age of the aircraft at the time of the accident in decades (Age). Each of these characteristics will be discussed further below.

4.2. Comparative Data

4.2.1. Fatalness

Figure 1 shows the distribution of fatal to non-fatal accidents. For all the official ICAO accidents, 14.7% resulted in at least one fatality. For accidents with maintenance contributions this increased to 20%. As noted in Section 4.1, this difference is not statistically significant. The lack of statistical significance is due to the comparatively small sample size. That is, more than 1277 accidents have occurred in the aviation industry since 2008. However, specific criteria need to be met for an accident such that it is included in the ICAO official statistics. Of this population, the resultant sample of accidents with maintenance contributions that are fatal is too small to draw definitive conclusions. The conclusion of interest being that accidents with maintenance contributions appear to be more fatal than the ‘average’ accident. Further work is needed to confirm this conclusion.

4.2.2. World Region

While it might be worth considering an expected distribution for a region based on traffic numbers, comparing the distribution of regions for accidents with a maintenance contribution to the distribution of regions for all accidents removes sampling bias. That is, different countries may have different levels of reliability when it comes to ensuring relevant aviation accidents are shared with ICAO. By comparing a distribution of accidents to another distribution of accidents, this potential bias is removed. This is because in principle a country should be as likely to report an accident with a maintenance contribution as any other accident. Region is coded as both the region of the operator, and the region in which the accident occurred. Figure 2a shows the region of the operator (ROp) which was not statistically significant in Section 4.1. There is, however, a noticeable lack of North American maintenance accidents, with the Middle East and South and Latin America having slightly more than expected. Figure 2b shows the distribution of accidents for the region in which those accidents occurred (ROc). A similar trend can be seen, but more pronounced, hence the reason this test in Section 4.1 was statistically significant. The interesting result here is the spike for the Middle East. Looking at these cases there are no accidents associated with the big three Middle Eastern airlines (Emirates, Etihad, and Qatar); the cases are two Iranian, a Sudanese, and a charted aircraft operating for Saudi Arabia. The other noteworthy difference is the lack of accidents in Africa; previous work looking at human factors (HF) related accidents showed a greater prevalence of these accidents in Africa [28].

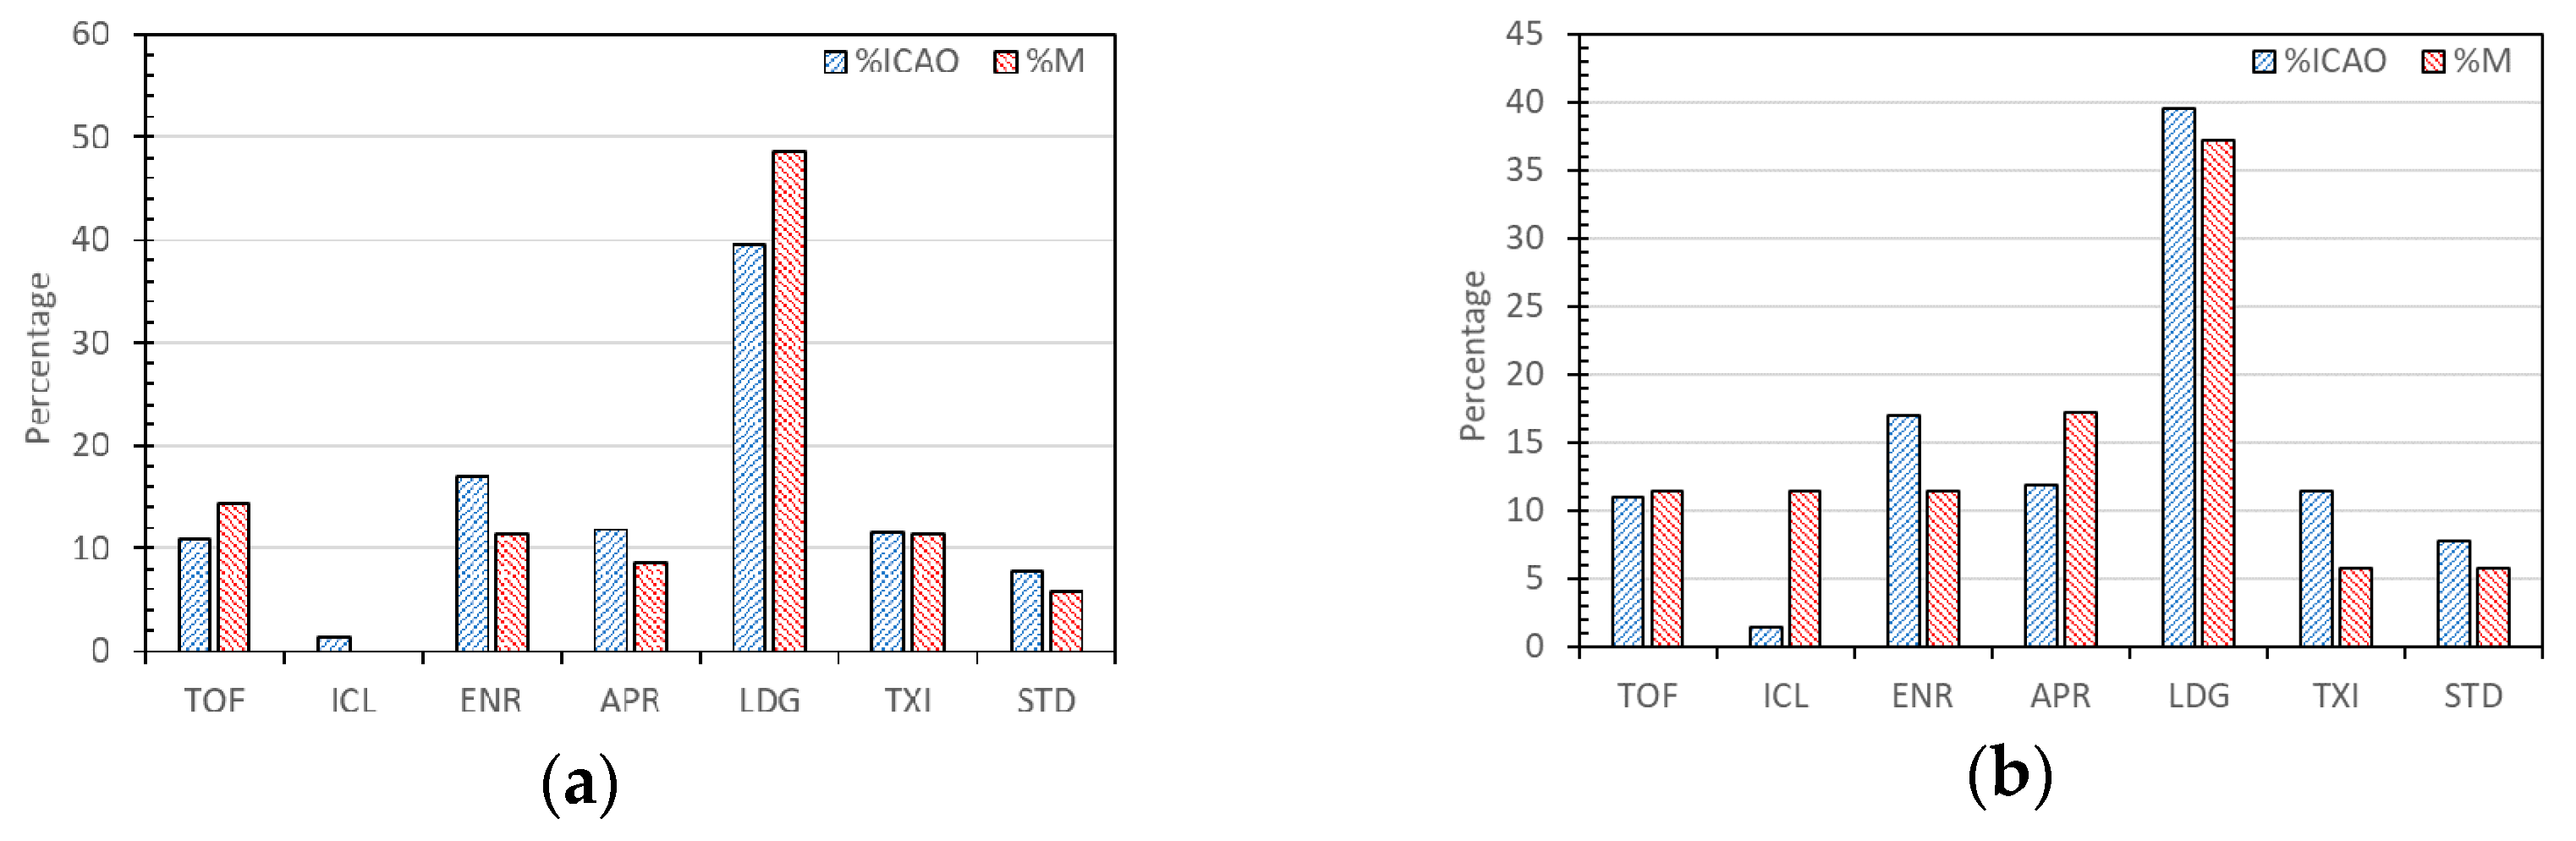
4.2.3. Phase of Flight

Figure 3 shows the distribution of accidents with maintenance contributions by phase of flight. The reason for recoding the phase of flight from the original ICAO codes is that a number of maintenance related issues manifest themselves prior to causing ‘the accident’. For example, gear related issues manifest themselves at takeoff (gear up) or approach (gear down), but the ‘accident’ is considered to have occurred upon landing. When the phase of flight as coded by ICAO was utilized (Figure 3a), no statistically significant result is observed (not included in Section 4.1), although there is a slight excess of landing accidents, again expected by the fact that maintenance issues are most commonly associated with the landing gear. When recoded (Figure 3b), the results are statistically significantly different (as shown in Section 4.1). As hypothesized, there are more accidents during climb; however, there is no increase during takeoff. Again, during climb (ICL) is when the gear is retracted, and this spike corresponds to these failures occurring at that time.

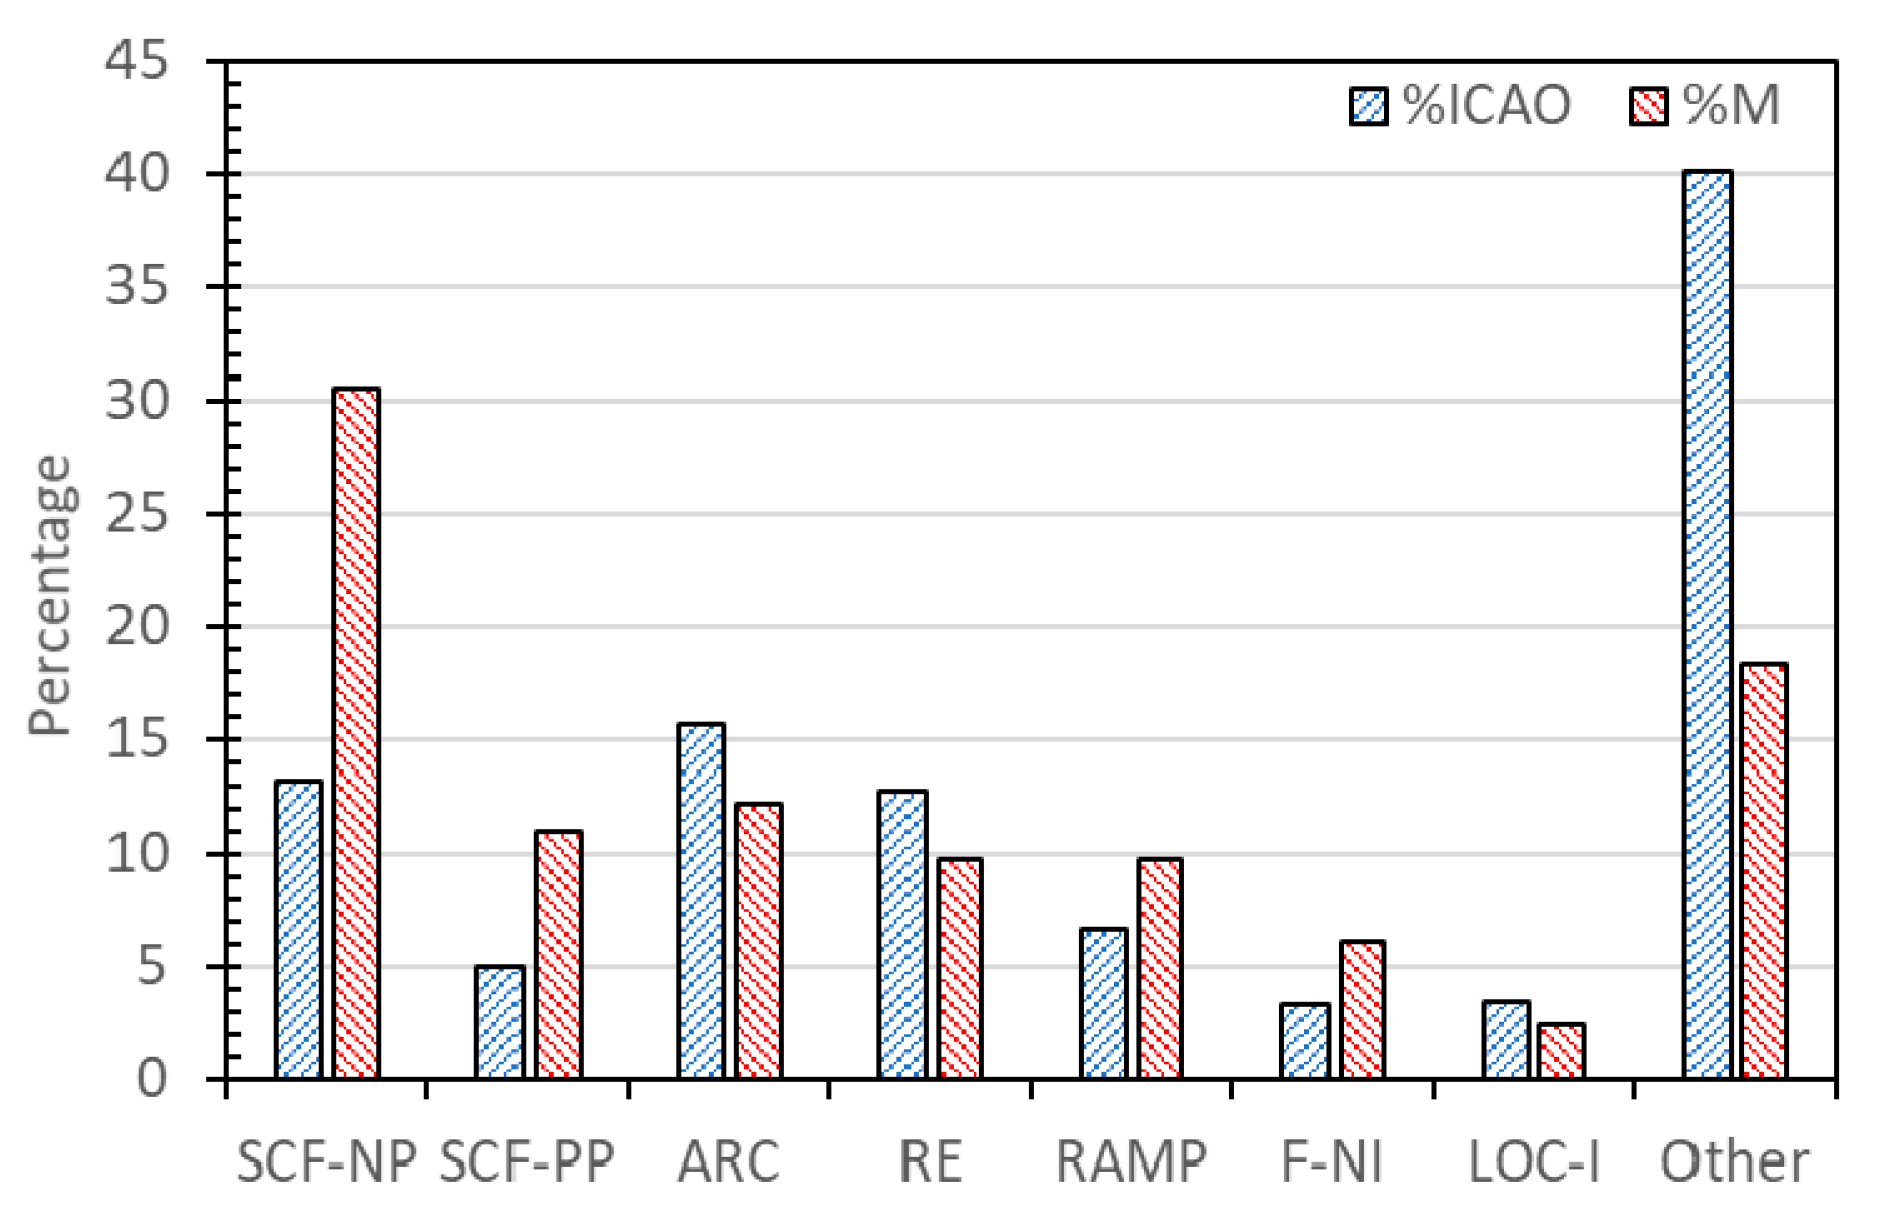
4.2.4. Occurrence Category

Any occurrence category that resulted in less than 5% of the total were grouped into an ‘other’ category. The results showing the associated occurrence categories in Figure 4 are not surprising, with system component failure non-powerplant (SCF-NP) the most common, followed by system component failure powerplant (SCF-PP). While in the ICAO official accident statistics SCF are common, they are more common in accidents with maintenance contributions. The increase in SCF occurrences is balanced by slightly less than expected abnormal runway contact (ARC) and runway excursions (RE); more significant is the lack of ‘other’ for accidents with maintenance contributions, and the fact that ‘other’ for ICAO official accidents includes turbulence (TURB) which is second most common cause in the ICAO official accident statistics.

4.2.5. Manufacturer

The distribution of accidents by manufacturer is shown in Figure 5. The mode for both distributions is clearly Boeing, which is expected based on the number of Boeing, McDonnell, and Douglas aircraft that have been in operation between 2008 and 2019. There are, however, fewer Airbus accidents with maintenance contributions relative to all official accidents. The key significant difference is for Ilyushin aircraft, where the percentage of maintenance accidents is 10 times the percentage of all accidents. This result mirrors previous research into human factors accidents [28], where accidents with Russian aircraft were more likely to be involved in those accidents. Interestingly, Antonov had no maintenance accidents while it had 43 other accidents in the ICAO official data set.

4.2.6. Mass Category

The ICAO Accident/Incident Data Reporting (ADREP) taxonomies code aircraft size as the mass category. These include maximum takeoff masses of (1) less than 2.25 tonnes, (2) 2.25 tonnes to 5.7 tonnes, (3) 5.7 tonnes to 27 tonnes, (4) 27 tonnes to 272 tonnes, and (5) above 272 tonnes. Given ICAO Official Accidents only include aircraft above 5.7 tonnes, the first two categories were omitted in the results. The distribution of accidents by mass category is shown in Figure 6. The mode is 3 (medium aircraft), and this mass category includes the majority of narrow body (single isle) large transport category aircraft, and the smaller wide body (twin isle) large transport category aircraft. The distributions are almost identical, and the test result was not statistically significant.

4.2.7. Engines

The ICAO ADREP taxonomies use multiple categories to differentiate the most common engine types used on aircraft. However, the ICAO official accidents code engines as reciprocating (piston), turboprop, and jet (which captures turbofan and turbojet engines). From Figure 7a, the most common engine in accidents (both maintenance and all) is jet. For the number of engines, Figure 7b, a twin engine aircraft is typically involved in accidents. This is because twin engine aircraft are the most common. For both engine type and engine count, there was no statistically significant difference between all accidents and those with maintenance contributions.

4.2.8. Maintenance Issue

From Figure 8a, ‘general’ (substandard practices, insufficient maintenance, qualification, training, etc.) has the highest count, and the observed variation is statistically significant. Engine and part issues are as expected, while ‘AD/SB’ (failure to follow airworthiness directives or service bulletins) and ‘PD’ (repaired previous damage), have low counts. Figure 8b shows the distribution of system/component involved in accidents with maintenance contributions. The statistically significant result indicates that the landing gear is involved in 47% of accidents, with engine is in 26%. Given the unexpectedly high count for gear related issues, a further sub-code of gear issue was created for these 16 accidents (Figure 8c) where mechanical/structural/physical issues were identified as the most common.

4.2.9. Operator and Operation

While in Figure 9a, there is a spike for FSNCs, this is not statistically significant. In fact, if we compare to a previous study that investigated business models in HF accidents [28], the distribution of accidents with maintenance contributions has a similar shape, and hence with a limited sample size, this would also not produce a statistically significant result. For the type of operation or service, the result is statistically significant, with the peak value for domestic and the minimum value for charter responsible for this. It should be noted that ICAO indicates globally that 60% of revenue passenger kilometers are currently international [29], leaving 40% for domestic (including regional). However, we can clearly see that accidents with maintenance contributions are more likely to occur in domestic operations, so relative to traffic, this becomes even more significant.

4.2.10. Age

Figure 10 shows the distribution of accidents with maintenance contributions by age. The mode is 10 to 20 years old. The interesting feature is the small count for aircraft that are 30 to 40 years old, and the data set included no accidents with maintenance contributions that were older than 40 years. Looking at the airlines involved, and consulting Airfleets.net [30], the average fleet age was (17.5 ± 4) years, which agrees with the average age for the 35 aircraft given as (19 ± 3) years. As such, the likely distribution coincides with the distribution of raw aircraft age (the ages of all aircraft in service).

5. Parametric Results and Analysis

5.1. Longitudinal Study

Table 3 shows the results for the various correlation and regression tests. The variables tested included:
  • ICAO, the total number of ICAO official accidents,
  • M, the number of ICAO official accidents with maintenance contributions,
  • M%, the percentage of accidents with maintenance contributions relative to all ICAO official accidents,
  • pICAO, the proportion of ICAO official accidents (relative to 2008),
  • pM, the proportion of accidents with maintenance contributions (relative to 2008), and
  • The model given by (3) above.
All of the tests were statistically significant. The results for the proportions match the respective raw count results, which is to be expected. However, the proportion results enable the β values to be directly compared, since they are relative counts. We note that maintenance accidents appear to have reduced over time 2.5 times faster than the rate of reduction in all ICAO official accidents. The statistical significance of this is supported by the results for the model given by (3). Figure 11 shows the annual accident counts for the accidents with maintenance contributions and all of the ICAO official accidents.

5.2. Logistic Regression Results

Research question 4 (RQ4) was posed to test the hypothesis that older aircraft are ‘more dangerous’ than newer aircraft. Clearly the context of this statement is only with regards to those accidents with a maintenance contribution. The two aspects here (fatalness and aircraft damage) and their relationship to age can be assessed with logistic regression. Figure 12a shows the resultant logit fitted to the fatalness data (0 = non-fatal, 1 = fatal), and the logit predicts that older aircraft are statistically significantly more likely to be associated with a fatality (McFadden’s pseudo R2 = 0.11, χ2 = 3.97, p = 0.046); to be clear, this is just statistically significant, and the R2 suggests only 11% in the variation of fatalness is due to the age of the aircraft, and the odds are even for an aircraft that is 34 years old. The limitation here is the small sample size, giving only a few fatal outcomes. Looking at the outcome for the aircraft (Figure 12b), the logit now much more clearly increases with age as hypothesized (McFadden’s pseudo R2 = 0.30, χ2 = 14.6, p <0.01). That is, about 30% of the variation in the aircraft damage outcome is predicted by the aircraft’s age, and the odds are even for an aircraft that is 18 years old.

5.3. Aircraft Maintenance Fraction

The Australian Transport Safety Bureau’s report into HF in aircraft maintenance [31] states that “precise statistics are unavailable” for the proportion of aviation accidents and incidents that are the result of improper maintenance. This is the inspiration for RQ1. While it would also be interesting to know the proportion of aviation incidents that have a maintenance contribution or causation, the ICAO official accident data is exactly that, only accident data. We have a database that contains n number of accidents each year, and we have a dataset that contains m number of accidents with maintenance contributions each year. Figure 13 shows this annual percentage of ICAO official accidents which have maintenance contributions.
Annually, the average percentage of accidents with maintenance contributions is given as (2.8 ± 0.9%). However, the result of the regression test for this was statistically significant, in terms of a reduction by 0.14% per year. That is, on average, this percentage is reducing by 1 every 7 years. The peak in 2016, and then the lack of an accident in 2019 suggests this reducing trend is an artifact of the small sample size. To conclude, approximately 3% of accidents are the result of aircraft maintenance.

6. Case Study

6.1. Rational

The results of the quantitative analysis produce findings that lack of context. While a trend over time can be shown to be statistically significant, further questions involving question of ‘why’ cannot be answered. Using the results of the quantitative analysis, a ‘typical’ case, however, can be identified. A case study of ‘typical’ accidents provides contextualization and helps to explain why the observed quantitative results exist. While a perfectly ‘average’ case would be ideal (embodying all modes), finding such as case is unrealistic. Even a study of “the average man” [32], with normally distributed anthropometry characteristics allowing average to mean within 0.3 standard deviations, after 10 characteristics out of 132 [33], there was no “average man” [34]. As such, we consider an indicative case here; this case is non-fatal, occurred in Europe with a European FSNC operator, during climb, that was a system component failure non-powerplant, for a twin engine jet aircraft in mass category 4, and is a general maintenance issue. The case is not Boeing (it is Airbus), not domestic (it is international), and is to a gear issue. That is, there are 10 ‘average’ or important characteristics and 3 that are not. The specific case involves a failure to follow Aircraft Maintenance Manual (AMM) procedures and an inadvertent aircraft swap by maintenance technicians led to the A319 aircraft, shortly after take-off, experiencing a detachment of fan cowl doors leading to hydraulic loss, fuel leak, and an engine fire.

6.2. The Flight

On 24, May 2013 the A319 aircraft departed from Heathrow for Oslo, Norway. As the aircraft rotated the fan cowl doors on both engines detached. The left engine was not damaged by the resulting debris; however, the right engine suffered damage from its detaching cowl door (Figure 14a). There was a subsequent loss of one hydraulic system and fuel also began leaking from the right engine. The loss of fuel from this engine was such that if the crew had not shut-down the engine on approach to land, the fuel supply to it would have been exhausted [35].
The crew requested and was cleared to return to Heathrow with an initial PAN call. On approach, the crew made the decision to shut-down the right engine. Shortly after this decision was made a fire warning for the right engine sounded. The crew’s response to this warning was to, “quickly shut down the right engine and discharged the first fire extinguisher bottle” [35]. A mayday call was made and after the required wait time, the second fire bottle was fired into the right engine.
After landing and coming to a halt on the runway, ATC informed the flight crew that there were flames visible in the right engine. Fire services arrived quickly to the aircraft and commenced fighting the fire, and an initial decision was made not to evacuate the aircraft. However, this was quickly changed to a request for the left engine to be shut down and a cabin to be evacuated from the left side of the aircraft. This resulted in no fatal or serious injuries to crew or passengers [35].

6.3. Maintenance of the Accident Aircraft

The aircraft had been inspected by two maintenance technicians, through the night, prior to the accident flight. One of the required tasks was to lift the fan cowl doors and inspect the oil level of the integrated drive generator (IDG). The inspection revealed the oil for the IDG on each engine needed to be replenished. As the technicians did not have the requisite equipment or oil for this task they decided to continue to complete the checks for the aircraft, move to inspect other aircraft, and return to the accident aircraft later in the shift after they had retrieved the correct equipment and oil.
In contravention of the AMM procedures, the technicians lowered the fan cowl doors and left them “open, resting on the hold-open device (depicted in Figure 14b). (With the) hook re-engaged with the latch handle, (therefore the) cowling (was) not locked” [35]. In effect, the cowl doors were like the Grand Old Duke of York’s men, neither up on telescopic struts nor down and locked, rather they were held somewhere in between. The technicians saw this as a common practice, albeit one that was not in the promulgated procedures. The investigators found that other technicians in the company saw this as a common practice. The rationale was that by leaving the doors open it was a hazard to staff.

6.4. Drift into Failure

This process is described by Dekker [36] as drift into failure, where workers make changes to practices so as to help them achieve the end goals. The new practice gets accepted by the workforce, it becomes “normal” and as the practices are the new normal, the workers do not see a need to report their diverging actions [37]. This drift of practice away from promulgated procedures is not necessarily a precursor to an accident. As Dekker [38] writes,
“not following procedures does not necessarily lead to trouble, and safe outcomes may be preceded by just as (relatively) many procedural deviations as those that precede accidents”.
The aircraft manufacturer, after the event, surveyed operators of the A32X series of aircraft and found that 69% of fan cowl loss events followed the opening of the cowl for the checking or replenishing of the IDG oil levels [35].
The investigators of the accident flight discovered how widespread the practice of leaving the cowl doors on hold-open device was when, in interviews with other technicians, it was suggested that 70% of staff followed this non-promulgated procedure [35]. The normality of this practice was further reflected in an examination of the operator’s internal audits over the years 2011–2013 which found no reports of this practice deviation of not complying with the AMM procedures.

6.5. Aircraft Swap

After progressing with their planned course of action to complete checks on other aircraft, the maintenance crew had a break from work then proceeded to obtain the required equipment and supplies to replenish the IDG oil levels of the accident aircraft. The two technicians then went to another aircraft believing it was the aircraft they intended to service; it was, however, the wrong aircraft. They were surprised to note that the cowl doors were closed and latched and thought that perhaps other staff had locked the cowl doors. They decided to check all was well and opened the cowl doors and noted that the IDG oil levels on both engines were at acceptable levels. They rationalized that the oil levels had risen to acceptable levels as the engine had cooled. So they correctly closed up the cowl doors and verified each other’s work [35], on the wrong aircraft.
This is an example of an aircraft swap error—that is, “required maintenance being carried out on an incorrect aircraft” (p. 78) [35]. The investigators found aircraft swap errors were “an occasional, infrequent occurrence” (p. 78) [35]. In having the correct plan of returning to the accident aircraft to complete the service but incorrectly carrying out the plan by going to the wrong aircraft the technicians unsafe act was a slip, rather than a mistake [39]. The outcome of the normalized changes to promulgated procedures when opening cowl doors, along with the aircraft swap error was that the accident aircraft was dispatched to service with the cowl doors still on the hold-open device and not fully latched.

6.6. Active Failures and Latent Conditions

Reason’s [39] first description and illustration of the now ubiquitous “Swiss-Cheese” model, had five “planes”. These planes were defenses against accidents occurring. The first four planes did not have holes through them. The last two planes interacted with local events and along with the limited window of opportunity afforded by a hole in the last planes an accident could occur. A further refinement by Reason of his model was published in 1997. He saw that to understand accidents there needed to be three elements, hazards, defenses, and loses. The defenses had latent conditions arising from organization factors as well as local workplace factors.
The defenses the accident organization has in place against an event such as the cowl doors not being fully latched involved a member of the flight crew and a ground crew worker conducting separate visual checks of the aircraft including the latching devices. Unfortunately, workplace failures punched holes in this localized defense. Neither the co-pilot on his walk around inspection nor the tug driver on his inspection noticed the locking devices protruding below the cowls. The latent condition that contributed to the lack of visual recognition of the unsafe condition of the cowl doors was the positioning of the latching devices being close to the ground and not easy to see. To visually check these devices, the workers were required to be on hands and knees on the ground [35], an option that obviously did not appeal to the co-pilot or tug driver.
One of the ‘planes’ in Reason’s (1990) original iteration of the Swiss Cheese model was labeled “fallible decisions”, Kourousis, et al. [40] identified the increased defenses the manufacturer of the A32X series of aircraft inserted into the safety system in the aftermath to this accident in an effort to reduce or eliminate the occurrences of cowl doors not being fully latched at take-off. Mandated modifications included new hardware and new procedures. However, the authors noted the potential latent failings that could arise from these newly implemented modifications [40]. These latent conditions arising from fallible decisions made by people who are not proximal to the accident may hinder or even work directly against the desired effect of reducing the number of cowl door incidents the mandated modifications are seeking.

7. Discussion

7.1. Findings

For RQ1 we note that on average aircraft maintenance contributes to (2.8 ± 0.9%) of all accidents. This rate appears to be showing a slight but statistically significant decrease with time, which if it was to continue suggests in 20 years maintenance could consistently contribute to no accidents; although this is an ambition statement being well outside the predictive capability of this simple longitudinal analysis. Of these maintenance accidents, the properties of note are the prevalence of general maintenance issues, such as inadequate maintenance and slips and lapses (like those associated with failing to latch engine cowls). The small number of AD/SB and previous damage accidents suggests when mandatory and completed, maintenance activities are effective in ensuring an aircraft is safe and airworthy. Looking at the systems involved, it was noted that issues with the landing gear accounted for almost half (47%) of cases; of these, 60% were due to structural/physical issues (not hydraulic or electrical issues). This is not surprising given the large mechanical loads placed on the landing gear.
There are a number of interesting characteristics of accidents with maintenance contributions relative to all ICAO official accidents. While the fatalness was slightly higher, 20% relative to 14.7%, this difference was not statistically significant. In terms of world regions, there was no statistically significant difference for the region of operator. However, for the region of the occurrence, there is a statistically significant difference. This is driven by a spike in accidents in the Middle East and South/Latin America, and a lower than expected count in North America. For phase of flight, a spike of engine related maintenance issues during initial climb resulted in a statistically significantly different distribution, one of which is further highlighted in the case study presented. The results for occurrence categories are as expected; an excess of system component failures, and a lack of ‘environment’ related occurrences. Of note here is that runway related occurrences are as expected. In terms of aircraft properties (number of engines, type of engine, and MTOW), there was no difference between accidents with maintenance contributions and all ICAO official accidents. However, for the manufacturer, the relatively accident free Ilyushin aircraft showed a spike in accidents with maintenance contributions that resulted in a statistically significant difference in the distribution of accidents by manufacturer. The final aircraft property considered was age, the results for which suggest that an aircraft between 10 and 20 years old is more likely to have an accident with a maintenance contribution, and very old aircraft (those over 30 years) were the least observed to be involved in accidents with maintenance contributions. In terms of the commercial operation and operator, there was no statistically significant difference for the operator, but domestic scheduled services did show a statistically significant count, again likely due to the volume of domestic traffic.
In response to RQ3, it is noted that all accident counts reduced over the period of the study. The relatively significant reduction of accidents with maintenance contributions since 2008 is promising. The fact that these accidents have reduced ‘faster’ than ‘average’ is also promising. Finally for RQ4, it was noted that while accidents with maintenance contributions occur less often as an aircraft becomes older (given older aircraft are less likely to be utilized in commercial air transport for economic reasons), the outcomes of those limited accidents tends to be worse, with the odds of both a fatal outcome and the aircraft being written-off increasing with age.
The undertaken case study highlights that maintenance issues are not exclusively an issue of budget conscious LCCs in commercial air transport, operating third tier aircraft. The fact that an indicative case involves a legacy airline (British Airways), and one of the two work horses of high capacity narrow body operations (Airbus A32X), highlights that maintenance can contribute to accidents across the aviation industry. The case also highlights that simple slips and lapses can result in an accident at great cost to the operator. So while significant improvements were implemented in the 1990s, there is still a lot of work that needs to be done to eliminate maintenance contributions to accidents in scheduled commercial air transport, and if not eliminate, consistently result in zero cases per year.

7.2. Assumptions and Limitations

The key limitation of this work is the small size of the data set. There is limited statistical power associated with small data sets. Of note here is the just statistically significant result of the odds of a fatality based on aircraft age. A larger dataset would help to either confirm of disprove this. Similarly, the data set size has influenced the trend in percentage of maintenance accidents over time, with significant ‘noise’ in the last three years.
It could also be argued that the lack of information about incidents, which are far more common than accidents, is a limitation. It should, however, be noted that accidents result in significant damage or injury, even hull loss or death, unlike incidents. As such, research in accidents is arguably more important in aviation safety.
The use of uniform expected distributions for some of the categorical variables is also a limitation. For the maintenance issue and the systems/components involved the goal is to simply assess if one of these is statistically speaking more likely than the others. In contrast, for the operator (business model) and operation (type of service), these would benefit from a non-uniform expected distribution. With time and effort, these codes could be created for all 1277 accidents in the ICAO official dataset. The additional insight gained from this could be useful or limited.
It would be ideal to analyze the dataset looking for covariances between the categorical variables considered. This would ideally help identify latent classes in the data (combinations of variable values that are more likely to occur together, and hence present a greater safety risk, e.g., an Ilyushin cargo aircraft in the Middle East). However, the limited number of accidents with maintenance contributions means that performing cross tabulations for these would result in such small counts that the associated Fisher’s exact test would likely yield no statistically significant results.

7.3. Future Work

Future work will utilize all the collated maintenance accidents from the ASN database (of which there are approximately 360, spanning 1940 to 2019), to see if all accidents with maintenance contributions are different to those captured in the official ICAO accident dataset. This will also require a comparison to the ASN dataset as a population, rather than the ICAO dataset. This will enable all of the properties in this study to be expanded beyond the scheduled commercial large transport category aircraft operations captured by the ICAO official accident statistics. Many of the limitations will be overcome with this larger data set, presenting even further opportunities for future work.
The other follow up question that remains unanswered is the proportion of incidents with a maintenance contribution or causation. The hypothesis is that a much higher percentage of incidents could be the result of maintenance issues, which are rectified before they become accidents. Many readers will have experienced either personally or professionally a delay at the gate because of ‘technical issues’. While maintenance personnel are clearly fixing technical issues, the topic of this work demonstrates that they also cause other technical issues, but how many? To answer this question requires an all-encompassing dataset with narrative information available to search for maintenance issues.

8. Conclusions

This work has investigated official ICAO accidents with maintenance contributions. The use of an exploratory research design enabled interesting features of these accidents to be identified (during the qualitative phase) and studied further (in the quantitative phase) to understand how the values of these variables are distributed and vary relative to all accidents. Maintenance was found to have contributed to approximately 3% of all accidents and resulted in slightly more accidents with a fatality (at least 1); that is, 20% of accidents with maintenance contributions ended with a fatality, while in the ICAO official accident data, only 15% were fatal. Relative to all accidents, the number of accidents with maintenance contributions was also found to be reducing at a greater rate over the 12-year span of the data used in this study. That is, accidents with maintenance contributions are reducing at a rate of 5% per year, while the rate at which all accidents is reducing is 2% per year. Finally, the effect of aircraft age was quantified. Accidents with maintenance contributions typically occur with an age of 10 to 20 years, and an average age of 19 years. Based on age, the outcome of the accident for crew and passengers (in terms of fatalness) and for the aircraft (in terms of a hull loss) were more likely to end badly. Specifically, for whether or not the aircraft was written off (damaged beyond repair), there was a significant trend showing that even odds occurred at 18 years; that is if an aircraft is older than 18 years when in an accident it is more likely than not to be written-off. For fatalness, even odds occurred at an age of 34 years, which means that if the aircraft involved in the accident was more than 34 years old, it was more likely than not to involve a fatality.

Author Contributions

Conceptualization, F.N.K., J.M. and G.W.; Data curation, G.W.; Formal analysis, J.M., G.B. and G.W.; Investigation, F.N.K., A.A., J.M., G.B. and G.W.; Methodology, G.W.; Project administration, G.B.; Resources, A.A. and G.W.; Supervision, G.B.; Visualization, G.W.; Writing—original draft, F.N.K., J.M. and G.W.; Writing—review & editing, A.A., G.B. and G.W. All authors have read and agreed to the published version of the manuscript.

Funding

This research received no external funding.

Conflicts of Interest

The authors declare no conflict of interest.

References

  1. EASA. Official Journal of the European Union: Commission Regulation (EU) No 1321/2014; European Aviation Safety Agency: Cologne, Germany, 2014.
  2. FAA. Maintenance Programs for U.S.-Registered Aircraft Operated Under 14 CFR Part 129 FAA; Federak Aviation Authority: Washington, DC, USA, 2009.
  3. PCAA. Approved Maintenance Organisations-Air Navigation Order, 3rd ed.; Pakistan Civil Aviation Authority: Karachi, Pakistan, 2019.
  4. Wang, L.; Sun, R.; Yang, Z. Analysis and evaluation of human factors in aviation maintenance based on fuzzy and AHP method. In Proceedings of the 2009 IEEE International Conference on Industrial Engineering and Engineering Management, Hong Kong, China, 8–11 December 2009; pp. 876–880. [Google Scholar]
  5. Rajee Olaganathan, D.; Miller, M.; Mrusek, B.M. Managing Safety Risks in Airline Maintenance Outsourcing. Int. J. Aviat. Aeronaut. Aerosp. 2020, 7, 7. [Google Scholar] [CrossRef]
  6. Bağan, H.; Gerede, E. Use of a nominal group technique in the exploration of safety hazards arising from the outsourcing of aircraft maintenance. Saf. Sci. 2019, 118, 795–804. [Google Scholar] [CrossRef]
  7. Insley, J.; Turkoglu, C. A Contemporary Analysis of Aircraft Maintenance-Related Accidents and Serious Incidents. Aerospace 2020, 7, 81. [Google Scholar] [CrossRef]
  8. Illankoon, P.; Tretten, P.; Kumar, U. A prospective study of maintenance deviations using HFACS-ME. Int. J. Ind. Ergon. 2019, 74, 102852. [Google Scholar] [CrossRef]
  9. Lestiani, M.E.; Yudoko, G.; Purboyo, H. Developing a conceptual model of organizational safety risk: Case studies of aircraft maintenance organizations in Indonesia. Transp. Res. Procedia 2017, 25, 136–148. [Google Scholar] [CrossRef]
  10. Dalkilic, S. Improving aircraft safety and reliability by aircraft maintenance technician training. Eng. Fail. Anal. 2017, 82, 687–694. [Google Scholar] [CrossRef]
  11. Hobbs, A.; Williamson, A. Skills, rules and knowledge in aircraft maintenance: Errors in context. Ergonomics 2002, 45, 290–308. [Google Scholar] [CrossRef] [PubMed]
  12. Floyd, H.L. Maintenance Errors as Cause for Electrical Injuries-What We Can Learn from Aviation Safety. In Proceedings of the 2019 IEEE IAS Electrical Safety Workshop (ESW), Jacksonville, FL, USA, 4–8 March 2019; pp. 1–6. [Google Scholar]
  13. PeriyarSelvam, U.; Tamilselvan, T.; Thilakan, S.; Shanmugaraja, M. Analysis on costs for aircraft maintenance. Adv. Aerosp. Sci. Appl. 2013, 3, 177–182. [Google Scholar]
  14. IATA MCTG. Airline Maintenance Cost Executive Commentary; International Air Transport Association: Montreal, QC, Canada, 2019. [Google Scholar]
  15. Nelson, N.L.; Goldman, S.M. Maintenance-Related Accidents: A Comparison of Amateur-Built Aircraft to all Other General Aviation. Hum. Factors Ergon. Soc. Annu. Meet. 2003, 47, 191–193. [Google Scholar] [CrossRef]
  16. Rashid, H.; Place, C.; Braithwaite, G. Helicopter maintenance error analysis: Beyond the third order of the HFACS-ME. Int. J. Ind. Ergon. 2010, 40, 636–647. [Google Scholar] [CrossRef]
  17. Saleh, J.H.; Tikayat Ray, A.; Zhang, K.S.; Churchwell, J.S. Maintenance and inspection as risk factors in helicopter accidents: Analysis and recommendations. PLoS ONE 2019, 14, e0211424. [Google Scholar] [CrossRef] [Green Version]
  18. Suzuki, T.; Von Thaden, T.L.; Geibel, W.D. Coordination and safety behaviors in commercial aircraft maintenance. In Proceedings of the Human Factors and Ergonomics Society Annual Meeting, New York, NY, USA, 22–26 September 2008; pp. 89–93. [Google Scholar]
  19. Geibel, W.D.; Von Thaden, T.L.; Suzuki, T. Issues that precipitate errors in airline maintenance. In Proceedings of the Human Factors and Ergonomics Society Annual Meeting, New York, NY, USA, 22–26 September 2008; pp. 94–98. [Google Scholar]
  20. Reynolds, R.; Blickensderfer, E.; Martin, A.; Rossignon, K.; Maleski, V. Human Factors Training in Aviation Maintenance: Impact on Incident Rates. In Proceedings of the Human Factors and Ergonomics Society Annual Meeting, San Francisco, CA, USA, 27 September 2010; pp. 1518–1520. [Google Scholar]
  21. Ng, M.-W.; Li, S.Y. An analysis of aircraft maintenance incidents using psychological and cognitive engineering knowledge. In Proceedings of the Human Factors and Ergonomics Society Annual Meeting, Washington, DC, USA, 19–23 September 2016; pp. 1676–1680. [Google Scholar]
  22. Schmidt, J.; Schmorrow, D.; Figlock, R. Human factors analysis of naval aviation maintenance related mishaps. In Proceedings of the Human Factors and Ergonomics Society Annual Meeting, San Diego, CA, USA, 30 July 2000; pp. 775–778. [Google Scholar]
  23. Wild, G.; Murray, J.; Baxter, G. Exploring Civil Drone Accidents and Incidents to Help Prevent Potential Air Disasters. Aerospace 2016, 3, 22. [Google Scholar] [CrossRef] [Green Version]
  24. ICAO. ICAO iSTARS API Data Service. Available online: https://www.icao.int/safety/istars/pages/api-data-service.aspx (accessed on 18 July 2020).
  25. Aviation Safety Network. ASN Aviation Safety Database. Available online: https://aviation-safety.net/database/ (accessed on 18 July 2020).
  26. Raymond, M.; Rousset, F. An Exact Test for Population Differentiation. Evolution 1995, 49, 1280–1283. [Google Scholar] [CrossRef] [PubMed]
  27. Ayiei, A.; Murray, J.; Wild, G. Visual Flight into Instrument Meteorological Condition: A Post Accident Analysis. Safety 2020, 6, 19. [Google Scholar] [CrossRef] [Green Version]
  28. Kharoufah, H.; Murray, J.; Baxter, G.; Wild, G. A review of human factors causations in commercial air transport accidents and incidents: From to 2000–2016. Prog. Aerosp. Sci. 2018, 99, 1–13. [Google Scholar] [CrossRef]
  29. ICAO. ICAO Long-Term Traffic Forecasts; International Civil Aviation Organization: Montreal QC, Canada, 2016. [Google Scholar]
  30. Airfleet.net. Airline Fleet Age. Available online: https://www.airfleets.net/ageflotte/fleet-age.htm (accessed on 7 July 2020).
  31. ATSB. An Overview of Human Factors in Aviation Maintenance; Australian Transport Safety Bureau: Canberra, Australia, 2018.
  32. Daniels, G.S. The Average Man? Air Force Aerospace Medical Research Lab Wright-Patterson Air Force Base: Dayton, OH, USA, 1952.
  33. Hertzberg, H.; Daniels, G.S.; Churchill, E. Anthropometry of Flying Personnel-1950; Antioch College: Yellow Springs, OH, USA, 1954. [Google Scholar]
  34. Parker, M. Humble Pi: A Comedy of Maths Errors; Penguin Books Limited: London, UK, 2019. [Google Scholar]
  35. AAIB. Report on the Accident to Airbus A319-13, G-EUOE London Heathrow Airport 24 May 2013; AAIB: Farnborough, UK, 2015.
  36. Dekker, S. Why we need new accident models. Hum. Factors Aerosp. Saf. 2004, 2. Available online: https://www.diva-portal.org/smash/record.jsf?pid=diva2%3A244497&dswid=-3453 (accessed on 2 August 2020).
  37. Dekker, S. Drift into Failure: From Hunting Broken Components to Understanding Complex Systems; CRC Press: Boca Raton, FL, USA, 2016. [Google Scholar]
  38. Dekker, S. Failure to adapt or adaptations that fail: Contrasting models on procedures and safety. Appl. Ergon. 2003, 34, 233–238. [Google Scholar] [CrossRef]
  39. Reason, J. Managing the Risks of Organizational Accidents; Routledge: New York, NY, USA, 2016. [Google Scholar]
  40. Kourousis, K.I.; Chatzi, A.V.; Giannopoulos, I.K. The airbus A320 family fan cowl door safety modification: A human factors scenario analysis. Aircr. Eng. Aerosp. Technol. 2018, 90, 967–972. [Google Scholar] [CrossRef]
Figure 1. Distribution of fatalness for accidents with maintenance contributions.
Aerospace 07 00129 g001
Figure 2. Distribution of world region for accidents with maintenance contributions: (a) region of the operator (ROp); (b) region where the accident occurred (ROc).
Aerospace 07 00129 g002
Figure 3. Distribution of phase of flight for accidents with maintenance contributions: (a) the phase in which the accident occurred (end result); (b) the phase in which the maintenance issue manifested.
Aerospace 07 00129 g003
Figure 4. Distribution of occurrence categories for accidents with maintenance contributions.
Aerospace 07 00129 g004
Figure 5. Distribution of aircraft manufacturer for accidents with maintenance contributions.
Aerospace 07 00129 g005
Figure 6. Distribution of aircraft mass category for accidents with maintenance contributions.
Aerospace 07 00129 g006
Figure 7. Distribution of aircraft engines for accidents with maintenance contributions: (a) the type of engine; (b) the number of engines.
Aerospace 07 00129 g007
Figure 8. Results for the maintenance and technical issues for accidents with maintenance contributions: (a) the broad maintenance issue; (b) the system or component involved in the maintenance issue; (c) the type of gear fault.
Aerospace 07 00129 g008
Figure 9. Results for aviation aspect of the accidents with maintenance contributions: (a) the operators business model; (b) the type of operation/service.
Aerospace 07 00129 g009
Figure 10. Results for the age of aircraft involved in aircraft maintenance related accidents.
Aerospace 07 00129 g010
Figure 11. The trends over time for accidents with maintenance contributions (secondary axis, purple line with large dashes) and all ICAO official accident (blue line with small dashes).
Aerospace 07 00129 g011
Figure 12. Results for the logistic regression investigating the effect of aircraft age on: (a) fatalness of maintenance accidents (0 = no fatalities, 1 = fatalities); (b) aircraft damage from maintenance accidents (0 = aircraft repaired, 1 = aircraft damaged beyond repair = hull loss).
Aerospace 07 00129 g012
Figure 13. Percentage of all accidents in the ICAO official accident data set that have been identified with a maintenance contribution, 2008 to 2019. The shaded band illustrates the confidence interval of the average, (2.8 ± 0.9%).
Aerospace 07 00129 g013
Figure 14. (a) Resultant damage to the right engine, with the cowling detached; The difference in the cowl fully locked (b) and just latch but not locked (c) [35].
Aerospace 07 00129 g014
Table 1. Fisher’s exact test, comparing characteristics of accidents with maintenance contributions to all accidents, in the ICAO official accident data set.
FatROpROcPoFOCManuMassETnE
p0.280.580.040.03~00.020.930.840.59
ConcNNYYYYNNN
Table 2. Fisher’s exact test, to determine if characteristics of accidents with maintenance contributions are different to an expected uniform distribution.
MISCGearBMOpAge
p0.010.010.170.310.020.03
ConcYYNNYY
Table 3. Correlation and regression test results for the various longitudinal factors.
ICAOMM%pICAOpMModel
β−2.77−0.29−0.14−0.02−0.05−0.21
r20.240.420.100.240.420.22
n121212121212
v10101010109
t5.588.453.295.588.454.73
p<0.01<0.010.01<0.01<0.01<0.01
SigYYYYYY

