Article

Plunging Airfoil: Reynolds Number and Angle of Attack Effects

by
Emanuel A. R. Camacho
*,
Fernando M. S. P. Neves
,
André R. R. Silva
and
Jorge M. M. Barata
LAETA-Aeronautics and Astronautics Research Center, University of Beira Interior, 6201-001 Covilhã, Portugal
*
Author to whom correspondence should be addressed.
Aerospace 2021, 8(8), 216; https://doi.org/10.3390/aerospace8080216
Submission received: 14 June 2021 / Revised: 22 July 2021 / Accepted: 3 August 2021 / Published: 6 August 2021
(This article belongs to the Section Aeronautics)

Abstract

:
Natural flight has consistently been the wellspring of many creative minds, yet recreating the propulsive systems of natural flyers is quite hard and challenging. Regarding propulsive systems design, biomimetics offers a wide variety of solutions that can be applied at low Reynolds numbers, achieving high performance and maneuverability systems. The main goal of the current work is to computationally investigate the thrust-power intricacies while operating at different Reynolds numbers, reduced frequencies, nondimensional amplitudes, and mean angles of attack of the oscillatory motion of a NACA0012 airfoil. Simulations are performed utilizing a RANS (Reynolds Averaged Navier-Stokes) approach for a Reynolds number between 8.5 × 10 3 and 3.4 × 10 4 , reduced frequencies within 1 and 5, and Strouhal numbers from 0.1 to 0.4 . The influence of the mean angle-of-attack is also studied in the range of 0 to 10 . The outcomes show ideal operational conditions for the diverse Reynolds numbers, and results regarding thrust-power correlations and the influence of the mean angle-of-attack on the aerodynamic coefficients and the propulsive efficiency are widely explored.

1. Introduction

As a propulsive system, the flapping airfoil has revealed new ways to explore the natural flight and the peculiarities of highly unsteady flow, which is contrary to conventional aviation where steady or quasi-steady effects are used to generate lift [1]. However, traditional propulsive systems have their performance deteriorated at small length scales, which makes flapping airfoils an attractive propulsive system at this regime, yet, there is still a lack of understanding regarding the parameters that govern the aerodynamics of living beings. Nonetheless, the unsteady airfoils study is also helpful concerning aeroelastic analysis [2,3] and dynamic stall, which negatively affects helicopter rotors [4]. Lately, the study of oscillating airfoils lost focus on their propulsive capabilities but is rather exploring their potential to extract energy from the flow field [5].
However, the main reason to study the flapping airfoil problem emerges from biomimetics. Animals such as birds [6], insects [7], small fishes, and even the big blue whale are equipped with a spectacular propulsion system, and what makes these systems so interestingly efficient is that they offer an advantage over conventional propulsion systems. Observations of several species made by Taylor et al. [8] allowed the authors to conclude that natural flight occurs within a limited range of Strouhal numbers between 0.2 and 0.4 . Other studies carried out so far show that optimum propulsive efficiencies are achieved within the same range of Strouhal, with numerical studies corroborating these results. It is noteworthy that pitching or flapping show a wider range of Strouhal numbers where rather good propulsive efficiency is found, whereas when considering only plunging, satisfactory efficiencies are exclusively achieved in a narrower range of S t .
The ability to adapt the flight instantly and keep the maximization of the aerodynamic performance a priority shakes the premise that flying can only be optimized for the cruise condition which is quite restricting. To counteract this tendency, micro and nano aerial vehicles with indispensable civil and military applications like surveillance, espionage, atmospheric weather monitoring, and catastrophe relief purposes [9] are being developed. These systems offer undeniable maneuverability and efficiency at lower scales for which conventional propulsion systems become inefficient since, at this scale, high viscosity effects are present, which makes flapping-wing systems way more efficient and more easily maneuverable when compared to fixed wings [10].
The dynamics of flapping airfoils were first explained by Knoller [11] and Betz [12] but there was a clear inaccuracy: the theory was only based on the airfoil kinematics. Later, Kármán and Burgers [13] are the ones who successfully explain the mechanism of drag and thrust production by observing the vortical structures and their orientation in the airfoil’s wake. Numerically, Garrick [14] studied plunging airfoils using Theodorsen’s theory [15] and concluded that thrust production was related to ( k h ) 2 , which was not so straightforward when considering pitching airfoils. Although this theory did not include viscosity effects, it offers interesting correlations and may be used for large Reynolds numbers and small angles of attack [16].
Wake structures of plunging airfoils have been studied by Lewin and Haj-Hariri [17], Lai and Platzer [18], and Young [19], especially the regime that represents the transition between drag and thrust production. Young and Lai [20] explains that this phenomenon is due to the interaction between bluff-body type natural shedding and the airfoil’s motion.
Thrust and propulsive efficiency have been estimated using a Navier-Stokes code by Tuncer and Platzer [21] for a flow passing a NACA0012 undergoing pure plunging motion. At R e = 3 × 10 6 , the maximum propulsive efficiency reached values close to 0.75 but with considerably low thrust coefficient values. The same effect was previously observed by Camacho et al. [5,22] for a Reynolds number of 3.4 × 10 4 .
Concerning airfoil geometry, Jones and Platzer [23] used 2D incompressible unsteady panel method (UPM), varied the airfoil’s thickness, and observed that it would not have a preponderant effect on propulsive efficiency or thrust production for k = 0.01–1 and h = 0.1–0.4.
Using a 2D compressible Navier-Stokes solver, Tuncer et al. [24] studied the plunging motion at R e = 10 6 and concluded that the maximum achievable thrust depends on the k h product which is related to dynamic stall occurrence. At this Reynolds number, the authors suggest that operating in the low frequency and large amplitude range would favor the propulsive performance. Nevertheless, at a Reynolds number of 2 × 10 4 Platzer et al. [16] states that operating at high frequency and low amplitude would favor the propulsive efficiency. In fact, the flapping airfoil problem is highly affected by the governing parameters as seen in [5,22] where the maximum efficiency zone is a clear function of the Reynolds number.
Further investigations conducted by Young and Lai [25,26] demonstrated the impact that many parameters have in this type of problem. Regarding the Strouhal number, Tuncer et al. [24] observed that maximum thrust and optimum efficiency take place at the near dynamic stall boundary. This differs from lower Reynolds numbers, where flow separation is required to guarantee an efficient thrust generation, which makes them conclude that it is more beneficial to operate at a high k and low h than at a low k and high h, as stated in [16].
Concerning the mean angle-of-attack influence on flapping airfoils at a Reynolds number of 2.0 × 10 4 , Chiereghin et al. [27] studied mean angles of attack up to 20 , with the main purpose of simulating the effects of gusts and maneuvers. Authors conducted experiments and used reduced-order models to study mean lift and moment, concluding that a leading-edge vortex can increase the mean lift and decrease the mean moment. Additionally, the maximum effective angle-of-attack has shown to be adequate to study the influence of the leading-edge vortex on the mean lift. Comparing the experiments with the results of the reduced-order models, they observed that when there is a leading-edge vortex present, the Theodorsen theory is not suitable to predict the pitching moment.
Predicting the presence and modeling the influence of a leading-edge vortex is very much needed to understand the impact on the aerodynamic and propulsive coefficients, which are greatly affected at higher frequencies and low Reynolds numbers. An adequate approximation might be correlating leading-edge vortex formation with the maximum effective angle-of-attack as stated in [28].
In the present work, the plunging airfoil is studied, especially the thrust and power demand relationship when operating a plunging NACA0012 airfoil at different wind speeds, motion frequency and amplitude, and mean angles of attack. It is a priority to understand the generation of lift and thrust forces and what combinations in the operating domain are energetically adequate.
The plunging mechanism is evaluated using the mean thrust and power coefficients defined as
C t ¯ = 1 Δ t t t + Δ t C d d t
and
C P ¯ = 1 Δ t t t + Δ t C l y ˙ U d t
respectively. The propulsive efficiency is then defined by the ratio between the mean thrust and mean power coefficients, as expressed in Equation (3).
η = C t ¯ C P ¯
Additionally, the mean lift coefficient which will be used for the mean angle-of-attack analysis is defined as
C l ¯ = 1 Δ t t t + Δ t C l d t
where C l is the lift coefficient.

2. Methodology

In the present work, a Reynolds Averaged Navier-Stokes (RANS) formulation, with k ω Shear-Stress Transport as the selected turbulence model, is used to study the aerodynamic and propulsive performance of a plunging NACA0012 airfoil. Such turbulence model has the merit of offering a superior ability to predict the flowfield under adverse pressure gradients and separating flow [29], having the possibility to be used as a low- R e model. Moreover, the model has been offering satisfactory results with high fidelity boundary-layer resolution over the years in flapping airfoils [30]. The same turbulence model coupled with a transition model also has shown its potential at low to moderate Reynolds numbers analysis [31].
The present methodology was previously described in detail in [5] and only the main points will be mentioned here. Mesh and timestep independence studies were conducted for a R e = 1.7 × 10 4 , k = 2.5 , and h = 0.5 and during the simulation, due to the turbulence model requirements, the y + was maintained under 5.
The flow field is obtained by solving continuity and momentum averaged equations simultaneously, written in a Cartesian tensor form as
ρ t + ( ρ u i ) x i = 0
and
( ρ u i ) t + ( ρ u i u j ) x j = p x i + x j μ u i x j + u j x i 2 3 δ i j u l x l + ( ρ u i u j ¯ ) x j
respectively [29]. The k ω Shear-Stress Transport turbulence model was chosen as it has already demonstrated its ability to predict the force generation of flapping airfoils, as seen in other works [32].
Simulations are carried out using ANSYS Fluent with a two-zone mesh, illustrated in Figure 1. The inner zone is a structured mesh that moves together with the airfoil as a rigid body, being both controlled by a UDF (User Defined Function). The outer zone is set as a deformable zone, which is deformed according to the spring-based method and remeshed whenever the mesh quality is inadequate. Such mesh design decreases computational demand since a lower number of cells are subjected to mesh update calculations such as deformation and remeshing.
The NACA0012 airfoil is subjected to an oscillatory motion described by the equation
y ( t ) = A cos ( 2 π f t )
and its velocity is given by
y ˙ ( t ) = 2 π f A sin ( 2 π f t )
where A and f are the motion’s amplitude and frequency, respectively.
As in [22], the airfoil is placed at the origin of the vertical axis. Starting the movement at such position would force the airfoil to start at its maximum velocity which increases the time to find the correct mean solution. To counteract such effect, the airfoil’s motion was subdivided into three segments as shown below.
y ˙ ( t ) = A / 0.5 T if   t 0.5 T 0 if   0.5 T < t < T 2 π f A sin ( 2 π f t ) if   t T
The angle-of-attack was change based on
α ˙ ( t ) = α 0 / 0.5 T if   t 0.5 T 0 if   t > 0.5 T
where T = 1 / f and α 0 is the mean angle of attack.
Concerning boundaries conditions, they consist of an inlet, an outlet, upper and lower walls, and the airfoil, which are represented in Figure 2. The velocity U is prescribed at the inlet and turbulence-related information is given. On the outlet, the outflow boundary condition is used. The upper and lower walls are treated as slip walls to remove any viscous effects while the airfoil is handled as a wall where the no-slip condition is forced.
The numerical solution is obtained by evaluating the gradients using the Least Squares Cells-Based scheme and interpolating pressure with PRESTO! (PREssure STaggering Option). The QUICK scheme was adopted as the method to discretize momentum, turbulent kinetic energy, and specific dissipation rate equations. The transient formulation uses the first-order implicit method and the pressure-velocity coupling algorithm is PISO (Pressure-Implicit with Splitting of Operators) which performs better in transient flow calculations.
The processing and analysis of data were made recurring to scripts developed in C, which calculated the mean aerodynamic and propulsive coefficients and propulsive efficiency. The implemented method to calculate the mean thrust, lift, and power coefficients is the trapezoidal rule.
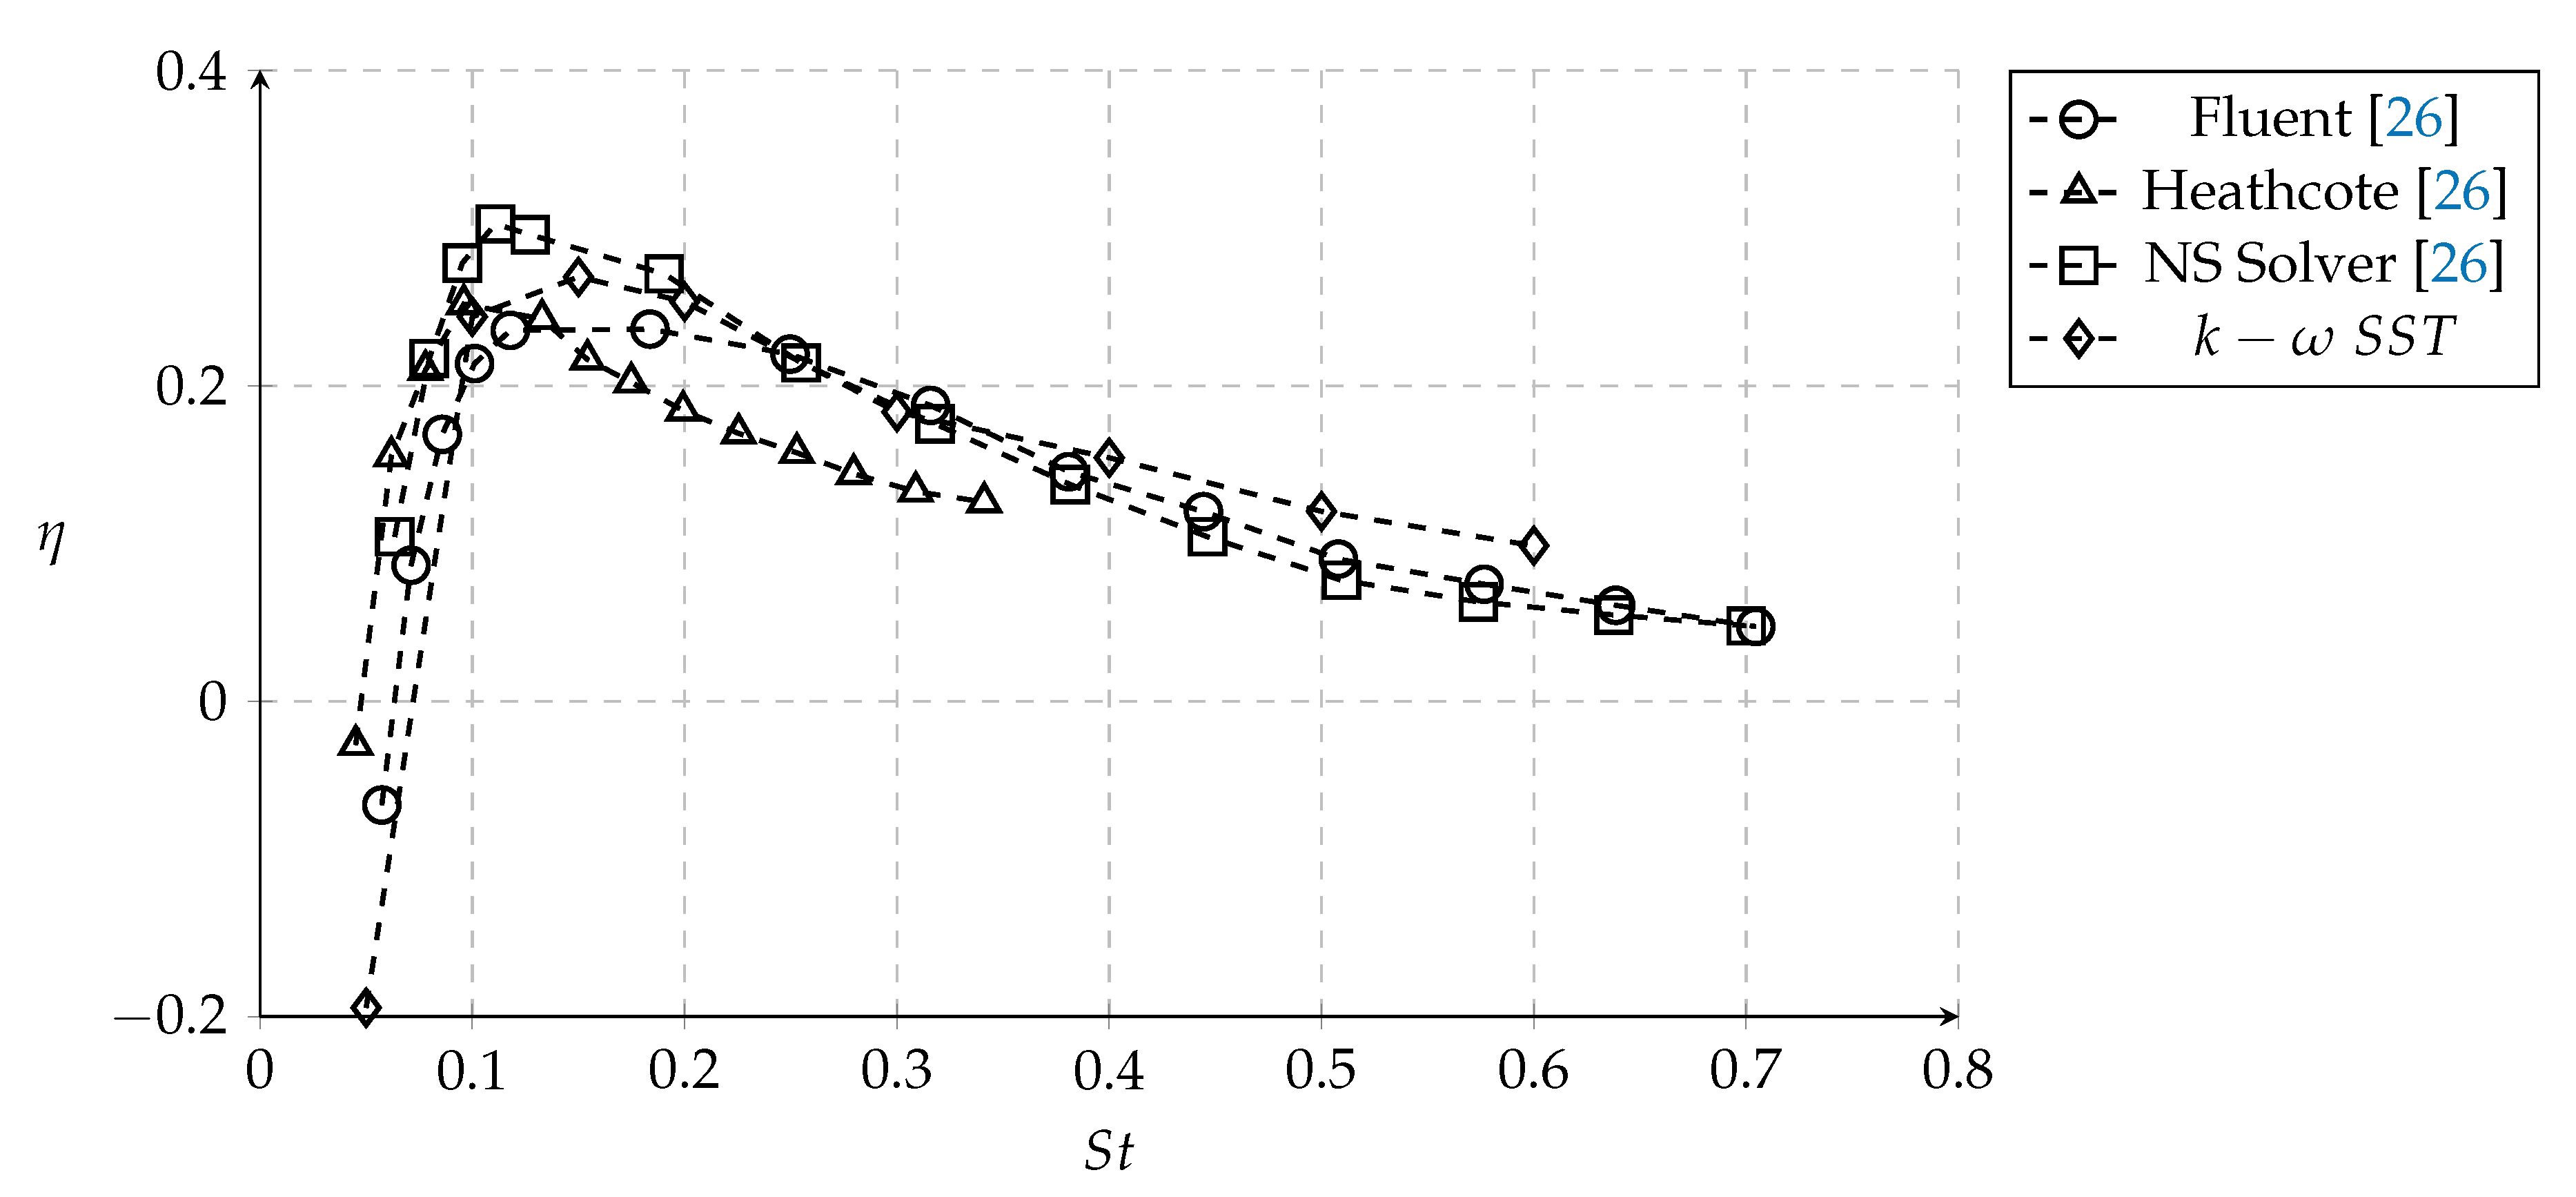
The validation of the numerical methodology was achieved by comparing the results obtained with those published by Heathcote et al. [33], NS and Fluent simulations for a h of 0.175 and reduced frequencies in the range k = 0.0 to 6.3 at R e = 2 × 10 4 , presented in [26]. Figure 3 shows the mean thrust and power coefficients obtained in the present work, using the k ω SST turbulence model. The propulsive efficiency is also compared, shown in Figure 4.
The graphs of Figure 3 and Figure 4 reveal that the mean propulsive coefficients and propulsive efficiency obtained with the k ω SST turbulence model follow published data over a wide range of Strouhal numbers. Small discrepancies arise from the use of the turbulence model, which slightly underestimates and overestimates η at lower and higher Strouhal numbers, respectively.

3. Results and Discussion

This section presents the results concerning the influence of different Reynolds numbers, motion amplitude and frequency, the Strouhal number, and mean angle-of-attack on the plunging airfoil mechanism, in particular the plunging motion. A deeper analysis regarding the influence of the mean angle-of-attack on mean thrust, lift, and power coefficients, as well as propulsive efficiency, presented for a Reynolds number of 1.7 × 10 4 .

3.1. Power and Thrust Correlations

In this subsection, the relationship between mean thrust and power requirements is explored. For this analysis, the previously obtained data in [5] was used, which consisted of analyzing the aerodynamic and propulsive characteristics of a NACA0012 plunging airfoil at three different Reynolds numbers ( 8.5 × 10 3 , 1.7 × 10 4 , 3.4 × 10 4 ) , reduced frequencies between 1 and 5, and a nondimensional amplitude never exceeding 0.5.
Thus, these dimensionless numbers were considered to be the input variables that all had a clear influence on thrust production and required power. Nonetheless, it should not be unconventional to consider the power coefficient as an input since this propulsive system, as all others, requires a given power to execute the motion which is then converted into kinetic energy.
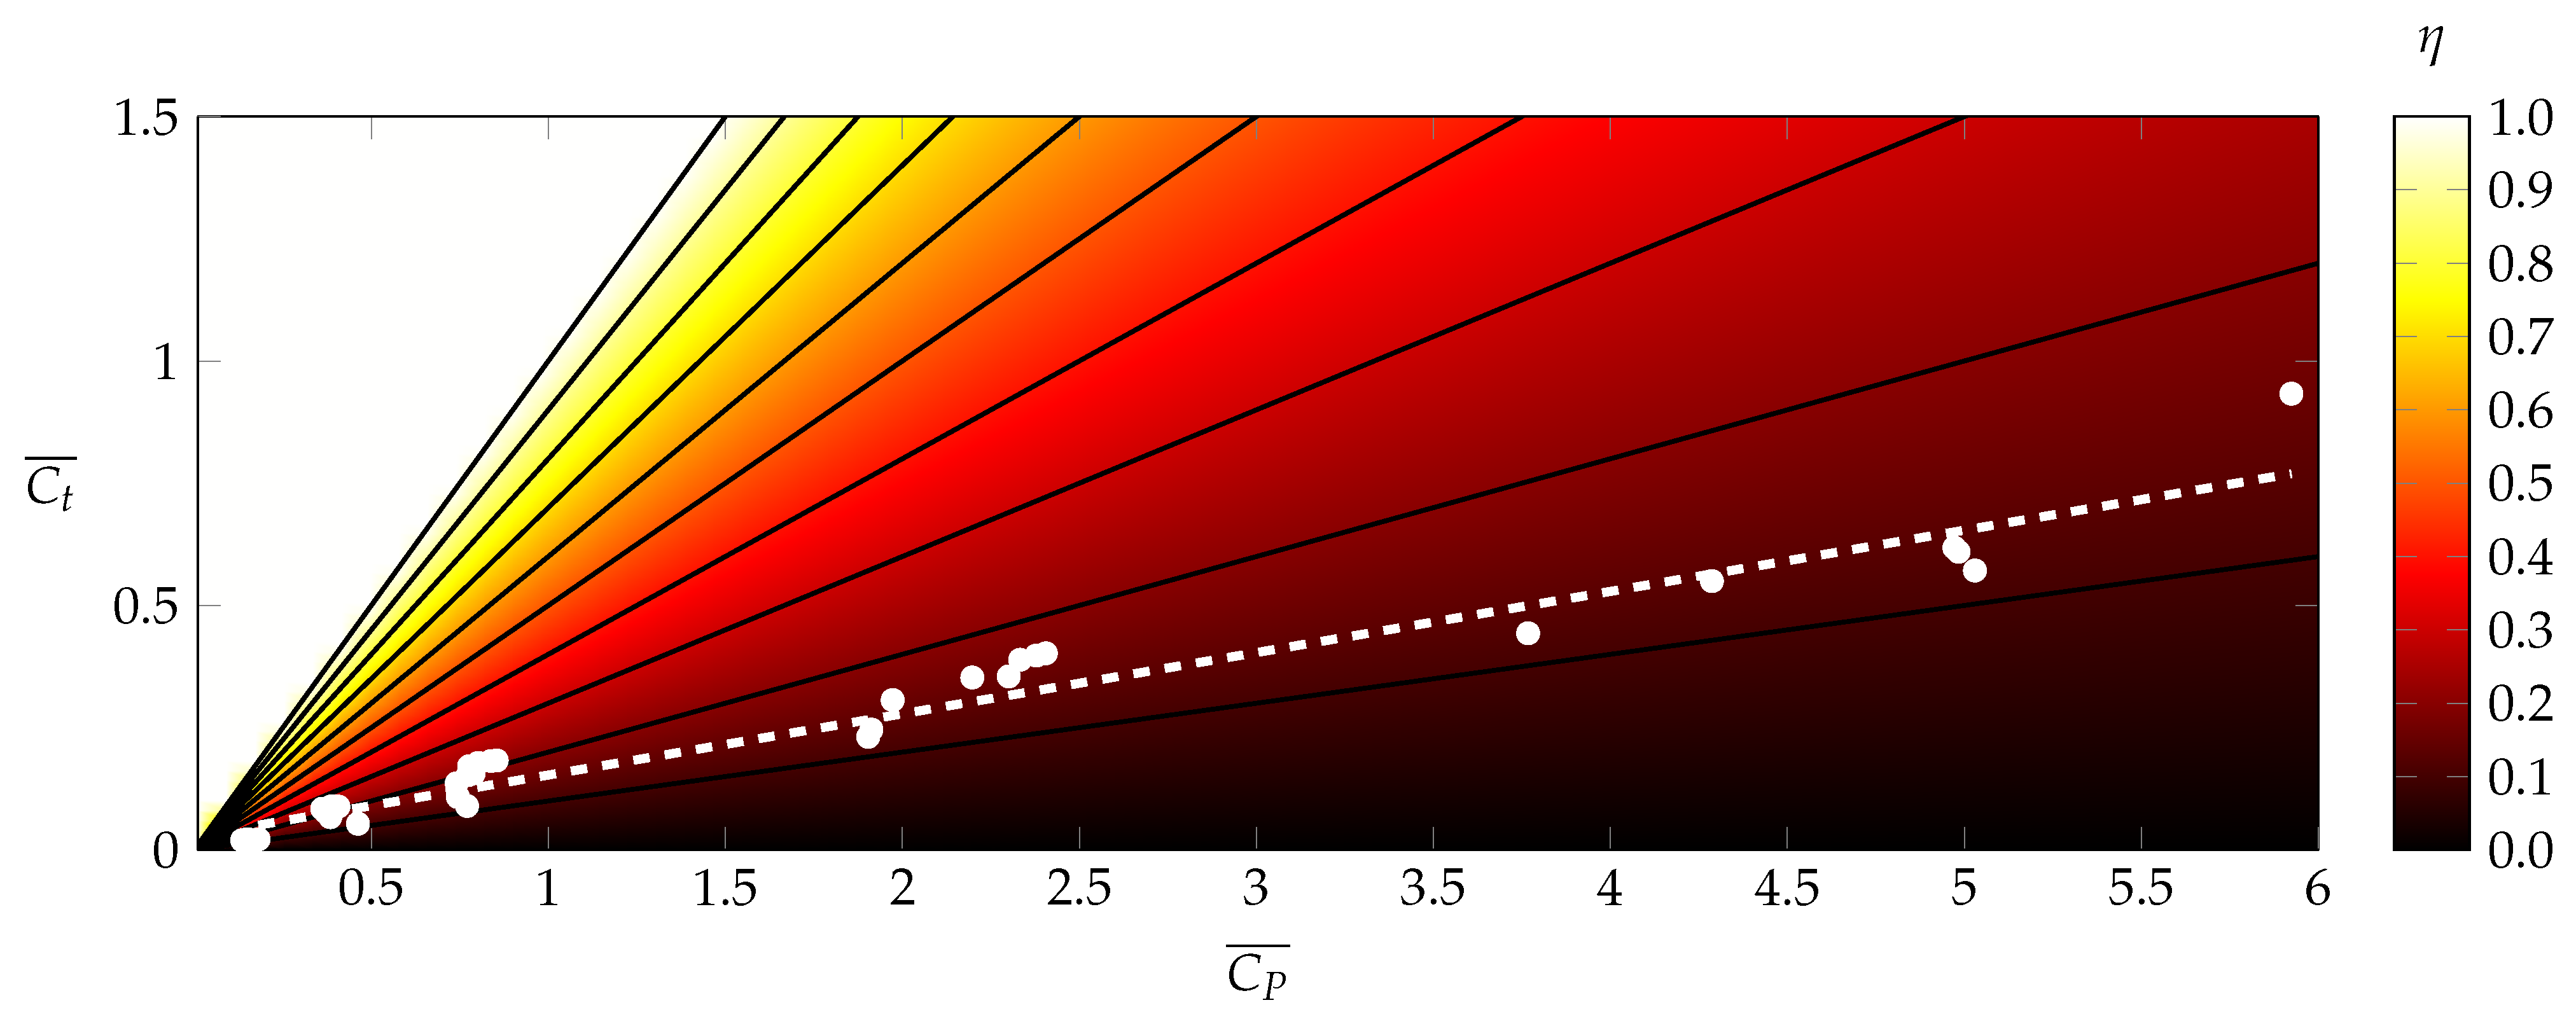
In Figure 5, Figure 6 and Figure 7, the mean thrust coefficient is shown as a function of the mean power coefficient for the three Reynolds numbers studied. The propulsive efficiency is also represented in the aforementioned figures as the contour plot. Using the several conditions simulated in [22], the graph of Figure 5 shows that overall, regardless of the reduced frequency and/or nondimensional amplitude, the mean thrust and power coefficients show a linear relationship which can be expressed as
C t = 0.125 C P + 0.028 ( R 2 = 0.95 )
At a Reynolds number of 1.7 × 10 4 (Figure 6), data still exhibits a linear dependency between thrust production and power required. Obtained data is well approximated by
C t = 0.144 C P + 0.042 ( R 2 = 0.96 )
At this Reynolds number, as in the previous one, it is seen that the plunging motion presents a propulsive efficiency somewhere between 0.1 and 0.3, although higher values can be obtained at lower mean power coefficients.
When increasing the Reynolds number to 3.4 × 10 4 , a slight increase in the performance is observed since the plunging airfoil can now reach almost 40 % regarding propulsive efficiency. Although fewer conditions were tested at this Reynolds number (Strouhal number was limited to 0.2), data still shows that the mean thrust coefficient depends linearly with the power, which at this R e is given by
C t = 0.285 C P + 0.003 ( R 2 = 0.97 )
Also interesting to note is the influence of the Reynolds number which when increased improves the overall propulsive performance ( η ). This reinforces the fact that when the flapping motion is limited to pure plunging, higher performance will be achieved at higher Reynolds numbers. Previously published research [5] shows that both thrust and power coefficients are functions of the Strouhal number (dominant parameter), so it is not illogical to assume that propulsive power becomes a function of the required power. Although these correlations offer a simplified approach regarding mean thrust and power inter-connectivity, they show very clearly the strong existing correlation between these two coefficients, judging by the quality of the approximation. This type of correlation, where the input variable is the power coefficient instead of the kinematics parameters (f or A) is very much needed concerning flapping airfoil development, especially on the earliest phases of design.

3.2. Influence of the Mean Angle of Attack α 0

The use of symmetrical airfoils has several advantages, such as the high propulsive efficiency they offer [34]. However, the symmetry of these airfoils causes the average lift force to be zero for a null mean angle-of-attack. Imposing a mean angle-of-attack will inevitably increase lift production and influence the airfoil’s overall performance, discussed in this subsection. The maximum effective angle-of-attack may also be used to analyze this problem since it combines the mean angle-of-attack and the ( k , h ) pair, being calculated as
α eff max = arctan k h + α 0
which is equal to
α eff max = arctan π S t + α 0
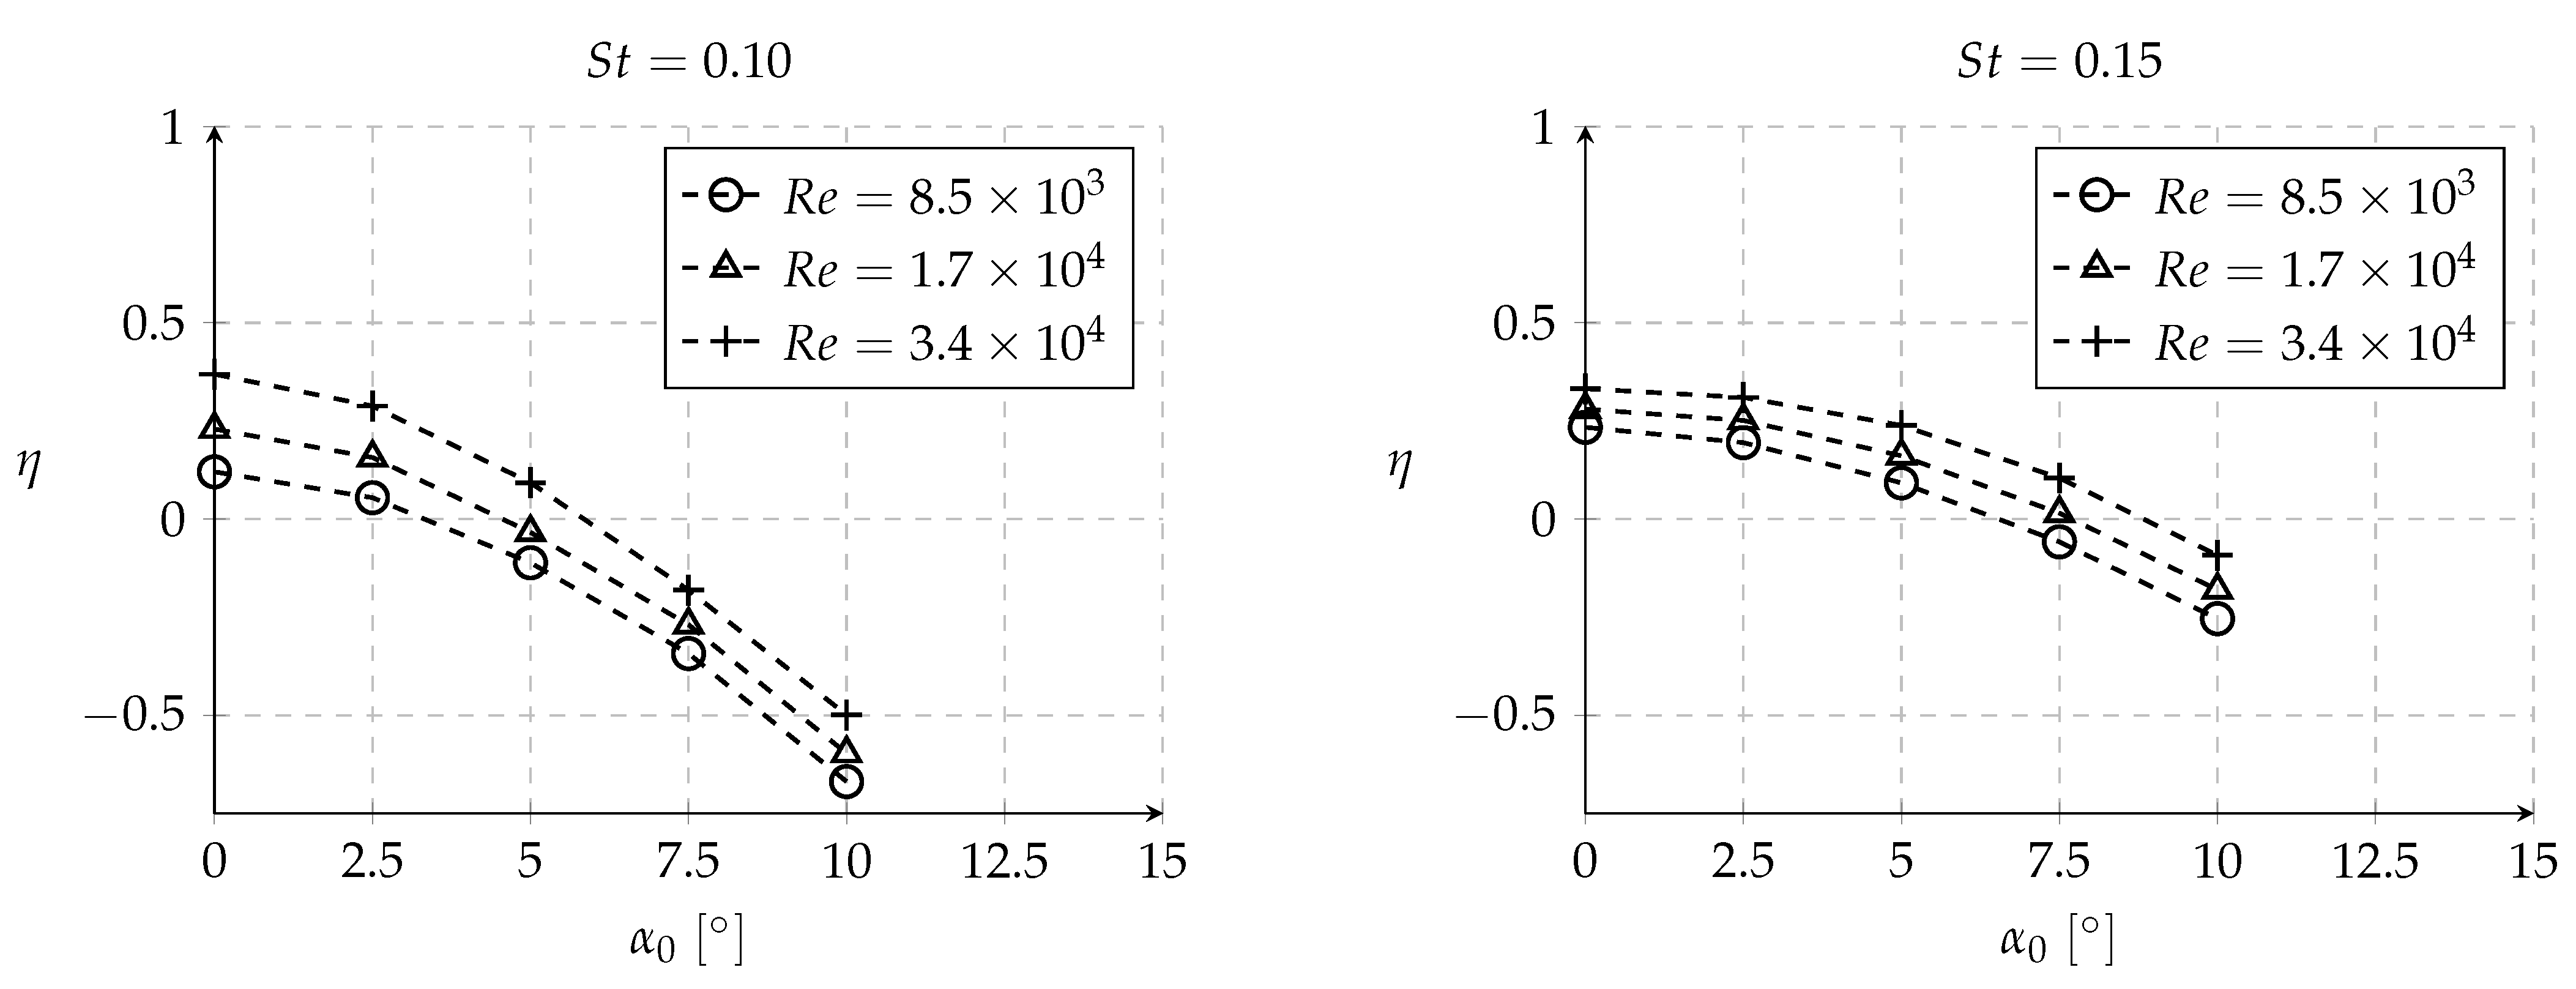
This subsection starts by analyzing the influence of the mean angle-of-attack on the propulsive efficiency of two specific conditions being these, the combination of k and h for the three Reynolds numbers considered in the power and thrust correlations subsection, that maximized the propulsive efficiency with α 0 = 0 . In Figure 8, the S t = 0.10 condition with k = 1 and h = 0.31 represents the maximum propulsive efficiency for a Reynolds number of 3.4 × 10 4 . The same condition was tested for R e = 1.7 × 10 4 and 8.5 × 10 3 . At S t = 0.15 ( k = 3.0 and h = 0.16 ) propulsive efficiency reaches its maximum at R e = 1.7 × 10 4 and 8.5 × 10 3 . Likewise, it is also tested for a Reynolds number of 3.4 × 10 4 . With this short parametric study, we can observe that increasing the Reynolds number, improves the propulsive efficiency but does not influence the way η decreases with the mean angle-of-attack. However, at the highest Strouhal number, propulsive efficiency is much less affected by the increase of α 0 .
This first phase of results offers a good understanding concerning the evolvement of propulsive efficiency with the Reynolds number. Yet, no clear judgment is made regarding mean thrust or power and how they depend on the reduced frequency, nondimensional amplitude, or their combination. Therefore, a parametric study was performed to evaluate the influence of these parameters for a constant Reynolds number of 1.7 × 10 4 in the vicinity of the ( k , h ) combination where maximum propulsive efficiency was detected for an α 0 = 0.0 (k and h ranging between 2–4 and 0.08–0.31, respectively).
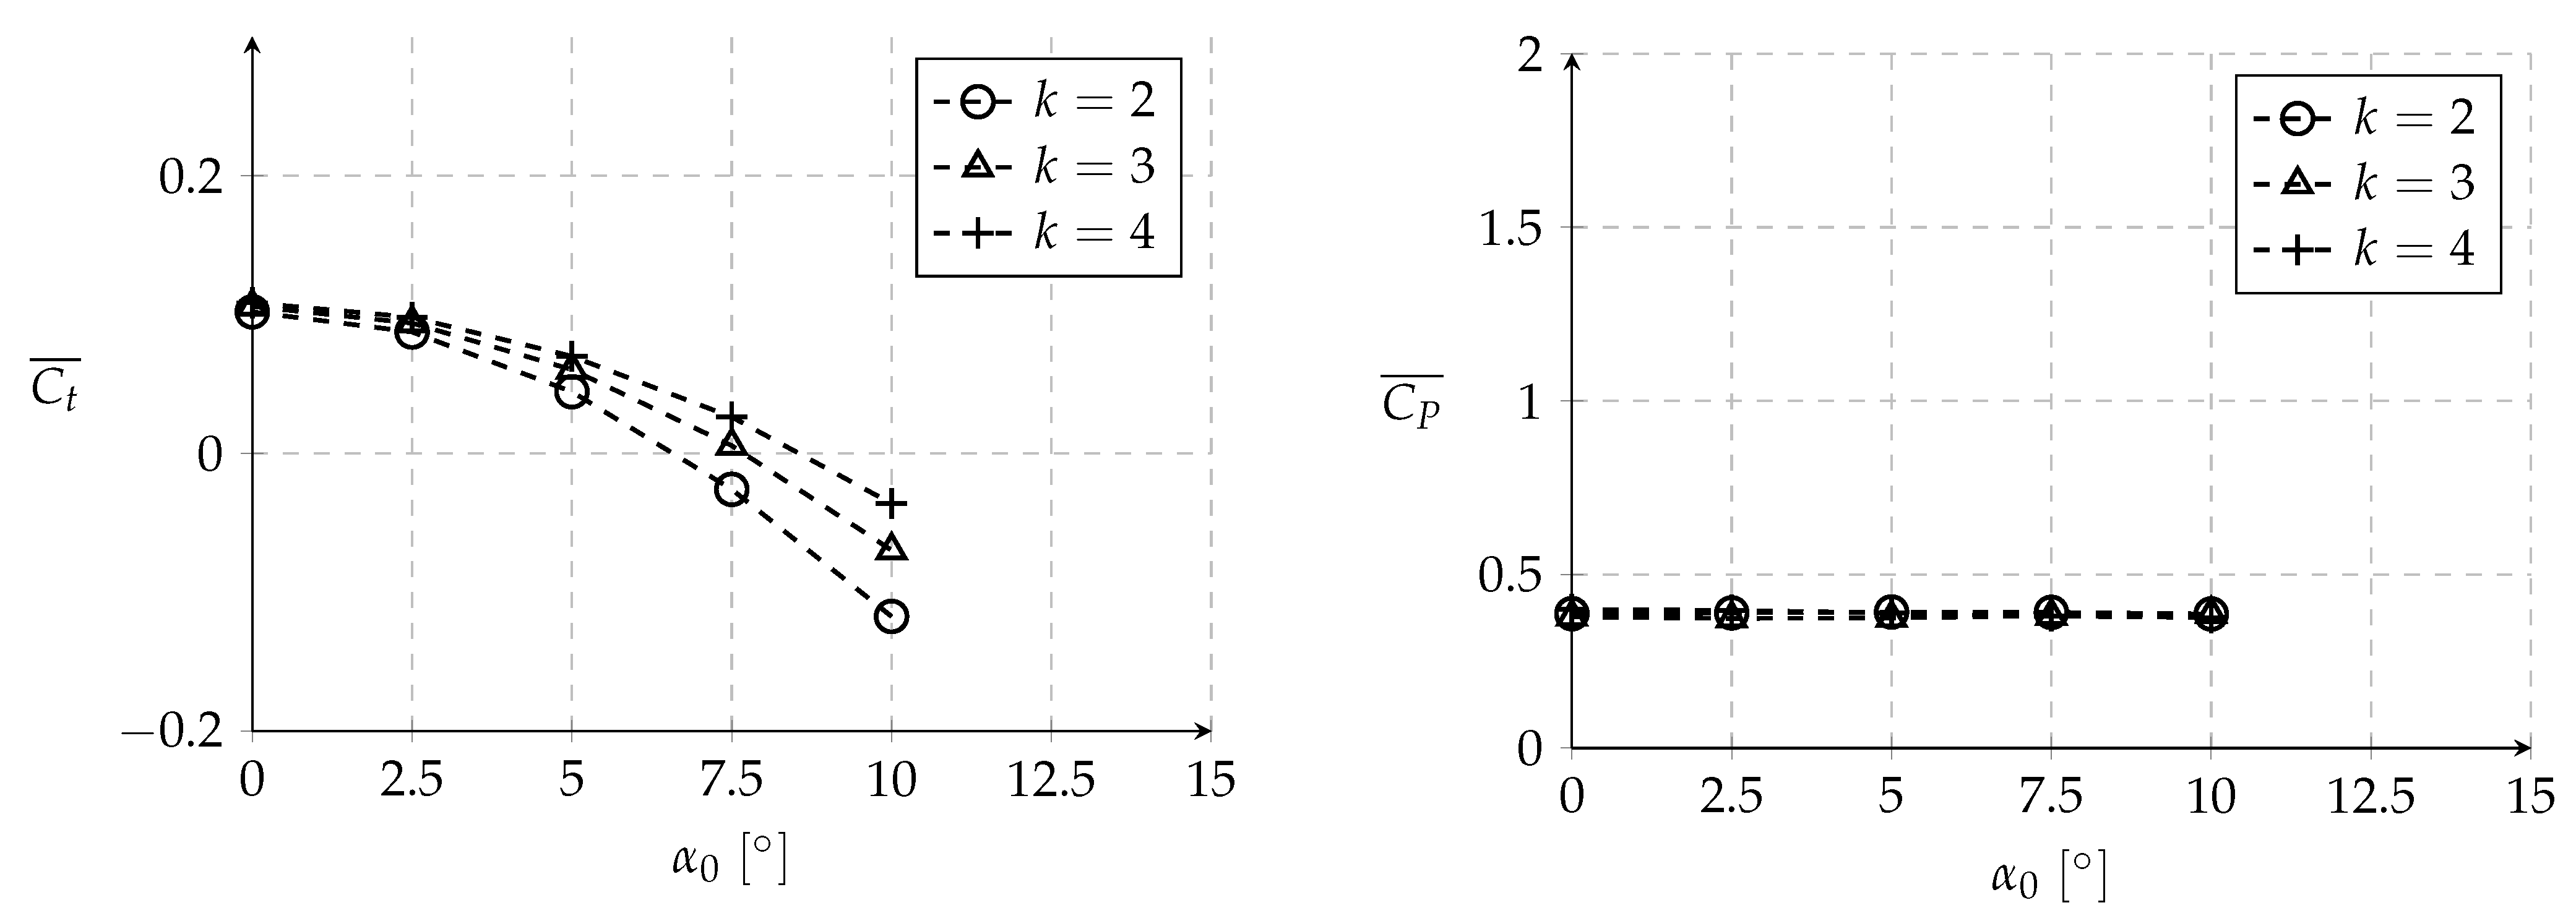
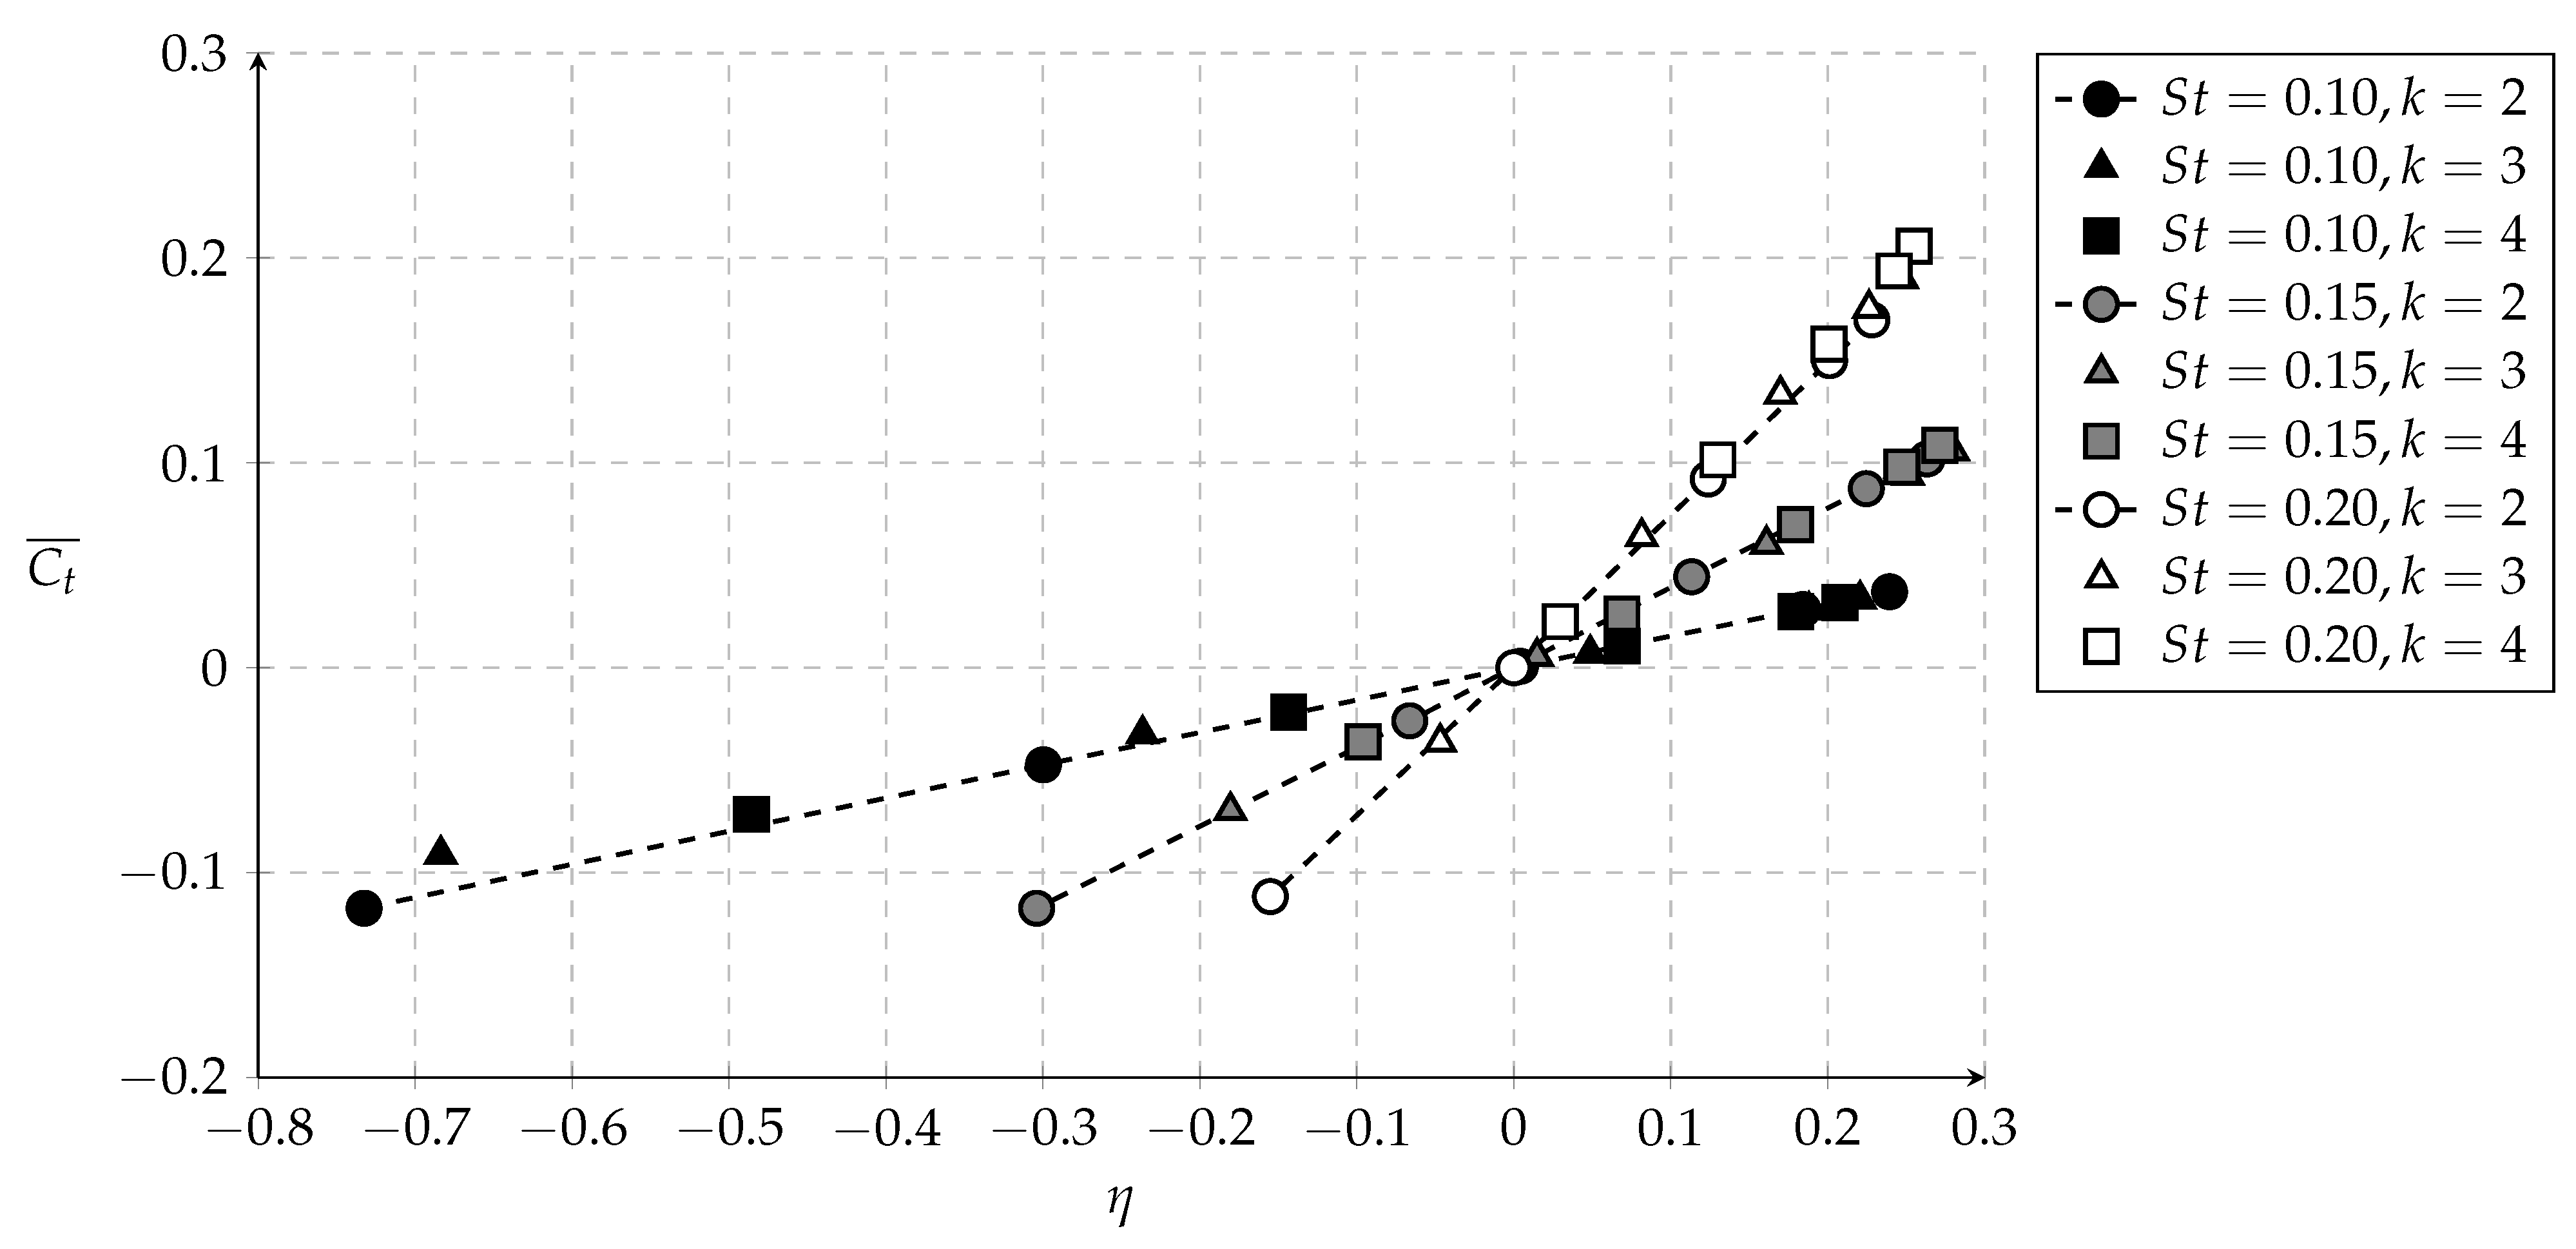
The results are shown in Figure 9, Figure 10 and Figure 11 where the evolution of C t ¯ and C P ¯ is presented for a Strouhal number of S t = 0.10 , S t = 0.15 and S t = 0.20 , respectively. For the tested conditions, it is always seen that the mean thrust coefficient always decreases as the mean angle-of-attack increases. However, when considering a constant Strouhal number, thrust production improves at higher reduced frequencies and, consequently, lower nondimensional amplitudes. Overall, the higher the Strouhal number is, the larger will thrust production be, regardless of the mean angle of attack.
Regarding the mean power coefficient, no clear conclusion is made with respect to the influence of k and h. However, it proved to be independent of the mean angle-of-attack, depending solely on the Strouhal number and consequently on the maximum effective angle-of-attack. In fact, at higher effective angles of attack (higher S t ), the plunging airfoil requires more power.
From these graphs, we conclude that when plunging at higher Strouhal numbers, higher power demand is verified as well as thrust production. However, when considering the influence of the mean angle-of-attack, thrust production is negatively affected with its increase mainly due to the fact that pressure drag increases.
When combining both mean thrust and power coefficients, the propulsive efficiency is obtained, represented in Figure 12 together with the mean thrust coefficient. As expected, due to the non-dependent evolution of C P ¯ with the mean angle-of-attack, the mean thrust coefficient and propulsive efficiency are coupled through a linear relationship which can be expressed as
C t ¯ = C P ¯ η
where the mean power coefficient C P ¯ is the slope of these linear functions.
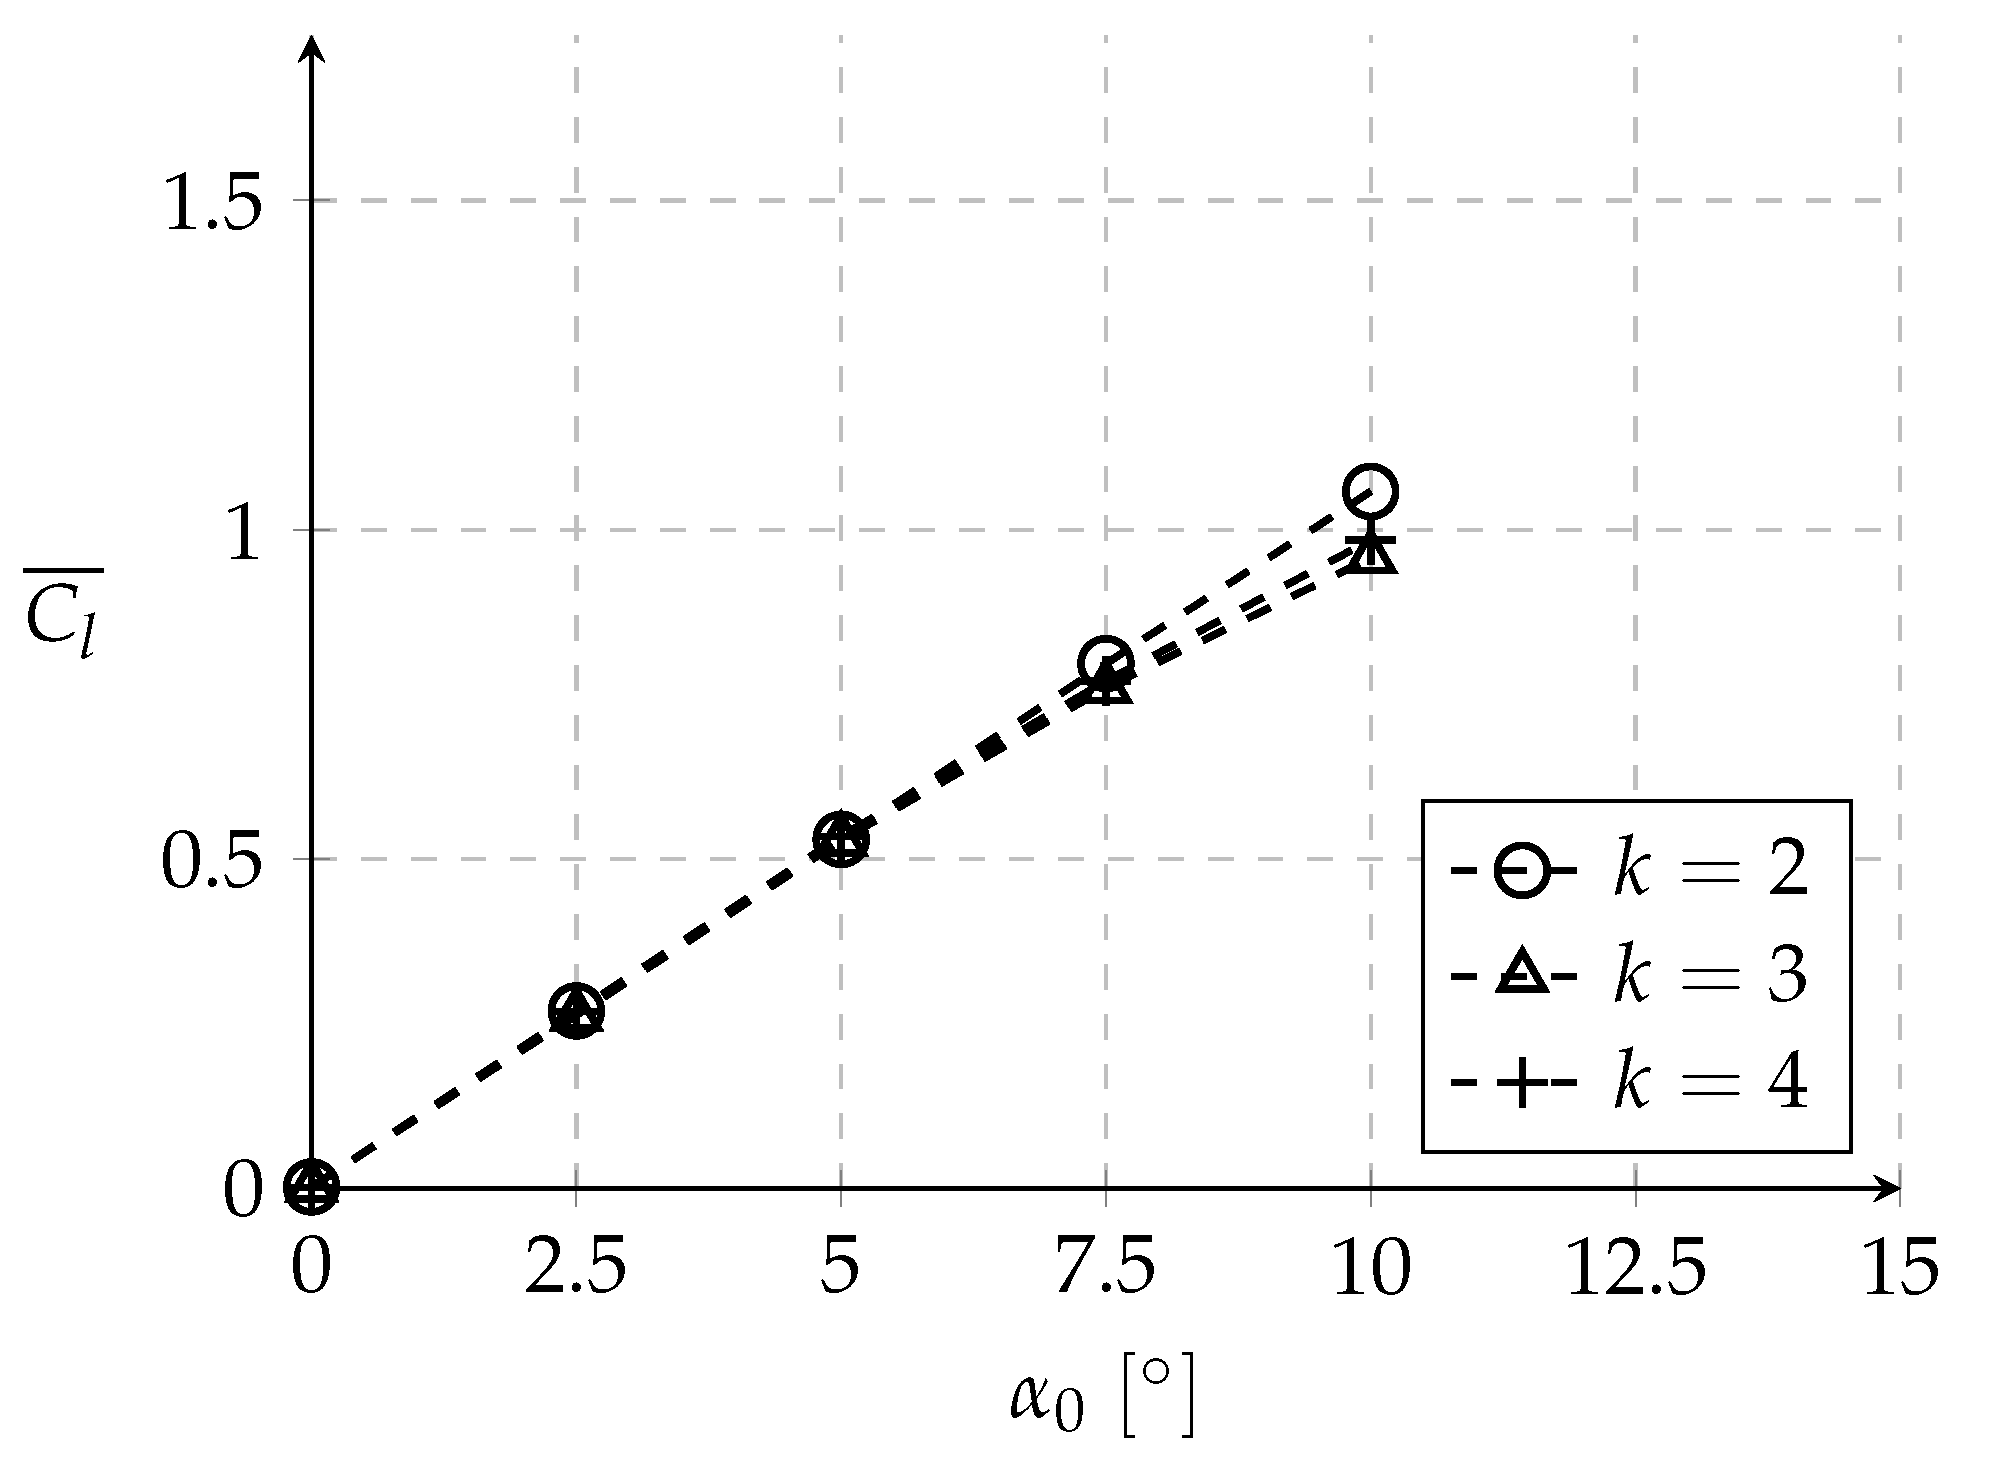
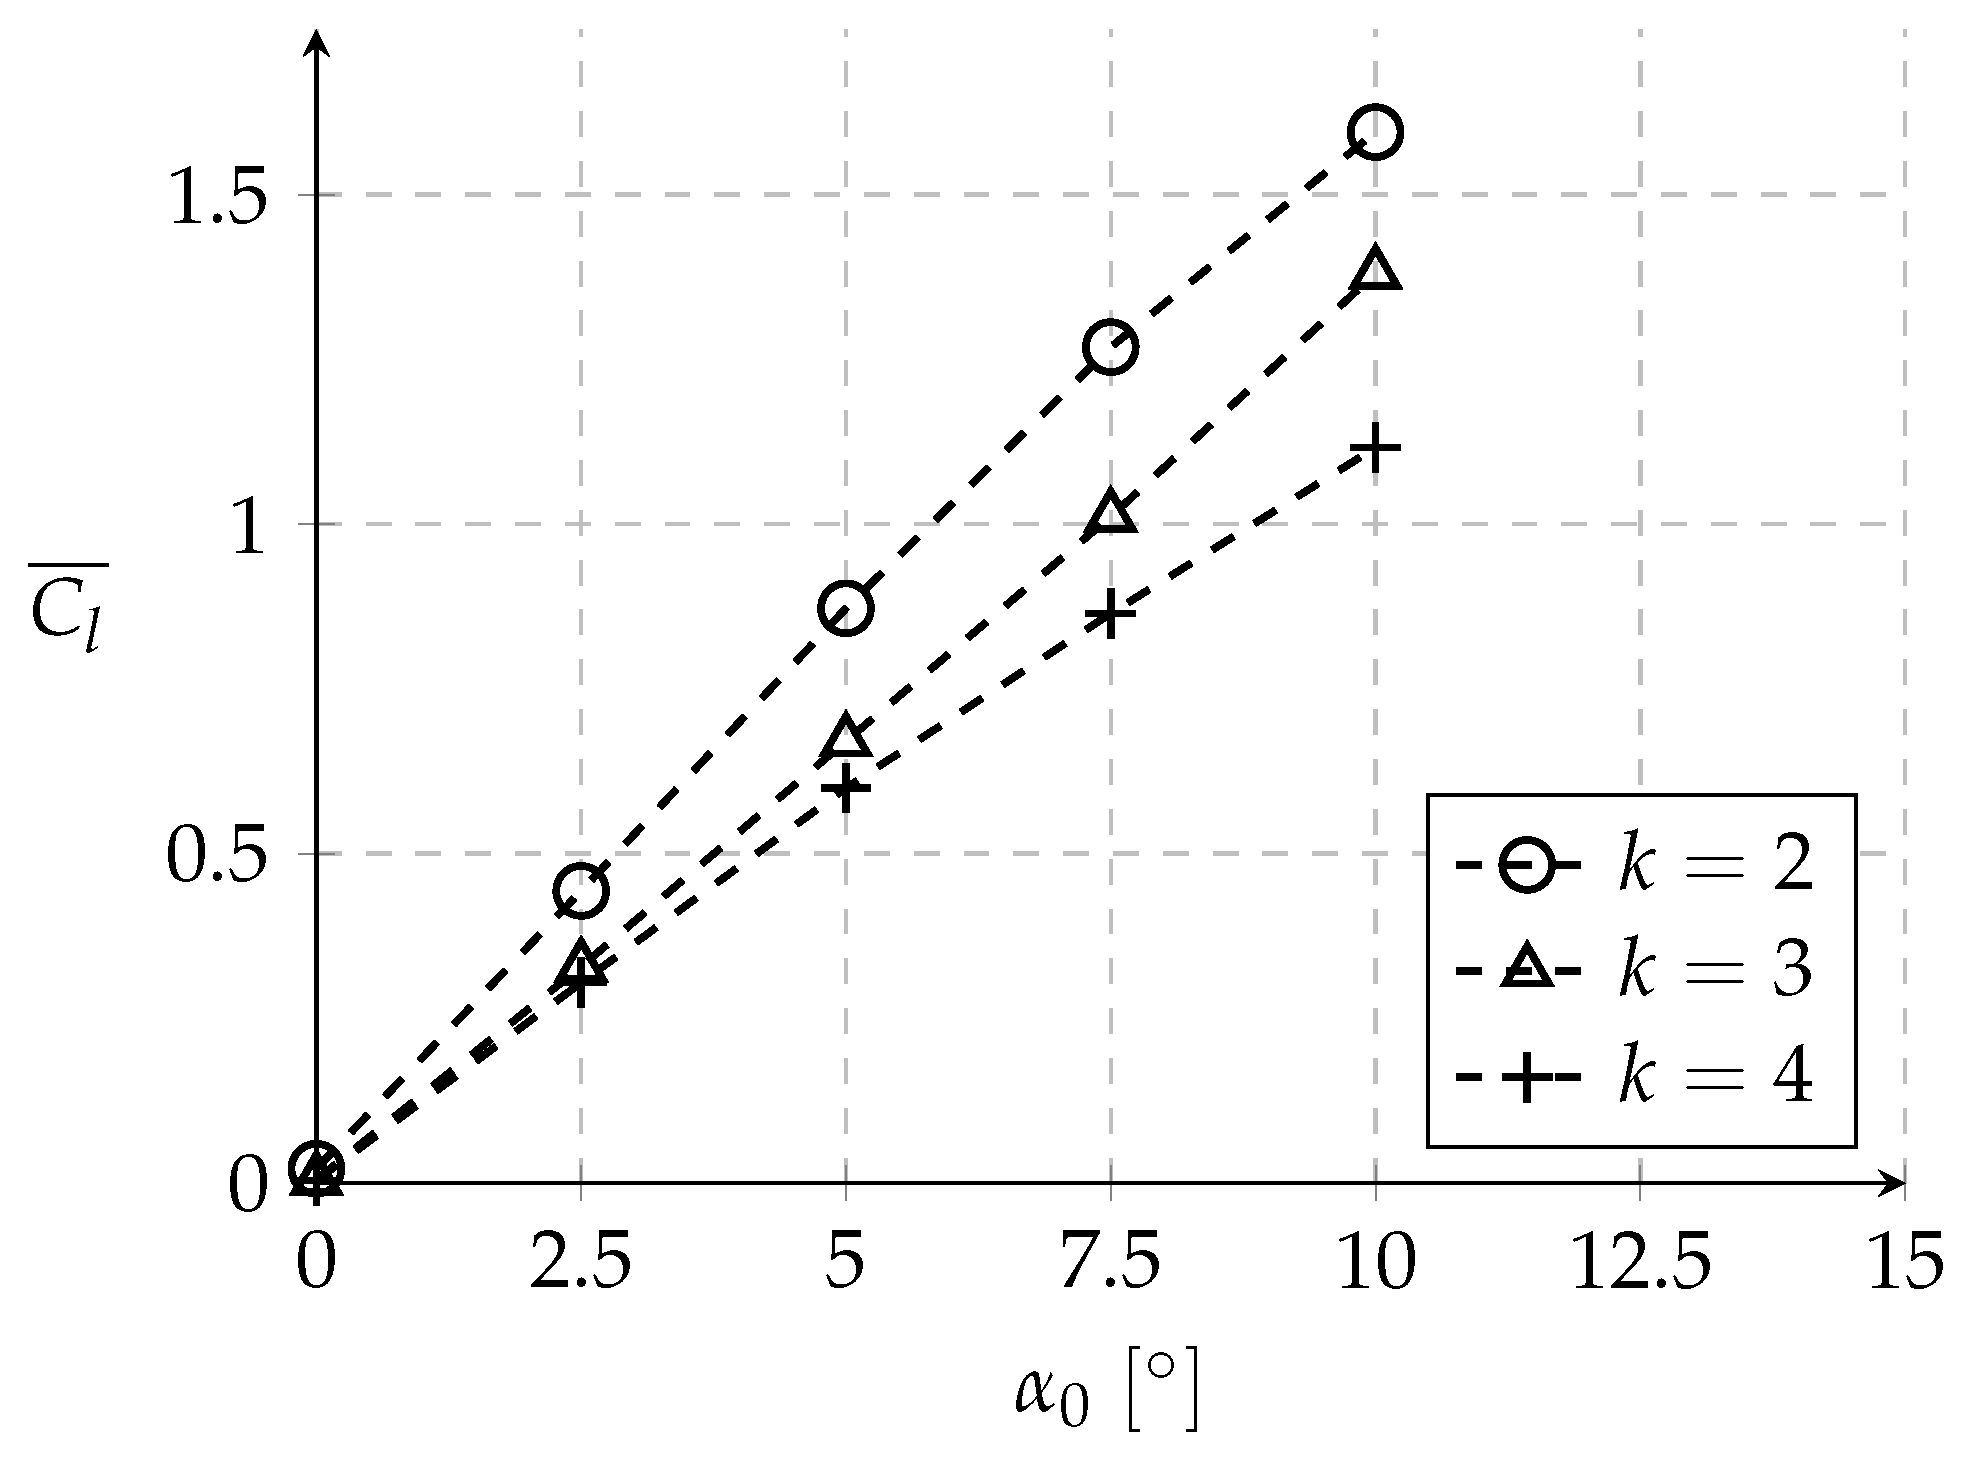
Looking forward to lift production and knowing beforehand that increasing the mean angle-of-attack increases the mean lift coefficient, one could also expect an increase in the power required to maintain the motion, however, such an event is not observed. Such effect raises the question if there is a balancing mechanism between the mean angle-of-attack and the instantaneous lift coefficient when the airfoil’s velocity is kept constant. Before answering that question, in Figure 13, Figure 14 and Figure 15, the mean lift coefficient is plotted against the mean angle of attack.
Analyzing the mean lift coefficient values from the aforementioned figures, it can observe that this coefficient increases both with the Strouhal number and mean angle-of-attack. Similar to the fixed airfoil case at different angles of attack, the mean lift coefficient and the mean angle-of-attack have a linear dependency. Regarding Strouhal number influence, it is observed that the larger it is, the higher C l ¯ can be. When considering a constant S t , higher mean lift coefficients are reached when the airfoil has a lower reduced frequency, although such effect is only visible for S t = 0.15 and S t = 0.20 .
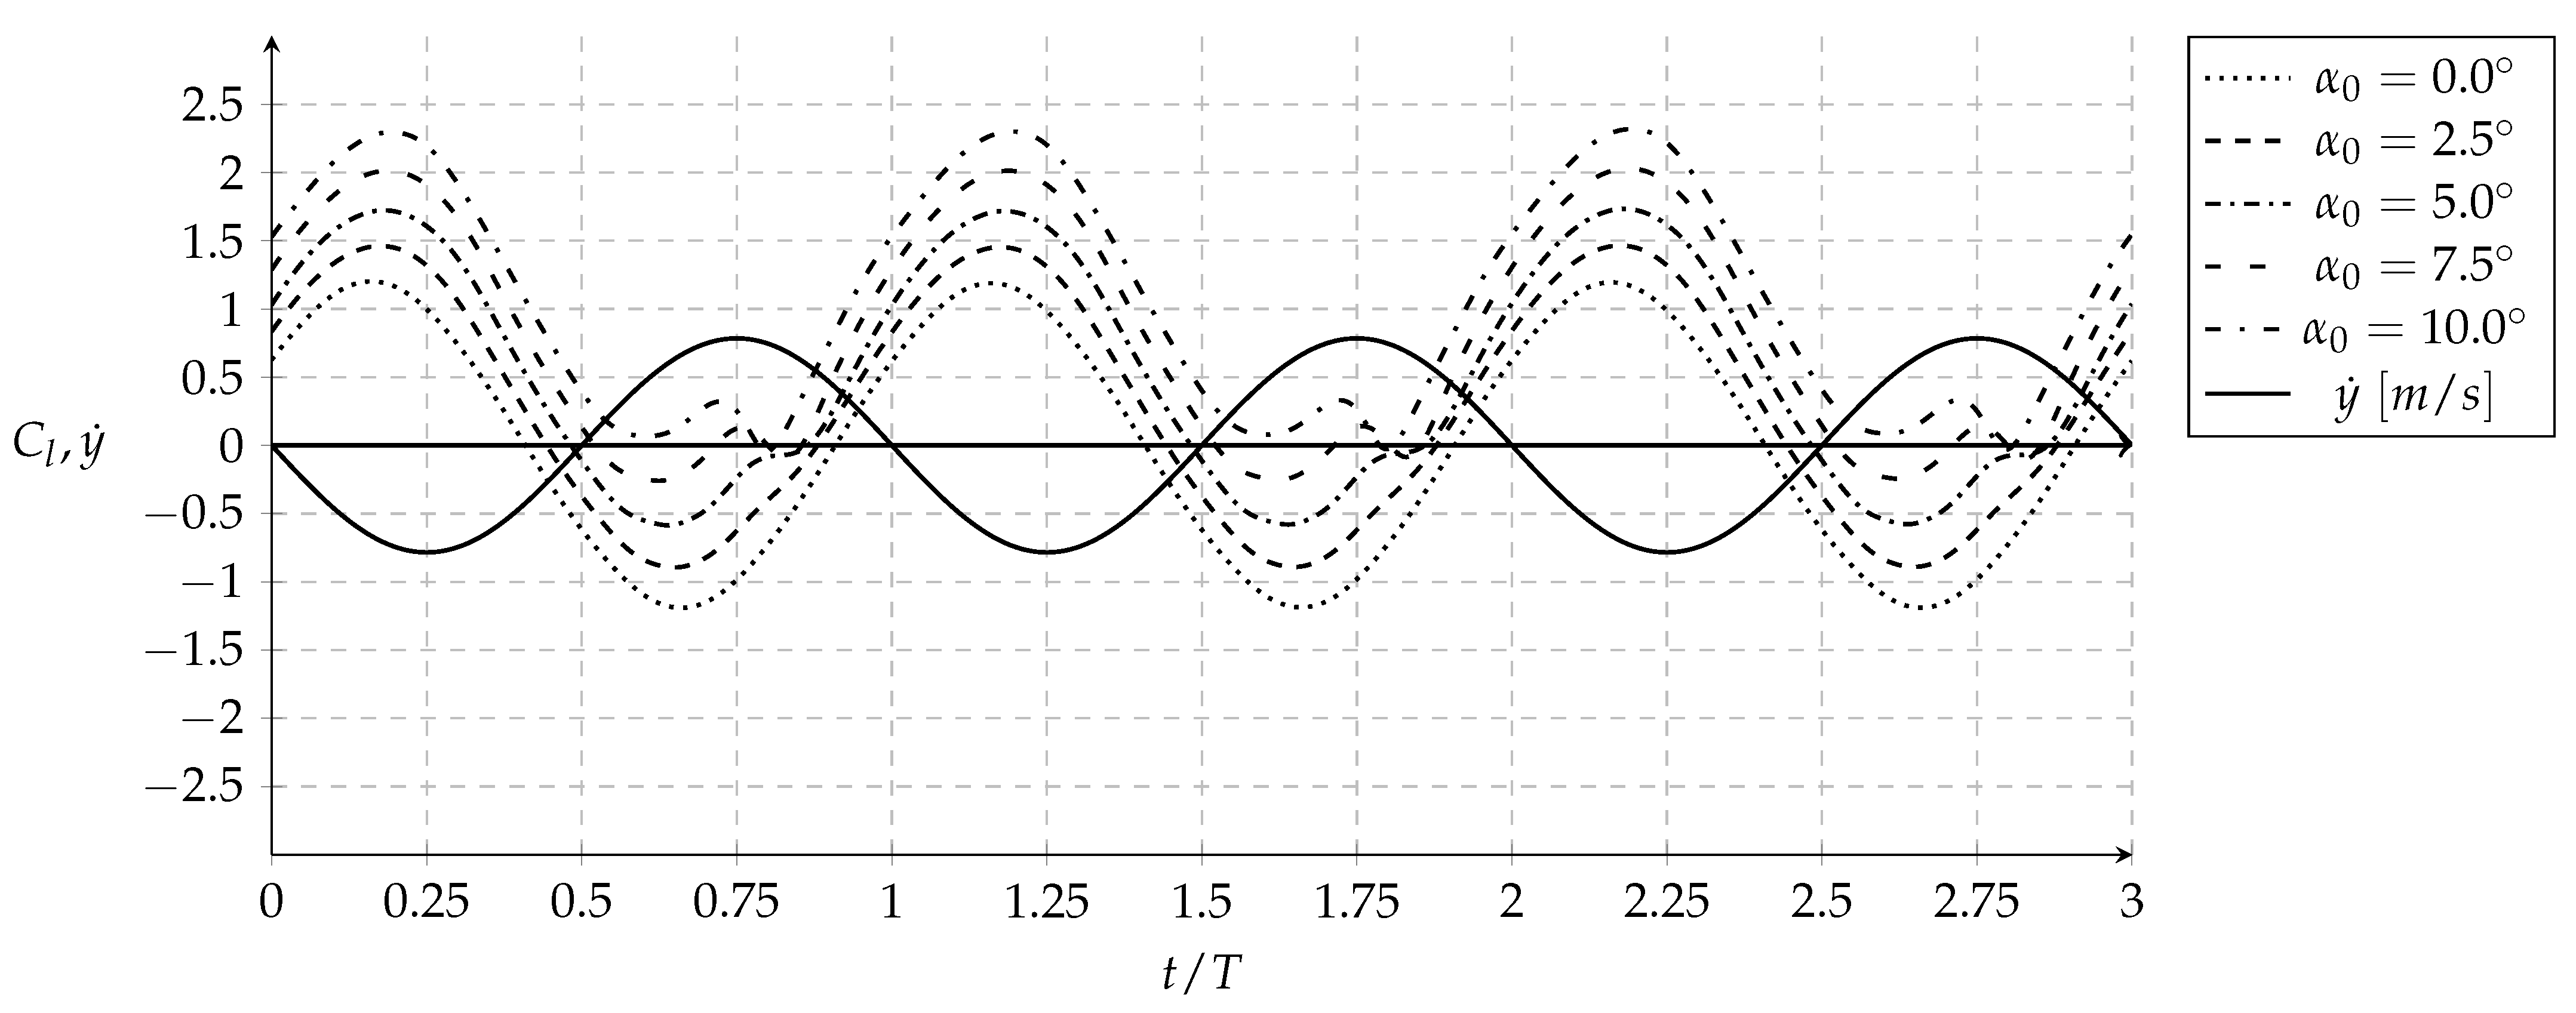
By increasing the mean angle-of-attack, lift production in its absolute value increases and decreases during the descending and ascending phases, respectively. This arose from the lower/higher effective angle-of-attack when the airfoil is going up/down and such effect itself, denounces the existence of a linear transformation (vertical translation of lift coefficient curves in Figure 16), which is also seen in fixed airfoils. Obviously one could argue that these are not perfect linear transformations since flow separation starts showing up during the descending phase, but the approximation is not unreasonable.
Returning to the question raised before, if whether there is a balancing mechanism between the instantaneous lift coefficient and the oscillating velocity, it is necessary to evaluate how the lift coefficient evolves in time to understand how the power coefficient is approximately independent of the mean angle of attack.
Therefore, in Figure 16, the lift coefficient is shown as a function of t / T , with k = 2.0 and h = 0.157 . The airfoil’s instantaneous velocity is also presented, kept constant while varying the mean angle of attack.
As expected, when increasing the mean angle-of-attack, higher are the instantaneous lift coefficients experienced by the airfoil as seen by the vertical translation of the α 0 = 0 graph. However, it is not only affected by a translation as also by a clear deformation in the second half of the period that starts to be noticed for a mean angle-of-attack of 5 and becomes clearly evident at 7.5 and 10.0 degrees.
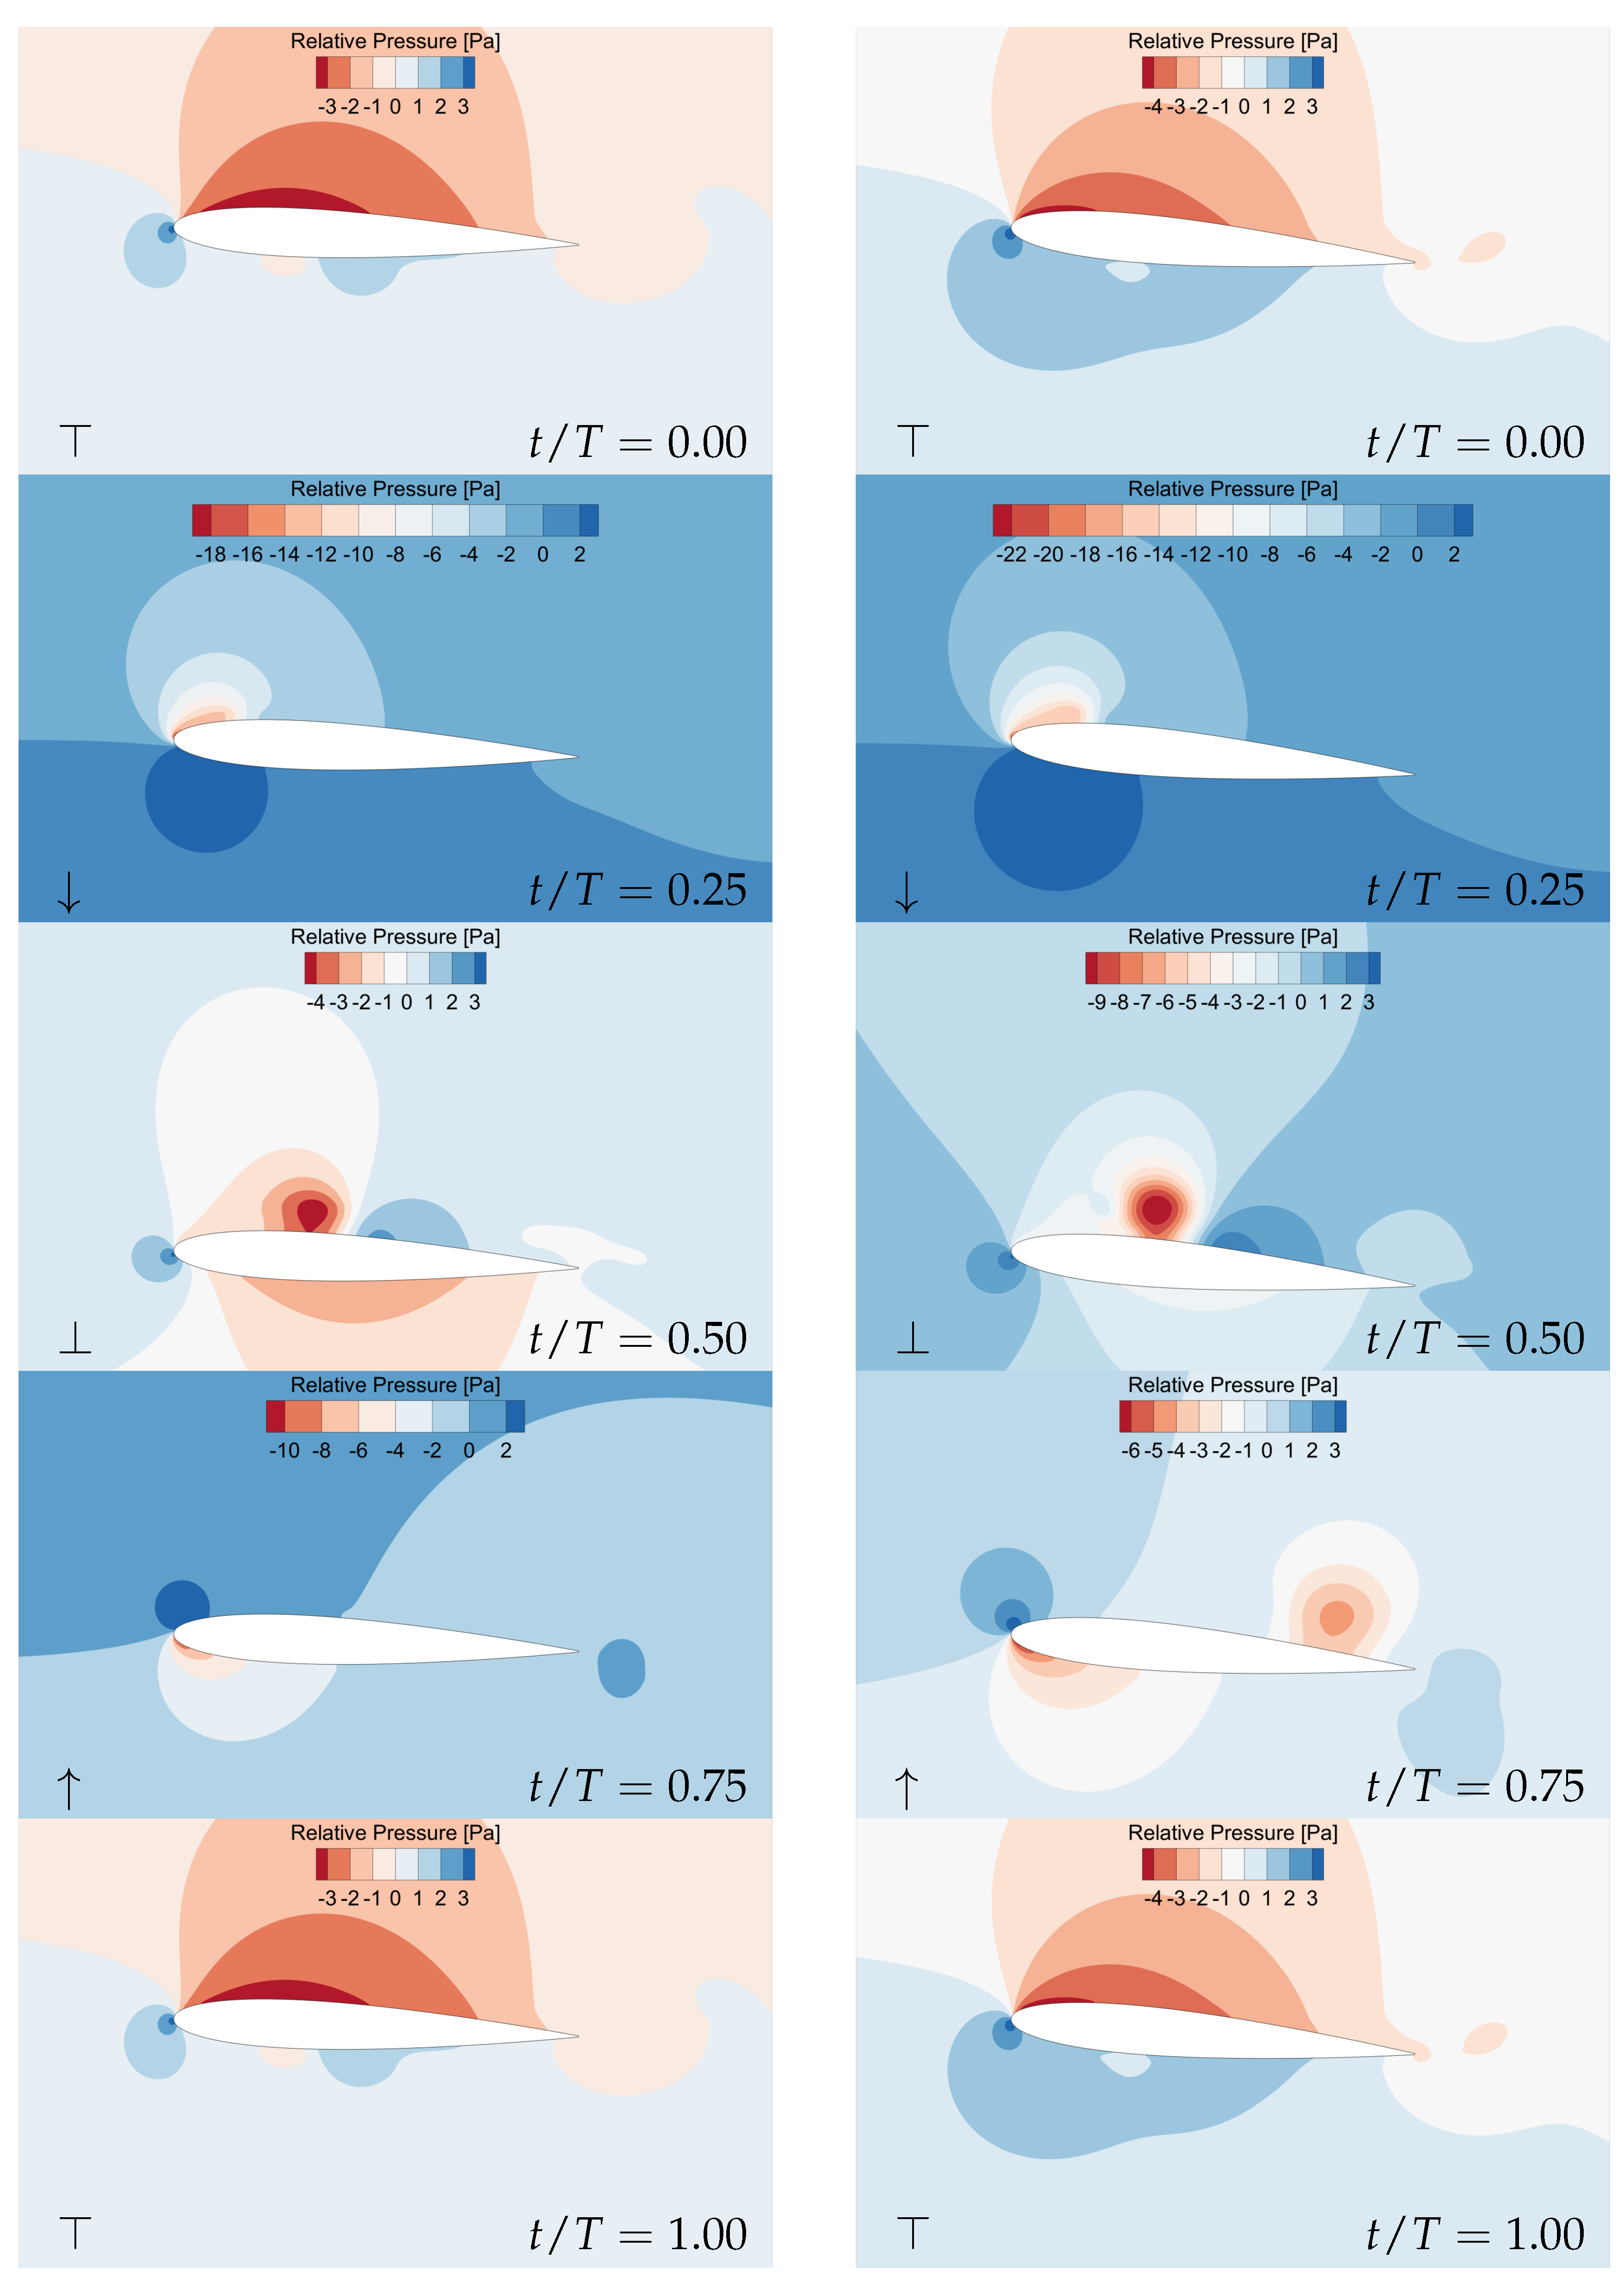
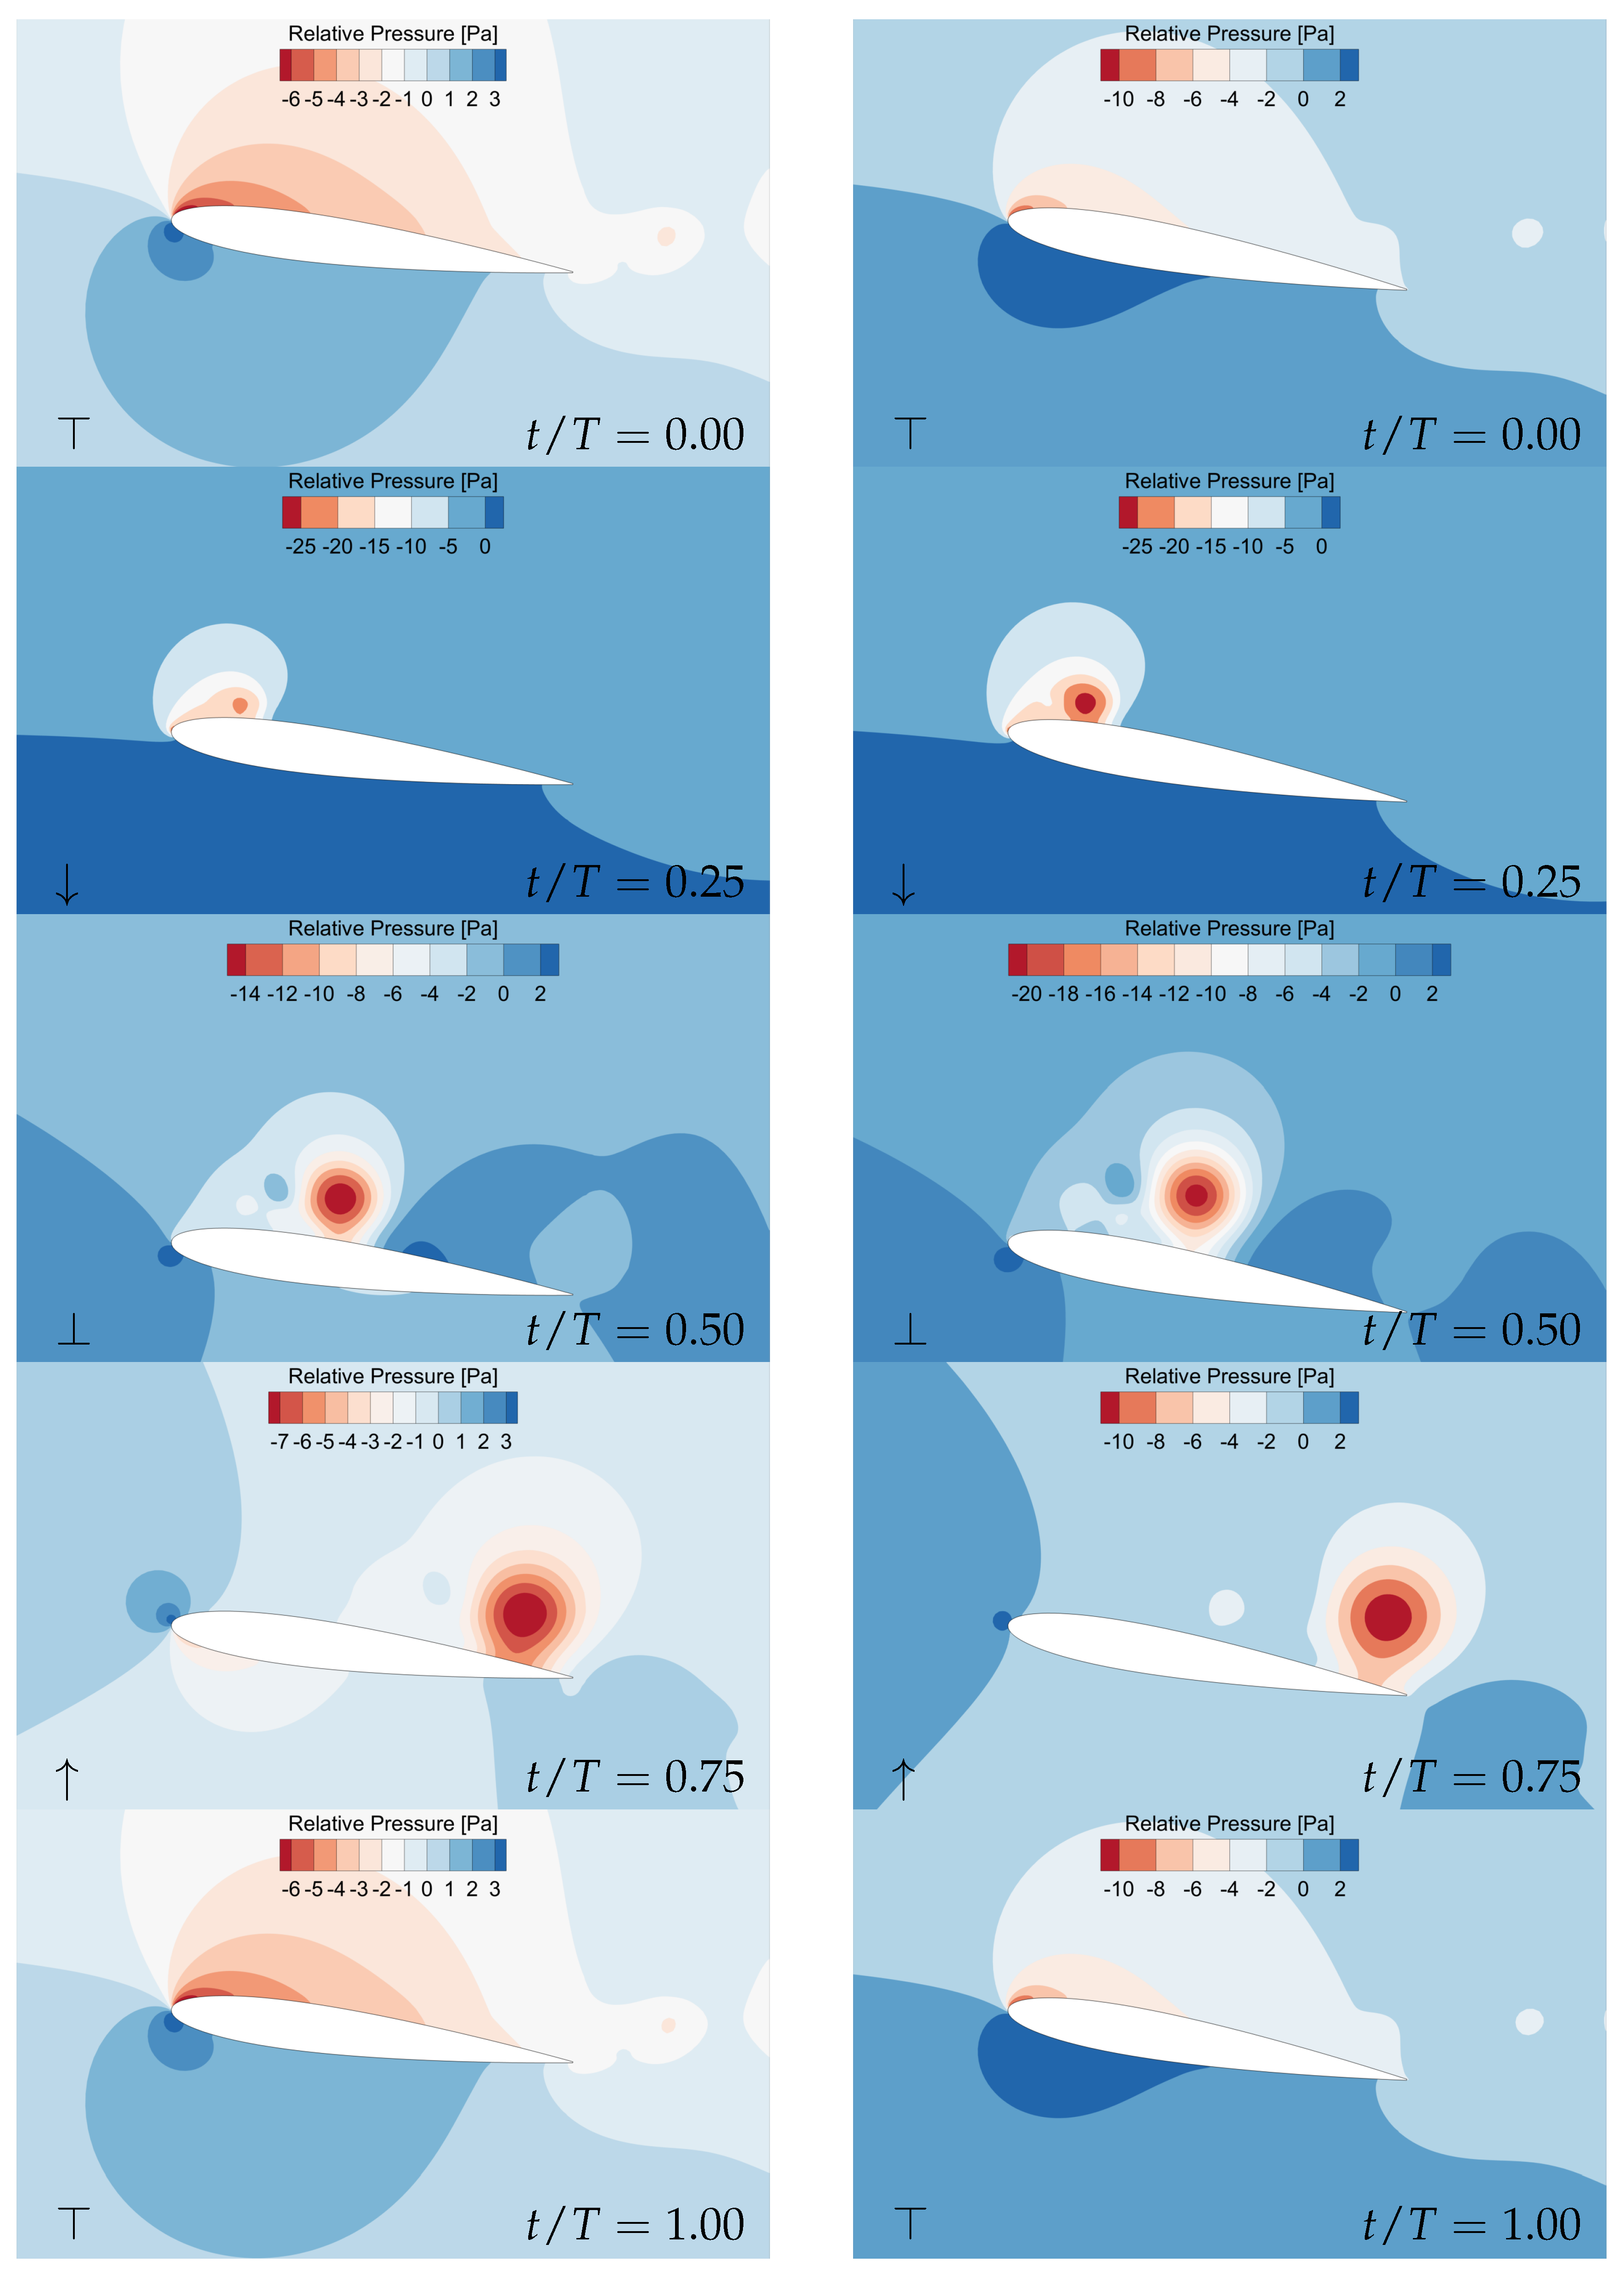
This slight decrease of the lift coefficient is due to the fact that a low-pressure zone created during descent that greatly enhances lift, is convected on the upper side of the airfoil, and then leaves at the trailing edge, moment when lift is reduced. This phenomenon, clearly visible for α 0 > 2.5 , is represented in Figure 17 and Figure 18 where the pressure distribution (relative to the free-stream pressure) is shown.
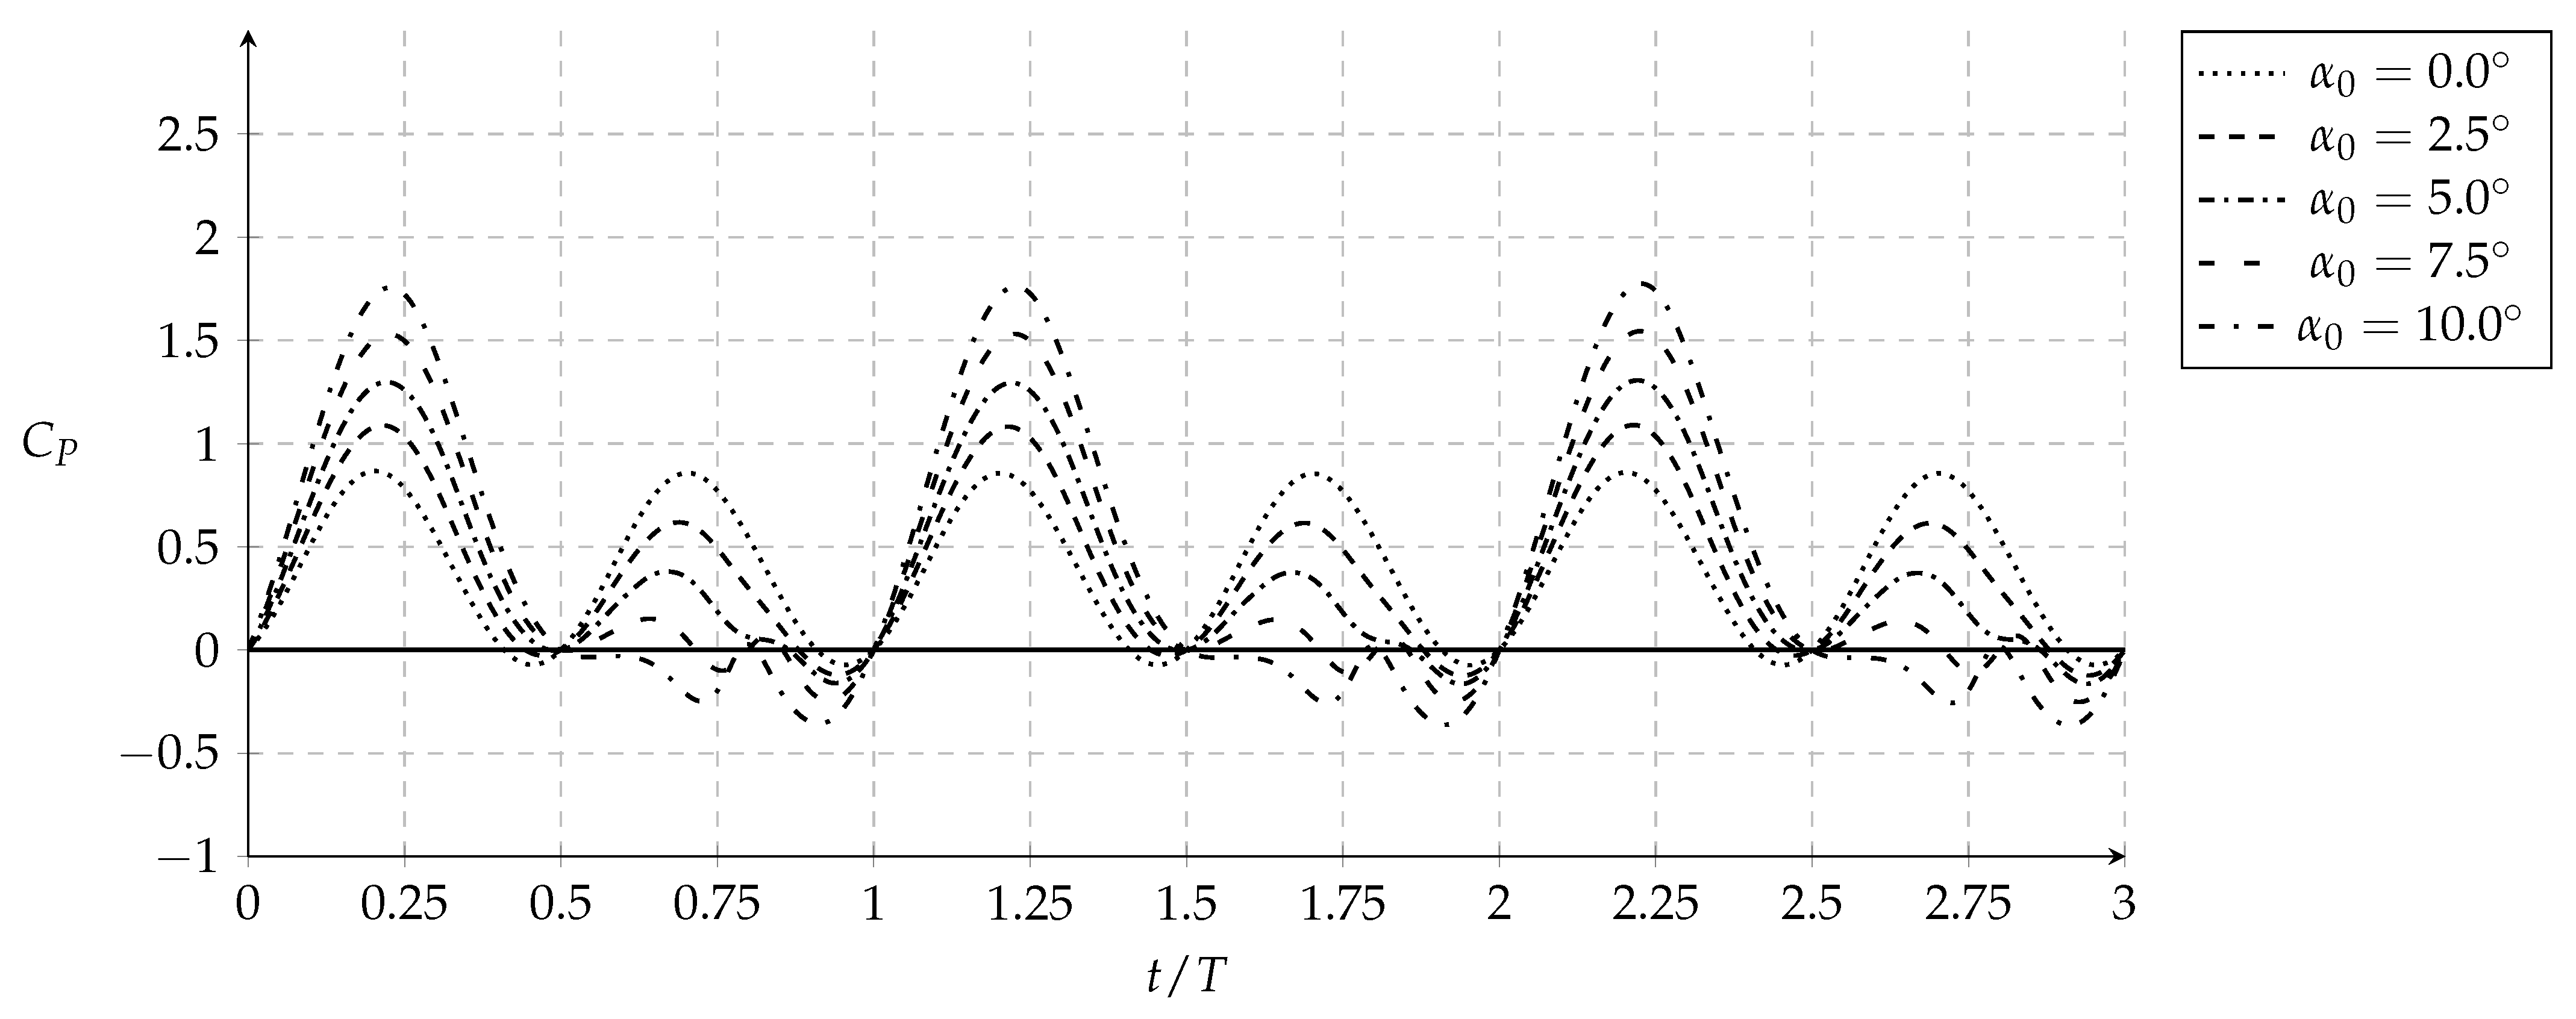
Regarding mean power coefficient independence of the mean angle-of-attack, it comes from the previously mentioned vertical translation of C l , that although rising the peaks of required power, makes C P ¯ almost constant, thus corroborating the hypothesis of a balancing mechanism. In Figure 19 it is seen that when the airfoil is descending ( 0 < t / T < 0.5 ), the higher the mean angle-of-attack, the higher is the power to maintain the prescribed motion. However, during the ascending phase, the higher the mean angle-of-attack, lower is the power requirement. In fact, the airfoil during the ascending phase reaches the point where it extracts power from the flowfield ( C P < 0 ). Such effect ends up balancing the enormous power demand upon descent, a phenomenon that is in line with an overlapping principle.
This can be further explained by observing Figure 17 and Figure 18, where the already mentioned low-pressure zone reduces the power demand during the ascending phase, functioning as a suction mechanism. Furthermore, the low-pressure zone present close to the leading edge at the lower surface starts vanishing as the mean angle-of-attack is increased.

4. Conclusions

In this paper, the plunging airfoil is investigated by observing the interdependence of thrust production and power requirement by changing several parameters such as motion frequency and amplitude, the Reynolds number and the Strouhal number. Also an extensive parametric study is made regarding the influence of the mean angle-of-attack on the aerodynamic and propulsive coefficients.
Concerning the first phase of analysis, results indicate that while plunging the NACA0012 airfoil, the mean thrust coefficient increases with the mean required power linearly, even with different reduced frequencies, nondimensional amplitudes, and Strouhal numbers. Although the authors had already studied the influence of kinematic parameters in previous works, this new and innovative approach eliminates the direct influence of kinematic parameters, and considers only that the propulsive power is a function of the required power, which are strongly correlated. This can be very useful for preliminary plunging airfoil design where the mean thrust coefficient can be obtained from the mean power coefficient. More data must be obtained to further complete and better understand these hidden correlations outside the studied range.
The second phase of results focuses on the influence of the mean angle-of-attack on the aerodynamic and propulsive performance. Firstly, a brief study on the impact of the Reynolds number with different mean angles of attack is performed. This short study reveals that by increasing R e , efficiency curves are moved upwards. However, it is found that propulsive efficiency decreases with the mean angle-of-attack due to pressure drag increase. To better understand the effect of the mean angle-of-attack, a parametric study is made in the vicinity of the maximum propulsive efficiency zone of a Reynolds number equal to 1.7 × 10 4 . In this parametric study, it is found that the mean thrust coefficient and the propulsive efficiency drop when α 0 increases, while the mean lift coefficient increases, especially at higher nondimensional amplitudes and Strouhal numbers. It is noteworthy that the mean lift coefficient shows a linear relationship with the mean angle-of-attack, something that is also observed in non moving airfoils but that has not yet been fully explored in flapping airfoils. On the other hand, the mean power coefficient is not affected by the mean angle-of-attack variation, meaning that the average power required to maintain a certain motion with different mean angles of attack is approximately the same. This finding has not received much attention by previous researchers and more conditions should be tested.
To aptly implement the flapping mechanism, the optimization of several flapping-airfoil parameters such as thrust or propulsive efficiency must be taken into consideration so that soon, we can develop algorithms that can control and adapt the flapping conditions to the flight environment, thus becoming much more like other propulsive systems.

Author Contributions

Conceptualization, E.A.R.C. and J.M.M.B.; Data curation, E.A.R.C.; Formal analysis, E.A.R.C.; Methodology, E.A.R.C. and A.R.R.S.; Project administration, A.R.R.S. and J.M.M.B.; Resources, A.R.R.S.; Software, E.A.R.C.; Supervision, A.R.R.S. and J.M.M.B.; Validation, E.A.R.C.; Visualization, E.A.R.C. and A.R.R.S. Writing–original draft, E.A.R.C. and F.M.S.P.N.; Writing–review & editing, A.R.R.S. and J.M.M.B. All authors have read and agreed to the published version of the manuscript.

Funding

The present work was performed under the scope of the Aeronautics and Astronautics Research Center (AEROG) of the Laboratório Associado em Energia, Transportes e Aeronáutica (LAETA) activities and it was supported by Fundação para a Ciência e Tecnologia (FCT) through the project number UIDB/50022/2020, the Grant co-sponsored by Santander-UBI BID/FE/2019 and the grant sponsored by Fundação para a Ciência e a Tecnologia 2020.04648.BD.

Conflicts of Interest

The authors declare no conflict of interest. The funders had no role in the design of the study; in the collection, analyses, or interpretation of data; in the writing of the manuscript, or in the decision to publish the results.

References

  1. Lee, J.S.; Kim, C.; Kim, K.H. Design of Flapping Airfoil for Optimal Aerodynamic Performance in Low-Reynolds Number Flows. AIAA J. 2006, 44, 1960–1972. [Google Scholar] [CrossRef]
  2. Jones, K.D.; Dohring, C.M.; Platzer, M.F. Experimental and Computational Investigation of the Knoller-Betz Effect. AIAA J. 1998, 36, 1240–1246. [Google Scholar] [CrossRef]
  3. Koochesfahani, M.M. Vortical Patterns in the Wake of an Oscillating Airfoil. AIAA J. 1989, 27, 1200–1205. [Google Scholar] [CrossRef]
  4. Tuncer, I.H.; Platzer, M.F. Computational Study of Flapping Airfoil Aerodynamics. AIAA J. Aircr. 2000, 37, 514–520. [Google Scholar] [CrossRef] [Green Version]
  5. Camacho, E.; Neves, F.; Silva, A.; Barata, J. Numerical Investigation of Frequency and Amplitude Influence on a Plunging NACA0012. Energies 2020, 13, 1861. [Google Scholar] [CrossRef] [Green Version]
  6. Barata, J.M.M.; Silva, T.A.J.; Neves, F.M.S.P.; Silva, A.R.R. Experimental Analysis of Forces During Take-Off of Birds. In Proceedings of the AIAA Information Systems—AIAA Infotech Aerospace, Grapevine, TX, USA, 9–13 January 2017; pp. 1196–1203. [Google Scholar]
  7. Barata, J.M.M.; Neves, F.M.S.P.; Manquinho, P.A.R. Comparative Study of Wing’s Motion Patterns on Various Types of Insects on Resemblant Flight Stages. In Proceedings of the AIAA Atmospheric Flight Mechanics Conference, Dallas, TX, USA, 22–26 June 2015; pp. 828–848. [Google Scholar]
  8. Taylor, G.K.; Nudds, R.L.; Thomas, A.L.R. Flying and Swimming Animals Cruise at a Strouhal Number Tuned for High Power Efficiency. Nature 2003, 425, 707–711. [Google Scholar] [CrossRef] [PubMed]
  9. Vuruskan, A.; Fenercioglu, I.; Cetiner, O. A study on forces acting on a flapping wing. EPJ Web Conf. 2013, 45, 01028. [Google Scholar] [CrossRef]
  10. Barata, J.M.M.; Neves, F.M.S.P.; Manquinho, P.A.R.; Silva, T.A.J. Propulsion for Biological Inspired Micro-Air Vehicles (MAVs). Open J. Appl. Sci. 2016, 6, 7–15. [Google Scholar] [CrossRef] [Green Version]
  11. Knoller, R. Die Gesetze des Luftwiderstandes; Verlag des Österreichischer Flugtechnischen Vereines: Wien, Austria, 1909; pp. 1–14. [Google Scholar]
  12. Betz, A. Ein Beitrag zur Erklärung des Segelfluges. Zeitschrift Flugtechnik für Motorluftschiffahrt 1912, 3, 269–272. [Google Scholar]
  13. von Kármán, T.; Burguers, J. Aerodynamic Theory: General Aerodynamic Theory: Perfect Fluids; Division, E., Ed.; Julius Springer Publisher: Berlin, Germany, 1935; Volume II, pp. 293–310. [Google Scholar]
  14. Garrick, I. Propulsion of a Flapping and Oscillating Aerofoil. In NACA Report No. 567; National Advisory Committee for Aeronautics: Washington, DC, USA, 1936. [Google Scholar]
  15. Theodorsen, T. General Theory of Aerodynamic Instability and the Mechanism of Flutter. In NACA Report R-496; National Advisory Committee for Aeronautics: Washington, DC, USA, 1935; pp. 291–311. [Google Scholar]
  16. Platzer, M.F.; Jones, K.D.; Young, J.; Lai, J.C.S. Flapping Wing Aerodynamics-Progress and Challenges. AIAA J. 2008, 46, 2136–2149. [Google Scholar] [CrossRef]
  17. Lewin, G.C.; Haj-Hariri, H. Modelling Thrust Generation of a Two-Dimensional Heaving Airfoil in a Viscous Flow. J. Fluid Mech. 2003, 492, 339–362. [Google Scholar] [CrossRef]
  18. Lai, J.C.S.; Platzer, M.F. Jet Characteristics of a Plunging Airfoil. AIAA J. 1999, 37, 1529–1537. [Google Scholar] [CrossRef]
  19. Young, J. Numerical Simulation of the Unsteady Aerodynamics of Flapping Airfoils. Ph.D. Thesis, The University of New South Wales, Sydney, Australia, 2005. [Google Scholar]
  20. Young, J.; Lai, J.C.S. Vortex Lock-in Phenomenon in the Wake of a Plunging Airfoil. AIAA J. 2007, 45, 485–490. [Google Scholar] [CrossRef]
  21. Tuncer, I.H.; Platzer, M.F. Thrust Generation due to Airfoil Flapping. AIAA J. 1996, 34, 324–331. [Google Scholar] [CrossRef]
  22. Camacho, E.A.R.; Neves, F.M.S.P.; Silva, A.R.R.; Barata, J.M.M. Parametric Study of a Plunging NACA0012 Airfoil. KnE Eng. 2020, 5, 424–437. [Google Scholar]
  23. Jones, K.D.; Platzer, M.F. Numerical Computation of Flapping-Wing Propulsion and Power Extraction. In Proceedings of the 35th Aerospace Sciences Meeting & Exhibit, Reno, NV, USA, 6–10 January 1997. [Google Scholar]
  24. Tuncer, I.H.; Walz, R.; Platzer, M. A Computational Study on the Dynamic Stall of a Flapping Airfoil. In Proceedings of the 16th Applied Aerodynamics Conference, Technical Papers, Albuquerque, NM, USA, 15–18 June 1998. [Google Scholar]
  25. Young, J.; Lai, J.C.S. Oscillation Frequency and Amplitude Effects on the Wake of a Plunging Airfoil. AIAA J. 2004, 42, 2042–2052. [Google Scholar] [CrossRef]
  26. Young, J.; Lai, J.C.S. Mechanisms Influencing the Efficiency of Oscillating Airfoil Propulsion. AIAA J. 2007, 45, 1695–1702. [Google Scholar] [CrossRef]
  27. Chiereghin, N.; Cleaver, D.J.; Gursul, I. Unsteady Lift and Moment of a Periodically Plunging Airfoil. AIAA J. 2019, 57, 208–222. [Google Scholar] [CrossRef] [Green Version]
  28. Gursul, I.; Cleaver, D. Plunging oscillations of airfoils and wings: Progress, opportunities, and challenges. AIAA J. 2019, 57, 3648–3665. [Google Scholar] [CrossRef]
  29. ANSYS Fluent. ANSYS Fluent Theory Guide (Release 15.0); ANSYS, Inc.: Canonsburg, PA, USA, 2013. [Google Scholar]
  30. Wu, X.; Zhang, X.; Tian, X.; Li, X.; Lu, W. A review on fluid dynamics of flapping foils. Ocean Eng. 2020, 195, 106712. [Google Scholar] [CrossRef]
  31. Rogowski, K.; Królak, G.; Bangga, G. Numerical Study on the Aerodynamic Characteristics of the NACA 0018 Airfoil at Low Reynolds Number for Darrieus Wind Turbines Using the Transition SST Model. Processes 2021, 9, 477. [Google Scholar] [CrossRef]
  32. Ashraf, M.; Young, J.; Lai, J. Effect of airfoil thickness, camber and reynolds number on plunging airfoil propulsion. In Proceedings of the 47th AIAA Aerospace Sciences Meeting Including the New Horizons Forum and Aerospace Exposition, Orlando, FL, USA, 5–8 January 2009; pp. 1274–1283. [Google Scholar]
  33. Heathcote, S.; Wang, Z.; Gursul, I. Effect of spanwise flexibility on flapping wing propulsion. J. Fluids Struct. 2008, 24, 183–199. [Google Scholar] [CrossRef]
  34. Tay, W.B.; Lim, K.B. Analysis of non-symmetrical flapping airfoils. Acta Mech. Sin. 2009, 25, 433–450. [Google Scholar] [CrossRef]
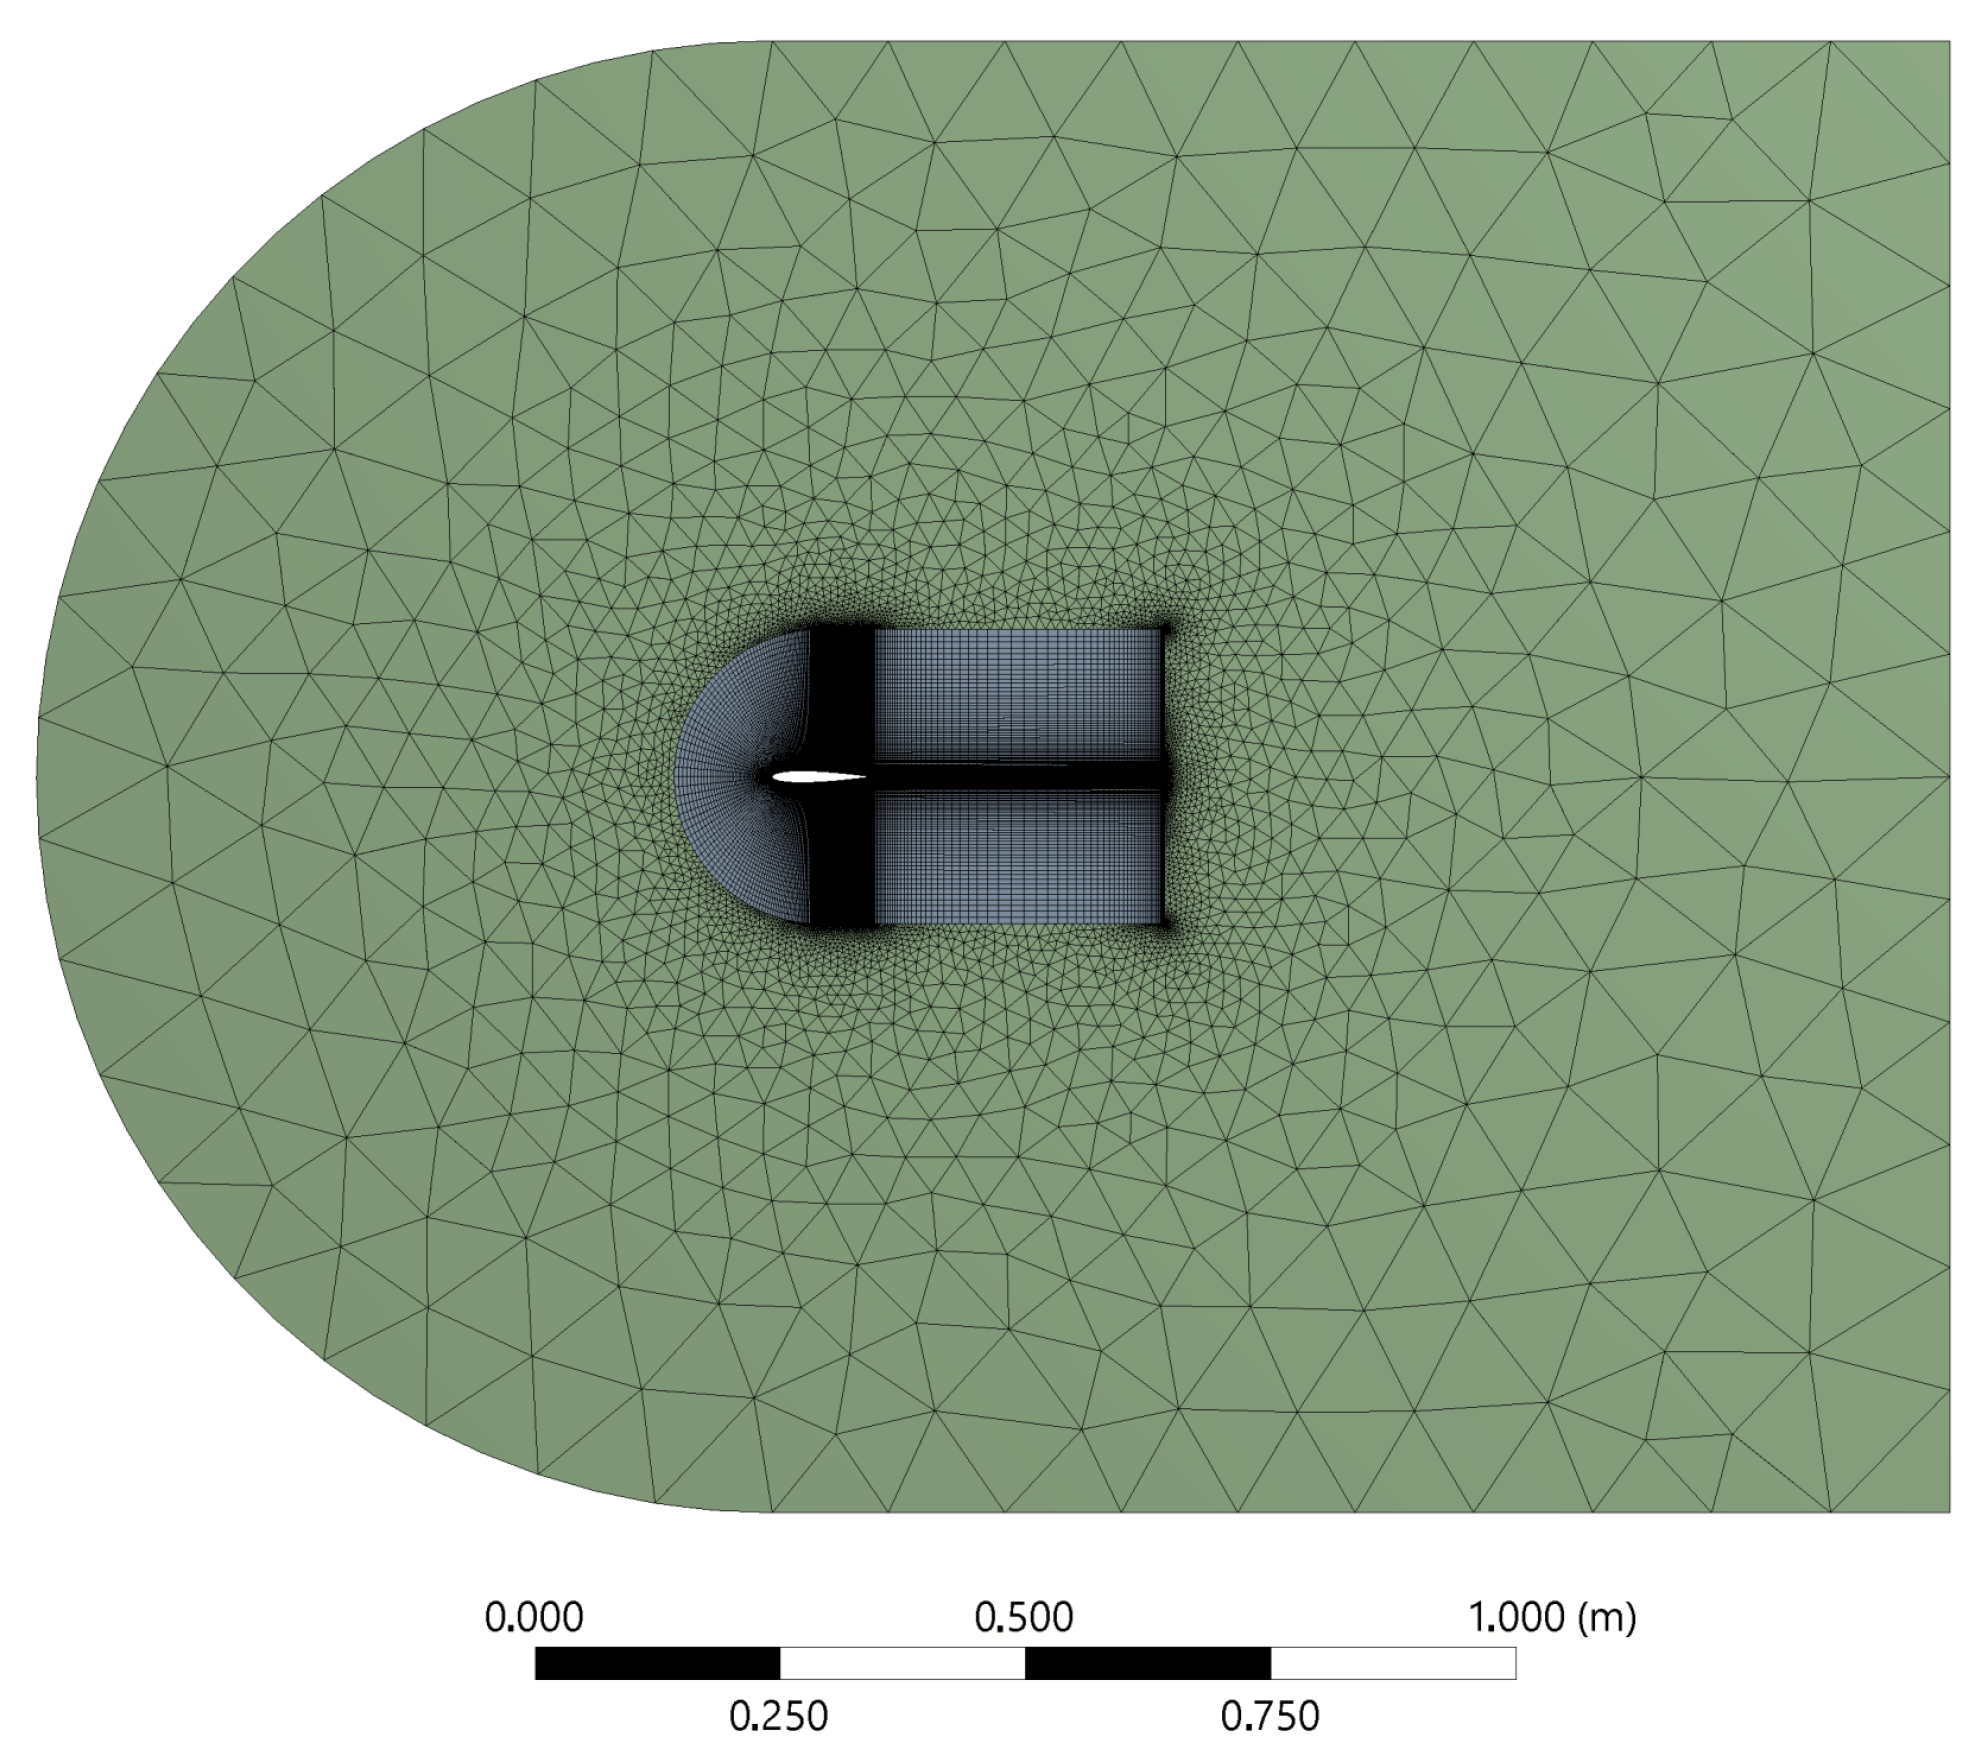
Figure 1. Computational mesh [5].
Aerospace 08 00216 g001
Figure 2. Computational domain [5].
Aerospace 08 00216 g002
Figure 3. Mean thrust and power coefficients as a function of the Strouhal number.
Aerospace 08 00216 g003
Figure 4. Propulsive efficiency as a function of the Strouhal number.
Aerospace 08 00216 g004
Figure 5. C t ¯ as a function of C P ¯ at R e = 8.5 × 10 3 . Propulsive efficiency is given by the contour plot.
Aerospace 08 00216 g005
Figure 6. C t ¯ as a function of C P ¯ at R e = 1.7 × 10 4 . Propulsive efficiency is given by the contour plot.
Aerospace 08 00216 g006
Figure 7. C t ¯ as a function of C P ¯ at R e = 3.4 × 10 4 . Propulsive efficiency is given by the contour plot.
Aerospace 08 00216 g007
Figure 8. Propulsive efficiency as a function of α 0 and R e with S t = 0.10 (left) and S t = 0.15 (right).
Aerospace 08 00216 g008
Figure 9. Mean thrust and power coefficients as a function of α 0 at S t = 0.10 .
Aerospace 08 00216 g009
Figure 10. Mean thrust and power coefficients as a function of α 0 at S t = 0.15 .
Aerospace 08 00216 g010
Figure 11. Mean thrust and power coefficients as a function of α 0 at S t = 0.20 .
Aerospace 08 00216 g011
Figure 12. C t ¯ as a function of η at S t = 0.10 , S t = 0.15 and S t = 0.20 .
Aerospace 08 00216 g012
Figure 13. Mean lift coefficient as a function of α 0 at S t = 0.10 .
Aerospace 08 00216 g013
Figure 14. Mean lift coefficient as a function of α 0 at S t = 0.15 .
Aerospace 08 00216 g014
Figure 15. Mean lift coefficient as a function of α 0 at S t = 0.20 .
Aerospace 08 00216 g015
Figure 16. Lift coefficient as a function of t / T and α 0 .
Aerospace 08 00216 g016
Figure 17. Relative pressure distribution over a period at R e = 1.7 × 10 4 , k = 2.0 and h = 0.157 with α 0 = 2.5 (left) and α 0 = 5.0 (right).
Aerospace 08 00216 g017
Figure 18. Relative pressure distribution over a period at R e = 1.7 × 10 4 , k = 2.0 and h = 0.157 with α 0 = 7.5 (left) and α 0 = 10.0 (right).
Aerospace 08 00216 g018
Figure 19. Power coefficient as a function of t / T and α 0 .
Aerospace 08 00216 g019
Publisher’s Note: MDPI stays neutral with regard to jurisdictional claims in published maps and institutional affiliations.