Article

Environmental Noise Assessment of Holding Approach Procedures Using a Multi-Level Simulation Framework

1
Institute for Acoustics, Technische Universität Braunschweig, 38106 Braunschweig, Germany
2
Cluster of Excellence SE2A—Sustainable and Energy-Efficient Aviation, Technische Universität Braunschweig, 38106 Braunschweig, Germany
3
Institute of Flight Guidance, Technische Universität Braunschweig, 38108 Braunschweig, Germany
4
Institute of Jet propulsion and Turbomachinery, Technische Universität Braunschweig, 38108 Braunschweig, Germany
*
Authors to whom correspondence should be addressed.
These authors contributed equally to this work.
Aerospace 2022, 9(10), 544; https://doi.org/10.3390/aerospace9100544
Submission received: 29 August 2022 / Revised: 15 September 2022 / Accepted: 20 September 2022 / Published: 23 September 2022

Abstract

:
Computational models of sufficient quality are indispensable to quantitatively assess aircraft noise reduction measures. Within this study, a multi-level simulation framework is established in order to predict the environmental noise of holding approach procedures by coupling simulation models from three different domains: flight performance calculation employing the base of aircraft data (BADA), jet engine performance using the software Gasturb and aircraft noise simulations based on the software sonAIR. Two different concepts of holding approach procedures are investigated, namely, the vertical holding stack and the linear hold point merge. The study is conducted considering generic air traffic scenarios at a single-runway airport. Thereby, the investigated air traffic is based on a statistical analysis of traffic data at existing airports and thus assumed to be representative. As the aircraft’s noise emission depends on both the aircraft and the engine performance, reliable results can be expected only if all individual challenges and interdependencies are accounted for simultaneously. Addressing this challenge is the main contribution of the presented work. The presented results show the plausibility of the proposed multi-level simulation framework, thus supporting its use to investigate the environmental noise impact of air traffic scenarios.

1. Introduction

The vision paper “Flightpath 2050” [1], published in 2011 by the European commission, sets ambitious goals for different fields of the future air traffic system in Europe, including, among others, societal and market needs, environmental aspects and research. For the societal aspects, specific goals are, for example, door-to-door travel within a maximum of 4 hours within Europe, flight arrivals within one minute of the planned arrival time or the availability of an air traffic management system capable of handling a minimum of 25 million flights per year. Concerning the environmental aspects, the specific goals are, among others, a 75% reduction in CO 2 emissions, 90% reduction of NO x emissions and a 65% cut of the perceived noise—all relative to the conditions in the year 2000 [2].

1.1. Means for an Eco-Friendly Future Air Traffic System

In order to achieve the Flightpath 2050 goals, a multitude of means of both policy-making and technological improvements are necessary and need to be established simultaneously. A comprehensive summary of possible and cost-effective technological measures aboard the aircraft is given in [3]. An overview of possible policy actions dedicated to reduce greenhouse gas emissions is given in [4]. One cornerstone of the air traffic system, and thus a crucial factor for its improvement with respect to the Flightpath 2050 goals, is the air traffic management (ATM), which concerns all functions needed for safe and efficient movement of aircraft in all phases of flight [5]. In order to cope with the exponential growth of the air traffic, measures are needed to ensure that both available ATM and airport capacity are sufficient to serve the demand whilst ensuring safe and reliable operations and minimizing adverse health effects [2,6]. One measure to support this task is the assessment and implementation of alternative holding and approach procedures.
Holding procedures are used by the ATM in times of high demand to put incoming aircraft on hold in order to establish the time and distance requirements between landing aircraft. Whilst the usage of holding procedures is necessary during high demand periods, they are undesired from an economic and ecologic perspective. To give examples, in [7], the authors stated that in the year of 1999, Lufthansa estimated the additional fuel burn due to holding procedures to approximately 26,000 tons and United Airlines attributed costs of US dollar 20 million to insufficient air traffic services in general. Thus, improvements of the air traffic system and, among them, holding procedures that reduce the economic and ecologic footprint while still ensuring optimal throughput and safe operation of the air traffic system are required.

1.2. Holding Procedures: Background And Definitions

In order to achieve proper spacing and to minimize safety risks because of the possible effects of potentially hazardous wake turbulence while improving the operational efficiency, air traffic controllers (ATC) are required to establish the sequence of arriving (and departing) aircraft. When the amount of traffic in an approach area cannot be handled by ATC for a certain period of time, holding procedures can be applied to put the aircraft on hold before integrating them into the approach sequence. Apart from traffic congestion, aircraft may be required to hold for other reasons, such as poor weather conditions or runway blockage, to name a few. In the following, the holding procedures to be investigated within this study are described, namely the vertical holding stack (VHS) and the linear hold point merge (LHPM) procedures.

1.2.1. Vertical Holding Stack Procedure

A holding procedure is a flight maneuver that keeps the aircraft within a specified airspace until further clearance from ATC is given. The holding procedure is constituted of a holding fix that serves as a geographical reference location to enter the holding pattern, a first half turn, an outbound leg, a second half turn and an inbound leg. The standard holding pattern is defined as a right-turn pattern and the outbound leg is usually 1 min at or below 14,000 ft and 1.5   min above 14,000 ft. The outbound leg length can also be based on a distance measuring equipment (DME) distance. The ATC or the instrument approach procedure chart will specify the length of the outbound leg in nautical miles. During holding, a constant bank of 25° and 30° or a turn rate of 3° s 1 is used to achieve the desired inbound and outbound turns [8].
Pilots are responsible for ensuring that the holding pattern conforms with the assigned charted holding pattern in terms of speed limit, turn direction, timing and distance. The entry into a holding pattern is performed according to the heading in relation to three entry sectors. The first entry sector is called parallel entry, the second one teardrop (or offset) and the third sector direct entry. Holding patterns are flown at a certain altitude with a maximum speed restriction, where an aircraft can exit to continue the next procedural approach phase of the flight.
Only one aircraft can use the holding pattern at a given altitude. In order to be able to put several aircraft on hold, ATC make use of holding stacks. A holding stack is an overlay of holding patterns using the same reference holding fix but flown at different altitudes. The aircraft in a holding stack are separated using an adequate vertical separation of 1000 ft below FL290 (read: flight level 290, i.e., a flight altitude of 29,000 ft with respect to the standard pressure of 1013.15   mbar ). Whenever an aircraft cannot be integrated into the approach sequence, ATC will create a holding stack. On flight charts, holding patterns are generally published at the initial approach fixes (IAF), which are the end of the arrival flight phase before starting the approach phase.
The ATC puts the aircraft in the holding stack by order of arrival in order to remove them using the same order (first-in first-out). Arriving aircraft are stacked at the reference point using the lowest altitude available above the preceding aircraft inside the stack. The ATC will remove the aircraft with the lowest altitude in the stack, usually when the aircraft is on the inbound leg of its holding pattern. The holding stack has to be reorganized whenever an aircraft leaves. In this case, ATC will descend each aircraft one by one, down to the next free level, clearing the higher levels to incoming aircraft.

1.2.2. Linear Hold Point Merge Procedure

A promising method to integrate aircraft into the approach sequence is the so-called point merge (PM) procedure [9]. The PM is a systemized technique for sequencing arrival flows. Based on a specific precision-area navigation (P-RNAV) route structure, this method consists of a single point used to merge arrivals, which is denominated as the merge point, and two predefined sequencing legs at different flight levels [10]. The sequencing is achieved via a “direct-to” instruction from ATC to the merge point, as soon as the required spacing with the preceding aircraft is obtained. From this point, the aircraft joins the final approach through a fixed path. The sequencing legs are only used to stretch the path of the aircraft whenever required to build the sequence in dense terminal areas. Those legs are designed in the shape of arcs with a certain distance from the merge point.
This closed-loop sequencing technique is expected to provide benefits in terms of safety and terminal airspace capacity even under high traffic conditions while enabling continuous descent operations and maintaining runway throughput [11,12]. This results in a reduced environmental impact and improved flight efficiency due to better trajectory prediction. According to the EUROCONTROL [13], the improved containment of flown trajectories (especially at low altitudes) after the merge point allows controlling the carbon footprint and optimizing it with respect to, for example, the noise impact in densely populated areas.

1.3. Contribution of the Presented Study

Aircraft noise and induced noise annoyance is a burden on public health [14] and, according to “Flightpath 2050” [1], among the major environmental impacts of the air traffic system to be reduced. However, the design and assessment of any means for improving future air traffic systems need to rely on precise computational models to account for diverse scenarios. The environmental noise can be simulated using a variety of existing models that oftentimes are divided into best-practice methods (BPM) and scientific models [15,16]. Whereas BPM are well suited for long-term air traffic scenarios, as shown in, for example, [17], scientific models are suitable for single-flight events [18] or future scenarios [19]. Regardless of the tool chosen, the noise emission of the aircraft under investigation needs to be accurately modelled in order to obtain reliable results. This is even more valid if sophisticated noise metrics addressing the human perception in a detailed manner shall be assessed. This is done, for example, in [20] to assess the short-term annoyance of novel aircraft concepts using psychoacoustic-based metrics.
Several noise sources aboard an aircraft directly depend on operational parameters, such as the flight procedure, aerodynamic configuration and engine setting throughout the entire flight path. Thus, these parameters need to be known or modeled in order to allow the noise computations [21]. A multi-level and multi-fidelity computational chain capable of assessing the environmental noise of novel aircraft concepts has been established in the past and applied in a preliminary study to the assessment of novel low-noise aircraft architecture in [19]. The computational chain incorporates high-fidelity predictions of noise sources using computational aeroacoustics methods, assembles component-based sources at the level of an entire aircraft and thus has the potential for the assessment of novel aircraft in future air traffic scenarios. However, to date, it is not directly linked to a precise modeling of aircraft flight trajectories and air traffic management modeling.
In this work, we propose a multi-level simulation framework capable of assessing the environmental noise of complex air traffic scenarios in a realistic manner. The simulation framework is based on the coupling of three different tools that allow for aircraft noise assessment based on realistic input data regarding flight trajectories, aircraft configuration and engine setting. The environmental noise is modeled using a scientific aircraft noise simulation tool incorporating several propagation effects and a distinction between airframe and engine noise emissions, described in Section 2.3. The flight trajectories and respective aircraft performance, configuration and thrust setting are modeled using a in-house tool described in Section 2.1. A crucial input parameter for the noise source modeling is the rotational speed of the jet engine’s fan, which is computed within this toolchain using a specific jet engine modeling tool described in Section 2.2.
The capabilities of the proposed multi-level simulation framework are demonstrated in a case study where the environmental noise of air traffic scenarios considering two different concepts of holding approach procedures on a generic single-runway airport is quantified. As a prerequisite for modeling realistic air traffic scenarios, a statistical analysis of the air traffic data at six single-runway airports located in the United Kingdom (UK) and Europe is conducted. Based on this analysis, the air traffic scenarios are defined considering two representative aircraft, namely one medium-range single-aisle aircraft and one long-range twin-aisle vehicle. Three reference scenarios are established with different shares of medium- and long-range aircraft, thus representing the air traffic for the different investigated airports. In order to obtain realistic results, the aircraft are distributed randomly within the possible flight routes, and the computations are run multiple times in a Monte Carlo based setting. Moreover, an additional investigation is presented focusing on the influence of the fan rotational speed values used as input for the noise simulations. Therein, a reduced modeling approach using mean values depending on the flight phase is investigated due to the fact that the availability of realistic data for this parameter is oftentimes low in practical applications.

1.4. Outline of The Paper

The paper is outlined as follows: in Section 2, the computational tools building the proposed modeling toolchain are presented in a detailed manner in Section 2.1, Section 2.2 and Section 2.3. The scenario definitions are described in Section 3, including the description of the airport layout in Section 3.1 and the definition of the modeled air traffic considering different concepts of holding procedures in Section 3.2. The statistical analysis of the air traffic at single-runway airports is presented in Section 3.3. The findings of the statistical analysis are used to define the air traffic scenarios investigated in terms of fleet mix (see Section 3.3) and number of flight operations (see Section 3.4). The results of the study are shown in Section 4, where the environmental noise of the holding approach procedures are assessed in terms of the equivalent sound pressure level for one hour and the maximum sound pressure level averaged over all noise events. The results are reported as contour maps and impacted areas in Section 4.1. The investigation on the influence of the fan rotational speed input data on the noise simulations is presented in Section 4.2. The contribution is summarized in Section 5, and an outlook is given.

2. Methodology

The investigation of novel concepts that can contribute to improve the efficiency and sustainability of the air traffic system requires simulation tools capable of providing as realistic predictions as possible. However, the simulation of real-life air traffic scenarios is a complex task due to the multitude of physical phenomena that need to be adequately modeled. Another challenging aspect is the quantity, availability and complexity of the required input data, which has a relevant impact on the performance of the models. For the purpose of assessing the environmental noise of different holding approach procedures, in this work, we employ a multi-level framework composed by three simulation tools. First, the performance of an aircraft along a prescribed flight trajectory is modeled using the calculation tool described in Section 2.1. In a second step, gas turbine simulations are conducted using the software Gasturb 12 [22,23] in order to model the performance of a jet engine and estimate the rotational speed of the aircraft engine’s fan (N1) along a prescribed flight trajectory (see Section 2.2). The N1 is an essential input required for realistic aircraft noise simulations using the software sonAIR [24], which are conducted in the last stage of the multi-level simulation framework. A brief overview about the software sonAIR is provided in Section 2.3. An overall illustration of the multi-level simulation framework employed in this work, along with the inputs and outputs associated to each stage, is provided in Figure 1. In the following, a detailed description of the individual simulation processes is provided.

2.1. Flight Trajectory and Performance Calculation Tool

Within the context of the proposed investigation, a software tool that allows to calculate the operational performance of an aircraft along a prescribed flight trajectory is used. The inputs necessary for this purpose are the aircraft type and weight and a set of flight navigation waypoints as illustrated in Figure 1.
The core of the aircraft performance modeling is conducted employing the base of aircraft data (BADA) 3.9 [25,26,27,28], which is a collection of ASCII files containing performance and operating procedure coefficients for a large span of aircraft types. These coefficients are employed in order to model the performance of a particular aircraft type along the entire flight envelope based on a set of parametric equations [25,26]. This procedure is structured as follows:
  • The operation performance model (OPM) defines a set of equations which provide a parametric description of the forces acting upon the aircraft’s motion, namely the aerodynamic forces (lift L and drag D), the propulsive force (engine thrust T E ), and the gravitational acceleration, g. The aircraft trajectory and performance are calculated based on a point mass, kinetic approach called total energy model (TEM) [27], which relates the rate of potential and kinetic energy increase to the resultant work done by the forces acting upon the aircraft’s movement, as
    ( T E D ) V TAS = m g d h d t + m V TAS d V TAS d t ,
    where V TAS is the true airspeed, h and m are the aircraft’s altitude and mass, respectively. By relating the rate of the aircraft mass change over time with the fuel consumption and the relevant boundary conditions, it is possible to compute the aircraft motion at each prescribed flight segment. The flight trajectory is then composed by the modeled aircraft’s motion along all flight segments.
  • The OPM is complemented by the atmosphere model (AM), which provides expressions for the atmospheric properties (pressure, temperature, density and sound speed) as a function of the altitude. This information is essential for the conversion of the aircraft’s calibrated airspeed (CAS) into true airspeed (TAS) and to compute the aircraft’s Mach number.
  • The aircraft’s calibrated airspeed along with the flight trajectory refers to the airline procedure model (APM), which is used to characterize standard airline speed procedures for different flight phases, i.e., take-off, climb, cruise, descent, approach and landing. The information regarding the aerodynamic configuration of the aircraft, i.e., the flap and landing gear settings, is defined based on the flight phase according to the aerodynamics block of the operations performance file (OPF) [26].
The engine thrust and fuel consumption predictions provided by this BADA-based software tool were previously verified by Förster et al. [29] for an Airbus A320 by means of comparison with data provided by a cockpit flight simulator.

2.2. Jet Engine Performance Simulation

The BADA-based flight trajectory and performance calculation tool described previously in Section 2.1 is able to model multiple performance parameters of an aircraft along a flight trajectory (see Figure 1), but not the rotational speed of the engine’s fan. This parameter, which is commonly used to describe the engine’s fan setting, is a crucial input required by the engine noise models used in the software sonAIR (see Section 2.3). The rotational speed of the engine’s fan is commonly expressed as the relative percentage value of the fan rotational speed, n 1 in rpm, with respect to the maximum fan rotational speed, n 1 , max in rpm, as
N 1 = n 1 n 1 , max · 100 .
In order to model the N1 values along the aircraft’s trajectory, the validated and verified software Gasturb 12 [22,30] is applied for the 0D-performance simulation of the jet engine mounted on the aircraft being considered in this study. These are the Airbus A320 and the Boeing B77W, representing medium-range and long-range aircraft, respectively. The criteria considered for the selection of these aircraft types are discussed in Section 3.3. The Airbus A320 is mounted with two V2500-A1 turbofan jet engines from International Aero Engines (IAE) while in the Boeing B77W, two GE90-115B turbofan jet engines from General Electric Aviation (GE) are installed. Both jet engines are two-shaft high-bypass turbofans with fan, low-pressure compressor (LPC), high-pressure compressor (HPC), high-pressure turbine (HPT), low-pressure turbine (LPT) and a common thrust nozzle.
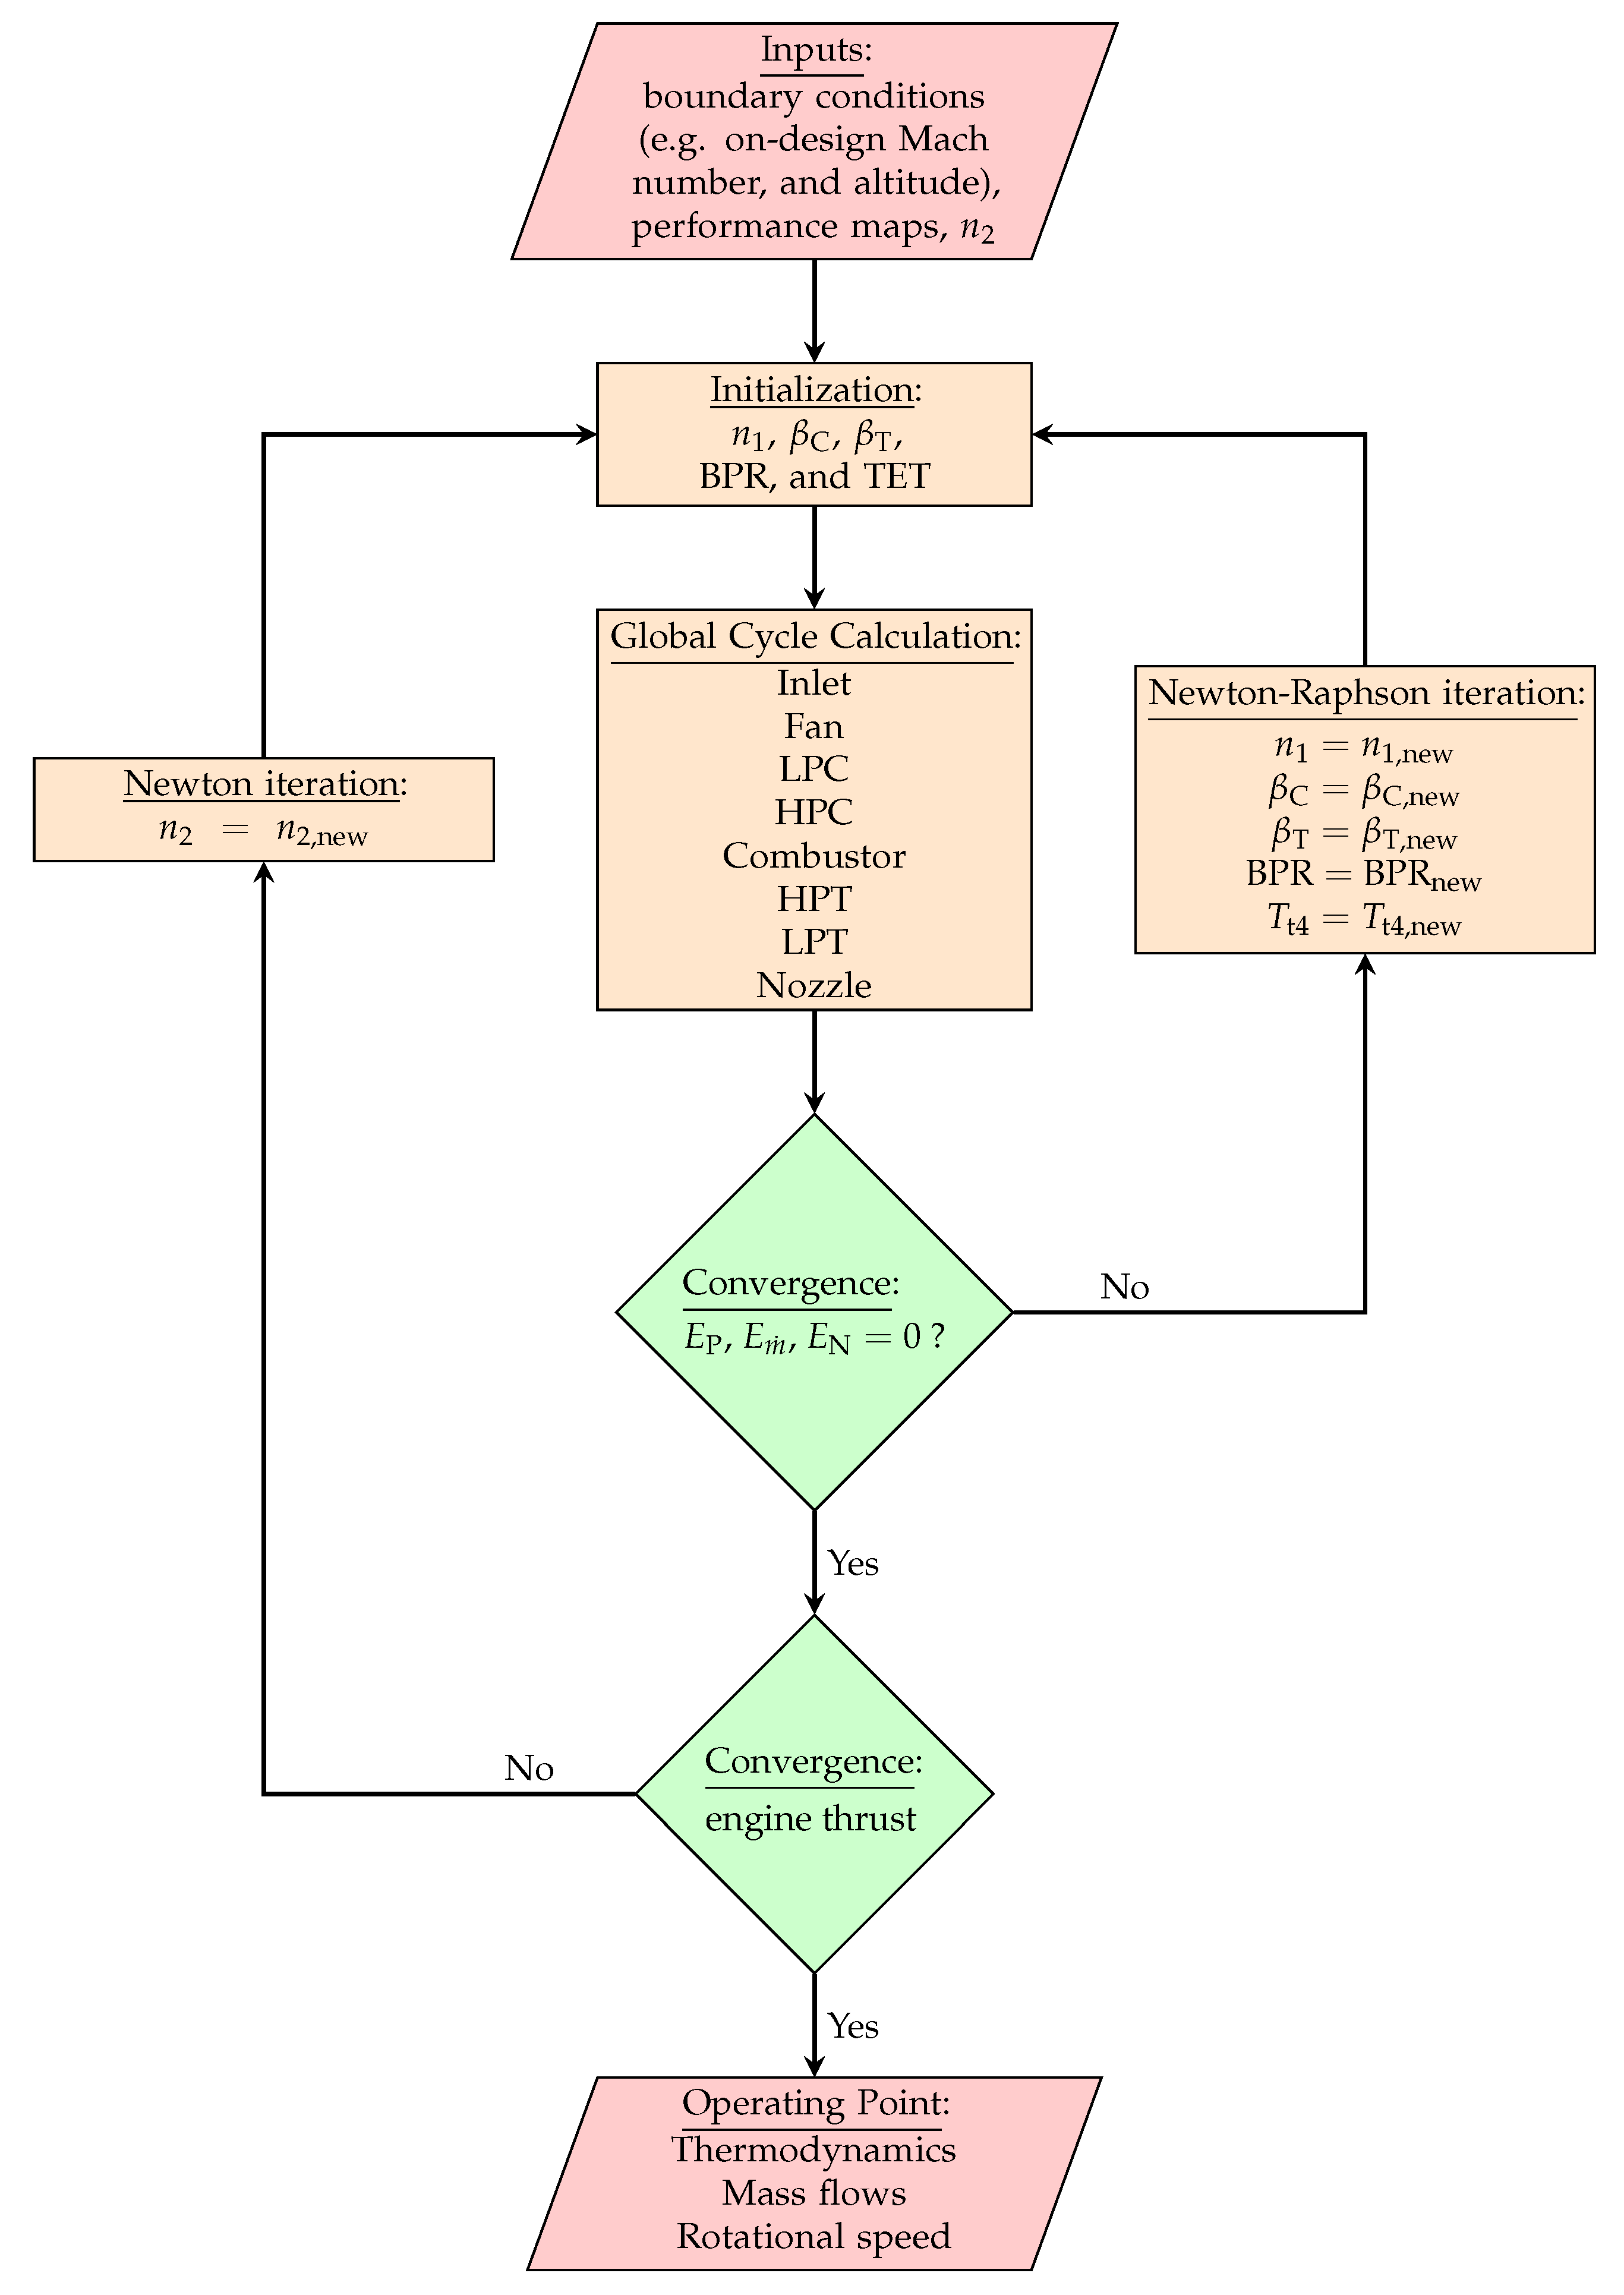
In Gasturb 12, a mission analysis is carried out to calculate the rotational speeds of the jet engines for different operating points, i.e., approach and landing. This off-design analysis is presented by the schematic flow chart illustrated in Figure 2.
The off-design calculation procedure consists of an iterative simulation process which requires various input data, such as the altitude, Mach number and engine thrust along the aircraft’s trajectory. These are modeled by the flight trajectory and performance calculation tool described in Section 2.1 depending on the aircraft type. Moreover, further jet engine-specific boundary conditions are required, the thermodynamic cycle at a reference point being a crucial one, also referred to as the engine’s on-design operating point. This point represents the basic framework of the jet engine and defines the interaction of the miscellaneous turbomachines, secondary air system, geometry (e.g., nozzle area) and number of revolutions in order to fulfill the thermodynamic cycle. Mostly, the on-design operating point is based on cruise or top of climb conditions. Table 1 presents the reference operating values considered for the cruise performance of both jet engines modeled in this work to develop their entire thermodynamic cycle, namely, thrust, overall pressure ratio (OPR) (product of fan, LPC and HPC pressure ratio P), fan rotational speed n 1 , rotational speed of the high-pressure system n 2 , specific fuel consumption (SFC) and the bypass ratio (BPR).
Another boundary condition required is the steady-state performance maps of the compressors and turbines. These characteristic diagrams describe the mass flow m ˙ and pressure ratio π of the turbomachines by different rotational speeds. Furthermore, auxiliary coordinates, the so-called beta lines β , are placed through the diagram, which are necessary for the iteration of the algorithm. The on-design performance values and the boundary conditions for the V2500-A1 jet engine are based on the works of Spuhler et al. [31] and Goeing et al. [32]. For the GE90-115B jet engine, these are based on the works of Davis and Stearns [33], Stearns [34] and Benawra and Wang [35].
After the engine-specific boundary conditions have been imported and the operating point to be reached has been defined, Gasturb starts its iterations. A distinction is made between the outer loop, in which the rotational speed n 2 is varied until the required engine thrust is reached, and the inner loop, in which a correct thermodynamic cycle is matched through iterations based on the input parameters. Matching in this context means iterating within the performance maps until the following: (1) the turbine power P T output matches the compressor power P C , as defined by the error function E P in Equation (3); (2) the mass flow is maintained, as defined by the error function E m ˙ in Equation (4); and (3) the nozzle pressure p nozzle , t 8 is equal to behind the LPT p LPT , t 8 (including friction), as defined by the error function E N in Equation (5). Hereon, quantities related to the compressor and turbines are denoted with ( . ) C and ( . ) T sub-indexes, respectively.
E P = P T P C = Δ h tT · m ˙ Δ h tC · m ˙
E m ˙ = m ˙ T m ˙ C
E N = p nozzle , t 8 p LPT , t 8
Based on the on-design input parameters, the initial values of all necessary parameters are provided for the first iteration. The iteration parameters for the inner loop at any rotational speed n 2 are the turbine entry temperature T TET , BPR, the rotational speed n 1 and the auxiliary coordinates β T and β C . Based on this, the operating point of each individual turbomachine is defined, and a global cycle process calculation can be carried out. The next step is to check whether Equations (3)–(5) are fulfilled and the error functions approach zero. If this is not the case, the iteration parameters are varied using the Newton–Raphson method until an operating point is found. The iteration searches through the complete performance maps until the turbomachines are matched and a complete cycle is found. The next step is to check whether this correct cycle also achieves the required thrust. If this does not happen, the rotational speed n 2 is varied using the Newton–Raphson method [23,36]. If both criteria are satisfied, the required cycle is achieved. This brings all the physical variables with it so that the rotational speed N1 can be transferred to sonAIR to perform the aircraft noise simulations.

2.3. Aircraft Noise Simulation

The computational predictions of the environmental noise caused by aircraft operations are hereby conducted using the software sonAIR [24]. The aircraft-specific noise emission models [16,37] available in sonAIR are based on a set of linear regression equations derived from a database of experimental measurements covering a wide range of typical aircraft operations and flight configurations [37]. The overall noise emission is modeled as three-dimensional frequency-dependent directivity patterns accounting for the engine and airframe noise contributions, separately. The main inputs required by the engine noise model are the fan rotational speed N1 and the aircraft’s Mach number. As the derivation of the noise emission models is based on a dataset containing different levels of detail available about the aerodynamic configuration of the aircraft (i.e., the settings of the flaps, landing gears, and speedbrakes), the sonAIR’s airframe noise models are formulated in two versions, namely full models and reduced models. In the first, the aerodynamic configuration of the aircraft at any segment of the aircraft flight trajectory is taken into account, while in the second, it is not explicitly considered. Therefore, the reduced models represent the average aerodynamic configuration settings of the aircraft at any given point of its flight trajectory. The main inputs required by both airframe models are the flight procedure, the air density at the flight altitude, and the aircraft’s Mach number. In the present work, only reduced models are used due to availability.
Sound propagation effects are calculated using the sonX model [24], which accounts for the main propagation effects described by ISO 9613-1 [38] and ISO 9613-2 [39], such as geometrical spreading, air absorption, shielding effects, foliage attenuation, ground reflections and meteorological effects. Therefore, the sonAIR simulations account for the terrain properties (i.e., topography and land-cover) around the modeled airport, which have a non-negligible effect on the noise calculations. Moreover, moving source effects, such as convective amplification and the Doppler effect, are also taken into account. The whole sonAIR simulation framework is formulated in 1/3 octave bands from 25 Hz to 5 kHz.
SonAIR is embedded as an add-in in the Esri ArcGIS software environment, which is a geographic information system platform broadly used for processing and visualizing cartographic data. In sonAIR, the description of the flight trajectory is obtained by merging a two-dimensional ground track with the flight profile. The ground track represents the flight trajectory as a series of discrete points projected in the horizontal ground-plane. The flight profile contains information about the aircraft operational parameters along the discrete ground track points. The operational parameters are as follows: cumulative distance from the runway, altitude above ground level (AGL), true airspeed, fan rotational speed, air density and sound speed at the flight altitude. Moreover, the flap and landing gear settings are necessary in case a full airframe noise emission model is used. A summary of the inputs required for conducting the noise simulations in sonAIR is presented in Figure 1.
The noise levels are computed for each individual flight along its trajectory on a grid of receiver positions with a spatial resolution of 150 m and at a height of 4 m above the ground, as recommended by the European directive 2002/49/EC [40]. The single-event noise footprints are computed in terms of the A-weighted maximum sound pressure level, L A , max , and the A-weighted sound exposure level, L AE . The noise impact promoted by multiple flight events over a period of time is hereby quantified by means of the A-weighted equivalent sound pressure level. This cumulative sound level indicator, which is defined in Equation (6), is computed by averaging the acoustic energy of all i th single flights occurring during a given time period T 0 , in seconds. In this study, T 0 = 3600 s as air traffic scenarios for a time period of 1 h are analyzed (see Section 3). Additionally, the L A , max , avg is also considered in our work as an indicator of the averaged A-weighted maximum sound pressure level over all i th single flights occurring on a particular scenario, as defined by Equation (7). In Equations (6) and (7), N refers to the total number of flight events.
L A , eq = 10 log 10 i = 1 N 10 L AE , i 10 10 log 10 T 0
L A , max , avg = 10 log 10 1 N i = 1 N 10 L A , max , i 10
The sonAIR prediction capabilities were extensively verified by means of comparison with large datasets of measurements conducted at the vicinities of Schiphol airport [41] as well as at Zurich and Geneva airports [18,42]. For the two particular aircraft considered in this study, i.e., the Airbus A320 and the Boeing B77W (see Section 3.3), the validation study of Jäger et al. [42] showed that the sonAIR simulations were able to predict the measurements, in terms of L AE , with absolute mean and standard deviation differences no bigger than 0.8 dB and 1.9 dB, respectively, for approaching aircraft (see Table 2). This gives a good confidence on the use of those two particular noise emission models for the purposes of the present study.

3. Scenario Definitions

Among other reasons, holding approach procedures are employed during periods of traffic peak when the demand for the sequencing of approaching aircraft surpasses the capacity of an airport’s runway. In this work, we consider the case of a single-runway airport operating on its full capacity during a traffic peak period of one hour. Therefore, the air traffic scenarios are modeled and assessed considering these characteristics.
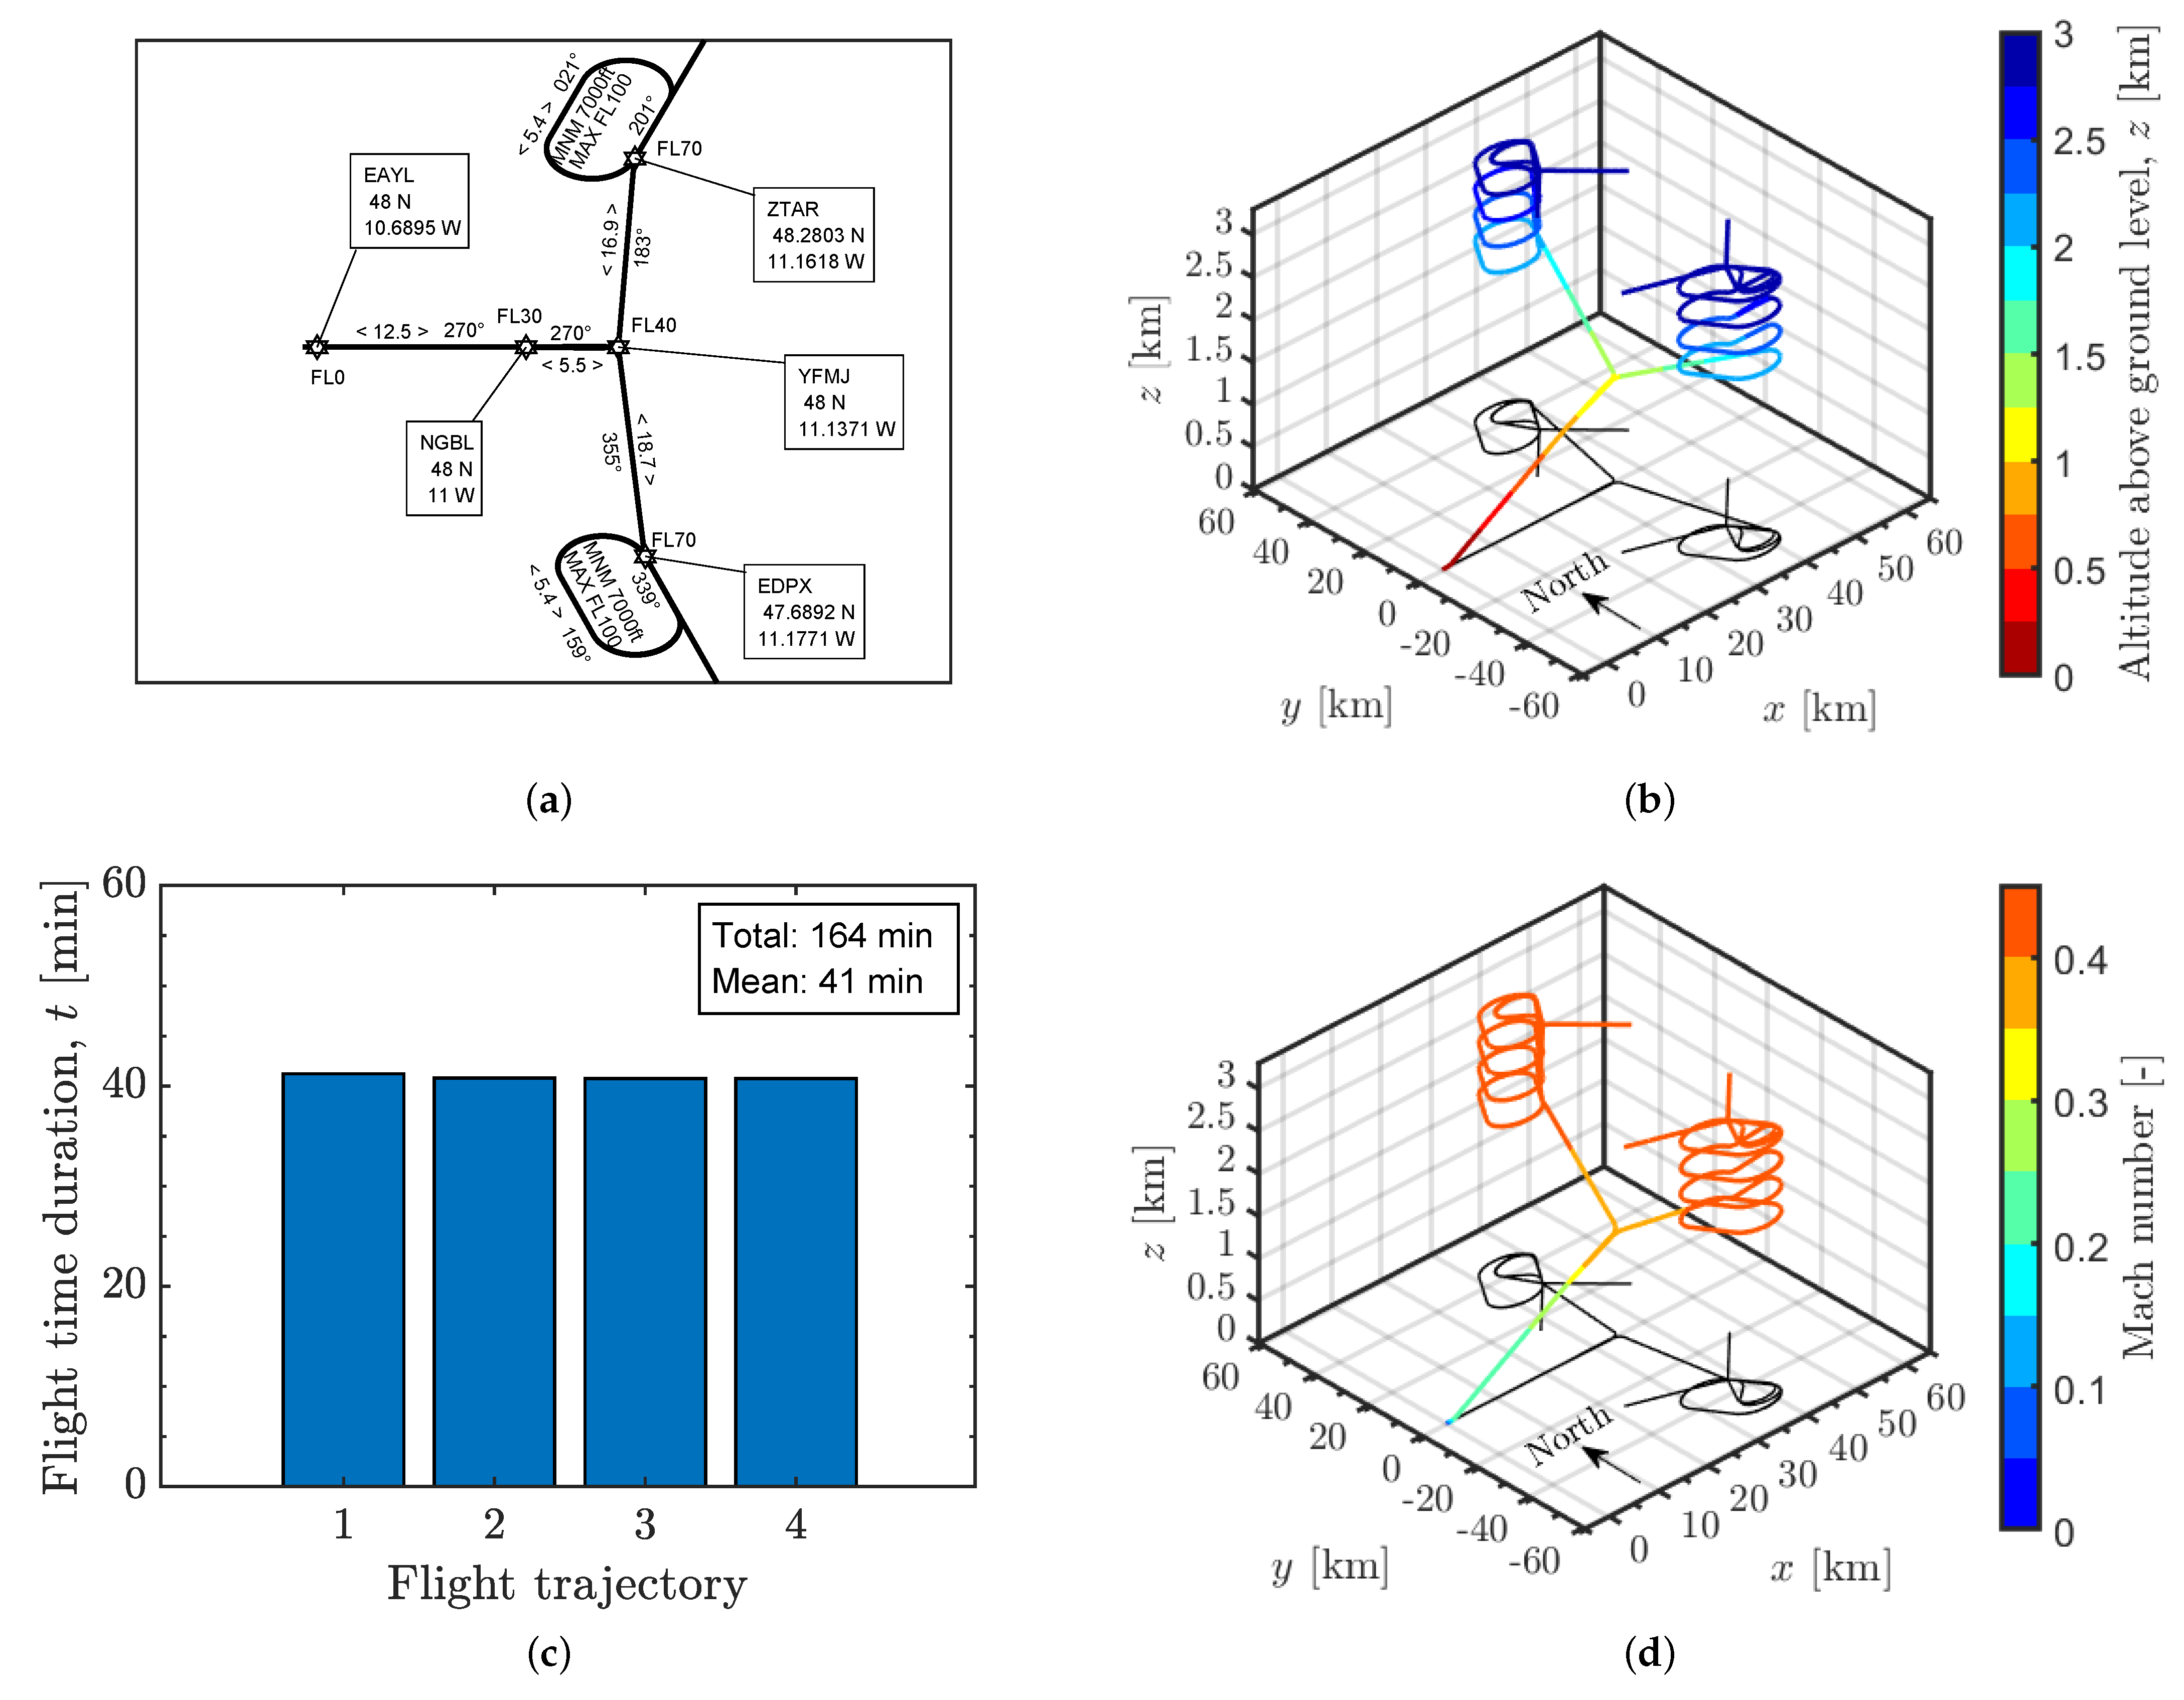
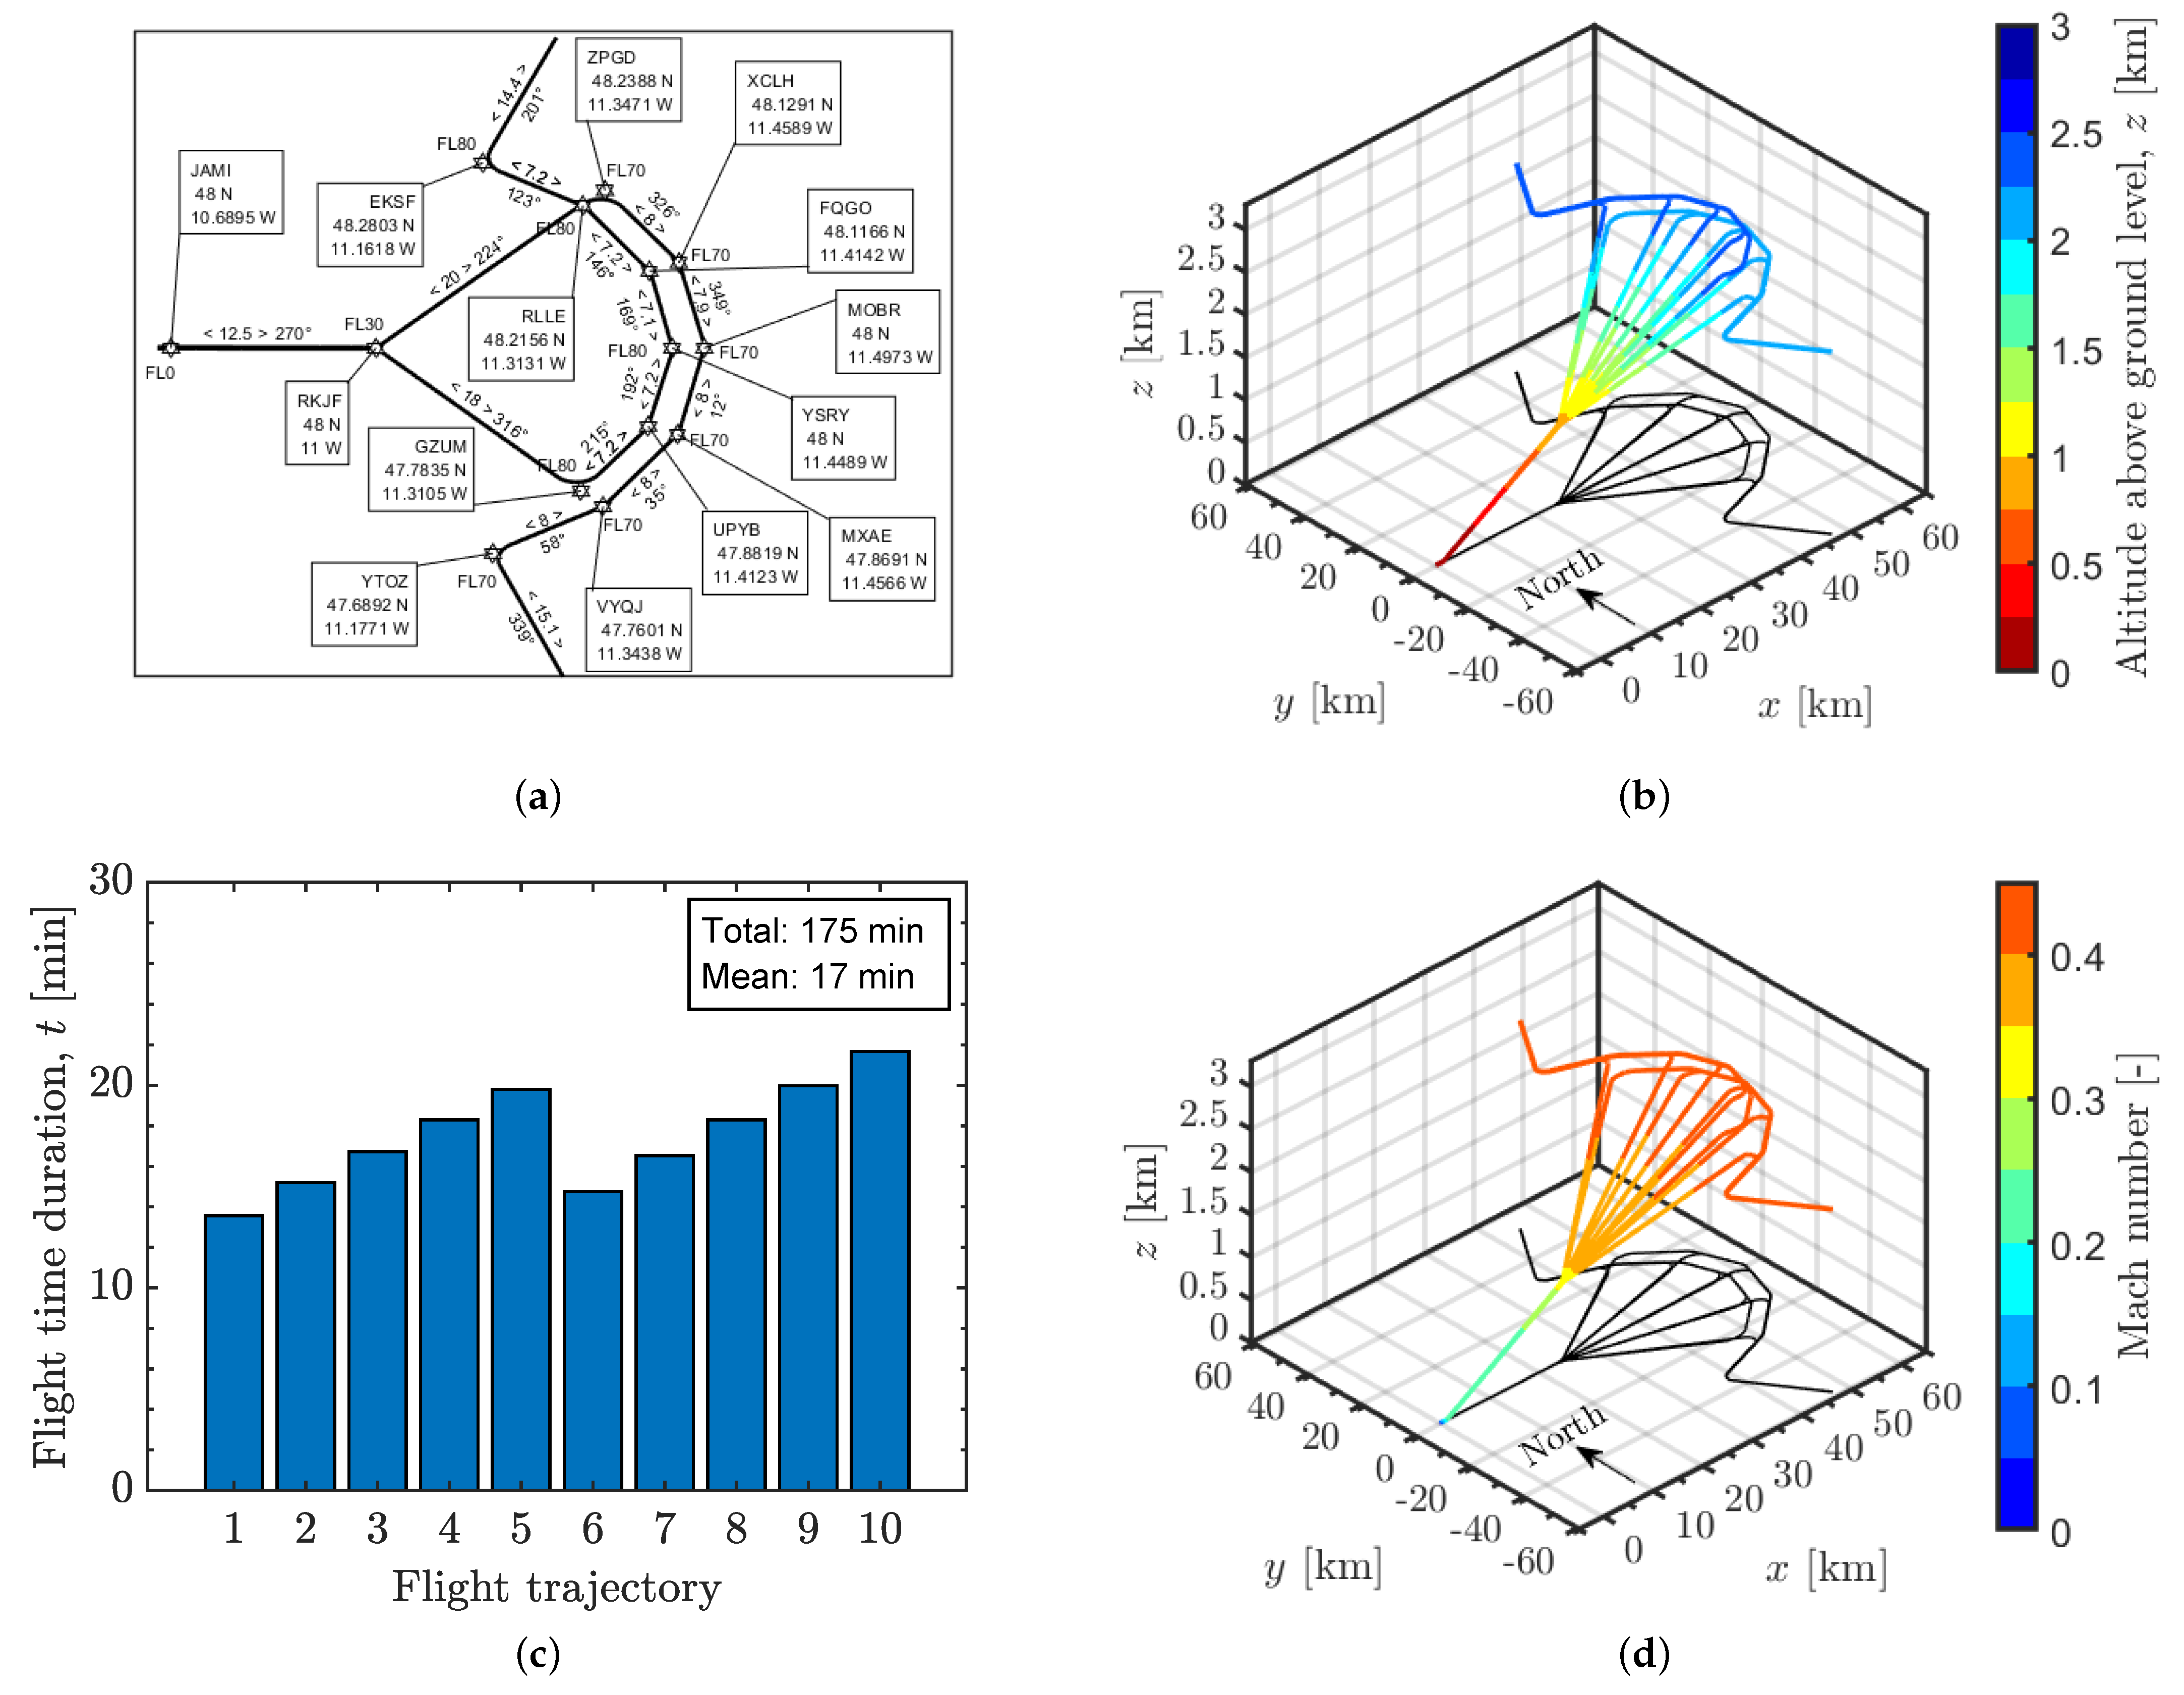
In general, the air traffic scenarios investigated hereafter are composed by an airport layout and a number of (approach) flight operations per aircraft type, which are distributed across a set of flight trajectories. Two different concepts of holding approach procedures are considered, namely the vertical holding stack (see Figure 3) and the linear holding point merge (see Figure 4). For this purpose, fictitious standard terminal arrival route (STAR) flight charts incorporating these two concepts of holding approach procedures are considered. Based on the STARs for each case, a predefined number of flight trajectories are calculated for each individual aircraft type. Finally, the air traffic scenarios are modeled by randomly assigning a number of flight operations per aircraft type to the different calculated flight trajectories. A detailed description about the scenario definitions is provided in the following sections.

3.1. Airport Layout

In order to consider a generic airport environment, a single runway with a 09/27 (east/west) configuration is considered. The runway has a total usable length of 3.3 km and width of 60 m, and is centered in the origin of a Cartesian plane (i.e., x = 0   m and y = 0   m ). For the noise simulations in sonAIR, the terrain around the airport is considered flat and homogeneously covered by grass, with a flow resistivity of 200 k g s 1 m 2 . Moreover, a quiescent (wind-free) and homogeneous atmosphere with a temperature of 20 °C, atmospheric pressure of 1000 mbar and relative humidity of 60% is considered.

3.2. Holding Procedures

Based on the fictitious STAR flight charts containing the vertical holding stack (see Figure 3) and linear hold point merge procedures (see Figure 4), the BADA-based tool described in Section 2.1 calculates a set of flight trajectories for each case according to the individual performance of the aircraft types composing the fleet used in this work (see Section 3.3). In all cases, the flight trajectories are calculated considering each aircraft’s maximum landing weight (MLW) and a three-degree glide slope during the landing flight phase, when the aircraft is aligned with the runway. A general description of the holding approach concepts considered in our study is presented in the following:
  • Vertical holding stack: This holding pattern is characterized by a race-track starting at the holding fix, and composed by 180° turns. Moreover, it is composed by four vertical layers separated by an altitude of 1000 ft (≈305 m ) from each other. The overall traffic routing is composed by two holding fix points, one located northeast and the other in the southeast direction from the runway threshold (see Figure 3a). The aircraft can enter in each one of the holding fix points with an altitude of ≈10,000 ft (≈3050 m ). In total, the air traffic is modeled by four possible flight trajectories in order to consider a parallel and a teardrop entry on each one of the two holding fix points. The flight chart, altitude and velocity of the flight profiles, and the total flight time duration per flight trajectory considered in this case are presented in Figure 3. The flight trajectories are presented in a more detailed manner in Figure A1.
  • Linear hold point merge: This alternative procedure is composed by two sequencing legs separated horizontally and vertically from each other, whereas the vertical distance is 1000 ft (≈305 m ). Each sequencing leg is accessed by one flight track resembling a direct entry track of the vertical holding stack case. The upper level sequencing leg, which is accessed by aircraft coming from the northeast, has a constant altitude of ≈8000 ft (≈2438 m ). The lower level sequencing leg, which is accessed by aircraft coming from the southeast, has a constant altitude of ≈7000 ft (≈2133 m ). For each sequencing leg, the aircraft can be directed to the merge point from five different waypoints (see Figure 4a). The merge point is positioned at a distance of ≈ 24.3 km from the runway threshold. In total, the air traffic is modeled by 10 possible flight trajectories in order to consider the sequencing of flights to the merge point from each of one of the five waypoints of the sequencing legs. The flight chart, altitude and velocity of the flight profiles, and the total flight time duration per flight trajectory considered in this case are presented in Figure 4. The flight trajectories are presented in a more detailed manner in Figure A1.
For the sake of clarity, only flight trajectories calculated based on the performance of the Airbus A320 are presented in Figure 3 and Figure 4. These are slightly different for the another aircraft considered in our study, i.e., the Boeing B77W, due to its performance and operational requirements, which are realistically modeled by the BADA-based flight trajectory and performance calculation tool described in Section 2.1. As the total flight time duration of the flight trajectories composing the two air traffic scenarios considered in this work are similar (see Figure 3c and Figure 4c), a comparative noise assessment is assumed to be plausible.

3.3. Aircraft Fleet

In order to generate generic yet realistic air traffic scenarios, a simplified approach to define the aircraft fleet is adopted by considering only two aircraft types, one representing medium-range and the other long-range aircraft. It is shown in the work of Torija and Self [43] that such a simplified representation of the aircraft fleet is a valid approach for the rapid and accurate noise assessment of large air traffic scenarios if representative aircraft types are adequately chosen.
For this purpose, we analyzed air traffic data from several single-runway airports in Europe and the UK for suitability. The analysis is based on the so6 data repository provided by the EUROCONTROL [44], which provides information about all planned flights in a particular airport, including origin and destination, planned waypoints and the aircraft type. For the present study, data comprising all the days of March, June, September and December of 2018 are considered, thus addressing the seasonal variability experienced in the selected airports throughout the year.
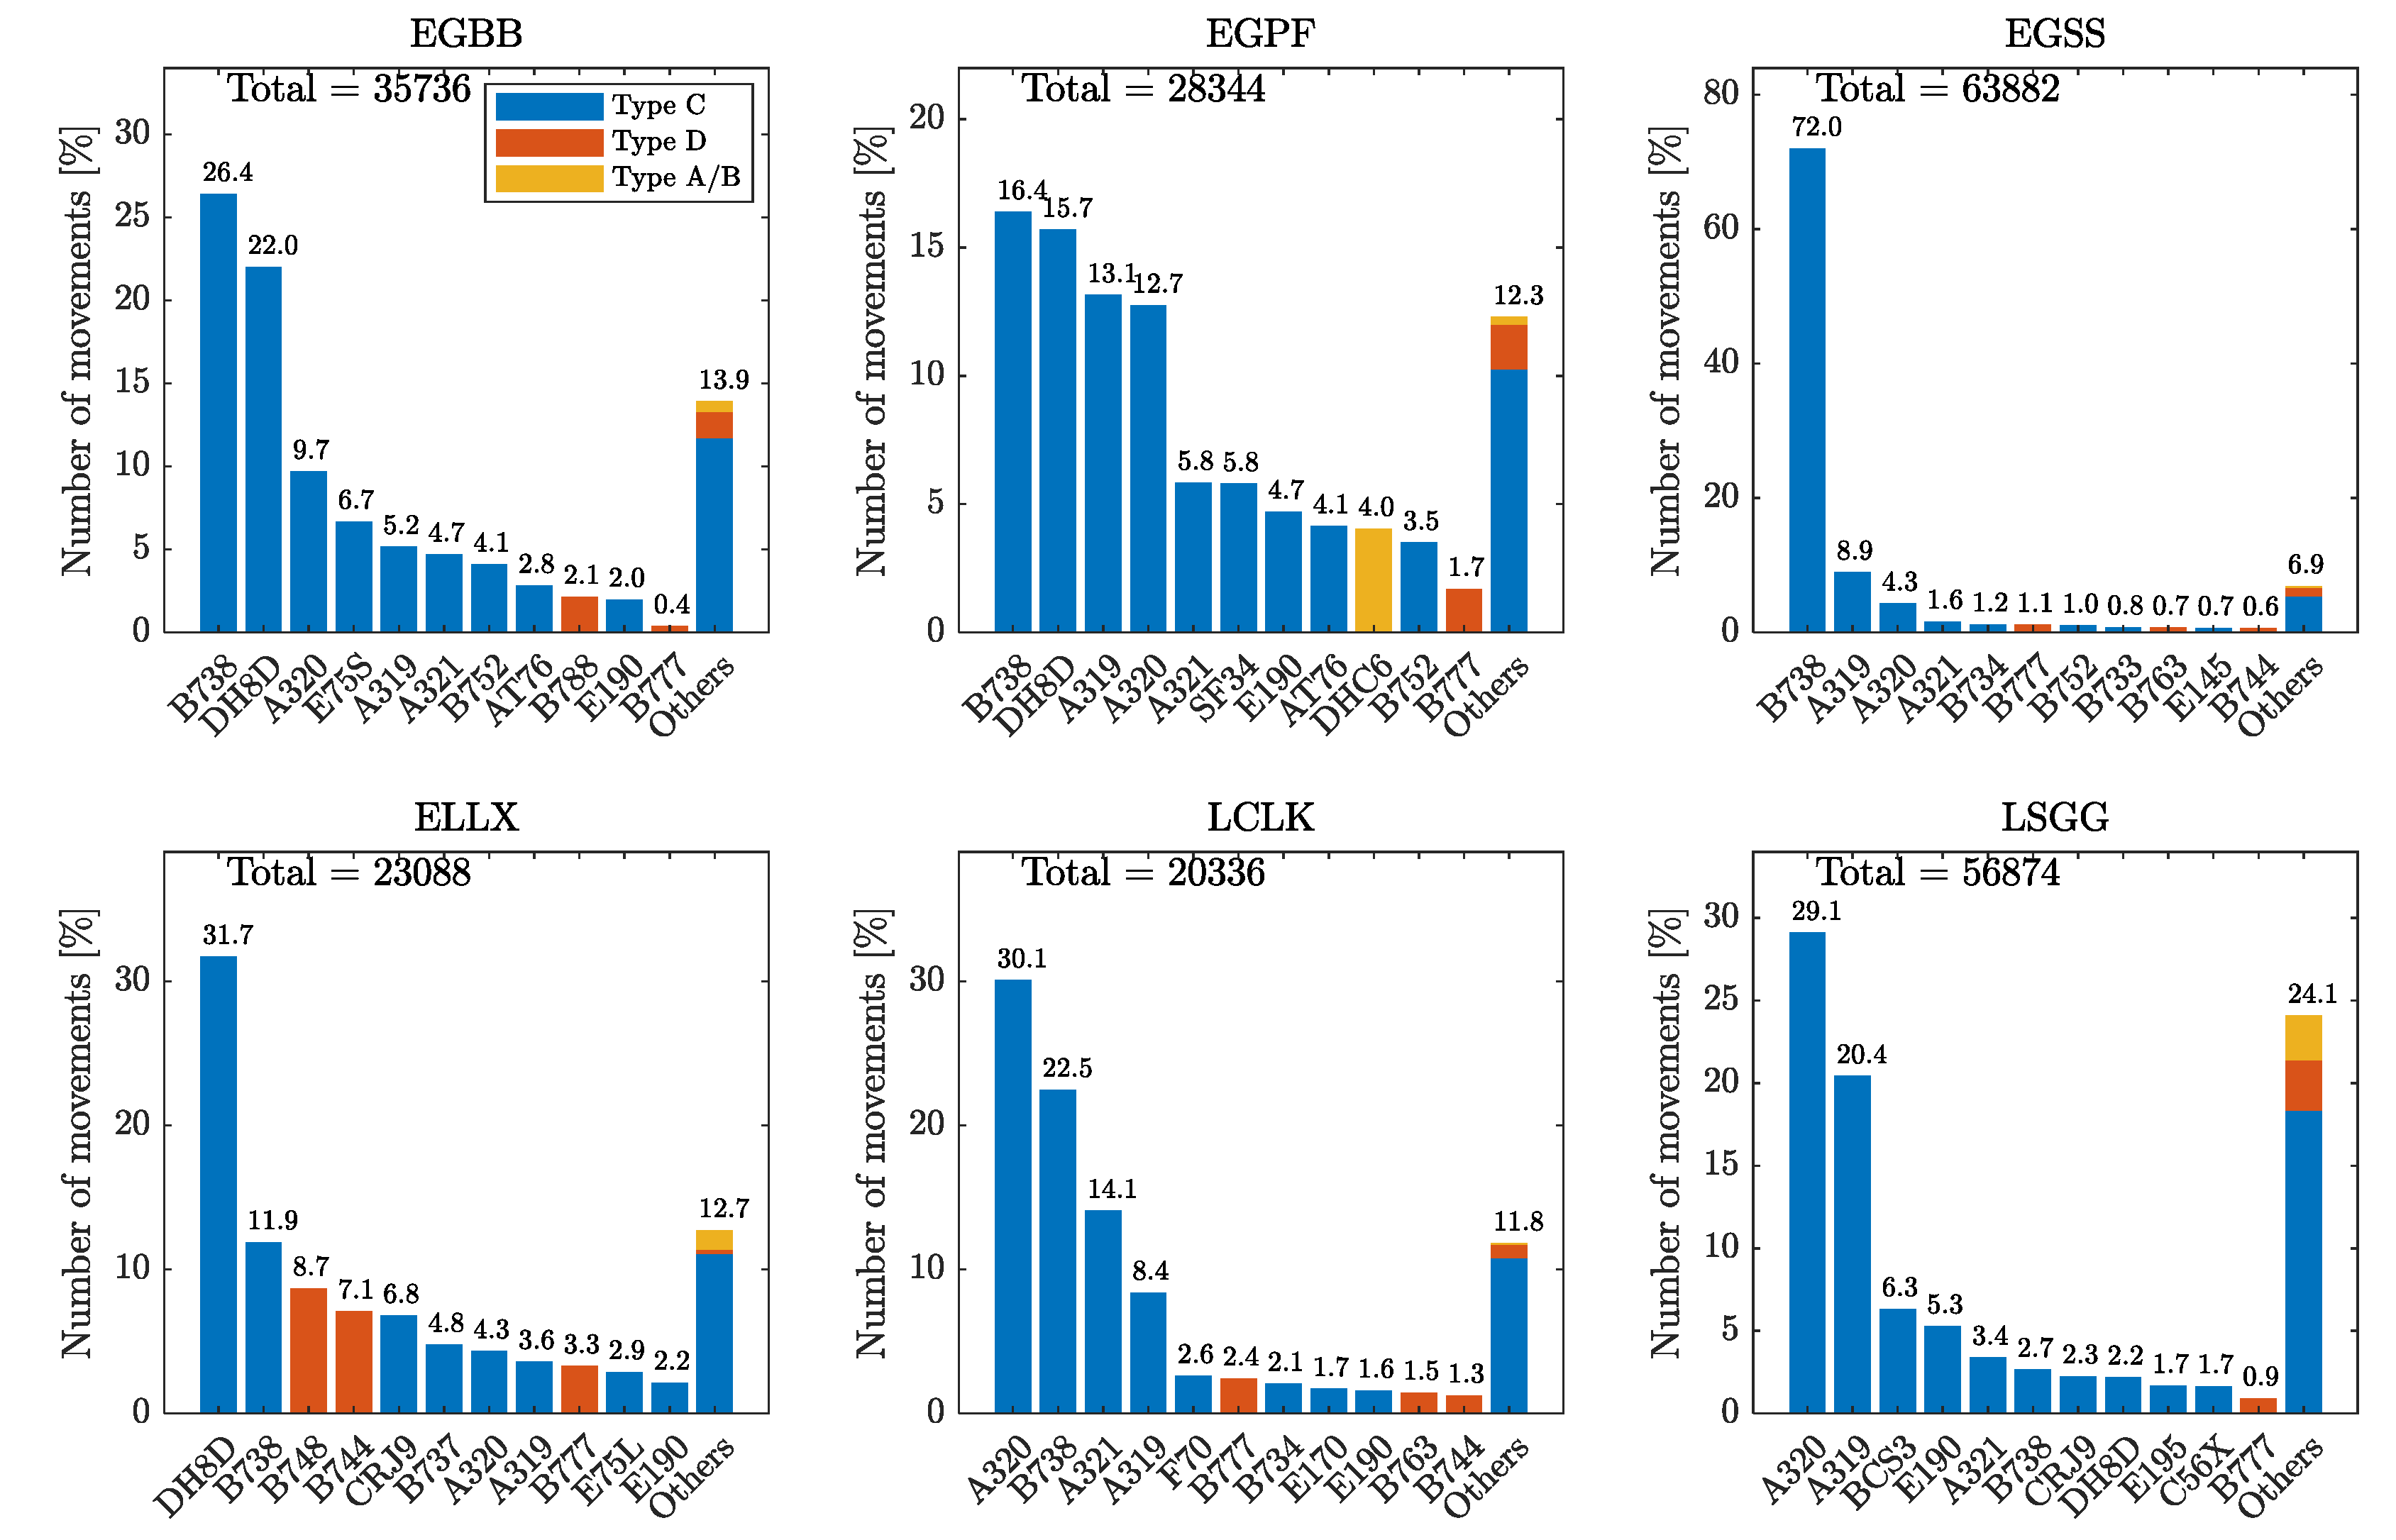
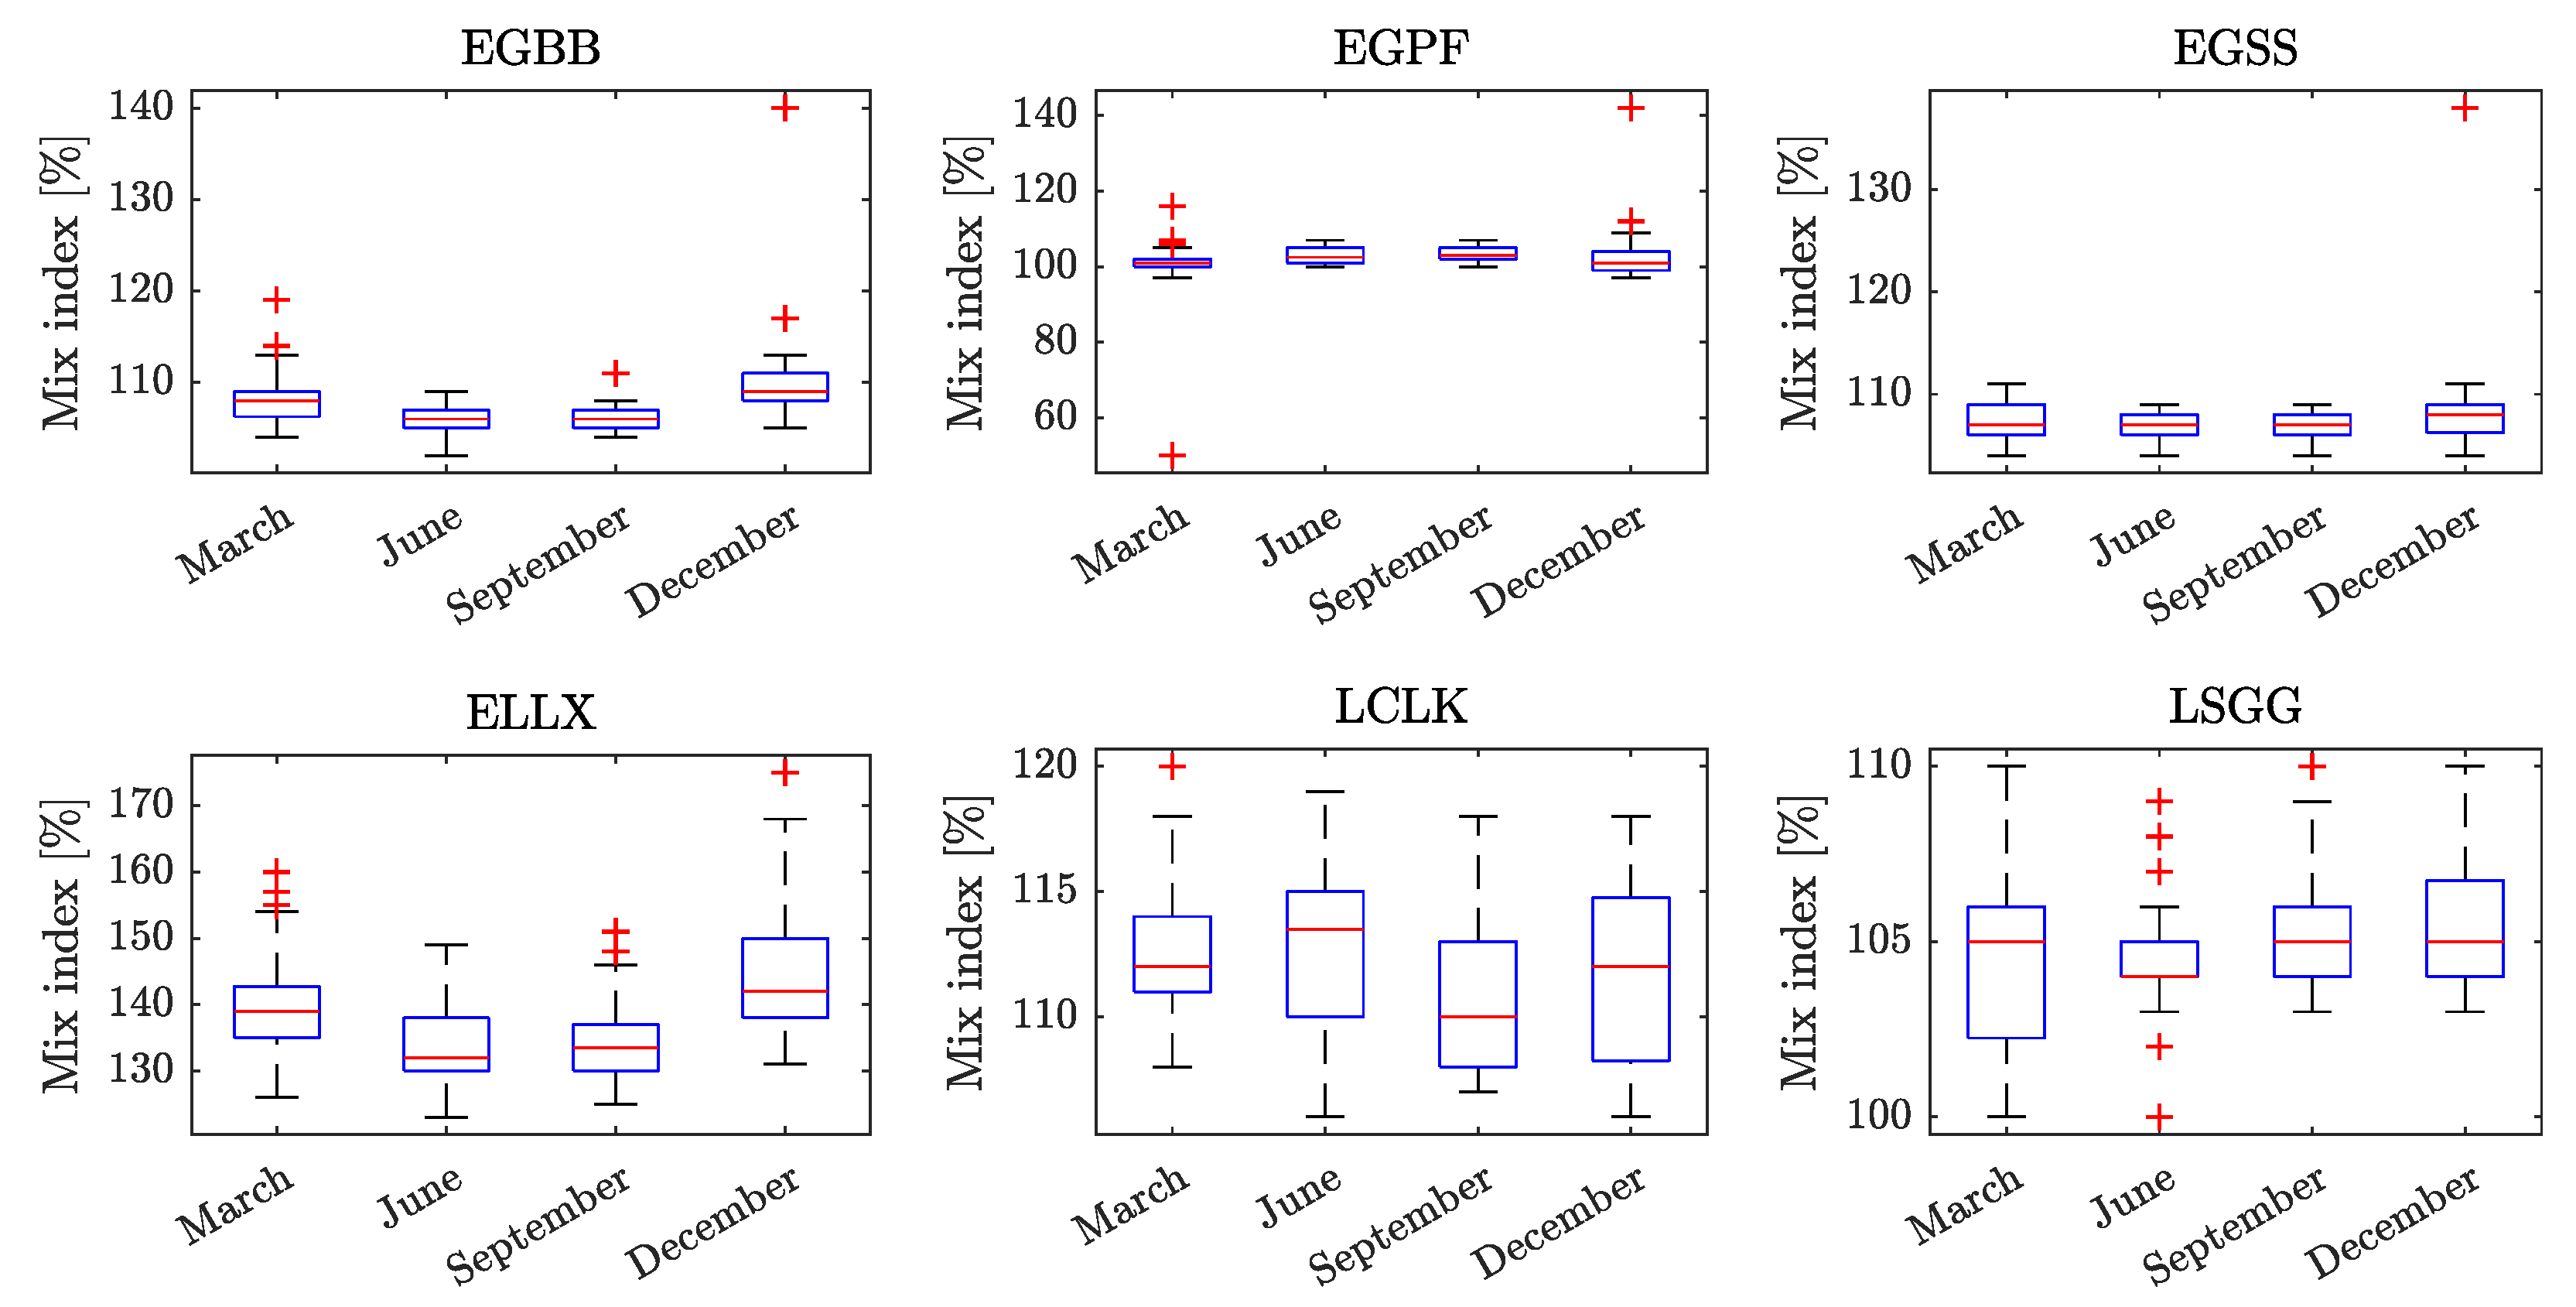
A preliminary analysis has shown that the number of single-runway airports operating a relevant number of medium- and long-range aircraft is limited. This was set as a criterion since we aim at studying scenarios as diversely as possible. With this criterion in mind, six airports were eligible for further analysis: Birmingham Airport (EGBB), Glasgow Airport (EGPF), London Stansted Airport (EGSS), Luxembourg Airport (ELLX), Larnaca Airport (LCLK) and Geneva Airport (LSGG). Figure 5 presents the percentage number of flight movements with respect to the total number of movements for the most representative aircraft types operating in the selected airports. Only relevant aircraft types, described here according to their respective ICAO codes, with a relative number of movements above or equal to 0.4%, are individually presented. Moreover, the aircraft are categorized according to the wake turbulence classification of the Federal Aviation Administration (FAA) [45] as type A and B (small), type C (large), and type D (heavy), where type C and type D aircraft represent medium- and long-range aircraft, respectively.
It is possible to observe in Figure 5 that the B737-family and the A320-family aircraft are the most representative medium-range turbofan aircraft of the type C operating in the selected airports. One exception is the EGGS Airport, where the B738 aircraft dominates the number of aircraft movements. Moreover, it is important to highlight that the DH8D, a turboprop aircraft, has a prominent contribution to the number of movements in at least three of the six airports analyzed (see EGBB, EGPF and ELLX in Figure 5). Nevertheless, this type C aircraft could not be considered for this study, as there is no noise emission model available for this aircraft in the software sonAIR. Moreover, modeling the performance of this type of propulsion system is out of the scope of the present work.
Regarding long-range aircraft, it is possible to observe in Figure 5 that the B747-family and the B777-family aircraft are the most representative type D aircraft operating in the analyzed airports. The first appears as a relevant aircraft type in three of the six airports considered while the second in all of the six airports. Based on the results presented in Figure 5 and on the availability of noise emission models in the software sonAIR, two turbofan-powered aircraft were selected to compose the aircraft fleet used to model the air traffic scenarios investigated in this study: the Airbus A320, representative of medium-haul flights, and the Boeing B77W, representative of long-haul flights. The sonAIR emission models used for the noise simulations of each aircraft are presented in Table 2.

3.4. Air Traffic Scenarios and Noise Assessment

For the purpose of defining realistic air traffic scenarios in terms of aircraft fleet mix and number of (hourly) arrival flights, the air traffic in the six previously selected airports is analyzed using the so6 database in a similar manner as in Section 3.3. The assessment is based on the FAA method for runway capacity estimation [46].
The FAA method is the result of extensive research conducted to determine the capacity of airports with different runway configurations. It accounts for multiple relevant factors, such as runway layout, occupancy time for arriving and departing aircraft, size and mix of aircraft, minimum separation distance and weather conditions, to name a few. This method is based on a lookup table (see Table 3), which can be used to determine the hourly runway capacity for flights under instrument flight rules (IFR) or visual flight rules (VFR) through the mix index MI, which is given by
MI = C + 3 D ,
where C and D are the percentage of type C and type D aircraft, respectively, according to the wake turbulence classification of the FAA [45]. As a remark, small aircraft of the types A and B are indirectly taken into account in the maximum capacity values given in Table 3. Therefore, the MI is simply an indication of the level of operations on the runway by large and heavy aircraft.
Figure 6 presents the results of the statistical analysis of daily MI values obtained for the selected airports, where it can be observed that seasonality does not seem to play an important role on the aircraft mix index. In fact, only the ELLX Airport presents a relevant dispersion around the median monthly MI values, while for the remaining airports, the median value of each month would be a representative indicator for the MI. By generalizing this assumption, one can draw the conclusion that the ELLX Airport, with an averaged MI value of ≈139%, has a maximal hourly capacity of 50 flight operations under IFR, according to the values provided by the FAA method (see Table 3). All of the remaining five airports analyzed fall into the 81% MI 120% category, thus allowing a maximum of 53 number of operations under IFR per hour during the whole year. Table 4 summarizes the results presented in Figure 6 in terms of monthly averaged values, including some additional information: the percentage number of arrivals and of type C and type D aircraft movements with respect to the total number of operations.
Based on the conclusions drawn from the results presented in Figure 6 and on the summary provided by Table 4, three hypothetical air traffic scenarios comprising different MI are defined. All scenarios are based on the following assumptions:
  • The airport is operating on its full capacity during the assessed hour, and
  • only flight operations under IFR are conducted.
Thus, the hourly capacity under IFR from Table 3 is adopted as the maximum number of operations possible during one hour, N op , max , depending on the MI considered. The number of landing operations N op is then computed for each air traffic scenario as
N op , j = P arrivals , j · N op , max ,
where P arrivals is the percentage number of arrivals. From Table 3, it is possible to observe that P arrivals is roughly 50% for most cases; however, this is an estimation based on a daily averaged number of flight operations. In order to comprehend a wide range of possible real-life air traffic scenarios occurring during a time period of one hour, P arrivals is defined as a vector containing j = 1 , 2 , . . . , M different P arrivals values ranging from 50% to 100%, in 1% steps. With this approach, the uncertainty brought by assuming a percentage number of arrival flights during a period of one hour is addressed.
After defining the N op , it is possible to prescribe the number of operations per aircraft type by considering a percentage number P C of type C aircraft and P D of type D aircraft with respect to N op , as
N op , type C , j = P C · N op , j ,
and
N op , type D , j = P D · N op , j .
Finally, N op , type C and N op , type D are randomly assigned to the possible precalculated flight trajectories for each case considered in our study, i.e., four trajectories for the vertical holding stack or 10 trajectories for the holding point merge (see Section 3.2). For each j th possible N op , type C , j and N op , type D , j , k = 1 , 2 , . . . , K random ensembles of flight trajectories are considered. The number of random ensembles used per j th iteration is defined as K = 250 in order to ensure that a homogeneous distribution of flight tracks is statistically achieved. The use of such a stochastic approach is crucial so that any local effects caused by an uneven distribution of assigned flight operations over the possible flight trajectories are minimized. Moreover, as the number of operating aircraft on a given flight trajectory must be an integer number, the results from Equations (10) and (11) are rounded to the nearest integer number. Nevertheless, it was verified that this approach always satisfies a N op , type C + N op , type D N op condition.
The noise assessment is based on the L A , eq and L A , max , avg indicators previously defined by Equations (6) and (7), respectively. In order to statistically address the K number of ensembles per j th percentage number of arrival flights, the L ¯ A , eq , 1 h and L ¯ A , max , avg defined by Equations (12) and (13), respectively, are used for the noise assessment of the proposed air traffic scenarios. Therefore, L ¯ A , eq , 1 h and L ¯ A , max , avg express the averaged L A , eq and L A , max , avg over the K number of ensembles and the M possible percentage number of arrival flights, N op , j .
L ¯ A , eq , 1 h = 10 log 10 1 M 1 K j = 1 M k = 1 K 10 L A , eq , 1 h , j , k 10
L ¯ A , max , avg = 10 log 10 1 M 1 K j = 1 M k = 1 K 10 L A , max , avg , j , k 10
The three air traffic scenarios considered are the following:
  • Scenario A—It is hypothesized that solely type C aircraft operate during a one-hour period. Thus, a scenario composed only of medium-range aircraft, i.e., the Airbus A320, is defined by considering P C = 100% and P D = 0%. This leads to MI = 100% and N op , max = 53 ;
  • Scenario B—a MI = 110% is considered, which is a similar scenario to the one experienced in the EGBB, EGPF, EGSS, LCLK, and LSGG airports (see Table 4). Thus, this scenario is defined by considering P C = 95%, P D = 5% and N op , max = 53 ; and
  • Scenario C—A MI = 140% is considered, which corresponds to a similar scenario as the one experienced in the ELLX Airport (see Table 4). In this case, P C = 80%, P D = 20% and N op , max = 50 .

4. Results

Within this section, the results for the evaluated scenarios are presented and discussed. Two different approaches are investigated that differ regarding the noise computations, i.e., the use of a full profile of N1 values along the flight track and a reduced approach considering mean N1 values per flight phase. Hereafter, the results obtained for all scenarios, computed with the full approach, are presented first in Section 4.1. The results obtained with the reduced approach, exemplary applied to scenario C, are presented in Section 4.2.

4.1. Scenario Assessment

Figure 7 presents the results obtained for Scenarios A–C for the vertical holding stack procedure and the linear hold point merge procedure in terms of L ¯ A , eq , 1 h (see Equation (12)). The results are presented in the range between 50 dBA and 80 dBA in 5 dBA intervals. Environmental noise regulations worldwide are defined based in different metrics and critical noise levels, differing from country to country. As a reference, the federal German government established noise protection zones around civil airports with an air traffic exceeding 25,000 movements per year for residential areas encompassed by L A , eq , 16 hr = 60 dBA and L A , eq , 16 hr = 65 dBA noise contours [47]. The L A , eq , 16 hr is computed for the daytime (06 AM–10 PM) and the six months of the forecast year with the largest number of flights. In the UK, the aviation noise policy defines the lowest observed adverse effect level (LOAEL) of L A , eq , 16 hr = 51 dBA as measured for the average summer day from 07 AM to 23 PM [48]. Although the aforementioned noise directives are not based on the L A , eq , 1 hr , their use as reference values is valid if we assume that the scenarios assessed in this work occur for a 1-hour period of the daytime, as they set critical noise levels based on a similar noise metric, which only differs in terms of the time period on which the A-weighted sound pressure level is averaged.
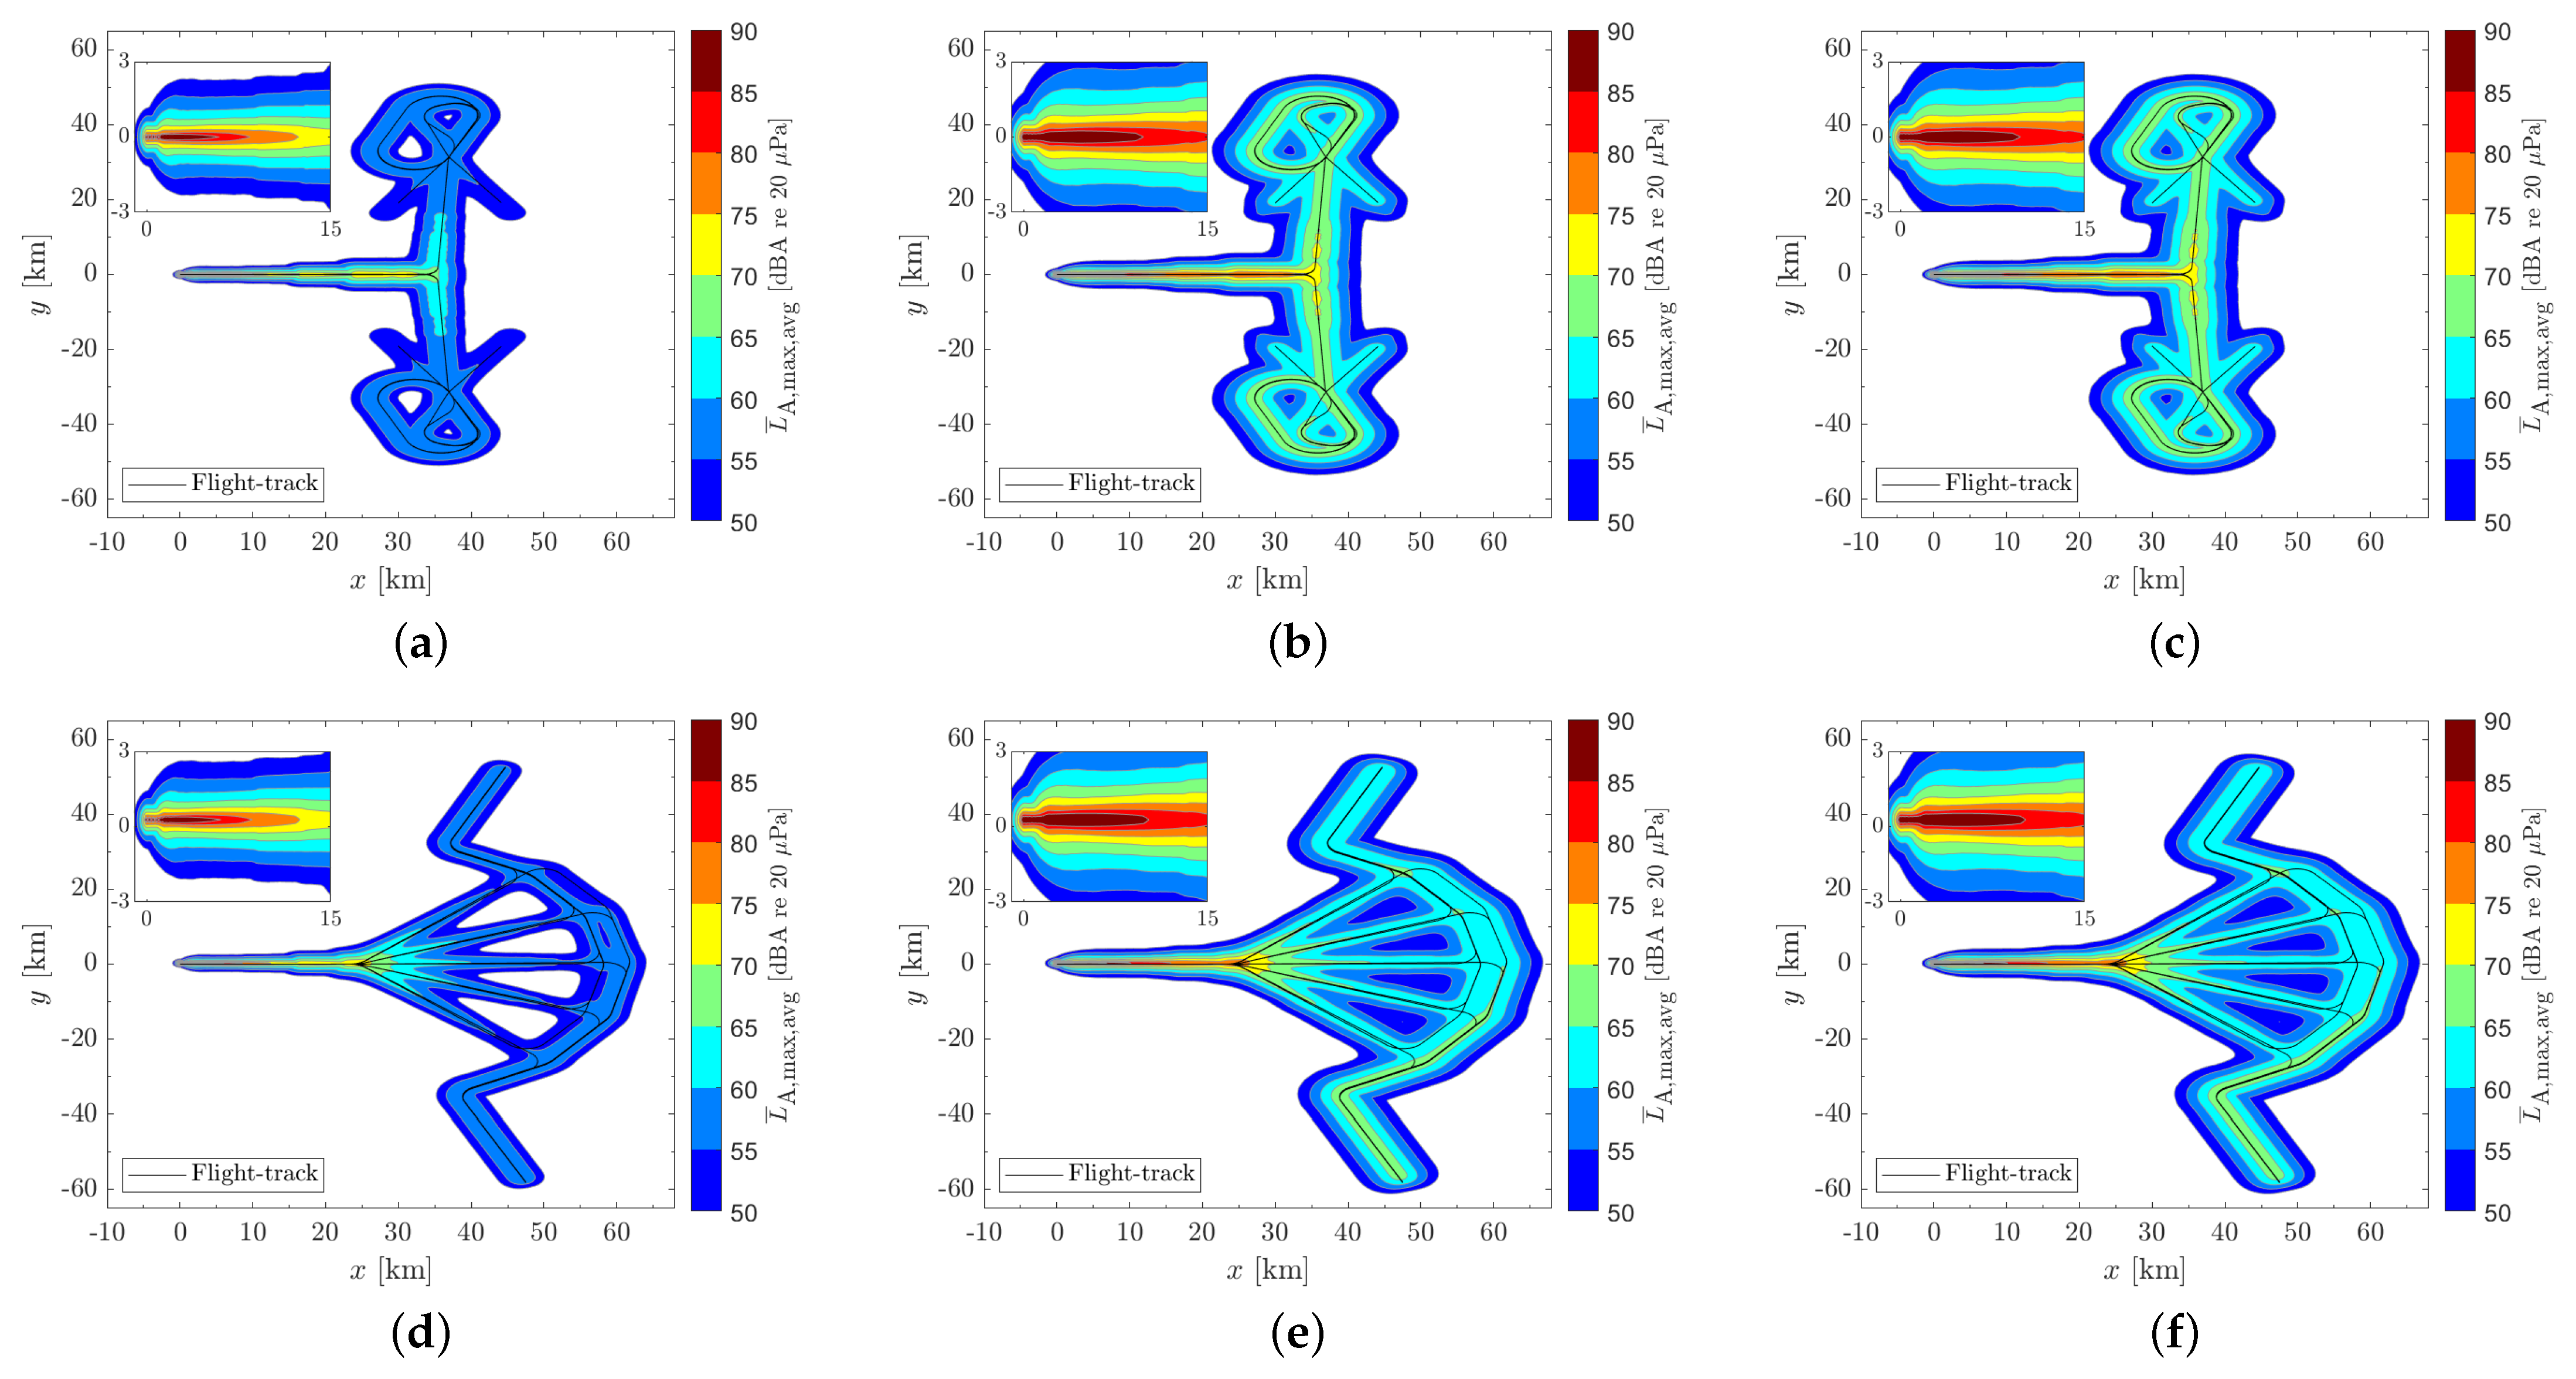
By inspecting the top row of Figure 7, one can verify similar shapes of the ground noise isocontour area for all scenarios. From Scenario A (Figure 7a) to Scenario C (Figure 7c), the share of heavy aircraft (here: B77W) is increased. Accordingly, the amount of areas with large equivalent sound pressure levels is increased. Moreover, it can be found that the largest equivalent sound pressure levels occur below the flight trajectories shortly before the last turn that aligns the aircraft with the runway center line and in close proximity of the runway. However, when the share of heavy aircraft is increased, an increased sound pressure level also below the holding stacks can be seen. On the other side, Figure 7d–f show the ground noise for the linear hold point merge procedure. By comparing the contours with the ones of the vertical holding stack procedure, it is possible to observe that the use of more flight tracks distributes the noise over a broader area instead of concentrating it in particular locations, such as beneath the holding stacks. Thus, the linear hold point merge procedure promotes noise reductions by distributing the arrival sequences in space. Therefore, the linear hold point merge concept would be an interesting choice for an airport which has an homogeneously distributed population around it and, thus, concentrating the noise in specific locations with no residential areas is not possible. Even for the noisiest case, i.e., Scenario C, equivalent sound pressure levels larger than 60 dBA only occur within ≈ 30 km from the runway threshold. In general, the results seem plausible from the viewpoint that increasing the share of heavy aircraft affects the ground noise in the direction of higher levels. Moreover, as the flight time for the holding stack procedure is larger, the expected higher sound pressure levels on the ground can be verified as well.
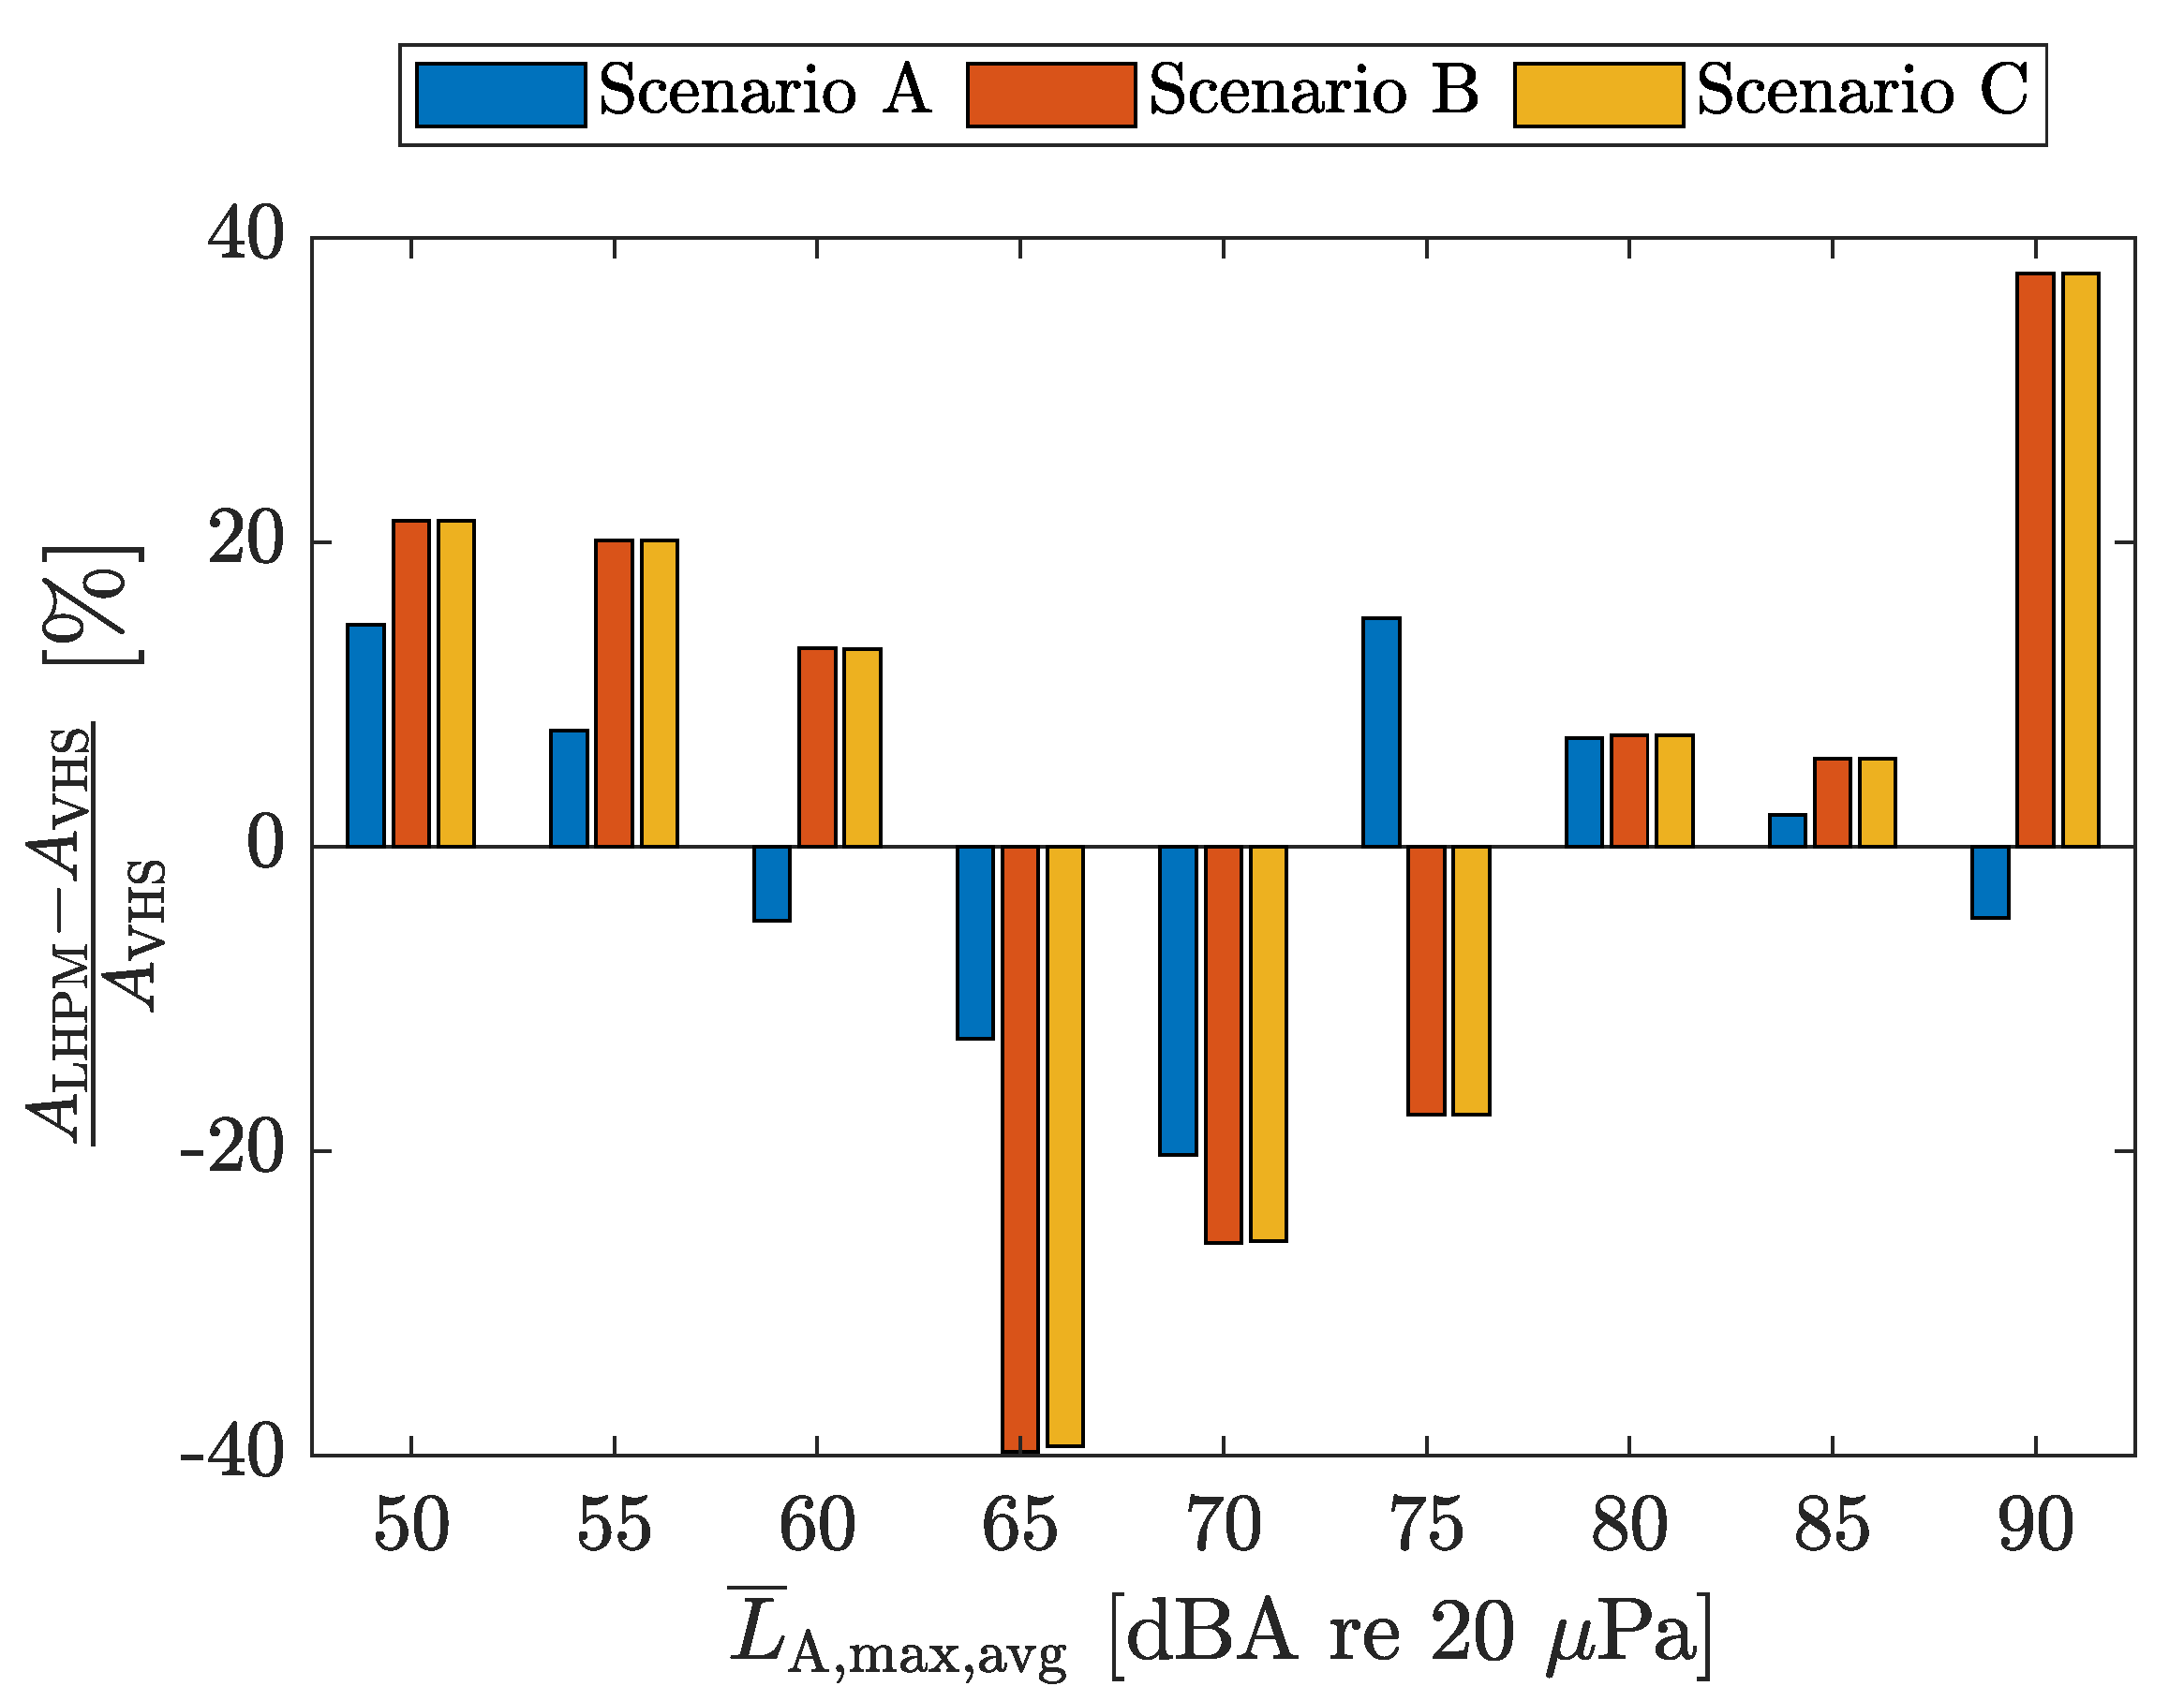
The differences in terms of noise can be verified as well by inspecting the geometric area of the noise contours for each investigated equivalent sound pressure level category. Figure 8 shows the percentage difference of the isocontour areas for the linear hold point merge procedure, A LHPM , and the vertical holding stack procedure, A VHS , relative to the values of the vertical holding stack for all investigated scenarios. Thus, negative values are read as reductions of the isocontour area due to the use of the linear hold point merge procedure. It should be noted here that all calculated contour areas incorporate the areas of the isocontours with higher noise levels as well. It can be seen that for all cases, except from Scenario C and the 80 dBA isocontour area, the employment of the linear hold point merge procedure results in lower noise contour areas. Thereby, for the 50 dBA isocontour area, the area reductions are in the range of ≈30–40%, for the 55 dBA , 60 dBA , 65 dBA and 70 dBA isocontour area, and the affected area is reduced by ≈80–90%. The isocontour areas for 75 dBA and 80 dBA are nearly unaffected by the choice of the holding procedure. This is due to the fact that these high sound pressure levels only occur in the close proximity of the runway, where the investigated holding procedures do not differ, thus no variation of the ground noise is expected.
For the second investigated metric, i.e., the L ¯ A , max , avg (see Equation (13)), the isocontour areas are shown in Figure 9. Again, the top row shows the results for the vertical holding stack procedure and the results of the linear point merge procedure are shown in the bottom row. As expected for the investigated metric, the reported values are higher than for the L ¯ A , eq , 1 h , shown in Figure 7. Apart from the higher values, a general increase in the reported noise levels can be verified from left to right, as the share of heavy aircraft is zero for Scenario A (Figure 9a,d), average for Scenario B (Figure 9b,e) and largest for Scenario C (Figure 9c,f). Nevertheless, the differences between Scenario B and Scenario C seem to be minimal for both cases. This is possibly due to the fact the that the number of operations in Scenario C is slightly smaller than in Scenario B, thus compensating for the increase in heavy aircraft. Therefore, the L ¯ A , max , avg does not seem to be highly influenced by the increase in heavy aircraft. This can also be verified in Figure 10, where no relative differences between the isocontour areas of the Scenario B and Scenario C are observed. Moreover, the effect of the different flight altitudes in the linear hold point merge procedure can be seen when inspecting Figure 9e,f. Here, the L ¯ A , max , avg are higher for the lower level sequencing leg, as this leg is flown at a 1000 ft lower altitude than aircraft in the higher level sequencing leg (see Figure A1 in the Appendix A).
A rather different picture for the L ¯ A , max , avg , compared to the L ¯ A , eq , 1 h , can be observed for the relative isocontour area reductions shown in Figure 10. The results show that, contradictory to the results for the L ¯ A , eq , 1 h , the L ¯ A , max , avg isocontur area of the linear hold point merge procedure are, in general, larger than the ones of the vertical holding stack for the noise levels below and including 60 dBA and for levels equal to and above 80 dBA . For the levels between 65 dBA and 75 dBA , the isocontour areas of the linear hold point merge are reduced in comparison to the vertical holding stack. However, this generally appears to be plausible as well. The linear hold point merge procedure results in a reduced affected area with respect to the equivalent sound pressure level L ¯ A , eq , 1 h , and thus, the noise footprints are more condensed and, accordingly, the maximum noise levels are increased. Therefore, the noise characteristics of the two holding procedures may differ depending on the noise metric and noise levels. This has to be carefully addressed when investigating the implementation of one or the other holding procedure in practice.

4.2. Influence of the N1 Values

As discussed in Section 2.3, one characteristic of the simulation framework used by the software sonAIR is that the engine noise emissions are modeled using the N1 as the main parameter describing the engine settings. The use of N1 to model the engine noise instead of thrust, as commonly used by BPM [49,50], is justified by the fact that the N1 can describe the noise generated by the fan and the jet flow, the two dominant noise sources of a turbofan engine, as a single parameter [16,37].
In the absence of flight data recorder (FDR) data, the N1 can be estimated acoustically [51,52], using a flight-phase-specific modeling approach [53,54] or based on jet engine simulations [19,55]. Nevertheless, often, only radar data or automatic dependent surveillance–broadcast (ADS-B) data, which do not provide any information regarding the engine settings, are available. In this case, mean N1 values depending on the flight phase are often used [56,57]. This simplification implies relying on a single N1 value to model the engine noise emissions for the entire flight trajectory during a specific flight phase. To the best of the authors’ knowledge, a dedicated study on the effect of such simplification on the aircraft noise predictions provided by sonAIR for large air traffic scenarios is not, to this date, available in the literature.
In this section, we aim at verifying the differences brought by the use of mean N1 values along predetermined flight phases and, consequently, the plausibility of such simplification. As no real N1 data are available, it is assumed that the predictions provided by the multi-level simulation framework introduced in this work (see Section 2) provide realistic N1 values which are, therefore, adopted as the reference N1 values. The investigation is conducted based on the scenario definitions described in Section 3 and considering the Scenario C (see Section 3.4), which is the most diverse scenario defined in this work in terms of aircraft fleet mix.
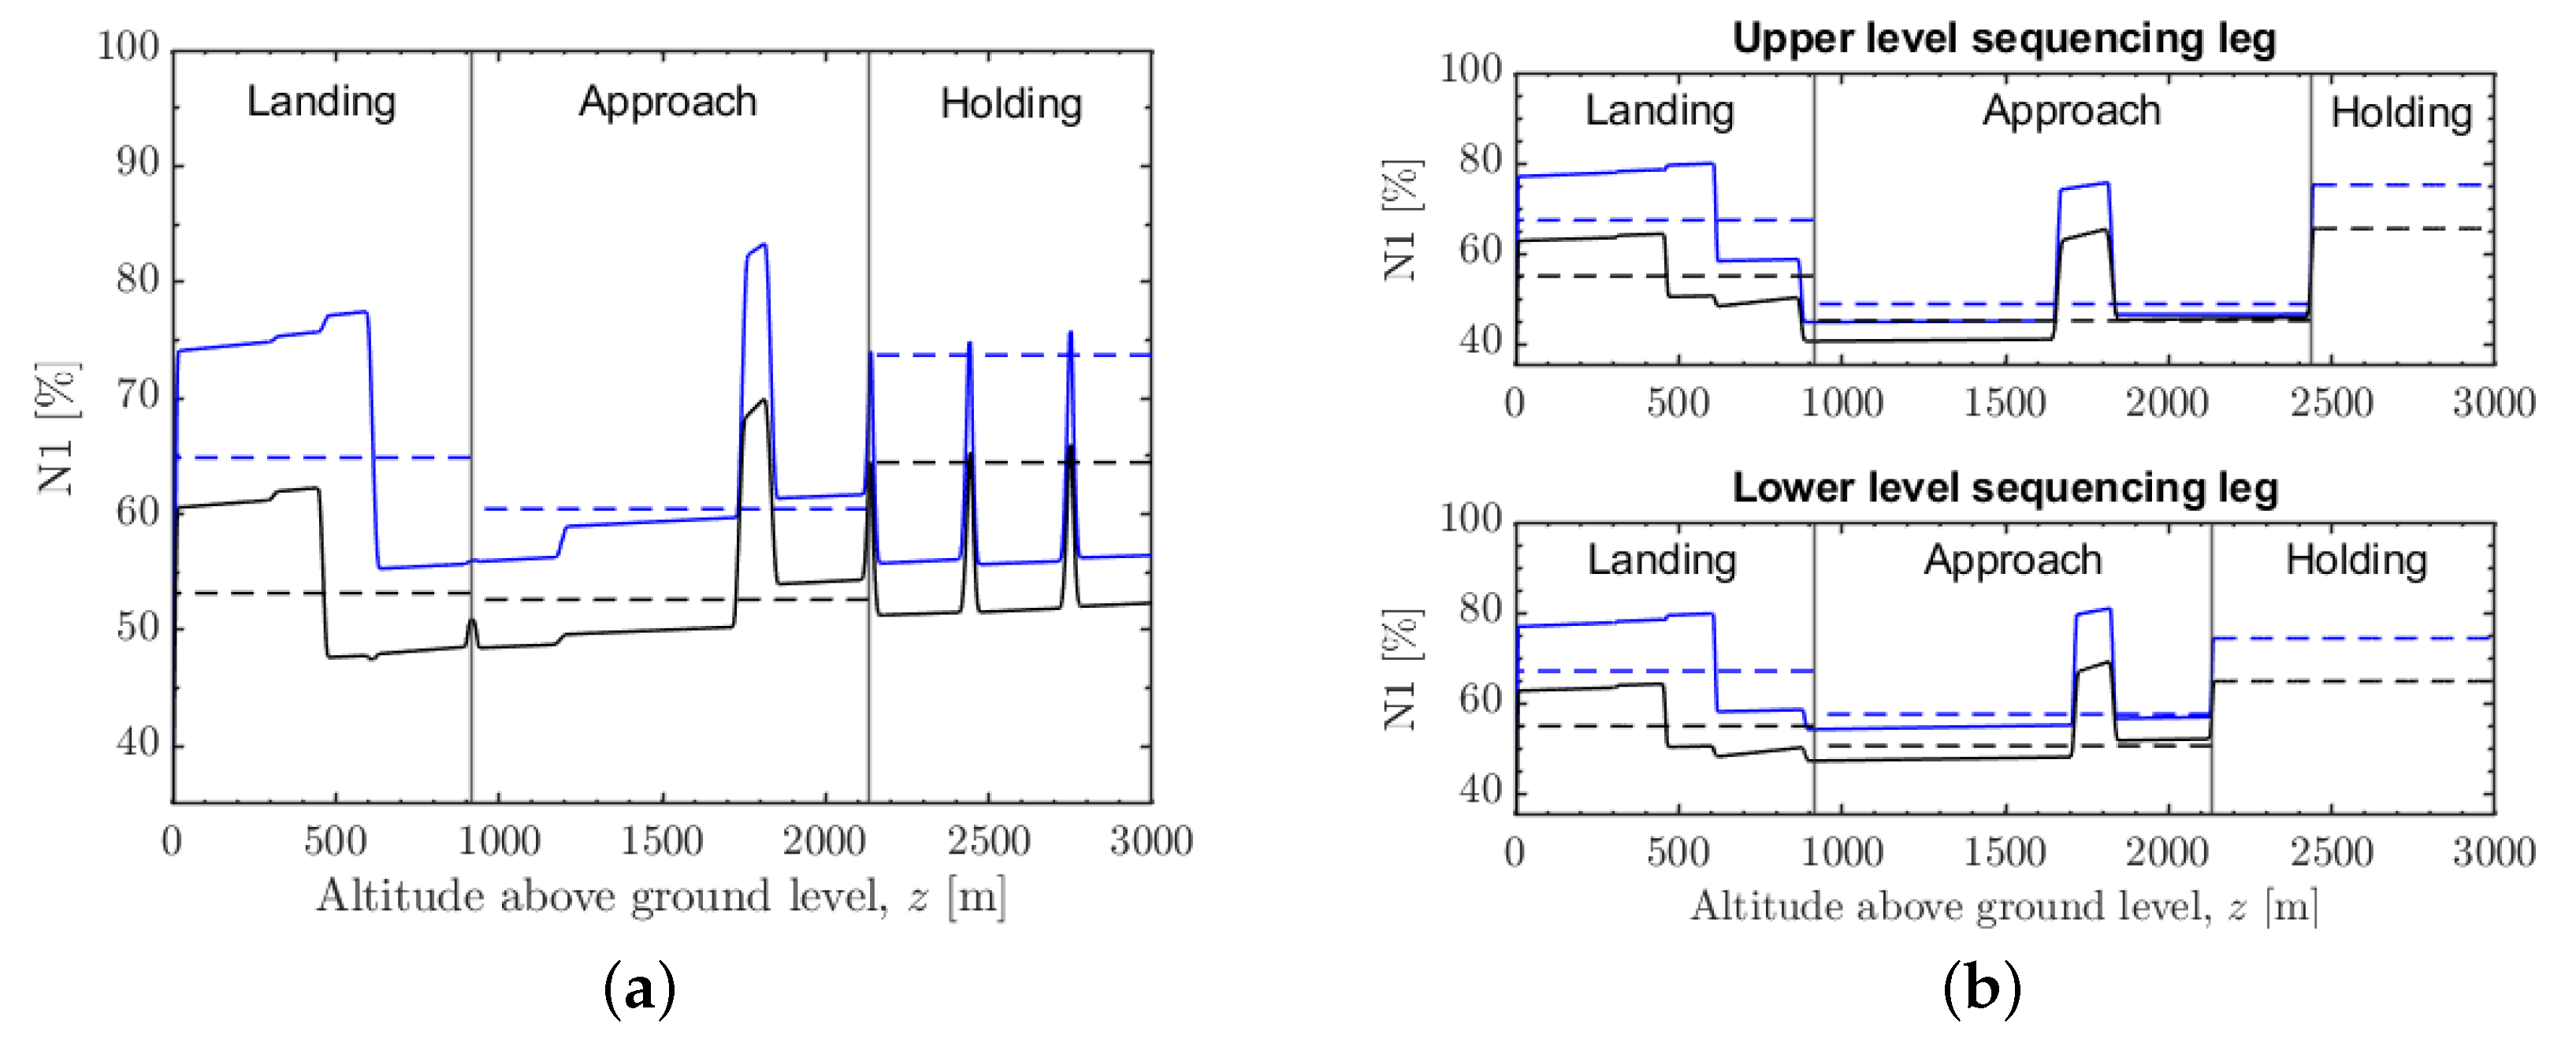
Figure 11 presents the calculated N1 profiles (mean N1 profiles of all flight trajectories considered in each holding procedure case) for each aircraft type and holding procedure, and their corresponding mean N1 values, N 1 ¯ , depending on the flight phase (landing, approach and holding). Please note that the N1 values are presented in Figure 11 as a function of only one dimension (i.e., the altitude above ground level) and, therefore, the mean N1 values depending on the flight phase do not directly correspond to the mean value of the N1 profiles along the altitude but rather to the mean N1 value computed considering the entire three-dimensional flight trajectories (see Figure 3b and Figure 4b). Moreover, it should be noted that the dashed lines in Figure 11b for the holding flight phase of the linear hold point merge are only for illustration purposes. Since the entire holding flight phase is flown on the same altitude of 7000 ft and 8000 ft for the lower and upper sequencing legs, respectively, no altitude variation and thus no variation in N1 can be shown. The mean N1 values per aircraft type, holding procedure and flight phase are provided in Table 5.
As no real N1 values are available to validate the N1 estimation methodology used in this work, a plausibility check is conducted by means of comparison with the mean N1 values provided by Zellmann [37]. The provided mean N1 values are calculated for the final approach flight phase, when the aircraft is aligned with the runway and stabilized for landing. According to Schwab and Zellmann [53] and Blinstrub [58], the stabilization usually occurs at an altitude of 1000 ft AGL (≈305 m AGL), when the landing gears and high-lift devices are fully deployed and the airspeed is kept constant by increasing the thrust accordingly. Therefore, mean N1 values and their corresponding standard deviation are computed considering all the flight trajectories calculated within the context of this contribution for an AGL of 15 ft z 1000 ft . For an Airbus A320 equipped with V2500 turbofan engines, the mean and standard deviation N1 values provided by Zellmann [37] for the final approach phase are ≈(48 ± 5)%. The mean and standard deviation N1 values of the flight trajectories calculated for the vertical holding stack are ≈(54 ± 1)%, while for the linear hold point merge they are ≈(56 ± 8)%. This corresponds to an absolute difference of ≈8% if only the mean values are considered, which is considered to be an acceptable agreement. Since the N1 values provided in the literature were obtained from a dataset of real-life air traffic data, differences due to factors such as weather conditions and/or operational requirements are expected. Unfortunately, to the best of the authors’ knowledge, no mean N1 values for the Boeing B77W are available in the literature for comparison.
Figure 12 shows the simulated noise contours as well as footprint differences in terms of Δ L ¯ A , eq , 1 h and Δ L ¯ A , max , avg , which are calculated as
Δ L ¯ A , eq , 1 h = L ¯ A , eq , 1 h , N 1 ¯ L ¯ A , eq , 1 h , N 1 ,
and
Δ L ¯ A , max , avg = L ¯ A , max , avg , N 1 ¯ L ¯ A , max , avg , N 1 ,
where L ¯ A , eq , 1 h , N 1 ¯ and L ¯ A , max , avg , N 1 ¯ are computed using the mean N1 values as a function of the flight phase and L ¯ A , eq , 1 h , N 1 and L ¯ A , max , avg , N 1 using the reference N1 profiles calculated along the entire flight trajectories. Thus positive delta values indicate that the results obtained using the mean N1 values are higher than the results obtained using the calculated N1 profiles and vice versa. In Figure 12, the absolute noise contours are presented in the range between 50 dBA and 80 dBA in 10 dBA intervals for all noise metrics, and differences between noise levels below 50 dBA are omitted.
In general, it is possible to observe in Figure 12 that the relevant differences between the simulations using the different N1 values are mostly on areas close to the runway up to x 17 km, when the aircraft are in the landing flight phase and at an AGL 620 m. Therefore, for high altitudes, the influence of the N1 seems to be not prominent, and the use of a mean N1 value would suffice to obtain reliable predictions. For 1.5   km x 17   km , the simulations conducted using the reference N1 profiles provide higher noise levels than the ones using the mean N1 values. This corresponds to a flight AGL 620   m , for which, according to Figure 11, the calculated N1 values are relatively higher than the mean N1 values. For this range, the maximum Δ L ¯ A , eq , 1 h and Δ L ¯ A , max , avg differences observed were ≈−1.7 dB and ≈−2.3 dB, respectively. For x < 1.5 km, this is reversed, as the mean N1 values are higher than the values calculated for the reference N1 profiles, which account for the reduction in the engine power at a close distance from the runway. For this range, the maximum Δ L ¯ A , eq , 1 h and Δ L ¯ A , max , avg differences observed were ≈ 1.7 dB and ≈ 1.9 dB, respectively. As, during the final approach, the increase in the N1 is a requirement to stabilize the aircraft at constant airspeeds, such differences are expected, as the use of mean N1 values instead of considering a full N1 profile along the flight trajectory will introduce relevant N1 differences.
Additionally, the noise contours presented in Figure 12 for the simulation with constant N1 values are mostly superimposed by the noise contours obtained using the reference N1 profiles. In fact, a quantitative analysis showed that relevant isocontour area differences occurs only for L ¯ A , max , avg = 80 dBA isocontours. In this case, the predictions obtained using the mean N1 approach provides isocontour areas, which are 24% and 33% larger than the ones obtained using the full N1 profile for the VHS and the LHPM procedures, respectively. This supports the use of mean N1 values as a function of the flight phase for the simulation of noise contours using sonAIR when the full N1 profiles are not available.

5. Conclusions

Aircraft noise is a large burden for public health, and its reduction is a core demand of the European vision ”Flightpath 2050”. The reduction in ground noise in the vicinity of airports can be reached by means of reductions at the source, i.e., the employment of low-noise technology aboard the aircraft, and by the use of appropriate flight procedures (noise abatement procedures) during departure and approach. In order to develop and assess future approach procedures or novel aircraft technologies with respect to ground noise, a computational approach is indispensable.
The computation of aircraft noise for situations not accessible by existing data (e.g., flight data recorder), or including aircraft concepts that not have yet entered service, is demanding since multiple input data are required and thus needs to be accurately modeled. The study presented here shows the implementation of a multi-level computation chain consisting of an aircraft performance computation, a computation of the jet engine performance and a subsequent computation of the environmental noise. Therein, the downstream stages receive their necessary input data from upstream stages, e.g., flight trajectory and engine fan rotational speed are input to the noise assessment. In particular, the fan rotational speed is crucial for the noise computations, as it is used as the main describing parameter for the engine noise emission. However, this parameter often is not accessible unless the entire aircraft and engine performance is computationally covered simultaneously. Addressing these challenges in a combined way is the main contribution of the work presented.
For the application of the simulation chain, an air traffic scenario is designed based on a generic single-runway airport. The scenario is composed of two representative aircraft types, i.e., a medium-range (A320) and a long-range aircraft (B77W). In order to obtain representative results, aircraft movements at six single-runway airports in Europe and the UK are analyzed, and the share of medium- and long-range aircraft is modeled accordingly. The results of the study show that, for the one-hour equivalent A-weighted sound pressure level Δ L ¯ A , eq , 1 h , the environmental noise due to aircraft approaching a generic single-runway airport is reduced when employing a linear hold point merge approach procedure instead of a vertical holding stack procedure. However, for the maximum sound pressure level Δ L ¯ A , max , avg the results are less clear. Generally it can be concluded that, for practical applications, the employed holding procedure depends on a multitude of constraints of which noise is only one. However, the presented simulation chain seems capable of covering the relevant aspects and thus will be applied in the future for the assessment of novel approaches to mitigate aircraft noise.
Additionally, a study is presented that focuses on the influence of the fan rotational speed parameter N1. Even though this parameter is crucial for the noise emission of the aircraft, for practical applications, precise data along the entire flight track are often not available. Instead, flight-phase-dependent mean values are employed. It can be concluded that, for the approach procedures and aircraft types investigated here, the use of flight-phase-dependent mean N1 values only results in minor deviations for most parts of the computational domain. Only in the close proximity of the airport, where the aircraft’s AGL is low and finally adjusting for landing, relevant deviations occur since the approach with mean N1 values underestimates the noise emission of the engines. However, as for the major part of the studied area deviations are low, the approach seems reasonable.
The presented computational chain allows for the noise assessment of future noise mitigation strategies for environmental aircraft noise. In the context of the Cluster of Excellence “Sustainable and Energy Efficient Aviation” (SE 2 A) established at TU Braunschweig, Germany, novel aircraft concepts are investigated that target the reduction in the environmental footprint of the air transport system, including the reduction in noise. These future aircraft incorporate technological features not common, to date, in aircraft design and are investigated for three different aircraft categories, i.e., short-range, medium-range and long-range aircraft. For the short-range aircraft, such novel features are a hybrid laminar flow control in combination with structural weight reductions and an full electric propulsion system [59]. As a promising candidate for long-range aircraft, Blended Wing Bodies are studied, as well featuring novel concepts, such as laminar flow control, active load alleviation and boundary layer ingestion [60].
In order to allow for a thorough noise assessment of such vehicles, a crucial step is the investigation of the noise emission of the technological features on the component level and, based on such investigations, the development of source models that can be incorporated into scientific noise assessment tools, such as sonAIR. This matter has been studied already for some examples on the component level, e.g., boundary layer ingestion noise is studied using both, analytical [61,62] and numerical approaches [63] or the Coanda flap, i.e., a high-lift device is studied regarding noise in [64,65,66] by means of numerical and experimental approaches. For the Coanda flap, even a system noise assessment is shown in [67]. However, due to the lack of a parametric emission noise model, in that study, the Coanda flap is modeled in a simplified manner using models for a conventional Fowler flap. Thus, the development of noise emission models specifically designed for novel aircraft technologies is urgently needed, as it is a crucial prerequisite for a reliable aircraft noise assessment. Moreover, it is expected that the use of reduced approaches, such as mean N1 data along the flight trajectory, might not be valid for future aircraft concepts. Thus, this aspect needs particular attention in future works as well.
To conclude, although, to date, some prerequisites for a holistic assessment addressing the flight performance and environmental noise of novel aircraft concepts are still missing, the multi-level simulation framework presented in this work has the potential to be used for this purpose. In future works, it is expected that adapted BADA coefficients and surrogate flight performance models will enable the calculation of the flight trajectories of novel aircraft concepts. These can then be used in conjunction with the proposed multi-level simulation framework to investigate the environmental noise and gaseous emissions of future aircraft with novel technological features currently not common in aircraft design.

Author Contributions

Conceptualization, G.F.G., B.Y. and J.G.; methodology, G.F.G., B.Y. and J.G.; software, G.F.G., B.Y. and J.G.; formal analysis, G.F.G., B.Y. and J.G.; investigation, G.F.G., B.Y. and J.G.; data curation, G.F.G., B.Y. and J.G.; writing—original draft preparation, G.F.G., B.Y., J.G. and T.P.R.; writing—review and editing, G.F.G., B.Y., T.P.R., J.G., T.F., P.H., S.C.L.; visualization, B.Y. and G.F.G.; supervision, T.P.R., T.F., P.H. and S.C.L.; project administration, P.H. and S.C.L.; funding acquisition, P.H. and S.C.L. All authors have read and agreed to the published version of the manuscript.

Funding

We would like to acknowledge the funding by the Deutsche Forschungsgemeinschaft (DFG, German Research Foundation) under Germany’s Excellence Strategy—EXC 2163/1—Sustainable and Energy Efficient Aviation—Project-ID 390881007. Furthermore, we acknowledge the support of the Open Access Publication Funds of the Technische Universität Braunschweig.

Data Availability Statement

The data presented in this study are available on request from the corresponding author.

Conflicts of Interest

The authors declare no conflict of interest.

Abbreviations

The following abbreviations are used in this manuscript:
ADS-BAutomatic Dependent Surveillance–Broadcast
AGLAltitude Above Ground Level
AMAtmospheric Model
APMAirline Procedure Model
ATCAir Traffic Controllers
ATMAir Traffic Management
BADABase of Aircraft Data
BPMBest-Practice Methods
BPRBypass Ratio
CASCalibrated Airspeed
DMEDistance Measuring Equipment
ECACEuropean Civil Aviation Conference
EGBBBirmingham Airport
EGPFGlasgow Airport
EGSSLondon Stansted Airport
ELXXLuxembourg Airport
FAAFederal Aviation Administration
FDRFlight Data Recorder
GEGeneral Electric Aviation
HPCHigh-Pressure Compressor
IAEInternational Aero Engines
IAFInitial Approach Fixes
ICAOInternational Civil Aviation Organization
IFRInstrumental Flight Rules
LCLKLarnaca Airport
LHPMLinear Hold Point Merge
LSGGGeneva Airport
LOAELLowest Observed Adverse Effect Level
LPCLow-Pressure Compressor
LPTLow-Pressure Turbine
MLWMaximum Landing Weight
OPFOperations Performance File
OPMOperation Performance Model
OPROverall Pressure Ratio
PMPoint Merge
P-RNAVPrecision-Area Navigation
SE 2 ASustainable and Energy Efficient Aviation
SFCSpecific Fuel Consumption
StdStandard deviation
STARStandard Terminal Arrival Route
TASTrue Airspeed
TEMTotal Energy Model
UKUnited Kingdom
VFRVisual Flight Rules
VHSVertical Holding stack

Appendix A. Holding Procedures: Flight Trajectories
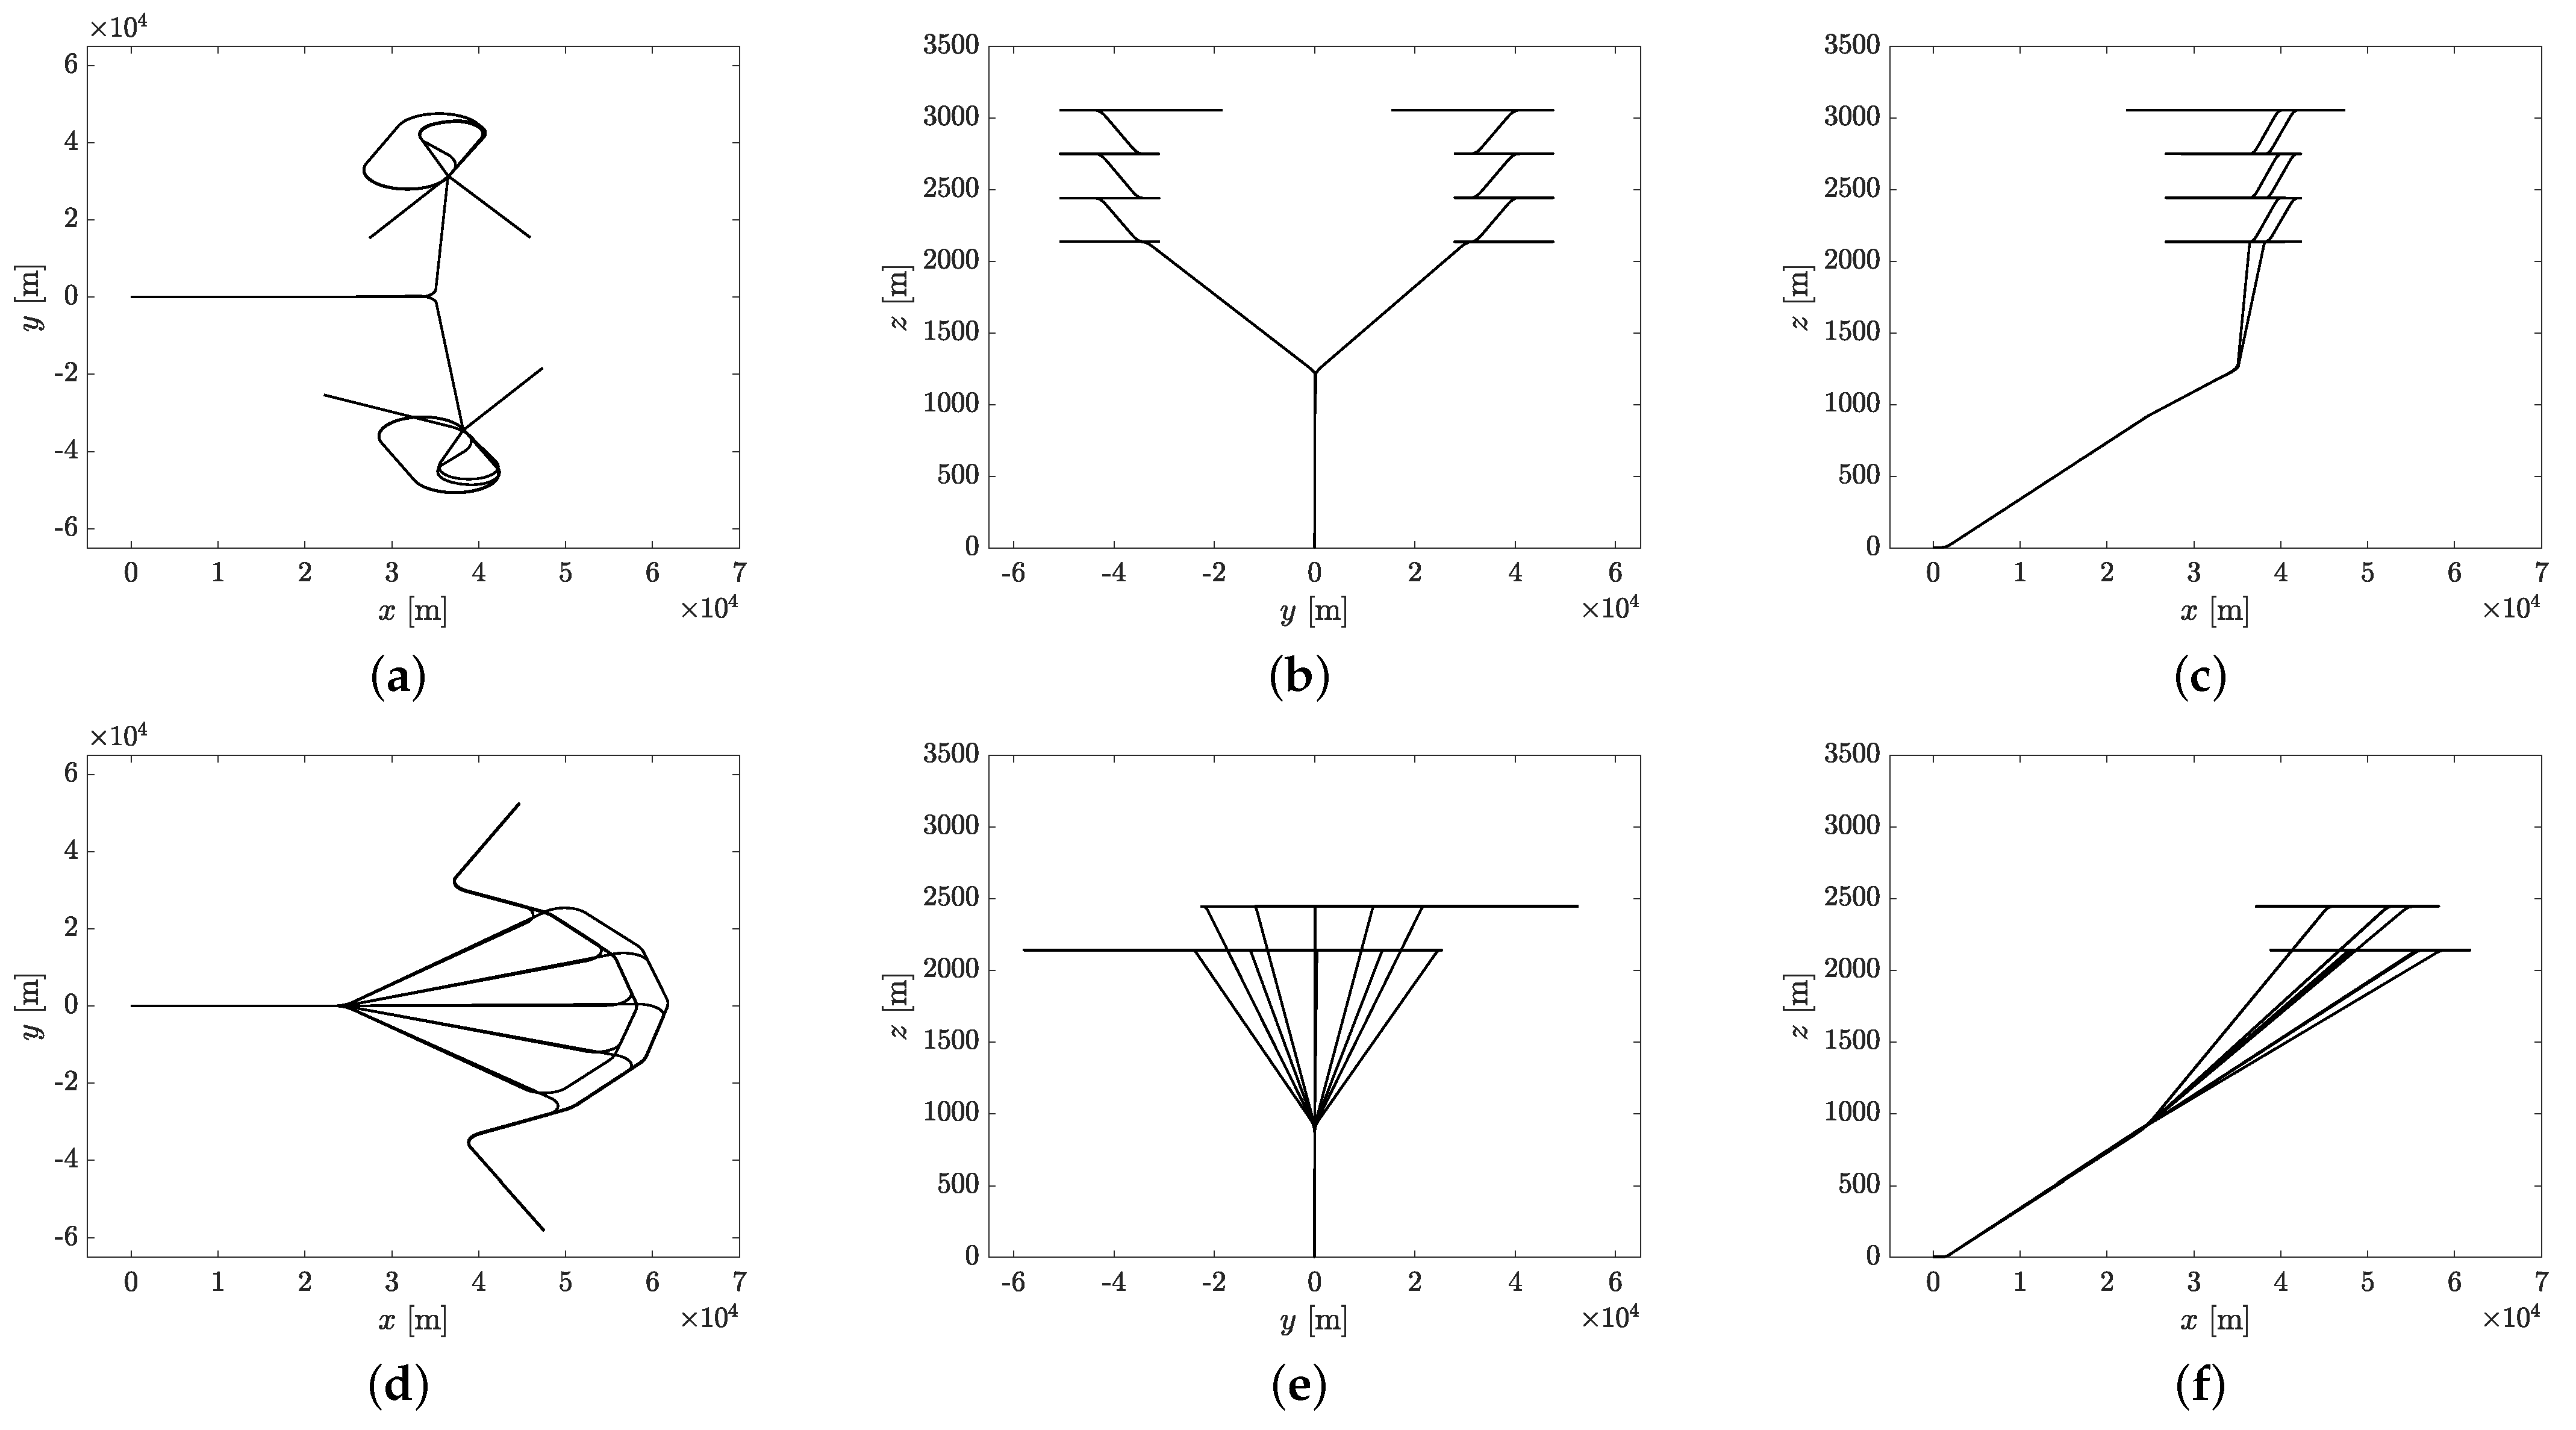
Figure A1. Flight trajectories used for the vertical holding stack (upper row) and the linear hold point merge (lower row): (a,d) x y profiles, (b,e) y z profiles, and (c,f) x z profiles. For the sake of brevity, only flight trajectories calculated based on the performance of the Airbus A320 are presented.
Aerospace 09 00544 g0a1

References

  1. European Commission and Directorate; General for Mobility and Transport and Directorate; General for Research and Innovation. Flightpath 2050: Europe’s Vision for Aviation: Maintaining Global Leadership and Serving Society’S Needs; Publications Office: Luxembourg, 2011. [Google Scholar] [CrossRef]
  2. Krein, A.; Williams, G. Flightpath 2050: Europe’s vision for aeronautics. In Innovation for Sustainable Aviation in a Global Environment: Proceedings of the Sixth European Aeronautics Days, Madrid, Spain, 30 March–1 April 2011; IOS Press: Amsterdam, The Netherlands, 2012; Volume 30. [Google Scholar]
  3. Kharina, A.; Rutherford, D.; Zeinali, M. Cost Assessment of Near and Mid-Term Technologies to Improve New Aircraft Fuel Efficiency; The International Council on Clean Transportation: Washington, DC, USA, 2016. [Google Scholar]
  4. Gössling, S.; Lyle, C. Transition policies for climatically sustainable aviation. Transp. Rev. 2021, 41, 643–658. [Google Scholar] [CrossRef]
  5. Bolić, T.; Ravenhill, P. SESAR: The Past, Present, and Future of European Air Traffic Management Research. Engineering 2021, 7, 448–451. [Google Scholar] [CrossRef]
  6. Single European Sky ATM Research 3 Joint Undertaking. In European ATM Master Plan: Digitalising Europe’s Aviation Infrastructure: Executive View, 2020 Edition; Publications Office: Luxembourg, 2020. [CrossRef]
  7. Wu, C.L.; Caves, R.E. Research review of air traffic management. Transp. Rev. 2002, 22, 115–132. [Google Scholar] [CrossRef]
  8. International Civil Aviation Organization (ICAO). Flight Procedures. In DOC 8168—PROCEDURES FOR AIR NAVIGATION SERVICES—Aircraft Operations, 6th ed.; 2018; Volume I, Available online: https://ffac.ch/wp-content/uploads/2020/11/ICAO-Doc-8168-Volume-I-Flight-Procedures.pdf (accessed on 28 August 2022).
  9. Favennec, B.; Hoffman, E.; Trzmiel, A.; Vergne, F.; Zeghal, K. The point merge arrival flow integration technique: Towards more complex environments and advanced continuous descent. In Proceedings of the 9th AIAA Aviation Technology, Integration, and Operations Conference (ATIO) and Aircraft Noise and Emissions Reduction Symposium (ANERS), Hilton Head, SC, USA, 21–23 September 2009; p. 6921. [Google Scholar]
  10. Meric, Ö.S.; Usanmaz, O. A new standard instrument arrival: The point merge system. Aircr. Eng. Aerosp. Technol. 2013, 85, 136–143. [Google Scholar] [CrossRef]
  11. International Civil Aviation Organization (ICAO). Continuous Descent Operations (CDO) Manual. In Doc 9931 - AN/476, 1st ed.; International Civil Aviation Organization (ICAO): Montreal, QC, USA, 2010. [Google Scholar]
  12. International Civil Aviation Organization (ICAO). Aviation System Block Upgrades, The Framework for Global Harmonization; International Civil Aviation Organization (ICAO): Montreal, QC, USA, 2016. [Google Scholar]
  13. EUROCONTROL. Point Merge Implementation Quick Guide, Simplifying and Enhancing Arrival Operations with Closed Loop Sequencing 2021; Edition: 1.4; EUROCONTROL: Brussels, Belgium, 2021. [Google Scholar]
  14. Guski, R.; Schreckenberg, D.; Schuemer, R. WHO environmental noise guidelines for the European region: A systematic review on environmental noise and annoyance. Int. J. Environ. Res. Public Health 2017, 14, 1539. [Google Scholar] [CrossRef]
  15. Isermann, U.; Bertsch, L. Aircraft noise immission modeling. CEAS Aeronaut. J. 2019, 10, 287–311. [Google Scholar] [CrossRef]
  16. Zellmann, C.; Schäffer, B.; Wunderli, J.M.; Isermann, U.; Paschereit, C.O. Aircraft Noise Emission Model Accounting for Aircraft Flight Parameters. J. Aircr. 2018, 55, 682–695. [Google Scholar] [CrossRef]
  17. Felix Greco, G.; Mysore Guruprasad, S.; Ring, T.P.; Langer, S.C. The impact of the COVID-19 outbreak on the air traffic noise at the Hannover airport region. J. Acoust. Soc. Am. 2022, 152, 1564–1572. [Google Scholar] [CrossRef]
  18. Jäger, D.; Zellmann, C.; Wunderli, J.M.; Scholz, M.; Abdelmoula, F.; Gerber, M. Validation of an airline pilot assistant system for low-noise approach procedures. Transp. Res. Part D Transp. Environ. 2021, 99, 103020. [Google Scholar] [CrossRef]
  19. Delfs, J.; Bertsch, L.; Zellmann, C.; Rossian, L.; Kian Far, E.; Ring, T.; Langer, S. Aircraft Noise Assessment—From Single Components to Large Scenarios. Energies 2018, 11, 429. [Google Scholar] [CrossRef]
  20. Felix Greco, G.; Bertsch, L.; Ring, T.P.; Langer, S.C. Sound quality assessment of a medium-range aircraft with enhanced fan-noise shielding design. CEAS Aeronaut. J. 2021, 12, 481–493. [Google Scholar] [CrossRef]
  21. Bertsch, L.; Sanders, L.; Thomas, R.H.; LeGriffon, I.; June, J.C.; Clark, I.A.; Lorteau, M. Comparative assessment of aircraft system noise simulation tools. J. Aircr. 2021, 58, 867–884. [Google Scholar] [CrossRef]
  22. GasTurb GmbH. Gas Turbine Performance Version 12. 2016. Available online: https://www.gasturb.de/ (accessed on 28 August 2022).
  23. Kurzke, J.; Halliwell, I. Propulsion and Power: An Exploration of Gas Turbine Performance Modeling; Springer: New York, NY, USA, 2018. [Google Scholar] [CrossRef]
  24. Wunderli, J.M.; Zellmann, C.; Köpfli, M.; Habermacher, M. sonAIR—A GIS-Integrated Spectral Aircraft Noise Simulation Tool for Single Flight Prediction and Noise Mapping. Acta Acust. United Acust. 2018, 104, 440–451. [Google Scholar] [CrossRef]
  25. EUROCONTROL. Base of Aircraft Data (BADA) Aircraft Performance Modelling Report. EEC Technical/Scientific Report No. 2009-009. 2009. Available online: https://www.eurocontrol.int/publication/base-aircraft-data-bada-aircraft-performance-modelling-report (accessed on 28 August 2022).
  26. EUROCONTROL. User Manual for the Base of Aircraft Data (BADA) Revision 3.12; EEC Technical/Scientific Report No. 14/04/24-44; EUROCONTROL: Brussels, Belgium, 2014. [Google Scholar]
  27. Poles, D.; Nuic, A.; Mouillet, V. Advanced aircraft performance modeling for ATM: Analysis of BADA model capabilities. In Proceedings of the 29th Digital Avionics Systems Conference, Salt Lake City, UT, USA, 3–7 October 2010. [Google Scholar] [CrossRef]
  28. Nuic, A.; Poles, D.; Mouillet, V. BADA: An advanced aircraft performance model for present and future ATM systems. Int. J. Adapt. Control Signal Process. 2010, 24, 850–866. [Google Scholar] [CrossRef]
  29. Förster, P.; Yildiz, B.; Feuerle, T.; Hecker, P. Approach for Cost Functions for the Use in Trade-Off Investigations Assessing the Environmental Impact of a Future Energy Efficient European Aviation. Aerospace 2022, 9, 167. [Google Scholar] [CrossRef]
  30. Göing, J.; Hogrefe, J.; Lück, S.; Friedrichs, J. Validation of a Dynamic Simulation Approach for Transient Performance Using the Example of a Turbojet Engine. In Proceedings of the STAB/DGLR Symposium, Online, 18 November 2020; Springer: New York, NY, USA, 2020; pp. 559–568. [Google Scholar]
  31. Spuhler, T.; Kellersmann, A.; Bode, C.; Friedrichs, J.; Reitz, G.; Kotulla, M.; Kappei, F.; Michaelis, T. The V2500-A1 as a test rig towards digital twin modeling. In Proceedings of the International Gas Turbine Congress, Chennai, India, 5–6 December 2019. [Google Scholar]
  32. Goeing, J.; Seehausen, H.; Pak, V.; Lueck, S.; Seume, J.R.; Friedrichs, J. Influence of combined compressor and turbine deterioration on the overall performance of a jet engine using RANS simulation and Pseudo Bond Graph approach. J. Glob. Power Propuls. Soc. 2020, 4, 296–308. [Google Scholar] [CrossRef]
  33. Davis, D.Y.; Stearns, E.M. Energy Efficient Engine—Flight Propulsion System Final Design and Analysis; Technical Report. NASA CR-168219; National Aeronautics and Space Administration—Lewis Research Center: Cleveland, OH, USA, 1985. [Google Scholar]
  34. Stearns, E.M. Energy Efficient Engine—Core Design and Performance Report; Technical Report. NASA CR-16869; National Aeronautics and Space Administration - Lewis Research Center: Cleveland, OH, USA, 1982. [Google Scholar]
  35. Benawra, S.; Wang, J. Dynamic modeling and simulation on GE90 engine. Int. J. Eng. Sci. 2016, 5, 111–119. [Google Scholar]
  36. Salomon, J.; Göing, J.; Lück, S.; Broggi, M.; Friedrichs, J.; Beer, M. Sensitivity Analysis of an Aircraft Engine Model Under Consideration of Dependent Variables. In Proceedings of the Turbo Expo: Power for Land, Sea, and Air, Online, June 7–11, 2021; American Society of Mechanical Engineers: New York, NY, USA, 2021; Volume 84898, p. V001T01A005. [Google Scholar]
  37. Zellmann, C. Development of an Aircraft Noise Emission Model Accounting for Flight Parameters. Ph.D. Thesis, Technische Universität Berlin, Berlin, Germany, 2018. [Google Scholar] [CrossRef]
  38. ISO 9613-1; Attenuation of Sound during Propagation Outdoors—Part 1: Calculation of the Absorption of Sound by the Atmosphere. International Standard Organization: Geneva, Switzerland, 1993.
  39. ISO 9613-2; Attenuation of Sound during Propagation Outdoors—Part 2: A General Method of Calculation. International Standard Organization: Geneva, Switzerland, 1996.
  40. Official Journal of the European Communities. Directive 2002/49/EC of the European Parliament and the Council of the European Union Relating to the Assessment and Management of Environmental Noise. 2002. Available online: https://eur-lex.europa.eu/eli/dir/2002/49/oj (accessed on 28 August 2022).
  41. Jaeger, D.; Zellmann, C.; Simons, D.G.; Snellen, M.; Wunderli, J.M. Validation of the sonAIR Aircraft Noise Simulation Model-a Case Study for Schiphol Airport. In Proceedings of the INTER-NOISE and NOISE-CON Congress and Conference Proceedings, Chicago, IL, USA, 26–29 August 2018; Institute of Noise Control Engineering: Reston, VA, USA, 2018; Volume 258, pp. 1048–1056. [Google Scholar]
  42. Jäger, D.; Zellmann, C.; Schlatter, F.; Wunderli, J.M. Validation of the sonAIR aircraft noise simulation model. Noise Mapp. 2021, 8, 95–107. [Google Scholar] [CrossRef]
  43. Torija, A.J.; Self, R.H. Aircraft classification for efficient modelling of environmental noise impact of aviation. J. Air Transp. Manag. 2018, 67, 157–168. [Google Scholar] [CrossRef]
  44. EUROCONTROL. Demand Data Repository, Historical Page. Available online: https://www.eurocontrol.int/ddr (accessed on 28 August 2022).
  45. Horonjeff, R.; McKelvey, F.X. Planning & Design of Airports, 4th ed.; McGraw-Hill Education: New York, NY, USA, 2007; ISBN 0-07-045345-4. [Google Scholar]
  46. Federal Aviation Administration. Airport Capacity and Delay. In Advisory Circular AC 150/5060-5; Federal Aviation Administration: Washington, DC, USA, 1983; Available online: https://www.princeton.edu/~ota/disk3/1984/8403/840305.PDF (accessed on 28 August 2022).
  47. Bundesministerium der Justiz und für Verbraucherschutz. Gesetz zum Schutz gegen Fluglärm (Act for Protectionagainst Aircraft Noise). 2007. Available online: https://www.gesetze-im-internet.de/flul_rmg/BJNR002820971.html (accessed on 28 August 2022).
  48. Civil Aviation Authority. CAP 1616a Airspace Change: Environmental Requirements Technical Annex. Technical Report. Available online: https://publicapps.caa.co.uk/modalapplication.aspx?appid=11&mode=detail&id=8128 (accessed on 28 August 2022).
  49. European Civil Aviation Conference (ECAC). Doc 29—Report on Standard Method of Computing Noise Contours around Civil Airports, 4th ed.; European Civil Aviation Conference (ECAC): Paris, France, 2016. [Google Scholar]
  50. International Civil Aviation Organization (ICAO). Doc 9911—Recommended Method for Computing Noise Contours Around Airports, 2nd ed.; International Civil Aviation Organization (ICAO): Montreal, QC, Canada, 2018. [Google Scholar]
  51. Schlüter, S.; Becker, S. Determination of Aircraft Engine Speed Based on Acoustic Measurements. In Proceedings of the INTER-NOISE and NOISE-CON Congress and Conference Proceedings, Hamburg, Germany, 21–24 August 2016; Institute of Noise Control Engineering: Reston, VA, USA, 2016; Volume 253, pp. 4366–4373. [Google Scholar]
  52. Merino-Martínez, R.; Heblij, S.J.; Bergmans, D.H.T.; Snellen, M.; Simons, D.G. Improving Aircraft Noise Predictions ConsideringFan Rotational Speed. J. Aircr. 2019, 56, 284–294. [Google Scholar] [CrossRef]
  53. Schwab, O.; Zellmann, C. Estimation of Flight-Phase-Specific Jet Aircraft Parameters for Noise Simulations. J. Aircr. 2020, 57, 1111–1120. [Google Scholar] [CrossRef]
  54. Meister, J.; Schalcher, S.; Wunderli, J.M.; Jäger, D.; Zellmann, C.; Schäffer, B. Comparison of the Aircraft Noise Calculation Programs sonAIR, FLULA2 and AEDT with Noise Measurements of Single Flights. Aerospace 2021, 8, 388. [Google Scholar] [CrossRef]
  55. Felix Greco, G.; Wienke, F.; Bertsch, L.; Zellmann, C.; Schäffer, B.; Ring, T.P.; Langer, S.C. A comparative study of semi–empirical noise emission models based on the PANAM and sonAIR aircraft noise simulation tools. In Proceedings of the INTER-NOISE and NOISE-CON Congress, the 51st International Congress and Exhibition on Noise Control Engineering, Glasgow, Scotland, 21–24 August 2022; Institute of Noise Control Engineering: Reston, VA, USA, 2022. [Google Scholar]
  56. Zellmann, C.; Bertsch, L.; Schwab, O.; Wolters, F.; Delfs, J. Aircraft noise assessment of next-generation narrow-body aircraft. In Proceedings of the INTER-NOISE and NOISE-CON Congress, the 48th International Congress and Exhibition on Noise Control Engineering, Madrid, Spain, 16–19 June 2019; Institute of Noise Control Engineering: Reston, VA, USA, 2019; Volume 259, pp. 6389–6400. [Google Scholar]
  57. Felix Greco, G.; Wienke, F.; Bertsch, L.; Ring, T.P.; Langer, S.C. Assessing the environmental noise of next-generation regional jet aircraft concepts in a generic airport scenario. In Proceedings of the 24th International Congress on Acoustics, Gyeongju, Korea, 24–28 October 2022. [Google Scholar]
  58. Blinstrub, J. Immission-Based Noise Reduction within Conceptual Aircraft Design. Ph.D. Thesis, Technische Universität Braunschweig, Braunschweig, Germany, 2019. [Google Scholar] [CrossRef]
  59. Mosca, V.; Karpuk, S.; Sudhi, A.; Badrya, C.; Elham, A. Multidisciplinary design optimisation of a fully electric regional aircraft wing with active flow control technology. Aeronaut. J. 2022, 126, 730–754. [Google Scholar] [CrossRef]
  60. Karpuk, S.; Liu, Y.; Elham, A. Multi-fidelity design optimization of a long-range blended wing body aircraft with new airframe technologies. Aerospace 2020, 7, 87. [Google Scholar] [CrossRef]
  61. Karve, R.; Angland, D.; Nodé-Langlois, T. An analytical model for predicting rotor broadband noise due to turbulent boundary layer ingestion. J. Sound Vib. 2018, 436, 62–80. [Google Scholar] [CrossRef] [Green Version]
  62. Staggat, M.; Moreau, A.; Guérin, S. Analytical prediction of boundary layer ingestion noise for an integrated turbofan. In Proceedings of the Proceedings of the 26th International Congress on Sound and Vibration, Montreal, Canada, 7–11 July 2019. [Google Scholar]
  63. Romani, G.; Ye, Q.; Avallone, F.; Ragni, D.; Casalino, D. Numerical analysis of fan noise for the NOVA boundary-layer ingestion configuration. Aerosp. Sci. Technol. 2020, 96, 105532. [Google Scholar] [CrossRef]
  64. Ananthan, V.B.; Bernicke, P.; Akkermans, R. Aeroacoustic analysis of a circulation-controlled high-lift flap by zonal overset large-eddy simulation. AIAA J. 2020, 58, 5294–5305. [Google Scholar] [CrossRef]
  65. Akkermans, R.A.; Pott-Pollenske, M.; Buchholz, H.; Delfs, J.; Almoneit, D. Installation Effects of a Propeller Mounted on a High-Lift Wing with a Coanda Flap. Part I: Aeroacoustic Experiments. In Proceedings of the 20th AIAA/CEAS Aeroacoustics Conference, Atlanta, GA, USA, 16–20 June 2014. [Google Scholar] [CrossRef]
  66. Dierke, J.; Akkermans, R.A.; Delfs, J.; Ewert, R. Installation Effects of a Propeller Mounted on a Wing with Coanda Flap. Part II: Numerical Investigation and Experimental Validation. In Proceedings of the 20th AIAA/CEAS Aeroacoustics Conference, Atlanta, GA, USA, 16–20 June 2014. [Google Scholar] [CrossRef] [Green Version]
  67. Blinstrub, J.; Heinze, W.; Bertsch, L.; Simons, D.; Snellen, M. System noise assessment of an aircraft with Coanda flaps. In Proceedings of the READ Conference, Warsaw, Poland, 12–14 September 2016; Volume 12, p. 14. [Google Scholar]
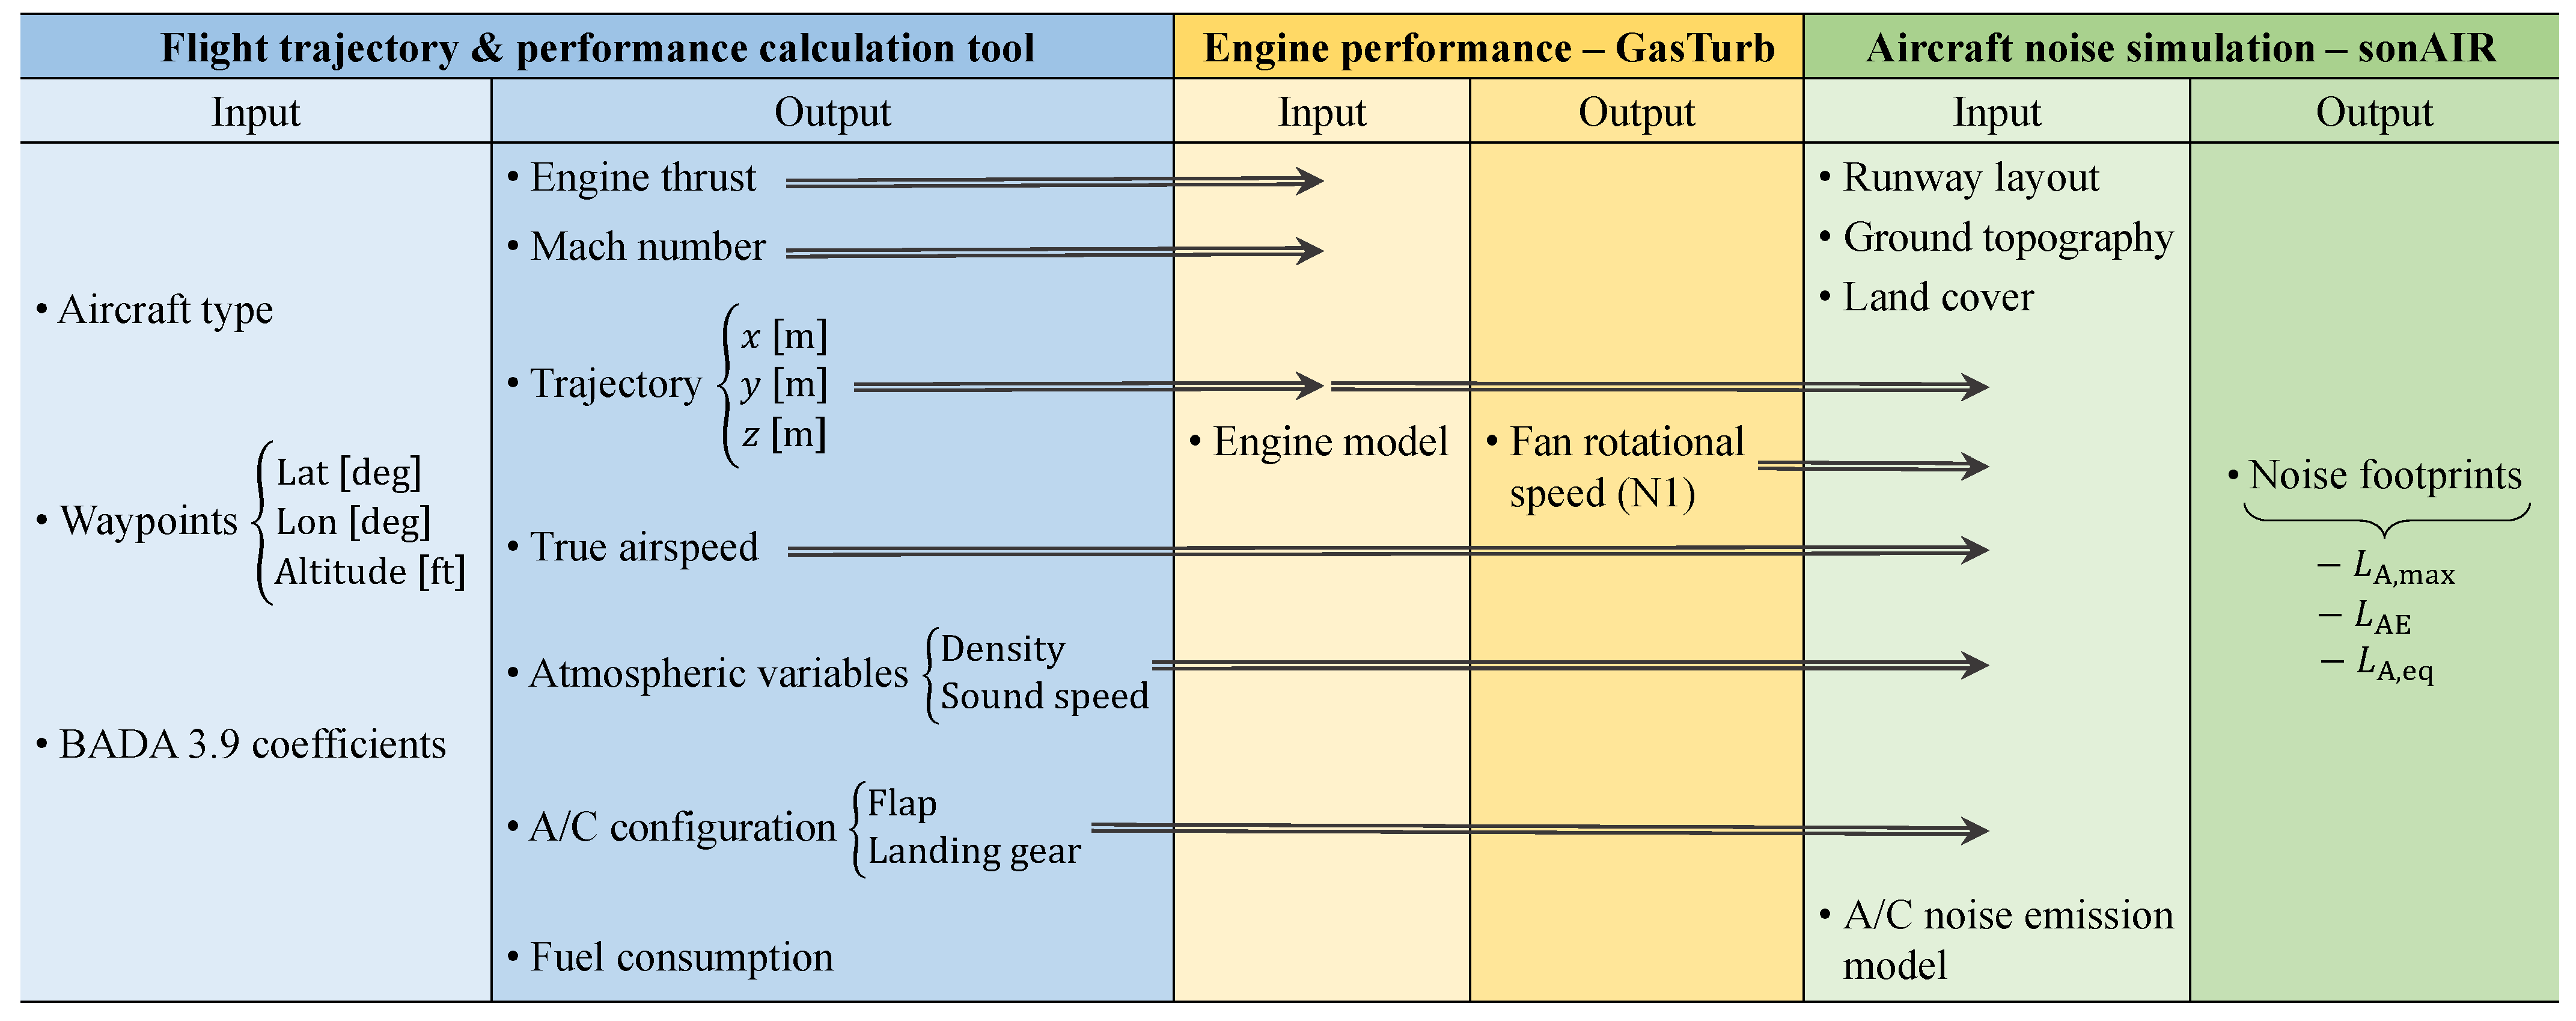
Figure 1. Schematic of the proposed multi-level simulation framework, including the inputs and outputs associated with the different prediction tools.
Aerospace 09 00544 g001
Figure 2. Global off-design calculation procedure for high-bypass turbofans.
Aerospace 09 00544 g002
Figure 3. Air traffic scenario considering the vertical holding stack concept: (a) flight chart, (b) altitude profiles of the flight trajectories, (c) total flight time duration per flight trajectory, and (d) velocity profiles of the flight trajectories. For the sake of clarity, only flight trajectories calculated based on the performance of an Airbus A320 are presented.
Aerospace 09 00544 g003
Figure 4. Air traffic scenario considering the linear hold point merge concept: (a) flight chart, (b) altitude profiles of the flight trajectories, (c) total flight time duration per flight trajectory, and (d) velocity profiles of the flight trajectories. For the sake of clarity, only flight trajectories calculated based on the performance of the Airbus A320 are presented.
Aerospace 09 00544 g004
Figure 5. Aircraft type variability at six selected airports in Europe and the UK: percentage of movements per aircraft type with respect to the total number of flight operations (approach and departure) along the months of March, June, September and December of the year of 2018. The aircraft are categorized according to the wake turbulence classification of the FAA [45].
Aerospace 09 00544 g005
Figure 6. Seasonal distribution of the aircraft mix index for six selected airports: results computed based on the total number of flight movements per day along the months of March, June, September and December of 2018.
Aerospace 09 00544 g006
Figure 7. L ¯ A , eq , 1 h noise contours for the vertical holding stack (upper row) and the linear hold point merge (lower row): (a,d) Scenario A, (b,e) Scenario B, (c,f) Scenario C. Inset figures show the noise contours close to the runway. For the sake of clarity, only flight trajectories calculated based on the performance of the Airbus A320 are presented.
Aerospace 09 00544 g007
Figure 8. Relative L ¯ A , eq , 1 h isocontour area differences for the linear hold point merge procedure with respect to the vertical holding stack procedure.
Aerospace 09 00544 g008
Figure 9. L ¯ A , max , avg noise contours for the vertical holding stack (upper row) and the linear hold point merge (lower row): (a,d) Scenario A, (b,e) Scenario B, (c,f) Scenario C. Inset figures show the noise contours close to the runway. For the sake of clarity, only flight trajectories calculated based on the performance of the Airbus A320 are presented.
Aerospace 09 00544 g009
Figure 10. Relative L ¯ A , max , avg isocontour area differences for the linear hold point merge procedure with respect to the vertical holding stack procedure.
Aerospace 09 00544 g010
Figure 11. N1 profiles (solid lines) and corresponding mean N1 values per flight phase (dashed lines) for the (a) vertical holding stack and (b) linear hold point merge: Airbus A320 (black lines) and Boeing B77W (blue lines).
Aerospace 09 00544 g011
Figure 12. Influence of the N1 values in terms of (a,b) Δ L ¯ A , eq , 1 h and (c,d) Δ L ¯ A , max , avg for the vertical holding stack (left column) and the linear hold point merge (right column). Inset figures show the noise contours close to the runway. Results obtained considering the Scenario C. For the sake of clarity, only flight trajectories calculated based on the performance of the Airbus A320 are presented.
Aerospace 09 00544 g012
Table 1. On-design operating points considered in this study for each jet engine.
Jet Engine
V2500-A1GE90-115B
Thrust [ k N ]2470
OPR [-]3540
n 1 [rpm]54312261
n 2 [rpm]13,9729332
SFC [ g   k N 1 / s 1 ]19.8115.86
BPR [-]5.18.1
Table 2. Noise emission models used in this work for the aircraft noise simulations and their accuracy for aircraft under approach procedure: mean and standard deviation (Std) absolute differences between simulation and measurements of N flight events in terms of L AE . Source: own representation based on the work of Jäger et al. [42].
AircraftEnginesonAIR ModelNMeanStd
A320V2500-A1A32X_V25001860.81.9
B77WGE90-115BB77W_GE90-115B2830.71.4
Table 3. Estimates of hourly and annual capacities for an single runway configuration and different aircraft mix indexes. Source: own representation based on [46].
RunwayMix Index [%]Hourly CapacityAnnual Service
ConfigurationVFRIFRVolume
0–209859230,000
21–507457195,000
Aerospace 09 00544 i00151–806356205,000
Single-runway81–1205553210,000
121–1805150240,000
Table 4. Summary of indicators from the statistical analysis conducted in six selected airports concerning the aircraft fleet mix: monthly averaged values based on the total number of flight movements per day in the year of 2018.
Number of Movements
AirportMonthPercentage of ArrivalsType C [%]Type D [%]MI [%]
EGBBMarch49.91945109
June49.87973106
September49.88973106
December50.02926110
mean49.96954.25107.75
EGPFMarch49.22913100
June49.85914103
September49.68914103
December49.96943103
mean49.6891.753.5102.25
EGSSMarch49.88954107
June49.94954107
September50.05954107
December50.09945109
mean49.9994.754.25107.5
ELLXMarch50.087821141
June50.128018134
September50.138118135
December50.177623145
mean50.1278.7520138.75
LCLKMarch50.06946112
June50927113
September50.07936111
December50.08946112
mean50.0593.256.25112
LSGGMarch50.01924104
June49.91934105
September50.02934105
December49.86944106
mean49.95934105
Table 5. Investigation on the influence of the N1 values: mean N1 values per aircraft type, holding procedure, and flight phase.
Vertical Holding Stack
Aircraft N 1 ¯ lan [%] N 1 ¯ app [%] N 1 ¯ hold [%]
A32053.1952.6564.45
B77W64.8760.4673.71
Flight phaseLanding ( z 3000 ft)Approach (3000 ft z 7000 ft)Holding ( z 7000 ft)
Linear hold point merge (upper level sequencing leg)
Aircraft N 1 ¯ lan [%] N 1 ¯ app [%] N 1 ¯ hold [%]
A32054.9445.0665.42
B77W67.2948.7675.11
Flight phaseLanding ( z 3000 ft)Approach (3000 ft z 8000 ft)Holding ( z 8000 ft)
Linear hold point merge (lower level sequencing leg)
Aircraft N 1 ¯ lan [%] N 1 ¯ app [%] N 1 ¯ hold [%]
A32054.7850.4364.77
B77W6757.4374.27
Flight phaseLanding ( z 3000 ft)Approach (3000 ft z 7000 ft)Holding ( z 7000 ft)
Publisher’s Note: MDPI stays neutral with regard to jurisdictional claims in published maps and institutional affiliations.