Article

Study on the Leading Edge of a Hypersonic Vehicle Using the Aero-Thermoelastic Coupling Method

College of Aerospace Engineering, Nanjing University of Aeronautics and Astronautics, Nanjing 210016, China
*
Author to whom correspondence should be addressed.
Aerospace 2022, 9(12), 835; https://doi.org/10.3390/aerospace9120835
Submission received: 4 November 2022 / Revised: 3 December 2022 / Accepted: 12 December 2022 / Published: 15 December 2022

Abstract

:
The characteristics of aero-thermoelastic coupling are important for the design of the leading edge in hypersonic vehicles. Herein, a fluid–structure interaction analysis is performed to study the leading edge of a hypersonic vehicle using aero-thermoelastic coupling methods. The results show that the maximum heat flux and temperature of the optimized Bézier curve leading edge are reduced to a certain extent, compared with a hemi-cylindrical leading edge, and the lift–to–drag ratios of the two models are close. The Bézier curve leading-edge model can reduce the blunt radius of the leading edge of the hypersonic vehicle and increase the aerodynamic performance without losing thermal performance.

1. Introduction

Hypersonic vehicles with a high lift-to-drag (L/D) ratio are designed with sharp leading edges to minimize drag through the waverider method. Under the waverider design conditions, the shock wave is attached to the entire sharp leading edge of the waverider, thereby confining the high-pressure gas between the wave and the lower surface, avoiding overflow at the lower surface. This feature enables the waverider to have an extremely high L/D ratio. However, the sharp leading edge is limited by excessive convective heat loading at high Mach numbers [1]. Therefore, the performance of the hypersonic vehicle is very sensitive to the shape of the leading edge. The design of the leading edge should take into account aerodynamic heating and drag [2,3,4].
The sharp leading edge of an ideal waverider should be blunted, due to manufacturing handling concerns and serious aero-heating [5]. Liu et al. [6] have studied the mechanism of bluntness impact. As the blunt radius enlarges, the aerodynamic performance degrades remarkably. Fu et al. [7] have performed a parametric method for blunting the leading edge. Hinman et al. [4] have performed an aero-thermal optimization study of two-dimensional hypersonic leading-edge geometries. The optimized geometry resulted in a 17.7% reduction in peak heat flux and an 8.67% increase in pressure resistance. Since the overall performance is governed by aerodynamic loads, aero-thermal effect, and structure coupling effects, the study of aero-thermo-elastic properties is of great importance. To better guide the design of hypersonic vehicles, it is necessary to conduct in-depth research on leading-edge aero-thermoelastic coupling characteristics.
Accurate numerical simulation of aero-thermoelastic coupling is a complex and challenging multidisciplinary problem. Computational fluid dynamics (CFD) requires accurate capabilities for modeling unsteady three-dimensional flow fields, flow with shocks, rapid grid deformation, and efficient solution methods. This must be coupled with computational structural dynamics (CSD) analysis for application in fluid–structure interaction (FSI). Over the past decade, several state-of-the-art Reynolds-averaged Navier–Stokes (RANS) solvers have been used in aero-thermoelastic coupling analysis. Recently, some authors have presented and applied a coupled CFD and CSD code method for comprehensive analysis [8,9,10]. These studies focus on aero-thermoelasticity problems, which involve mutual interactions between aerodynamic, structural dynamic, and thermal forces in a system [11].
This paper is organized as follows. Section 2 describes the aero-thermoelastic coupling methods. In Section 3, the geometry optimization of the hypersonic leading edge is described. In Section 4, two testing cases are presented to study the leading edge of a hypersonic vehicle using the aero-thermoelastic coupling method. Finally, conclusions are drawn in Section 5.

2. Aero-Thermoelastic Coupling Methods

2.1. Flow Solver

An unstructured grid finite-volume RANS in-house solver OVERU was developed for the present analysis [12,13]. The solver employs an implicit upwind algorithm in which the inviscid fluxes are obtained with a HLLE++ Riemann solver [14,15], with second-order reconstruction based on the values and gradients on either side of the interface. According to Jameson and Yoon [16], a lower–upper symmetric Gauss–Seidel (LU-SGS) operator is applied to time integration, with a 2nd-order time-accuracy dual-time stepping method for temporal discretization. The RANS equations are as follows:
W t + F j x j = G j x j
where W is a conserved variable vector:
W = ( ρ ρ u ρ v ρ w ρ E ) T
where F is the convective flux vector, G is the viscous flux vector, ρ is the density, u, v, and w are the velocities in three directions, and E is the total energy. The LU-SGS method discretizes the equation as:
( D + L ) D 1 ( D + L ) Δ W = R + ( L D 1 U ) Δ W
where D denotes a diagonal matrix, L denotes a strictly lower triangular matrix, and U denotes a strictly upper triangular matrix. The resulting equation can be solved in two steps shown as follows:
Lower (forward) sweep:
( D + L ) Δ W = R
Upper (backward) sweep:
( D + U ) Δ W = D Δ W
It is found that the computational cost of one LU-SGS step is approximately 50% of one three-state Runge–Kutta explicit step.

2.2. Structural Solver

A computational structural dynamics (CSD) solver FEAP [17] (http://projects.ce.berkeley.edu/feap, accessed on 30 October 2022) was used to solve the structural equations. FEAP is a general-purpose finite-element analysis program that was designed for research and educational use. For parallel simulation, the Super_LU package [18] was used to solve the linear equations:
σ + f = ρ d 2 u d t 2 + ξ d u d t
The equation of motion for dynamic elastic bodies derived from the principle of virtual work discretized using the finite element method is:
K U + C U ˙ + M U ¨ = F
The thermal element solves the Fourier heat-conduction equation in three-dimensional domains. The equation is described by:
( k T ) + Q = ρ c T t
where k is the thermal conductivity value, ∇ is the gradient operator, Q is the heat added per volume, ρ is the mass density and c is the specific heat.
The discretized governing equations for heat conduction in structures is:
K T + M T ˙ = F
According to the above equations, FEAP includes a library of elements for thermomechanical analyses, which are suitable for the simulation of aero-thermoelastic coupling problems.

2.3. Fluid–Structure Interaction

A two-way coupling between the fluid and structure domains is used to solve the governing equations in an iterative manner [19,20], as shown in Figure 1. The simulation starts from the cold body. The pressure and heat flux loads are applied on the surface of the leading-edge structure. The structural equations are solved, which provide the deformation and temperature at the fluid–structure interface. The volume mesh of fluid is moved by the grid-deformation method in accordance with the deformation of the fluid–structure interface. The Navier–Stokes equations are solved for the fluid domain based on the moved mesh, and then the fluid force and heat flux are computed on the structure surface. The fluid force and heat flux are applied on the surface of the structure for the next time step. At the fluid–structure interface, the two meshes are conformed to each other. Usually, different surface meshes are applied on the two domains of the interface. An interpolation method based on radial basis function (RBF) [21] is used to interpolate the displacement and temperature from the structure mesh to the fluid mesh, according to Equation (10), and interpolate the force and flux from the fluid mesh to the structure mesh, according to Equation (11). The construction of the FSI method is implemented by coupling OVERU with FEAP. An FSI coupling package was developed in the Python language for FSI iteration control. The FSI coupling package and solvers exchanged the data on displacement, temperature, force, and heat flux using the message passing interface (MPI).
The data transfer between the two grids can be summarized by the following equation:
d a = H d s T a = H T s
F s = H T F a q s = H T q a
where d a is the displacement of the aerodynamic grid on the boundary, and d s is the displacement of the structural grid on the boundary. F a is the aerodynamic force, F s is the structural force, q is the heat flux, and T is the temperature. H represents the transfer matrix that projects the CFD onto the structure mesh surface. The exchange of force, displacement, heat flux, and temperature between the CSD and CFD is achieved by the above two equations.

2.4. Grid Deformation

In the time-marching FSI simulations, the grid must be updated at every time step so that it conforms to the aero-elastic deformation of the structure. For unsteady computations, a dynamic grid based on the Delaunay map is a fast and robust new algorithm. It is noniterative, efficient, topologically flexible, and avoids negative cell volumes [22].
A Delaunay graph of the whole grid is generated first, and then auxiliary points are inserted around the geometry in the initial Delaunay. Next, we map between the Delaunay graph and the computational grid during the movement. The Delaunay graph can be moved easily during geometric dynamic deformation, even for large deformations. Therefore, the new computational grid after the dynamic movement can be generated efficiently through the mapping, while maintaining the primary qualities of the grid. The Delaunay graph and grid deformation of an airfoil are shown in Figure 2.

3. Optimization of the Hypersonic Leading Edge

The performance of the hypersonic vehicle is very sensitive to the shape of the leading edge. The design of the leading edge should consider aerodynamic heating and drag. Compared with the traditional hemi-cylindrical leading edge (HCLE), studies [2,3] have been performed regarding finite leading-edge geometries using power law curve and Bézier curve leading edges (BCLE). The BCLE has been optimized to reduce the peak leading-edge heating in the design of waverider-based vehicles. The optimized geometry resulted in a 17.7% decrease in peak heat flux and an 8.67% increase in pressure drag [4]. These studies show that optimization of the hypersonic leading edge can reduce the maximum heat flux when designing a hypersonic vehicle. In other words, the performance of the hypersonic vehicle can be improved by reducing the diameter of the leading edge, and its thermal impact can be reduced.

4. Results and Discussion

In this section, two leading edges of hypersonic vehicle models will be studied using the aero-thermoelastic coupling method.

4.1. Finite Leading Edge

4.1.1. Geometry and Grids

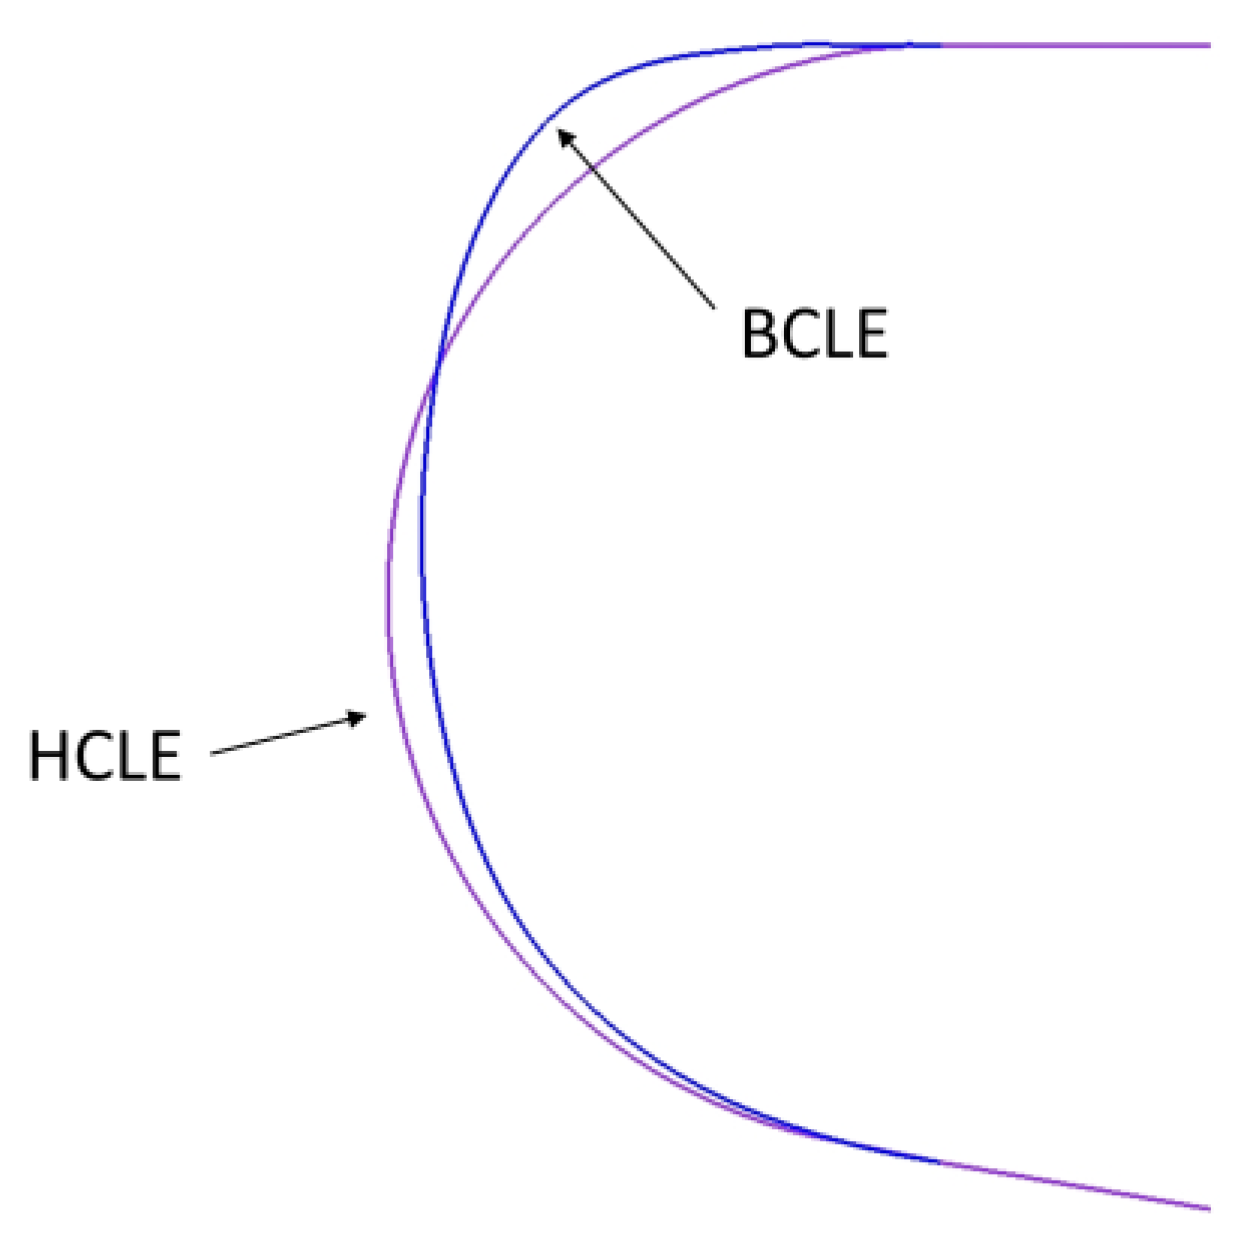
Reference [4] presents several sets of optimized leading-edge profiles. Figure 3 shows the comparison between the BCLE profile selected in this paper and the HCLE. Through the calculation of heat flux, it is found that the stagnant heat flux of the BCLE is significantly lower than that of the HCLE. The material properties of the titanium alloy are used for the leading edge. The Young’s modulus of the material is 1.09 G Pa. The Poisson’s ratio of the material is 0.34. The density of the material 4440 kg/m3. The specific heat capacity and thermal conductivity of the material are 611 J/(kg·°C) and 6.8 W/(m·°C), respectively. Internal instrumentation is not considered. The radiation effect of the wall is considered. For all simulations, a time step size of 0.01 s and second-order accuracy in time discretization are used. The freestream-flow conditions of the numerical simulation in this section are as follows: the altitude is 25 km and the Mach number is 6.0.
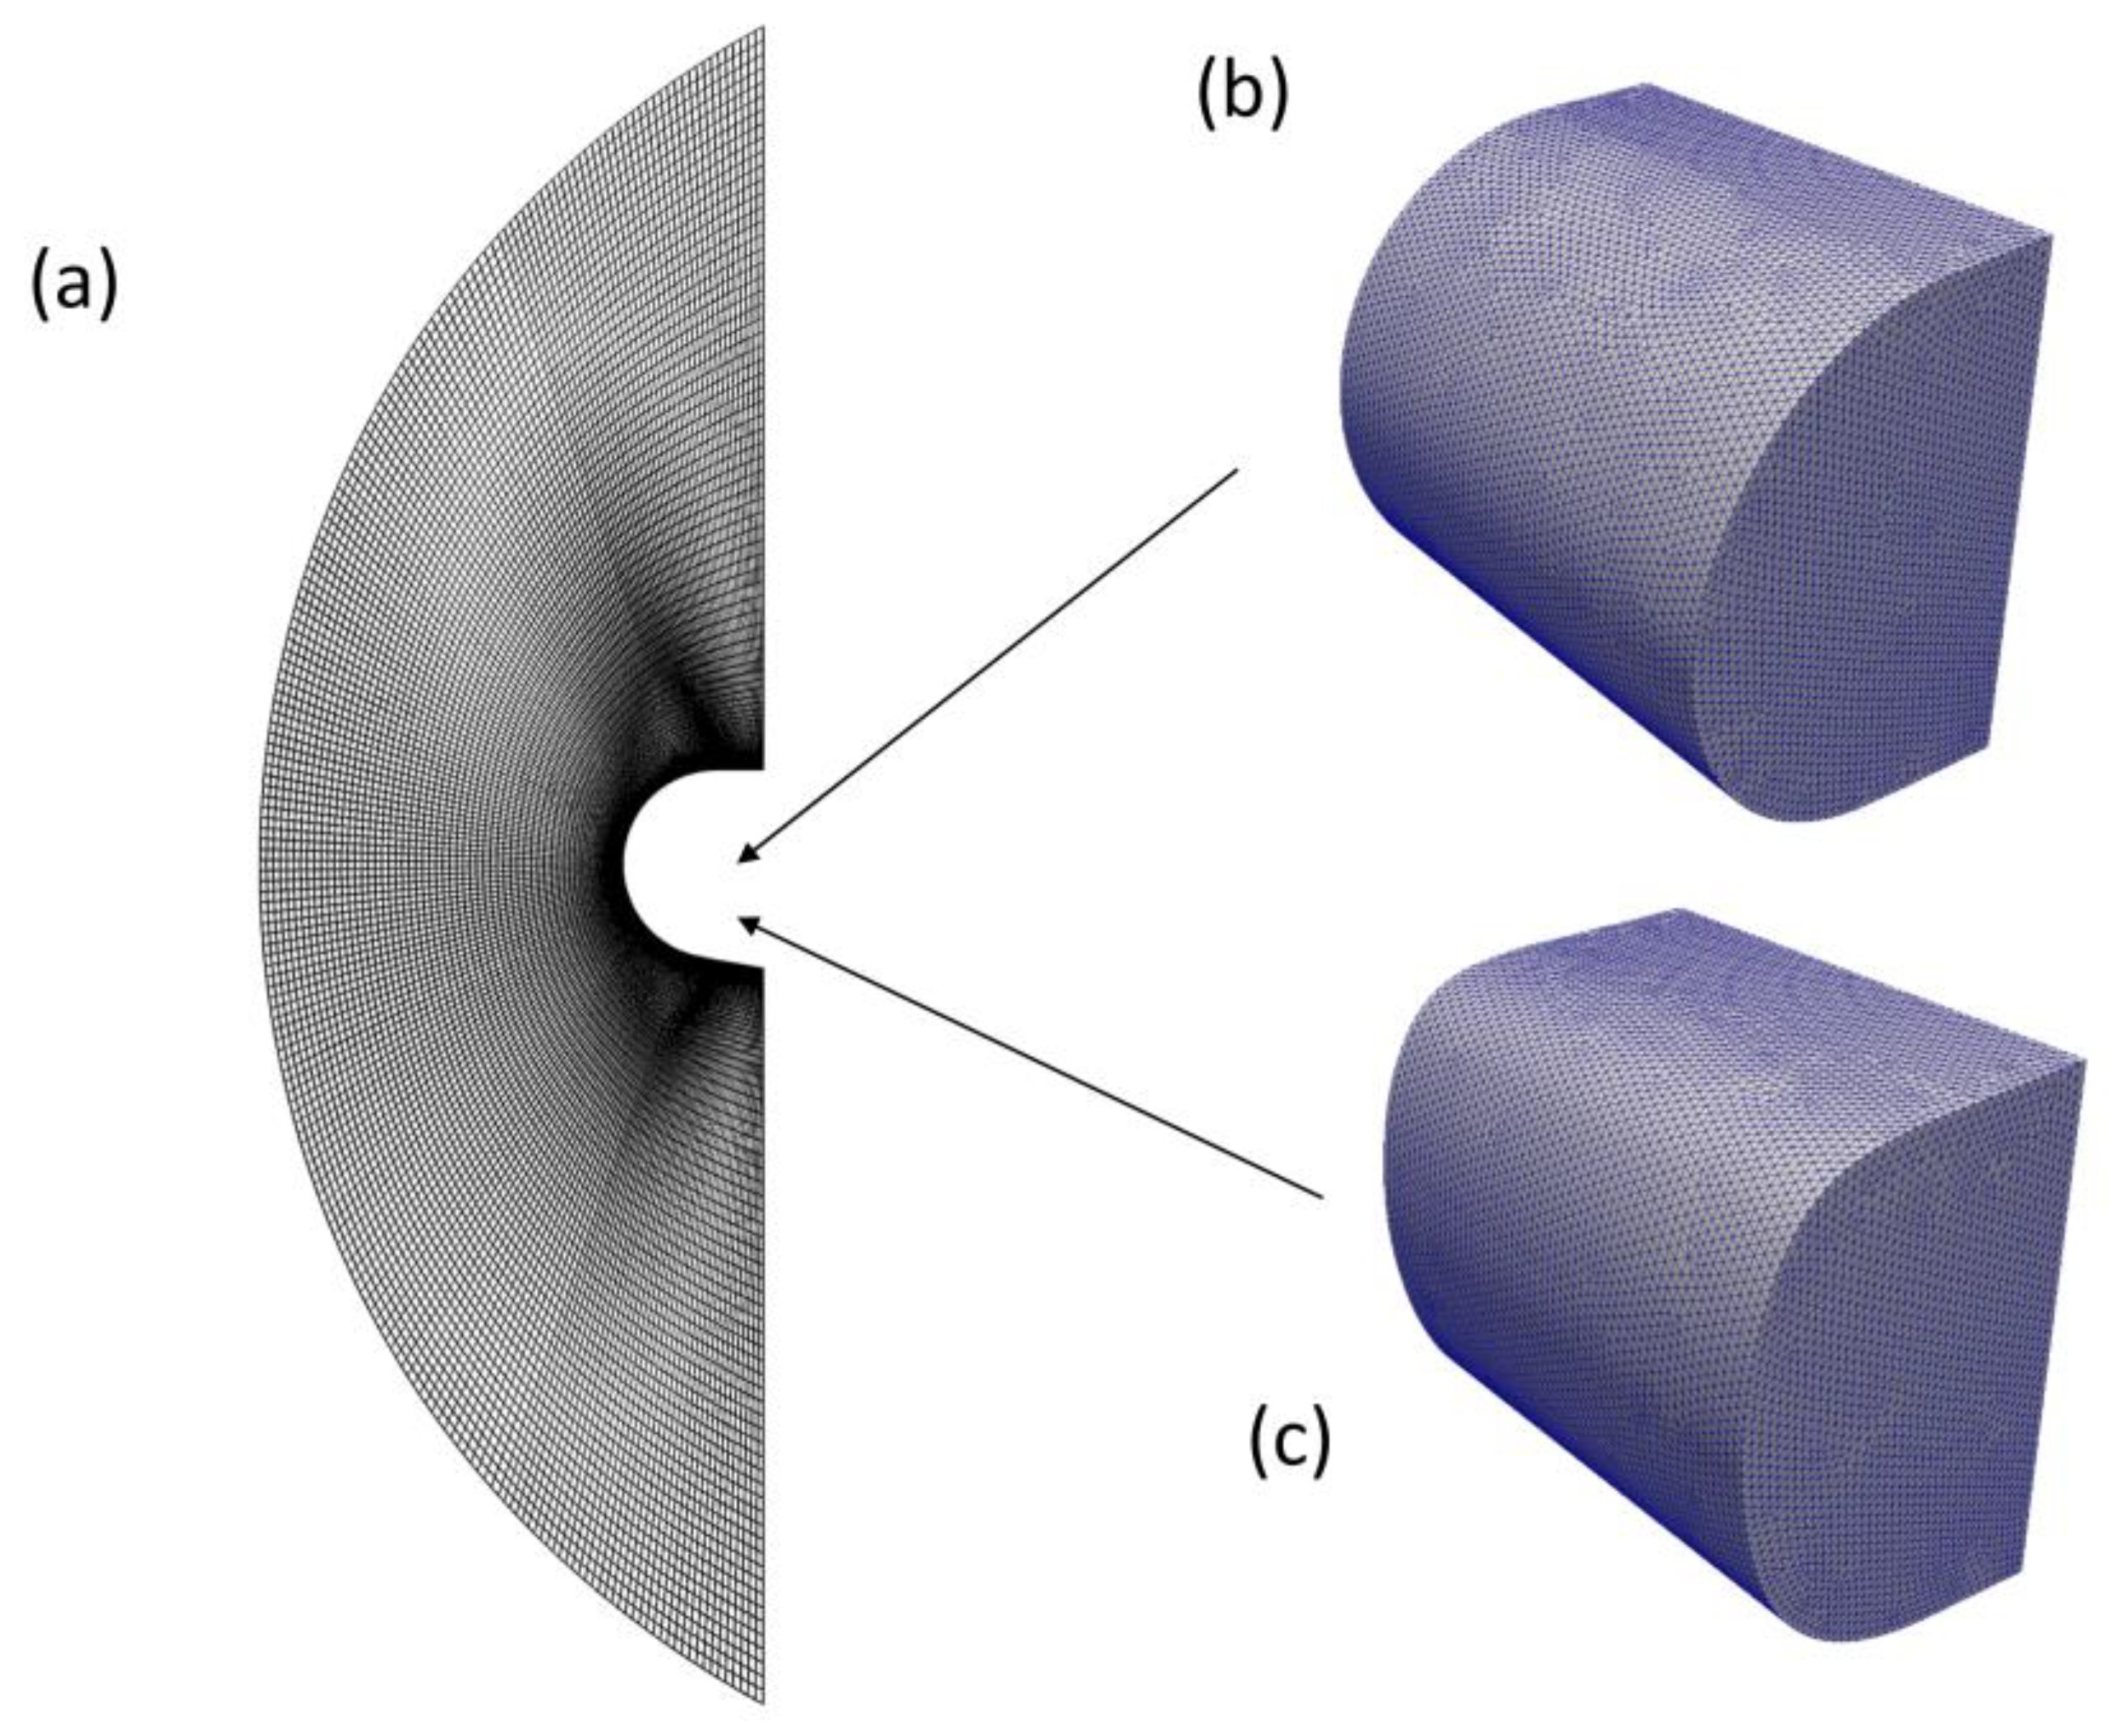
The CFD and CSD meshes used are shown in Figure 4. For each fluid domain, structured meshes composed of hexahedrons are generated as a CFD grid. The CFD grid is composed of approximately 3 million elements. For each structure domain, unstructured grids composed of tetrahedrons are generated, which is approximately 0.2 million elements. To ensure independence of the computational grid used, a mesh convergence study is performed for the finite leading-edge model. Three different mesh sizes, ranging from 2.3 M to 4.4 M CFD mesh elements and 0.1 M to 0.3 M CSD mesh elements, are generated for the HCLE model. Mesh convergence study parameters are shown in Table 1. The maximum temperature changed by only 1.65% (less than 2%) between medium and fine meshes. The medium meshes achieve suitable accuracy and were used for subsequent simulations.

4.1.2. Results

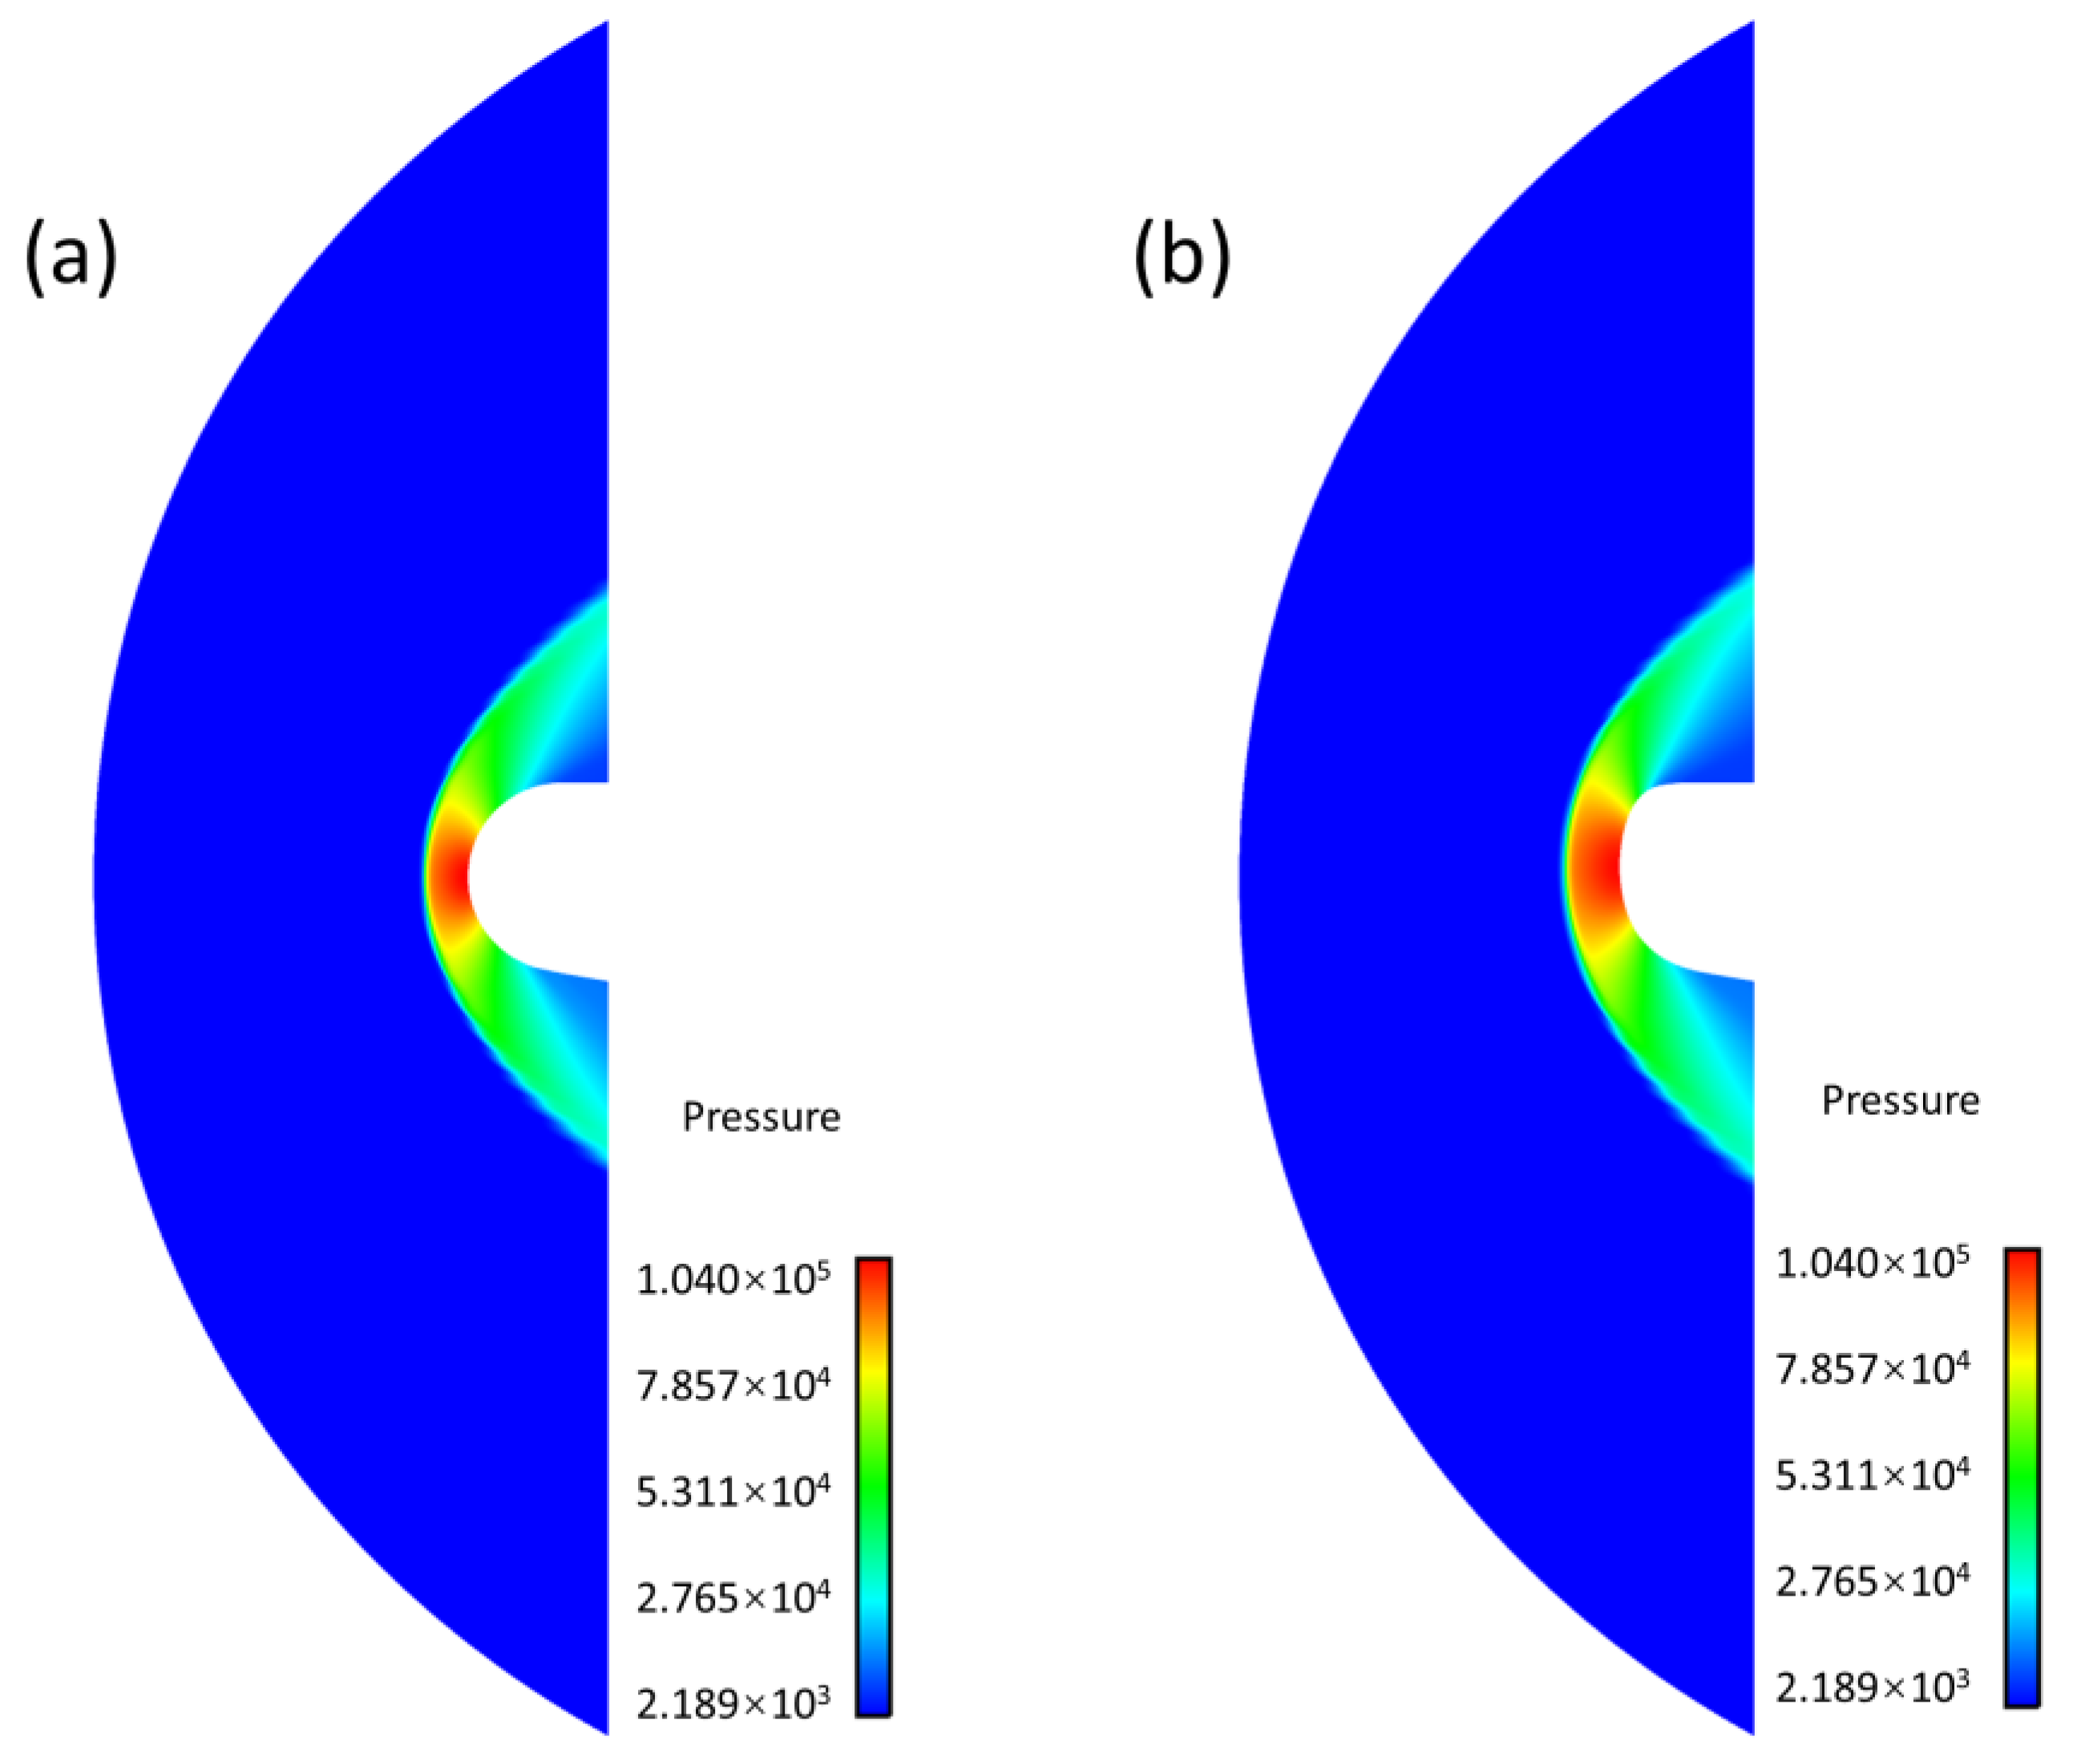
Figure 5 shows the flow-field pressure contours of the HCLE and the BCLE. The flow field can be divided into the far-field free-flow region and the bow-shock region. The bow shock of the BCLE is farther from the surface, which is mainly caused by the bluntness at the stagnation point of the BCLE. Generally, the larger the radius of curvature, the farther away the shock wave is from the blunt body, and the heat flux is inversely proportional to the radius of curvature. Therefore, the radius of curvature of BCLE’s stagnation point is larger, resulting in its shock wave being farther away from the surface and its heat flux being smaller.
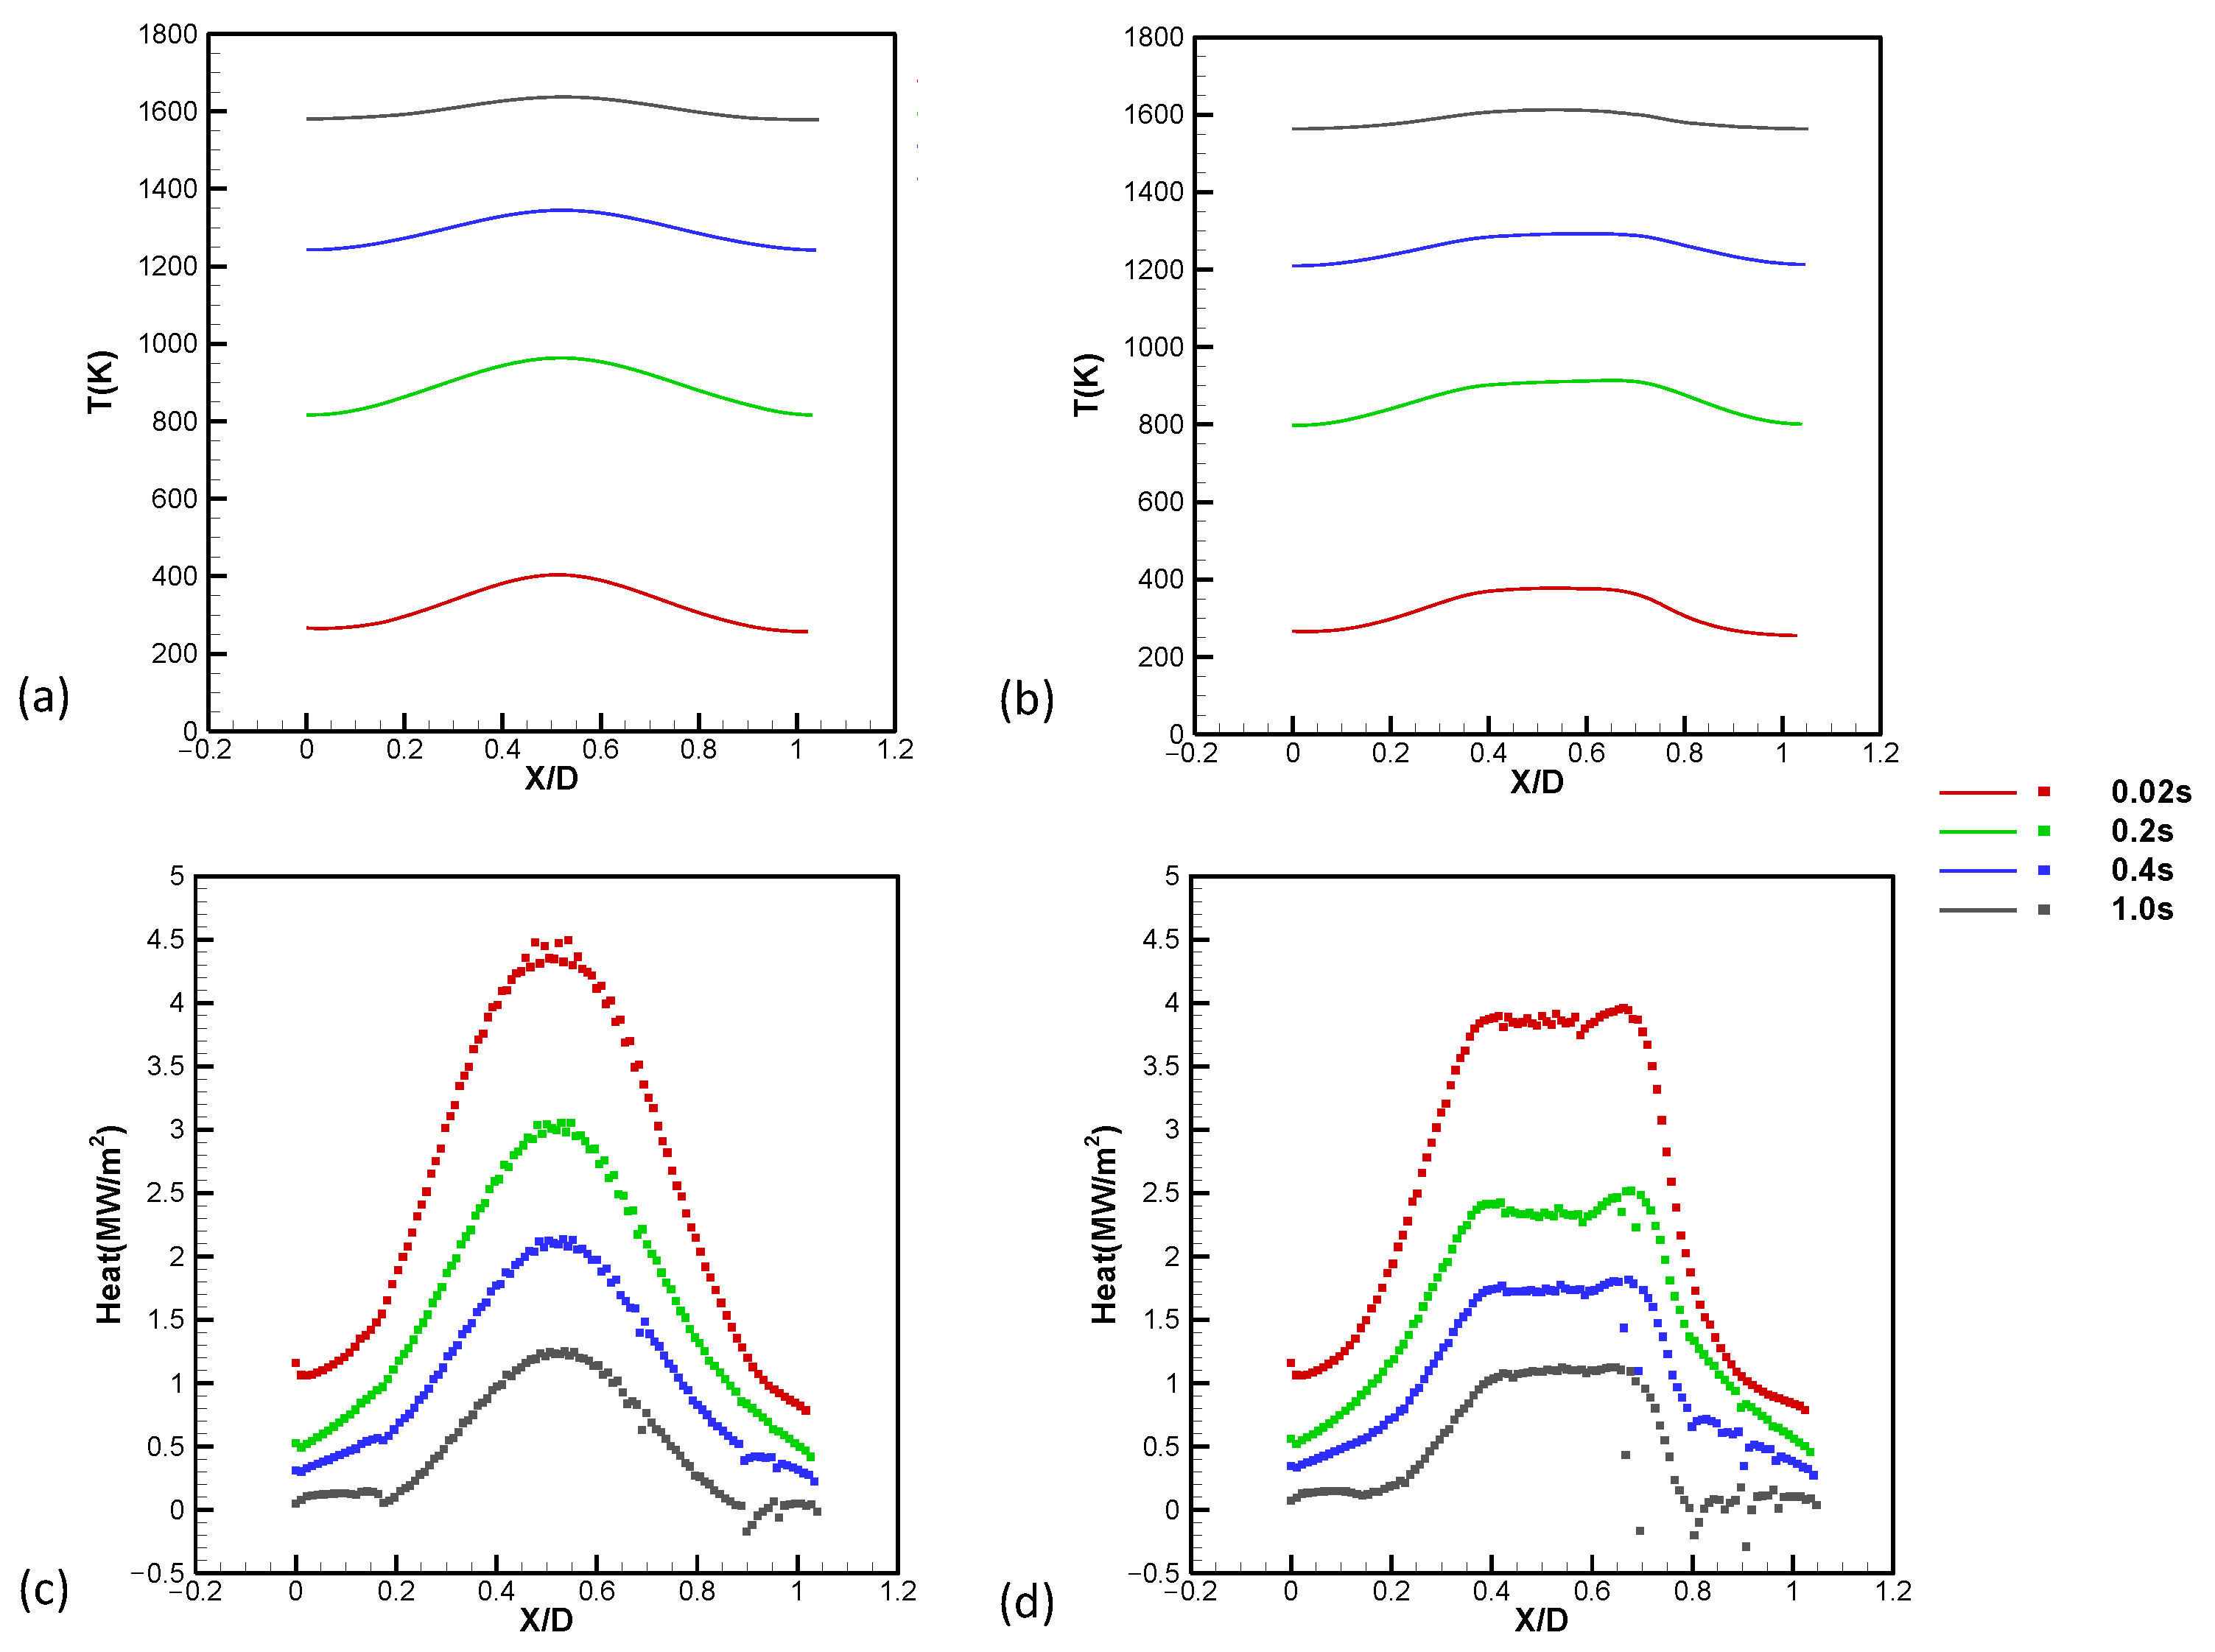
Figure 6 shows the time-dependent characteristics of temperature and heat flux at the fluid–structure interface. At the start time, the stagnation-point temperature is the highest. As time progresses, the wall temperature will continue to increase (HCLE from 257 K to 1637 K; BCLE from 257 K to 1612 K), and the stagnation-point temperature is higher than that of other parts. With increasing heating time, there is a gradually forming uniform trend from 1580 K to 1637 K. The wall heat flux density decreases with the gradual increase in the wall temperature, which reflects the coupling of heat transfer between the fluid and solid. For the BCLE, at the beginning, the stagnation point has the highest temperature, but it is flatter than the HCLE. The heat is also flat in the stagnation region, which is in good agreement with Reference [4]. The heat flux of the stagnation points for HCLE and BCLE are 1.19 MW/m2 and 0.81 MW/m2, respectively.
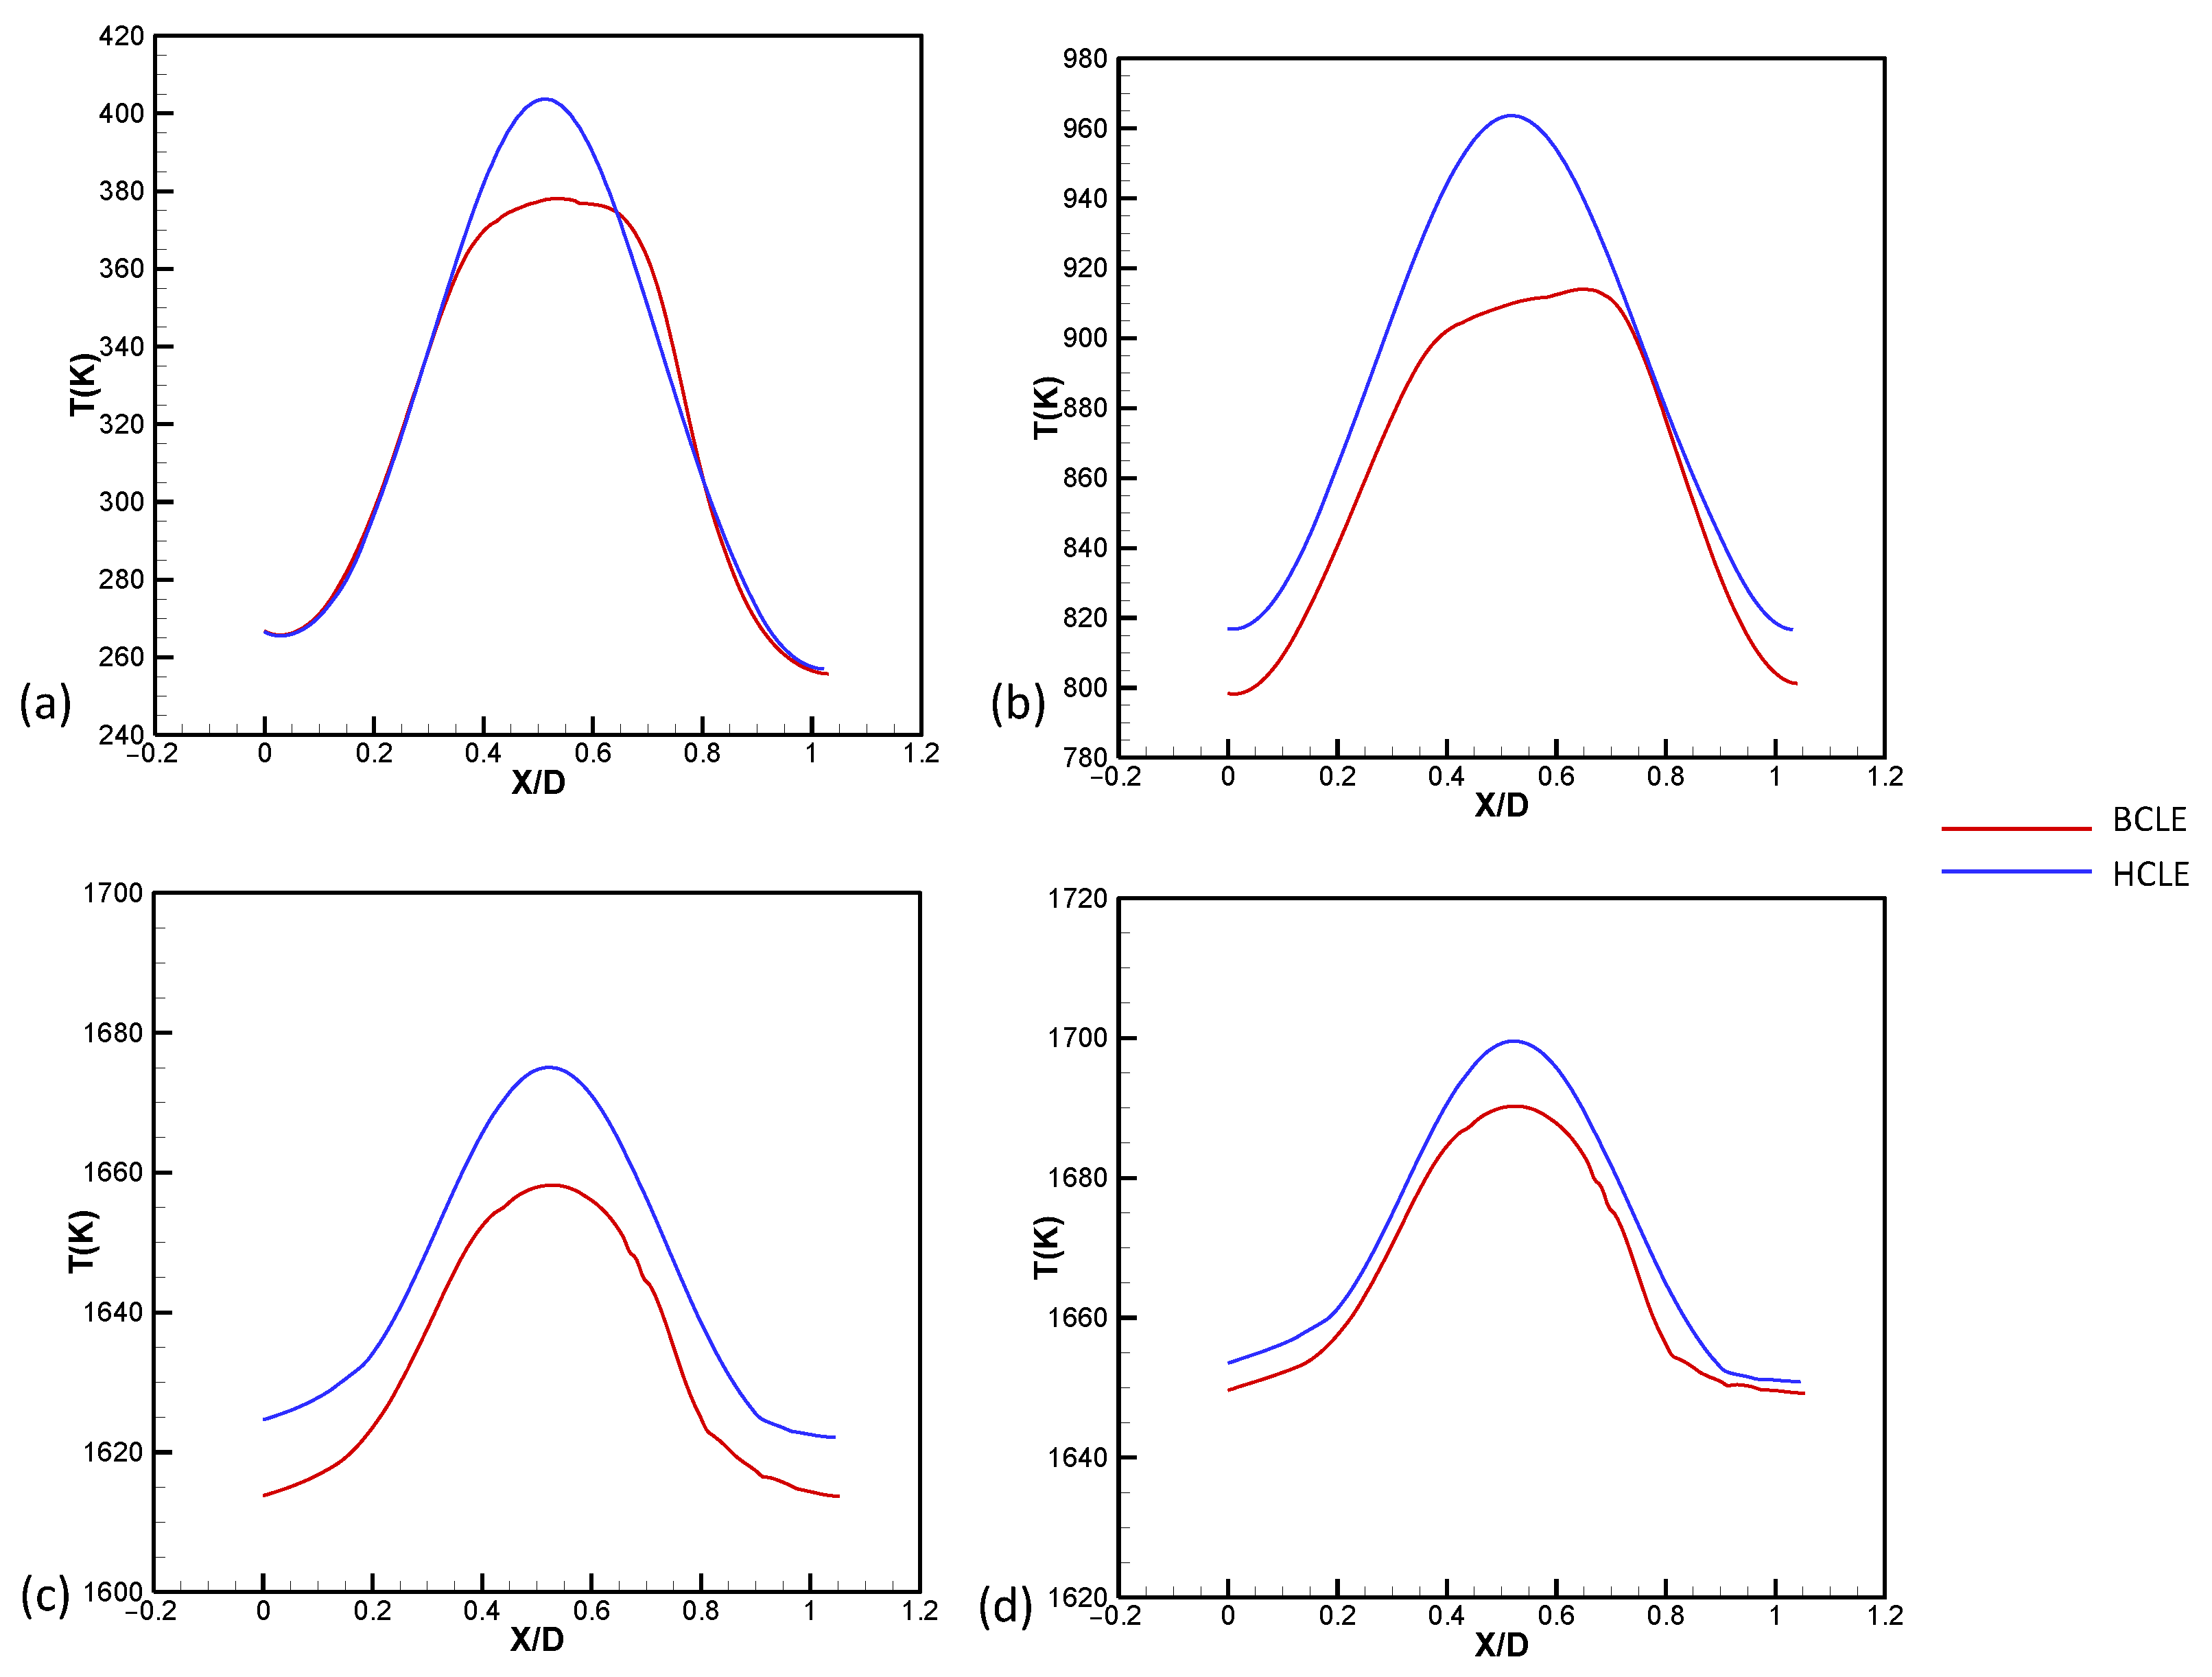
Figure 7 shows a comparison of the HCLE and BCLE temperatures at typical times. The stagnation point temperature of the BCLE at the initial moment is significantly lower than that of the HCLE. As time progresses, the stagnation-point temperature is approximately 30 K lower at 1 s and approximately 10 K lower at 2 s.
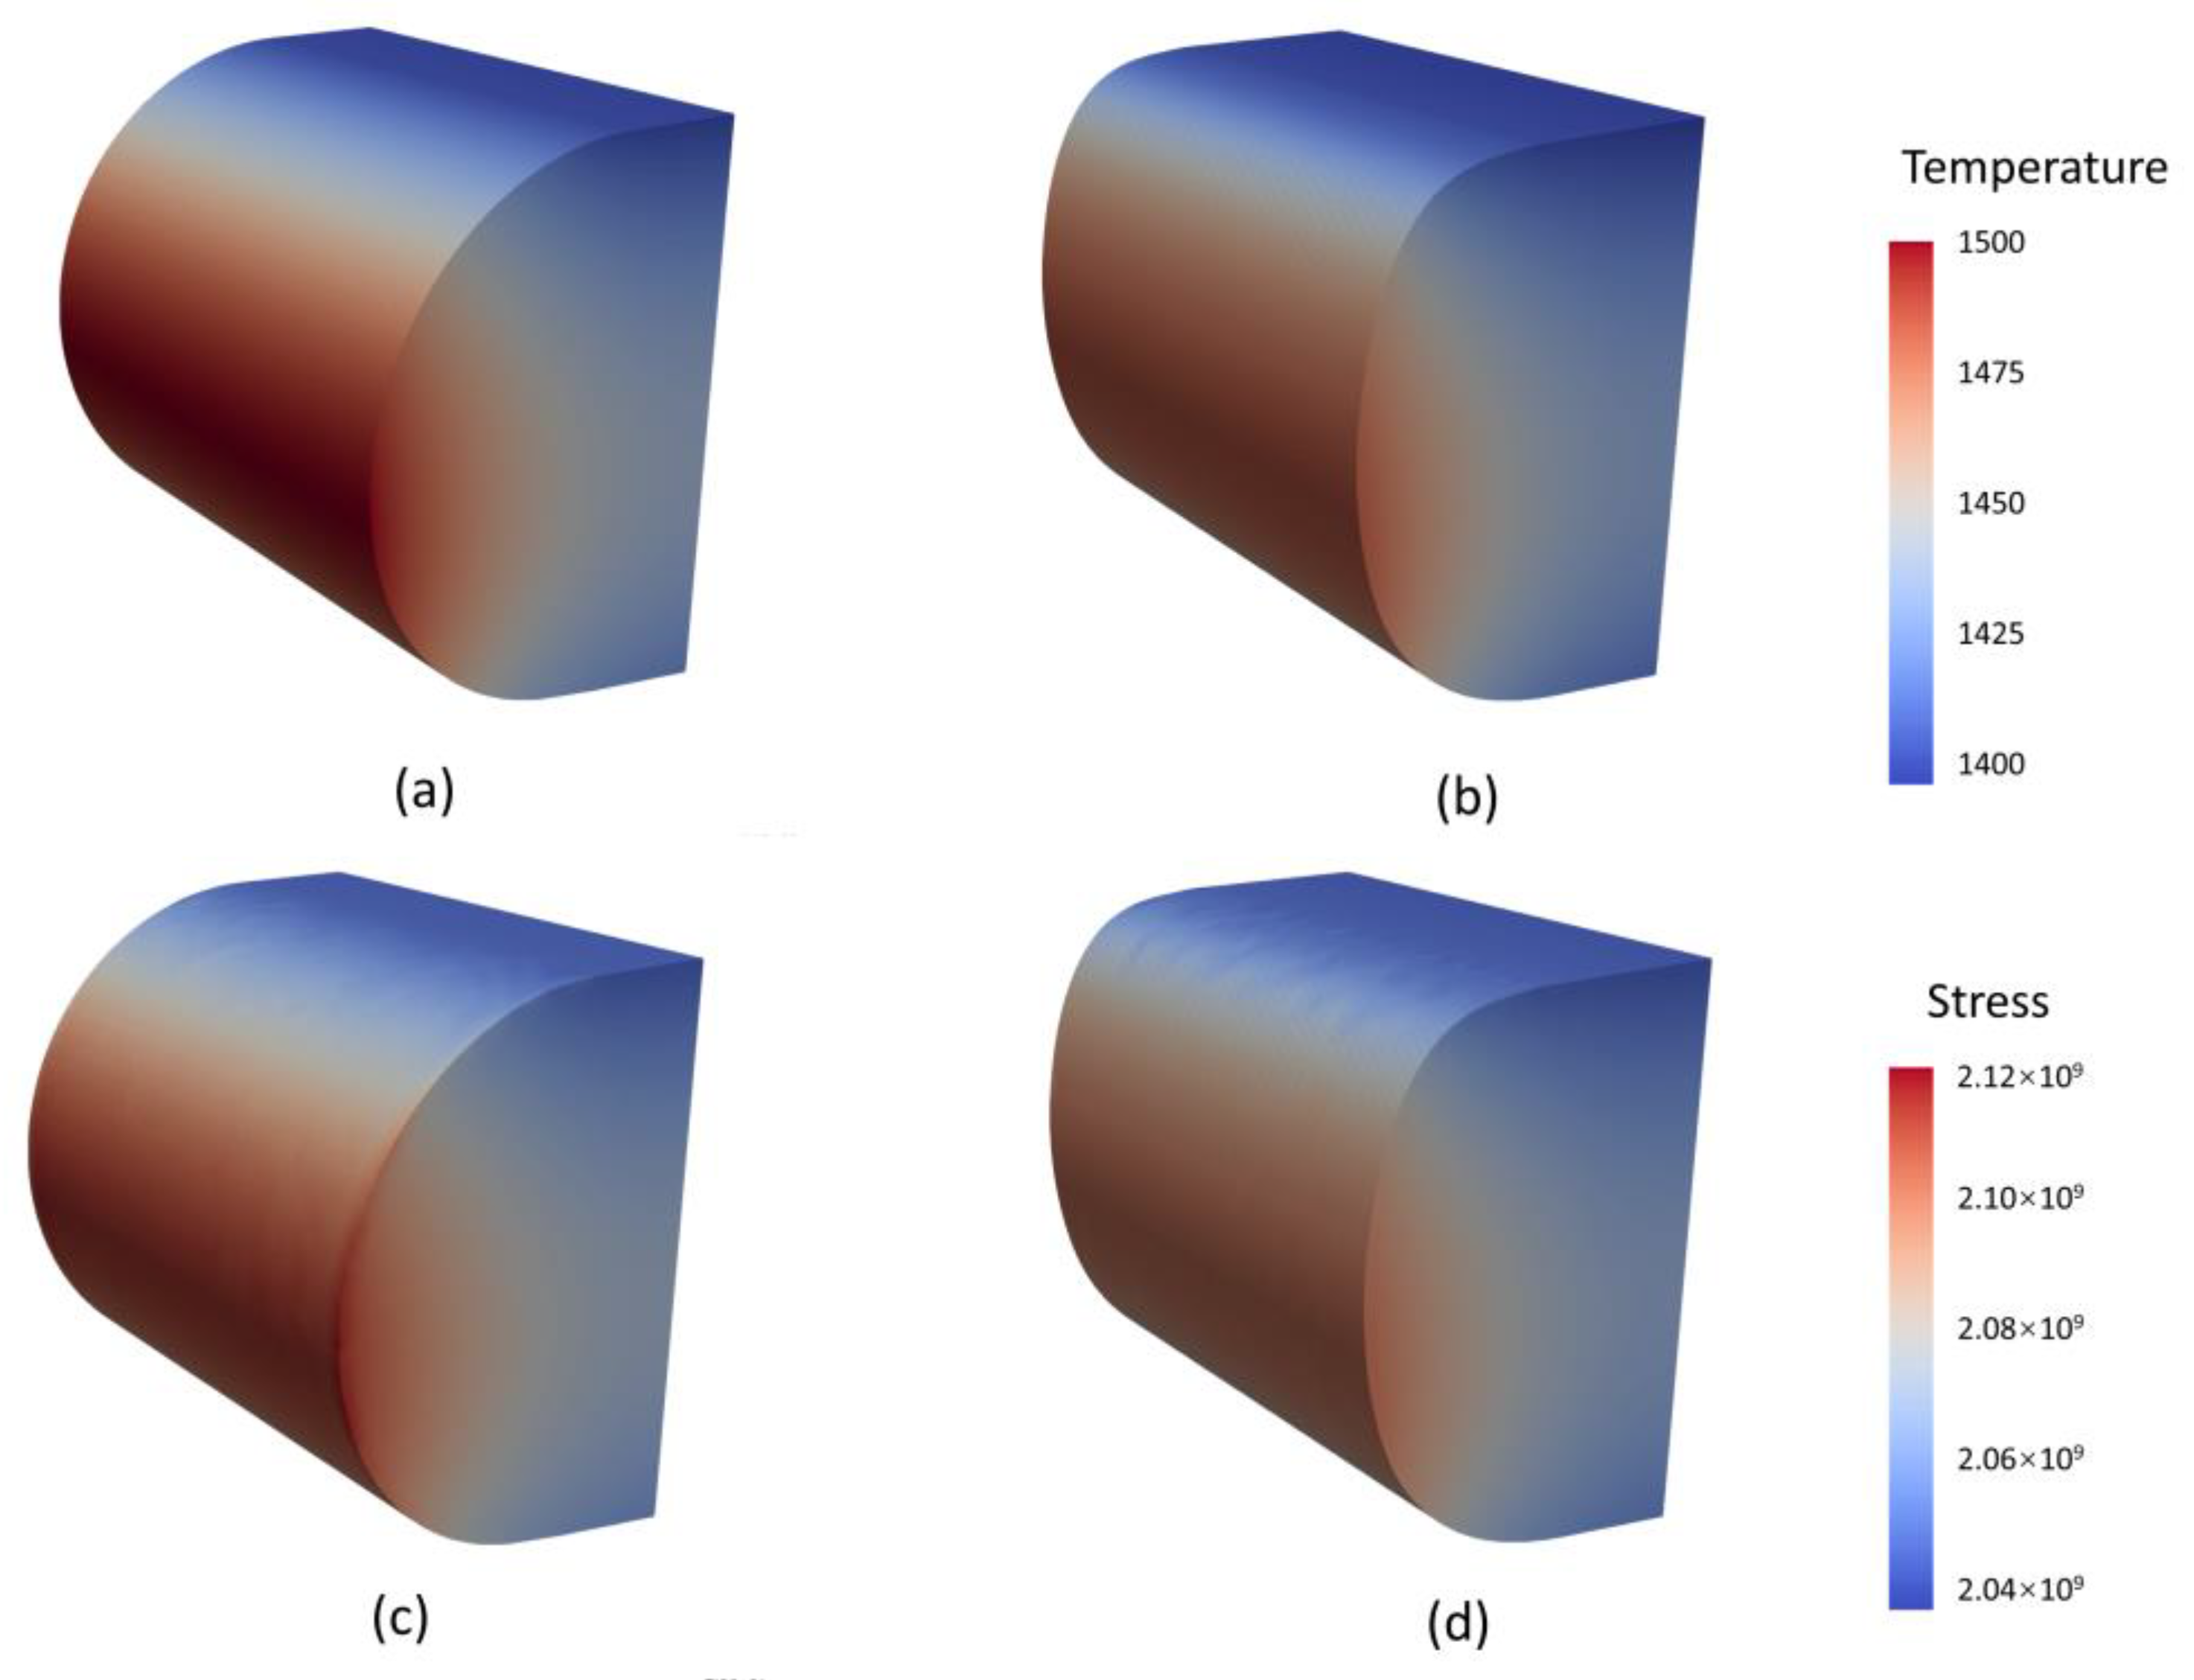
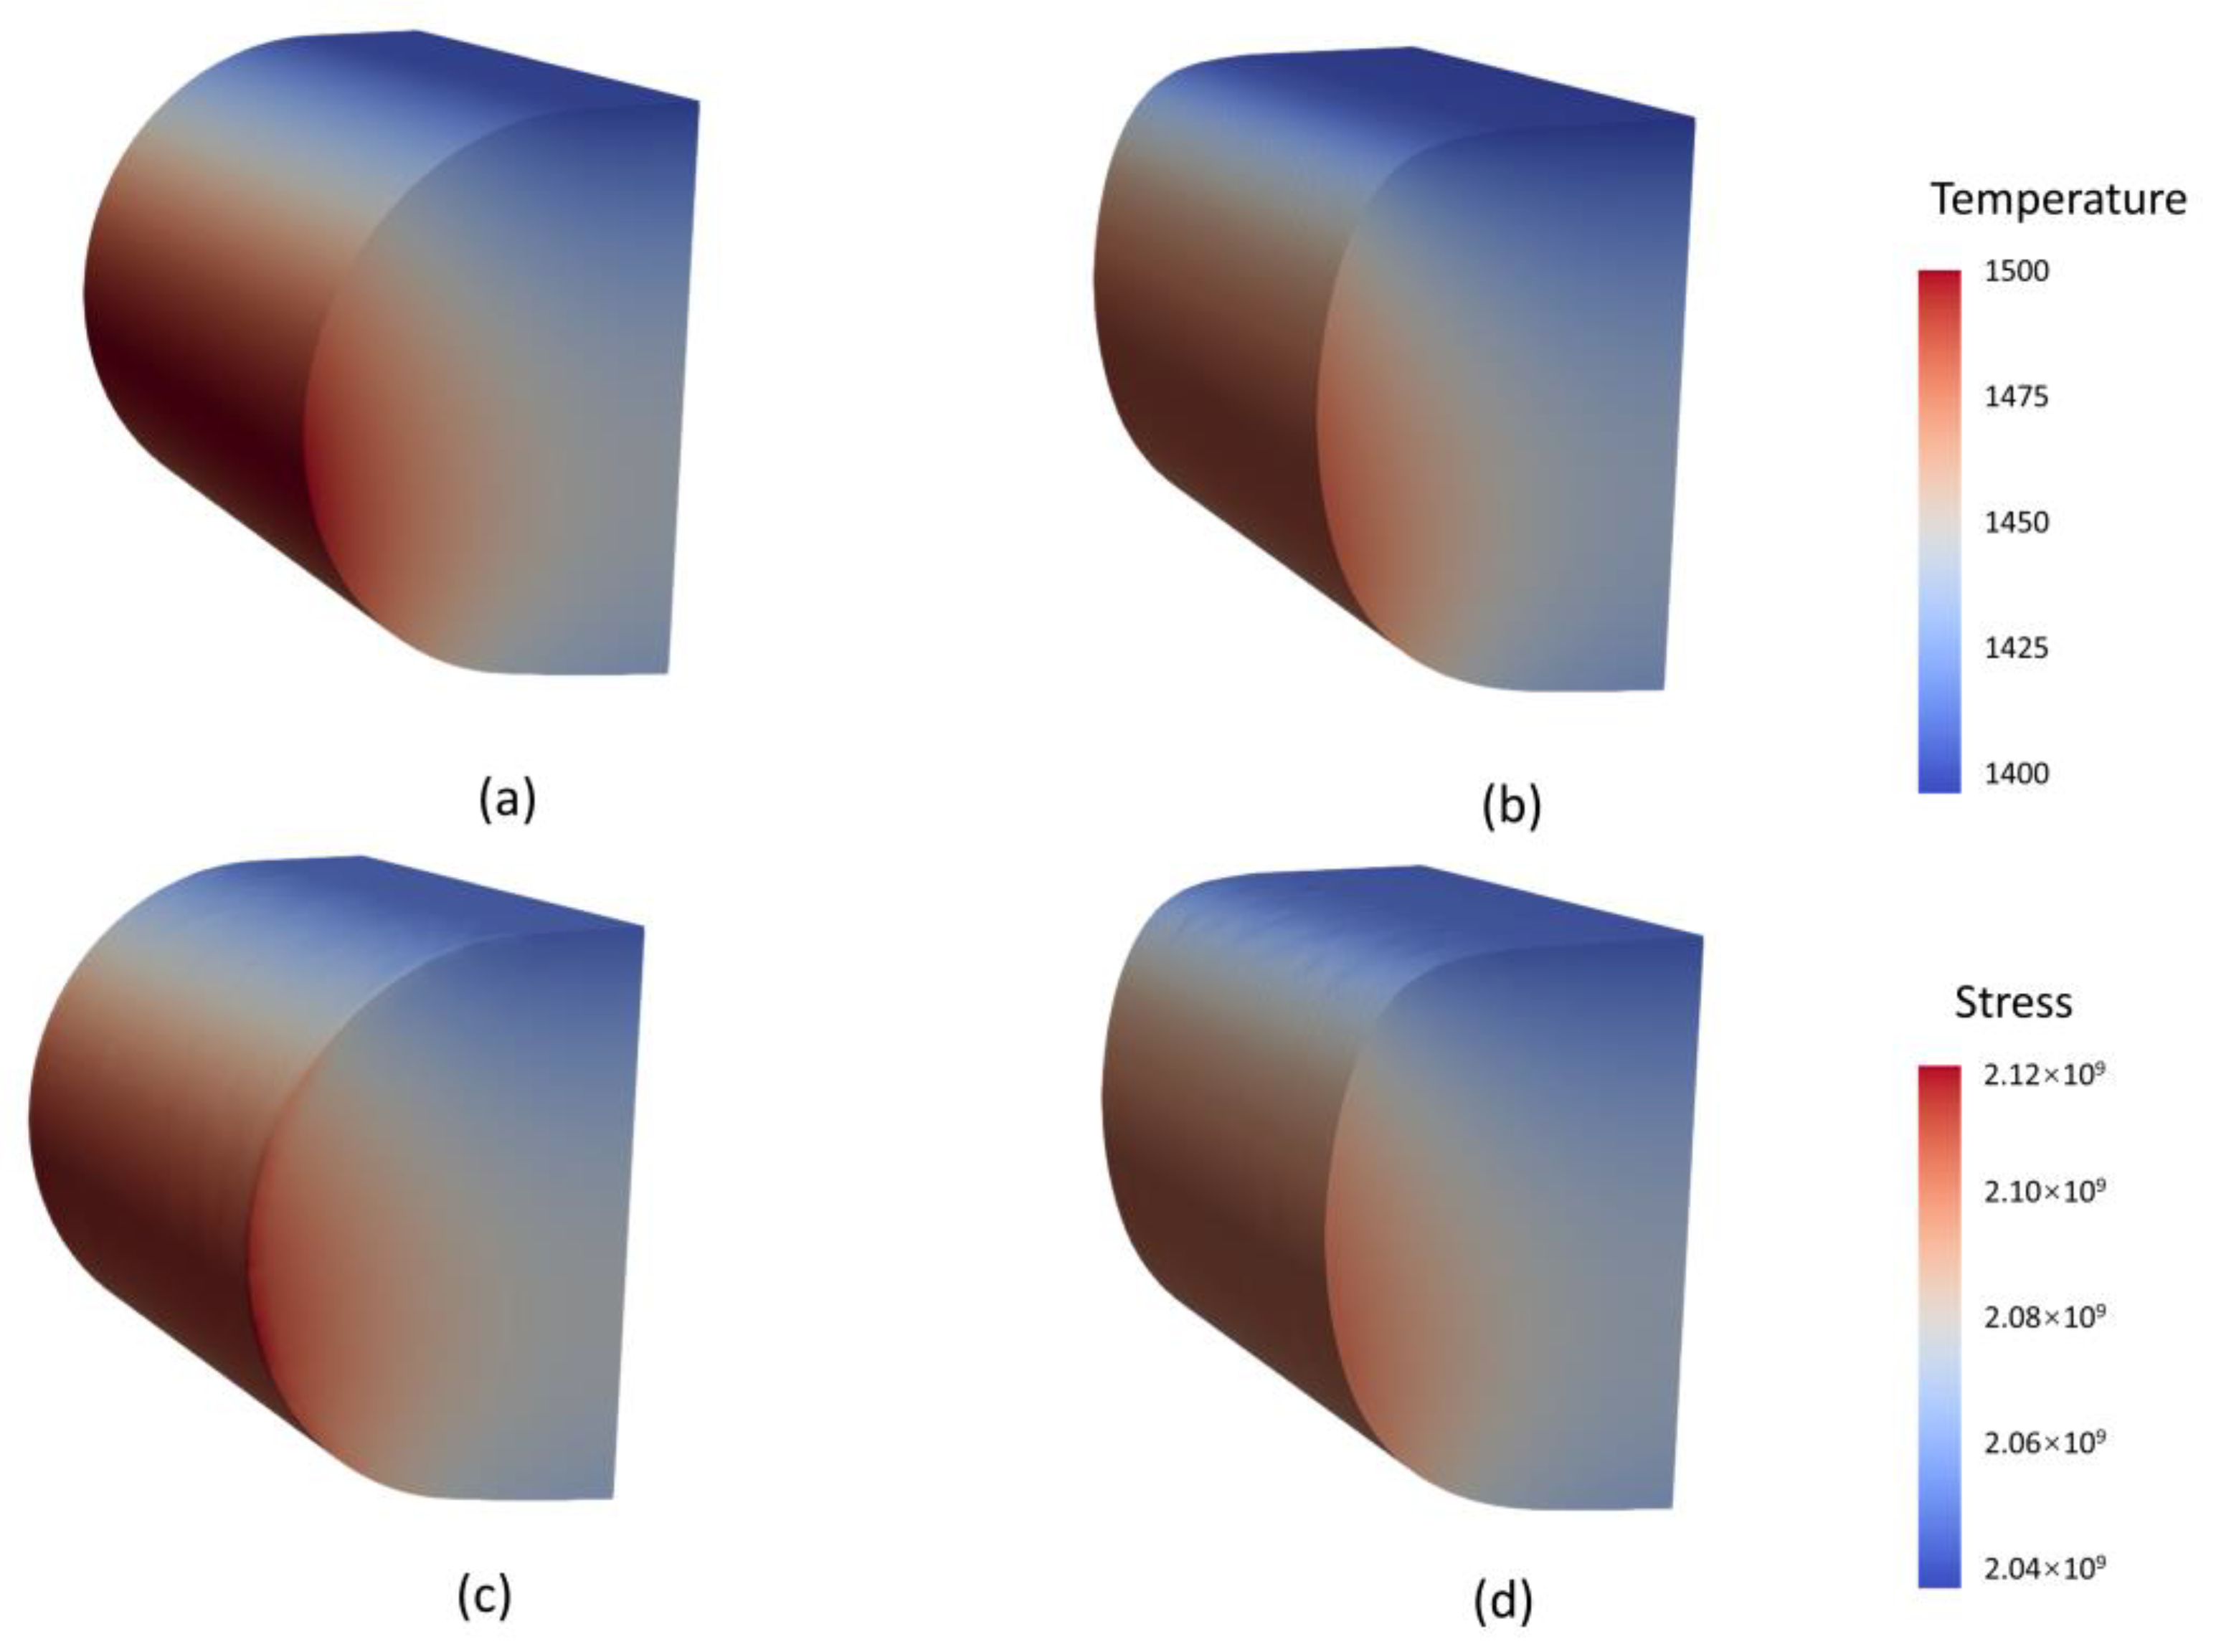
Figure 8 shows the temperature contour and the stress contour over time. With the advancement of the aerodynamic heating time, the temperature of the high-temperature region of the stagnation points of the leading edge gradually increased, resulting in the continuous increase in thermal strain and total deformation; meanwhile, the thermal strain of the high-temperature region of the stagnation point was also the largest. The body temperature of the leading edge reached the maximum at the tip, decreased in turn, and gradually became uniform with increasing heating time. The stress concentration occurs inside the structure near the leading edge, and it gradually extends to the deep area inside the structure over time. Figure 8 also shows a comparison of the temperature and stress distributions at the HCLE and the BCLE at typical times. The reduction in body temperature at the optimized leading edge resulted in a reduction in thermal strain and total deformation by 1.3%.
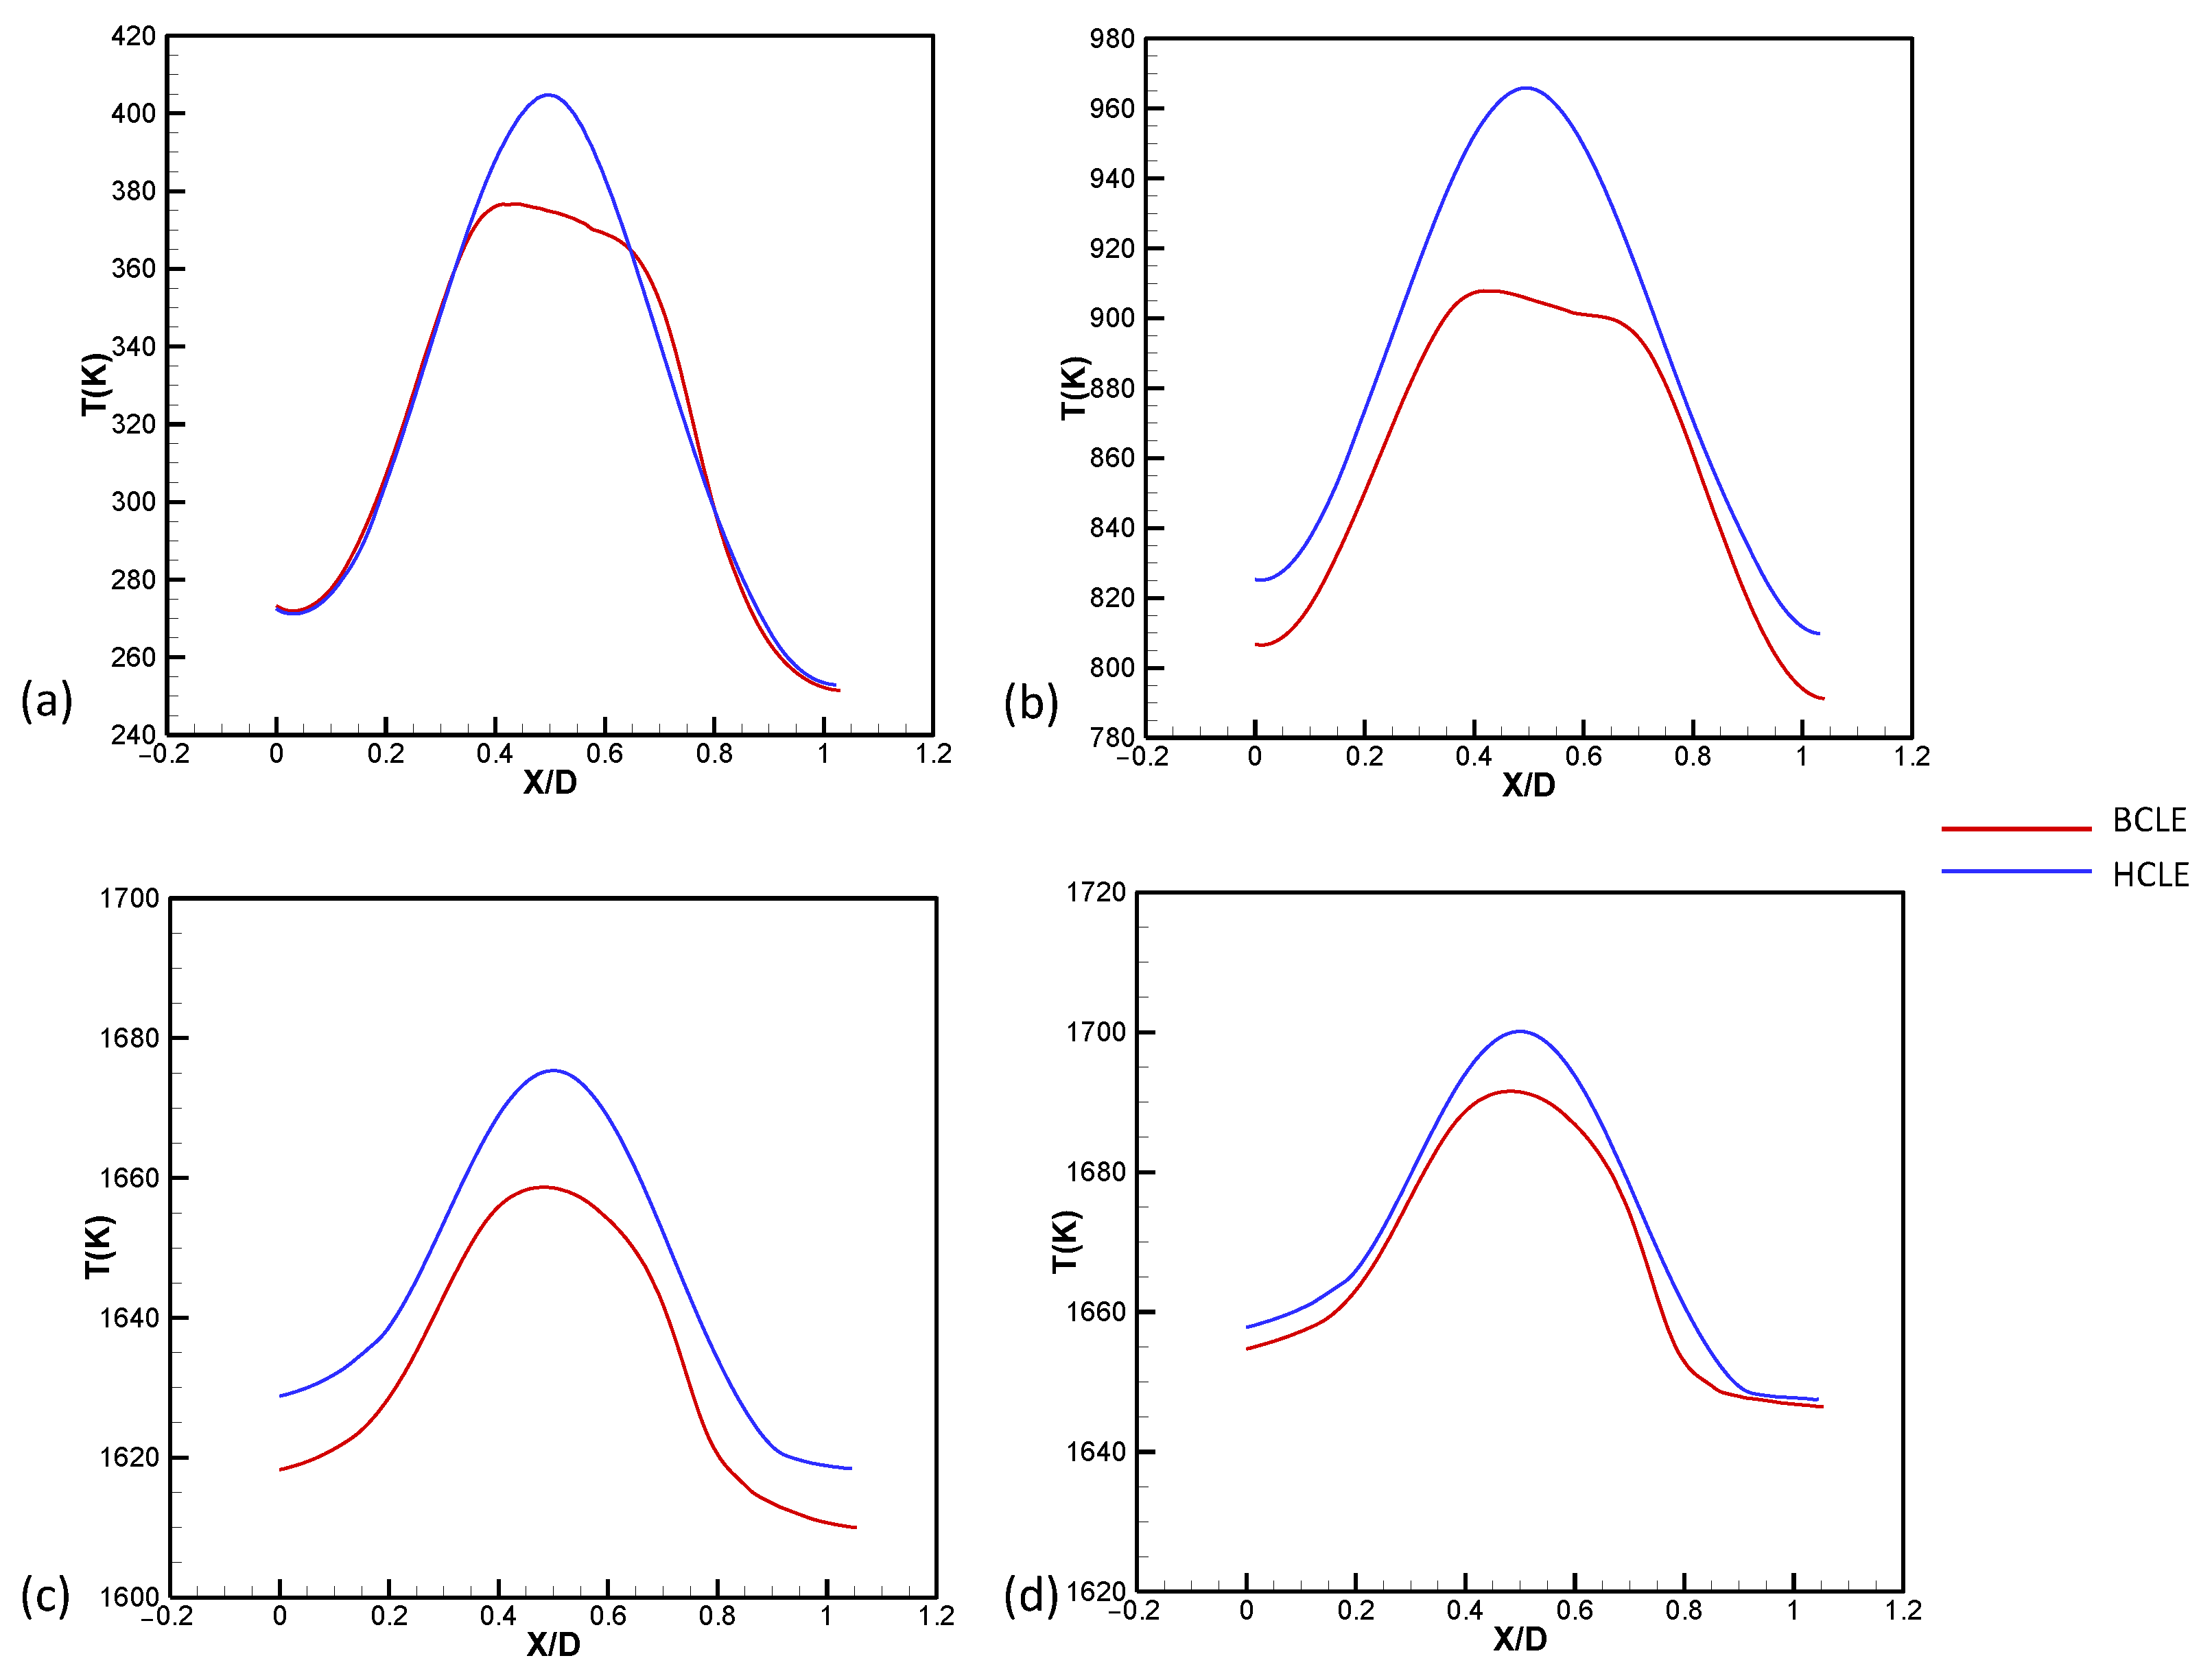
The influence of the angle of attack on the coupling characteristics of the leading edge is studied through numerical simulation under the condition of 0, 5, and 10 degrees of attack angle. Figure 9 shows a comparison of the temperature at the fluid–structure interface at AoA = 5°. The stagnation-point temperature of the optimized leading edge at the initial moment is significantly lower than that of the semicircular leading edge. As time progresses, the stagnation-point temperature is approximately 30 K lower at 1 s and approximately 10 K lower at 2 s. Figure 10 shows a comparison of the temperature and stress contours at the HCLE and the BCLE at AoA = 5°. The reduction in body temperature at the BCLE resulted in a reduction in thermal strain and total deformation by 1.1%.
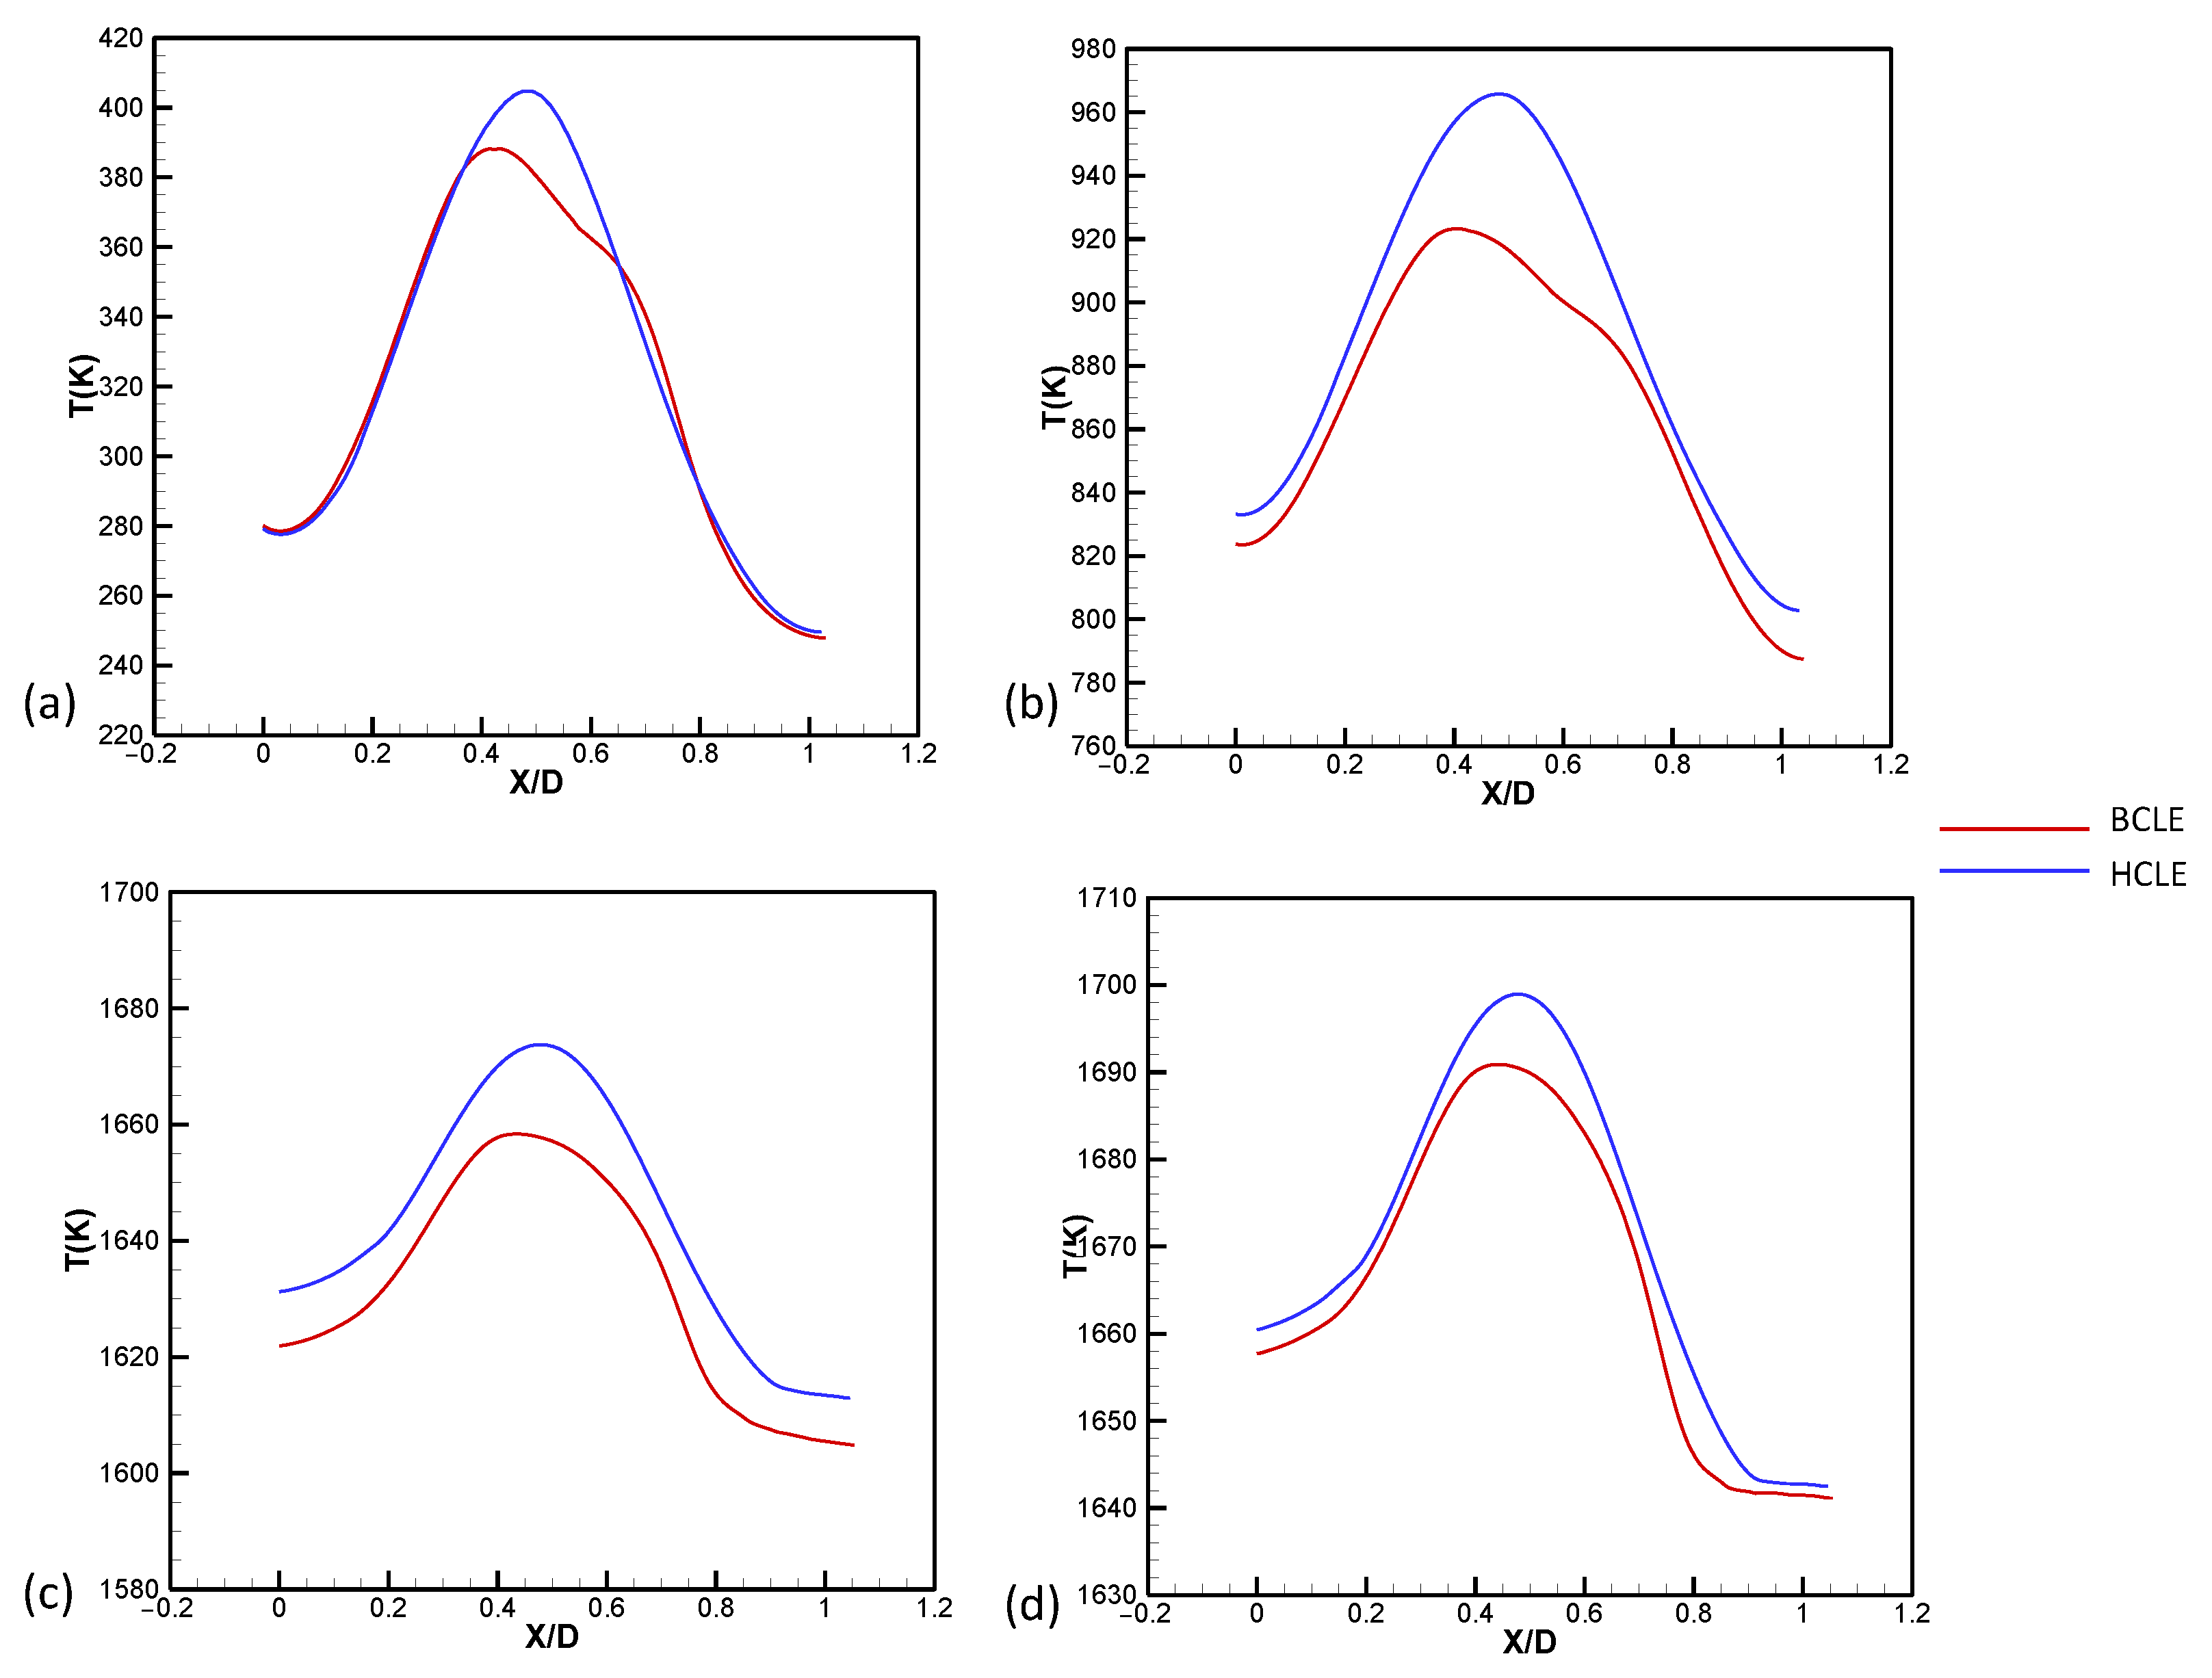
Figure 11 shows a comparison of the temperature at the fluid–structure interface at AoA = 10°. The stagnation-point temperature of the optimized leading edge at the initial moment is significantly lower than that of the semicircular leading edge. As time progresses, the stagnation-point temperature is approximately 18 K lower at 1 s and approximately 9 K lower at 2 s. Figure 12 shows a comparison of the temperature and stress contours at the HCLE and the BCLE at AoA = 10°. The reduction in body temperature at the BCLE resulted in a reduction in thermal strain and total deformation by 1.1%.
In summary, compared with the HCLE, the heat flux at the stagnation point of the BCLE is significantly reduced, which reduces the thermal load of the leading edge. The BCLE is still effective in the positive angle-of-attack condition.

4.2. Hypersonic Vehicle

4.2.1. Geometry and Grids

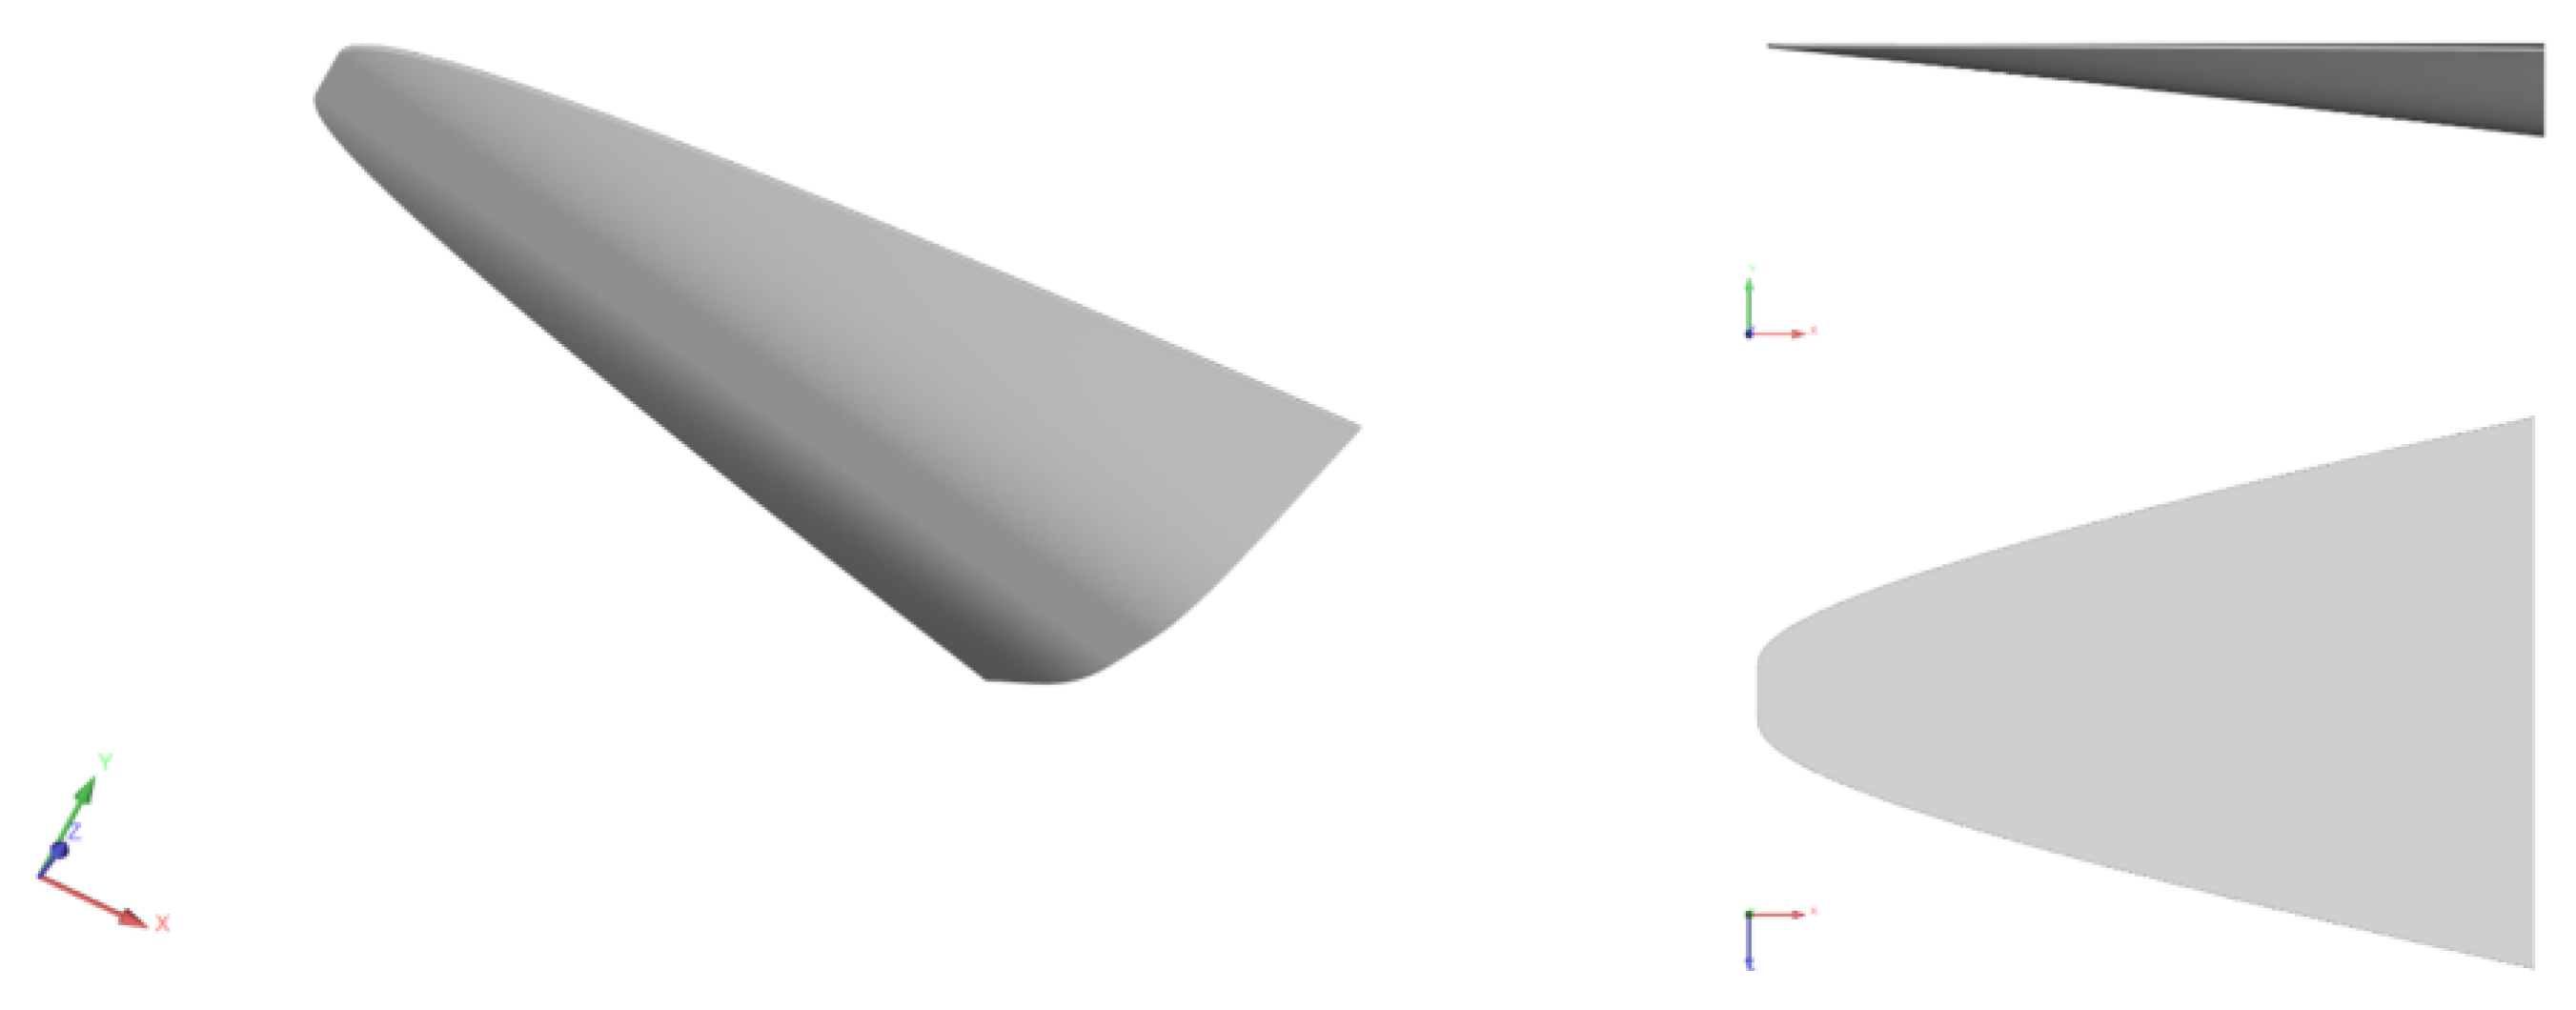
In this section, the multifield coupling simulation of the 3D hypersonic vehicle based on the HCLE and the BCLE are carried out. The waverider is generated by the osculating cone method. A schematic diagram of the model is shown in Figure 13. Figure 14 shows the configuration of the leading edges of the hypersonic vehicles based on the HCLE and the BCLE. We designed three computational models, in which the HCLE and the BCLE are hypersonic vehicles with a blunt diameter of 15 mm, and BCLE2 is a hypersonic vehicle with a blunt diameter of 12 mm. The material properties of the titanium alloy are used for the leading edge. Internal instrumentation is not considered. The radiation effect of the wall is considered. For all simulations, a time step size of 0.1 s and second-order accuracy in time discretization were used. The freestream-flow conditions of the numerical simulation in this section are as follows: the altitude is 30 km and the Mach number is 6.0.
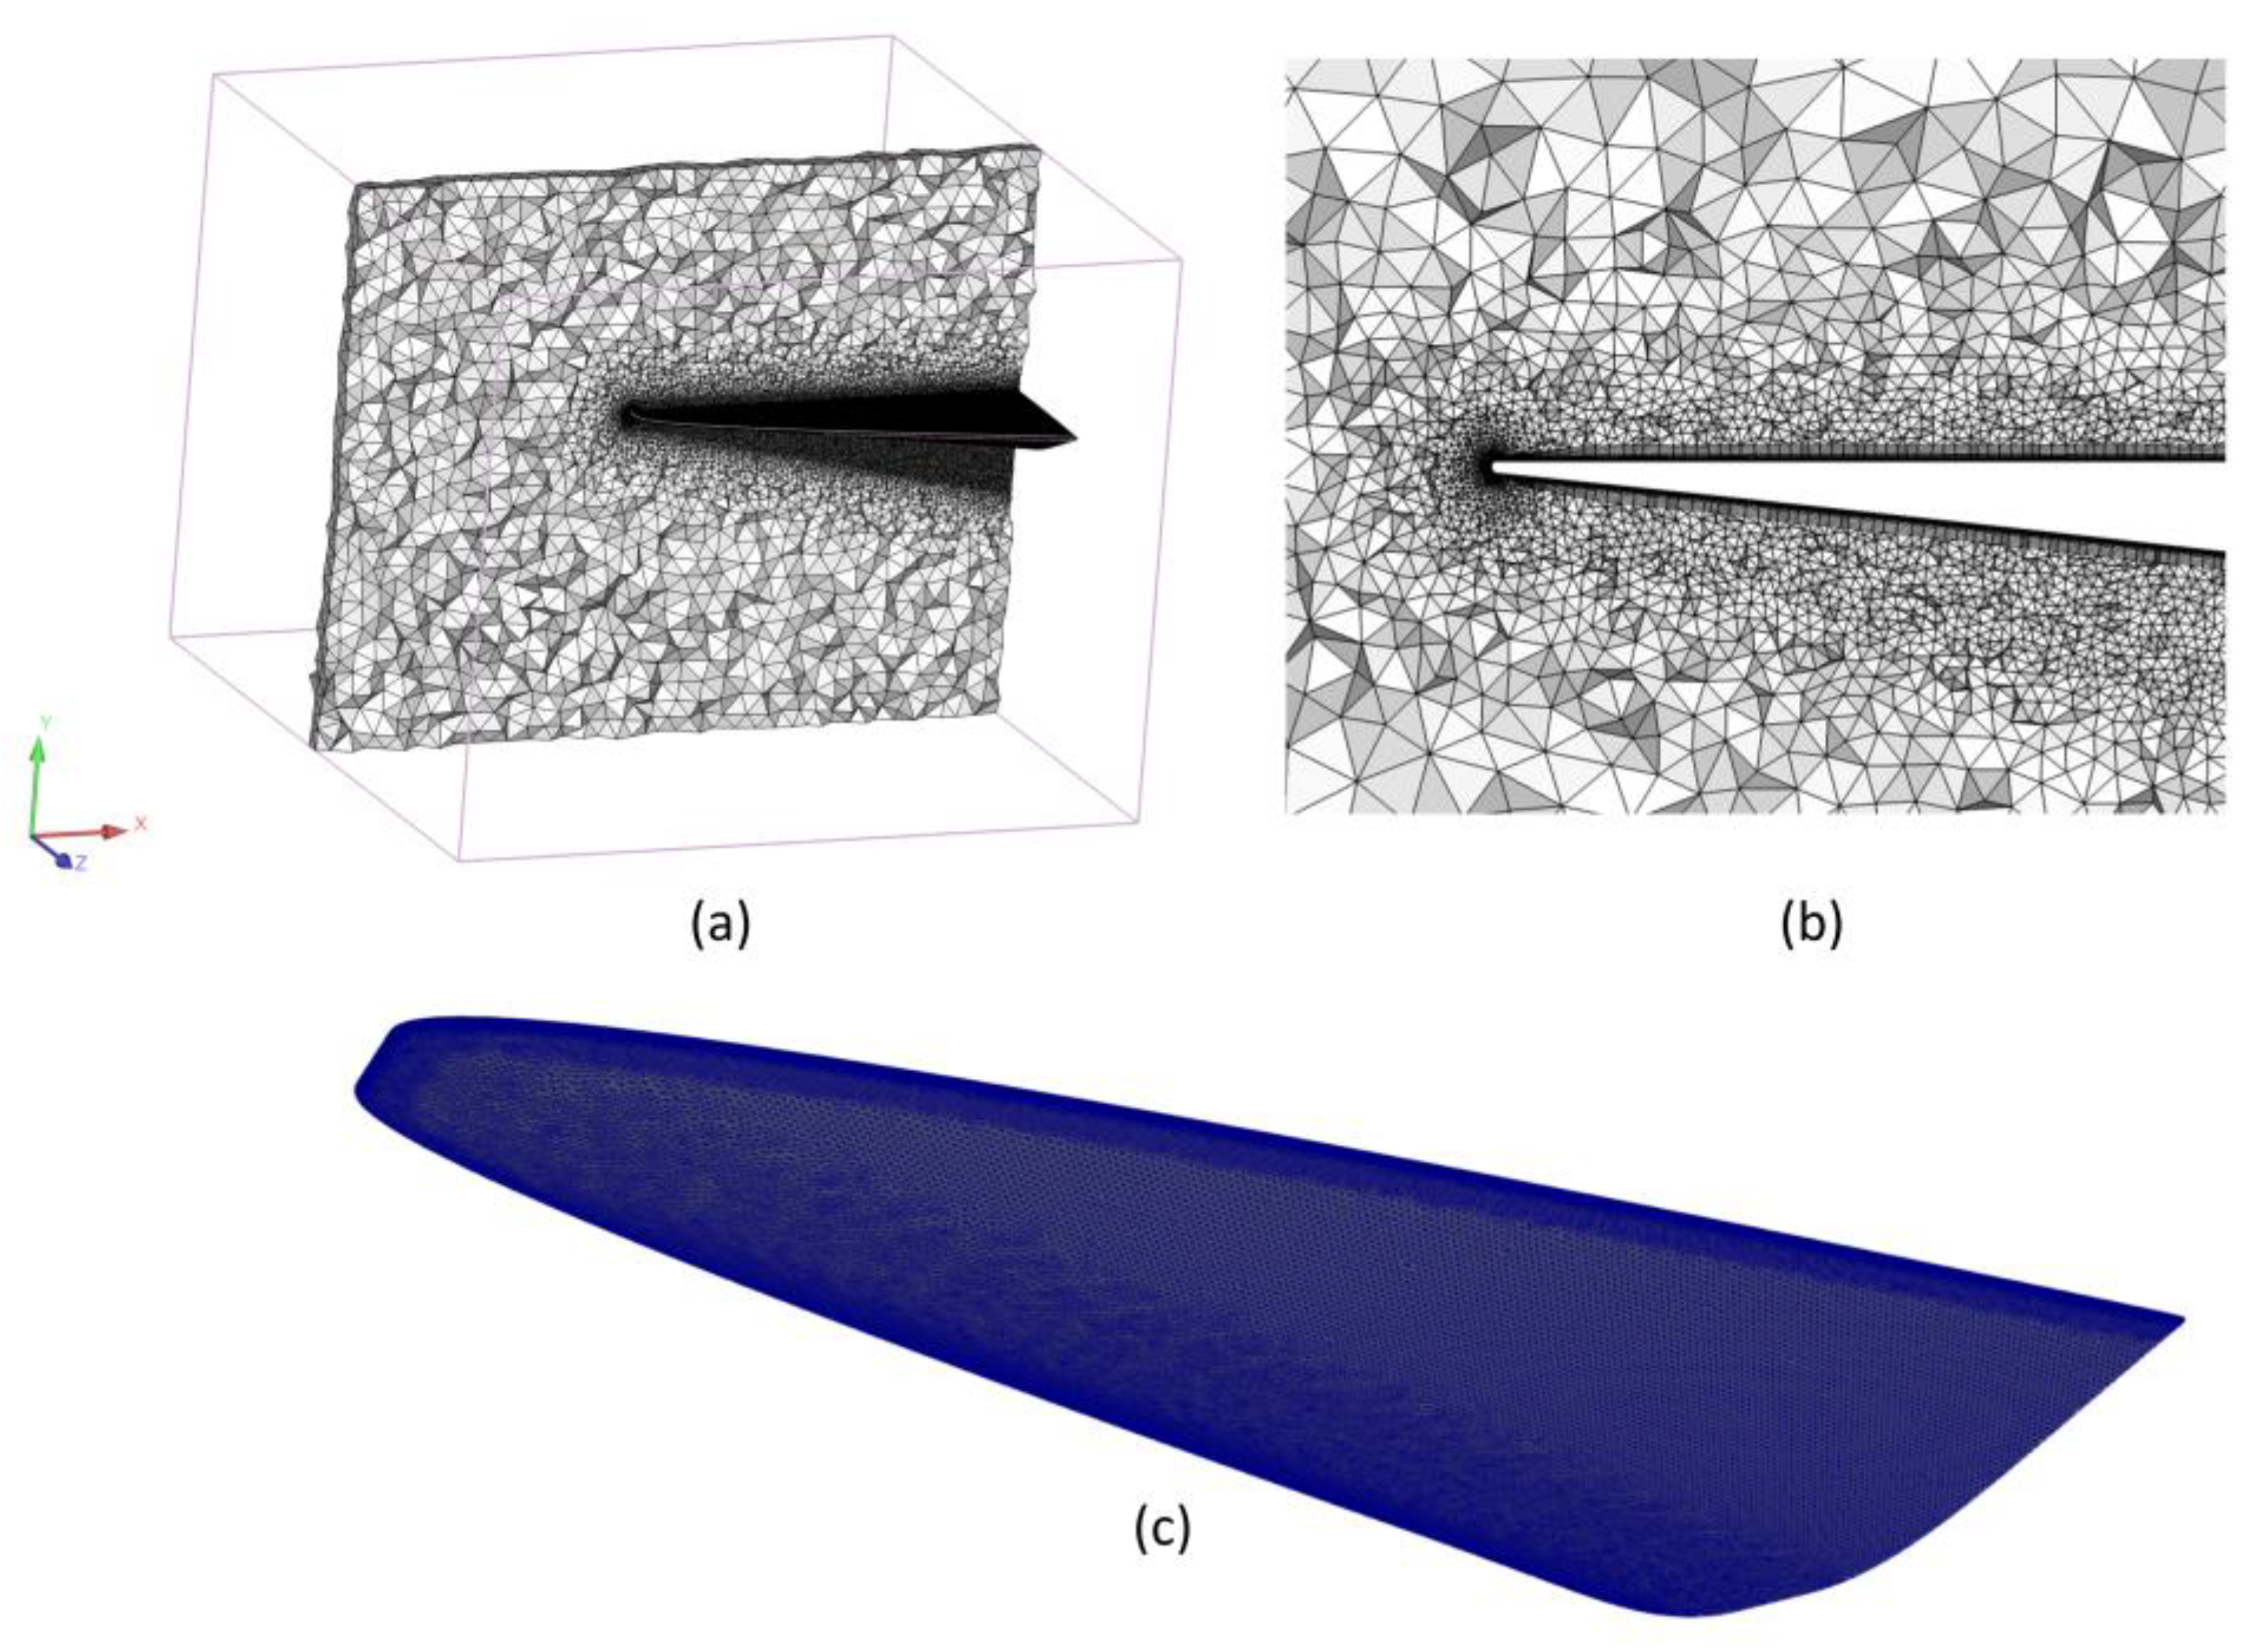
The CFD and CSD meshes used are shown in Figure 15. For each fluid domain, hybrid unstructured meshes composed of tetrahedrons and prisms are generated as CFD meshes. Prism elements are adopted near the wall to ensure accurate resolution of the boundary conditions. The CFD grid is composed of approximately 17 million elements. For each structure domain, unstructured meshes composed of tetrahedrons are generated, which is approximately 5 million elements. To ensure independence of the computational grid used, a mesh convergence study is performed for the hypersonic vehicle model. Three different mesh sizes, ranging from 12.6 M to 24.3 M CFD mesh elements and 3.8 M to 7.3 M CSD mesh elements, are generated for the HCLE model. Mesh convergence study parameters are shown in the Table 2. The maximum temperature changed by only 0.55% (less than 1%) between medium and fine meshes. The medium meshes achieve suitable accuracy and are used for subsequent simulations.

4.2.2. Results

The pressure contours at the symmetry plane of the CFD grid are shown in Figure 16. The oblique shock of the wave rider and the bow shock caused by the blunt leading edge can be observed. The contours of pressure on the three models are similar, and the main difference is reflected in the vicinity of the leading edge.
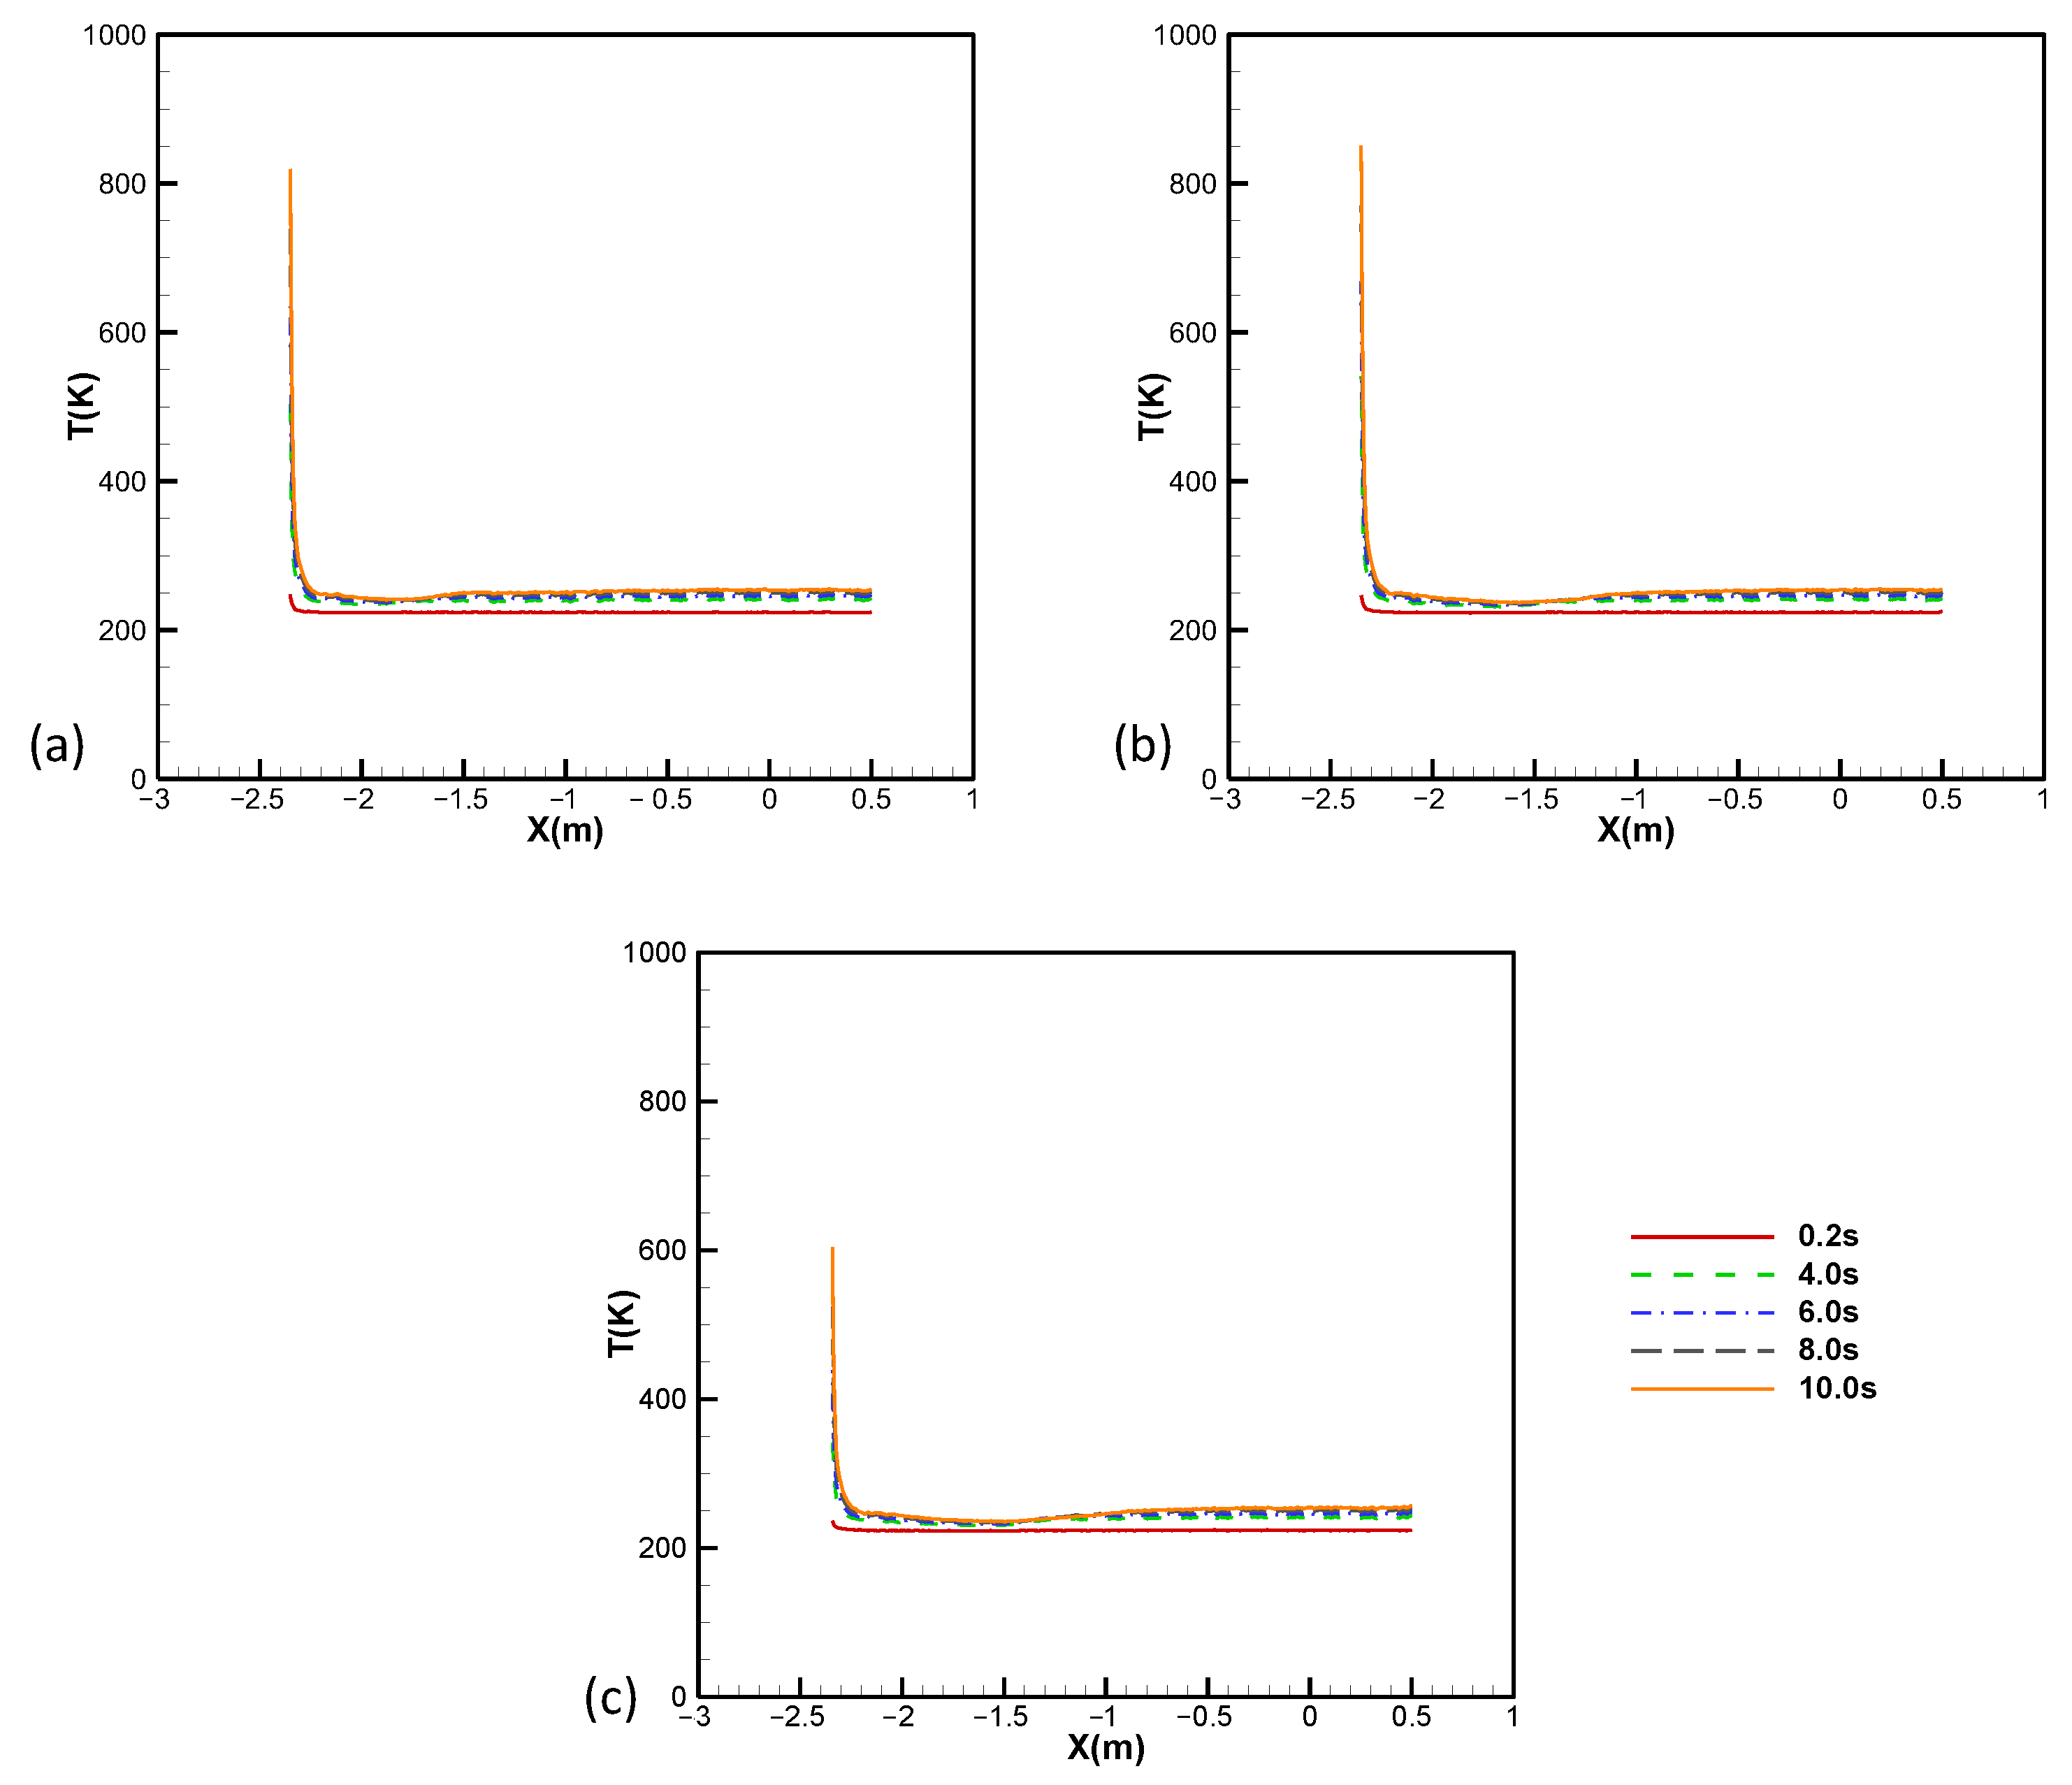
Figure 17 shows a comparison of the temperature at the upper surface of the hypersonic vehicle. The upper surface temperatures of the HCLE and the BCLE are similar, and the temperature gradient is the largest near the leading-edge region. The heating of the leading-edge region is faster over time than that of the other regions. Compared with the other two models, the temperature gradient of the BCLE2 model is reduced by 22%. The strengths of the BCLE2 model are shown.
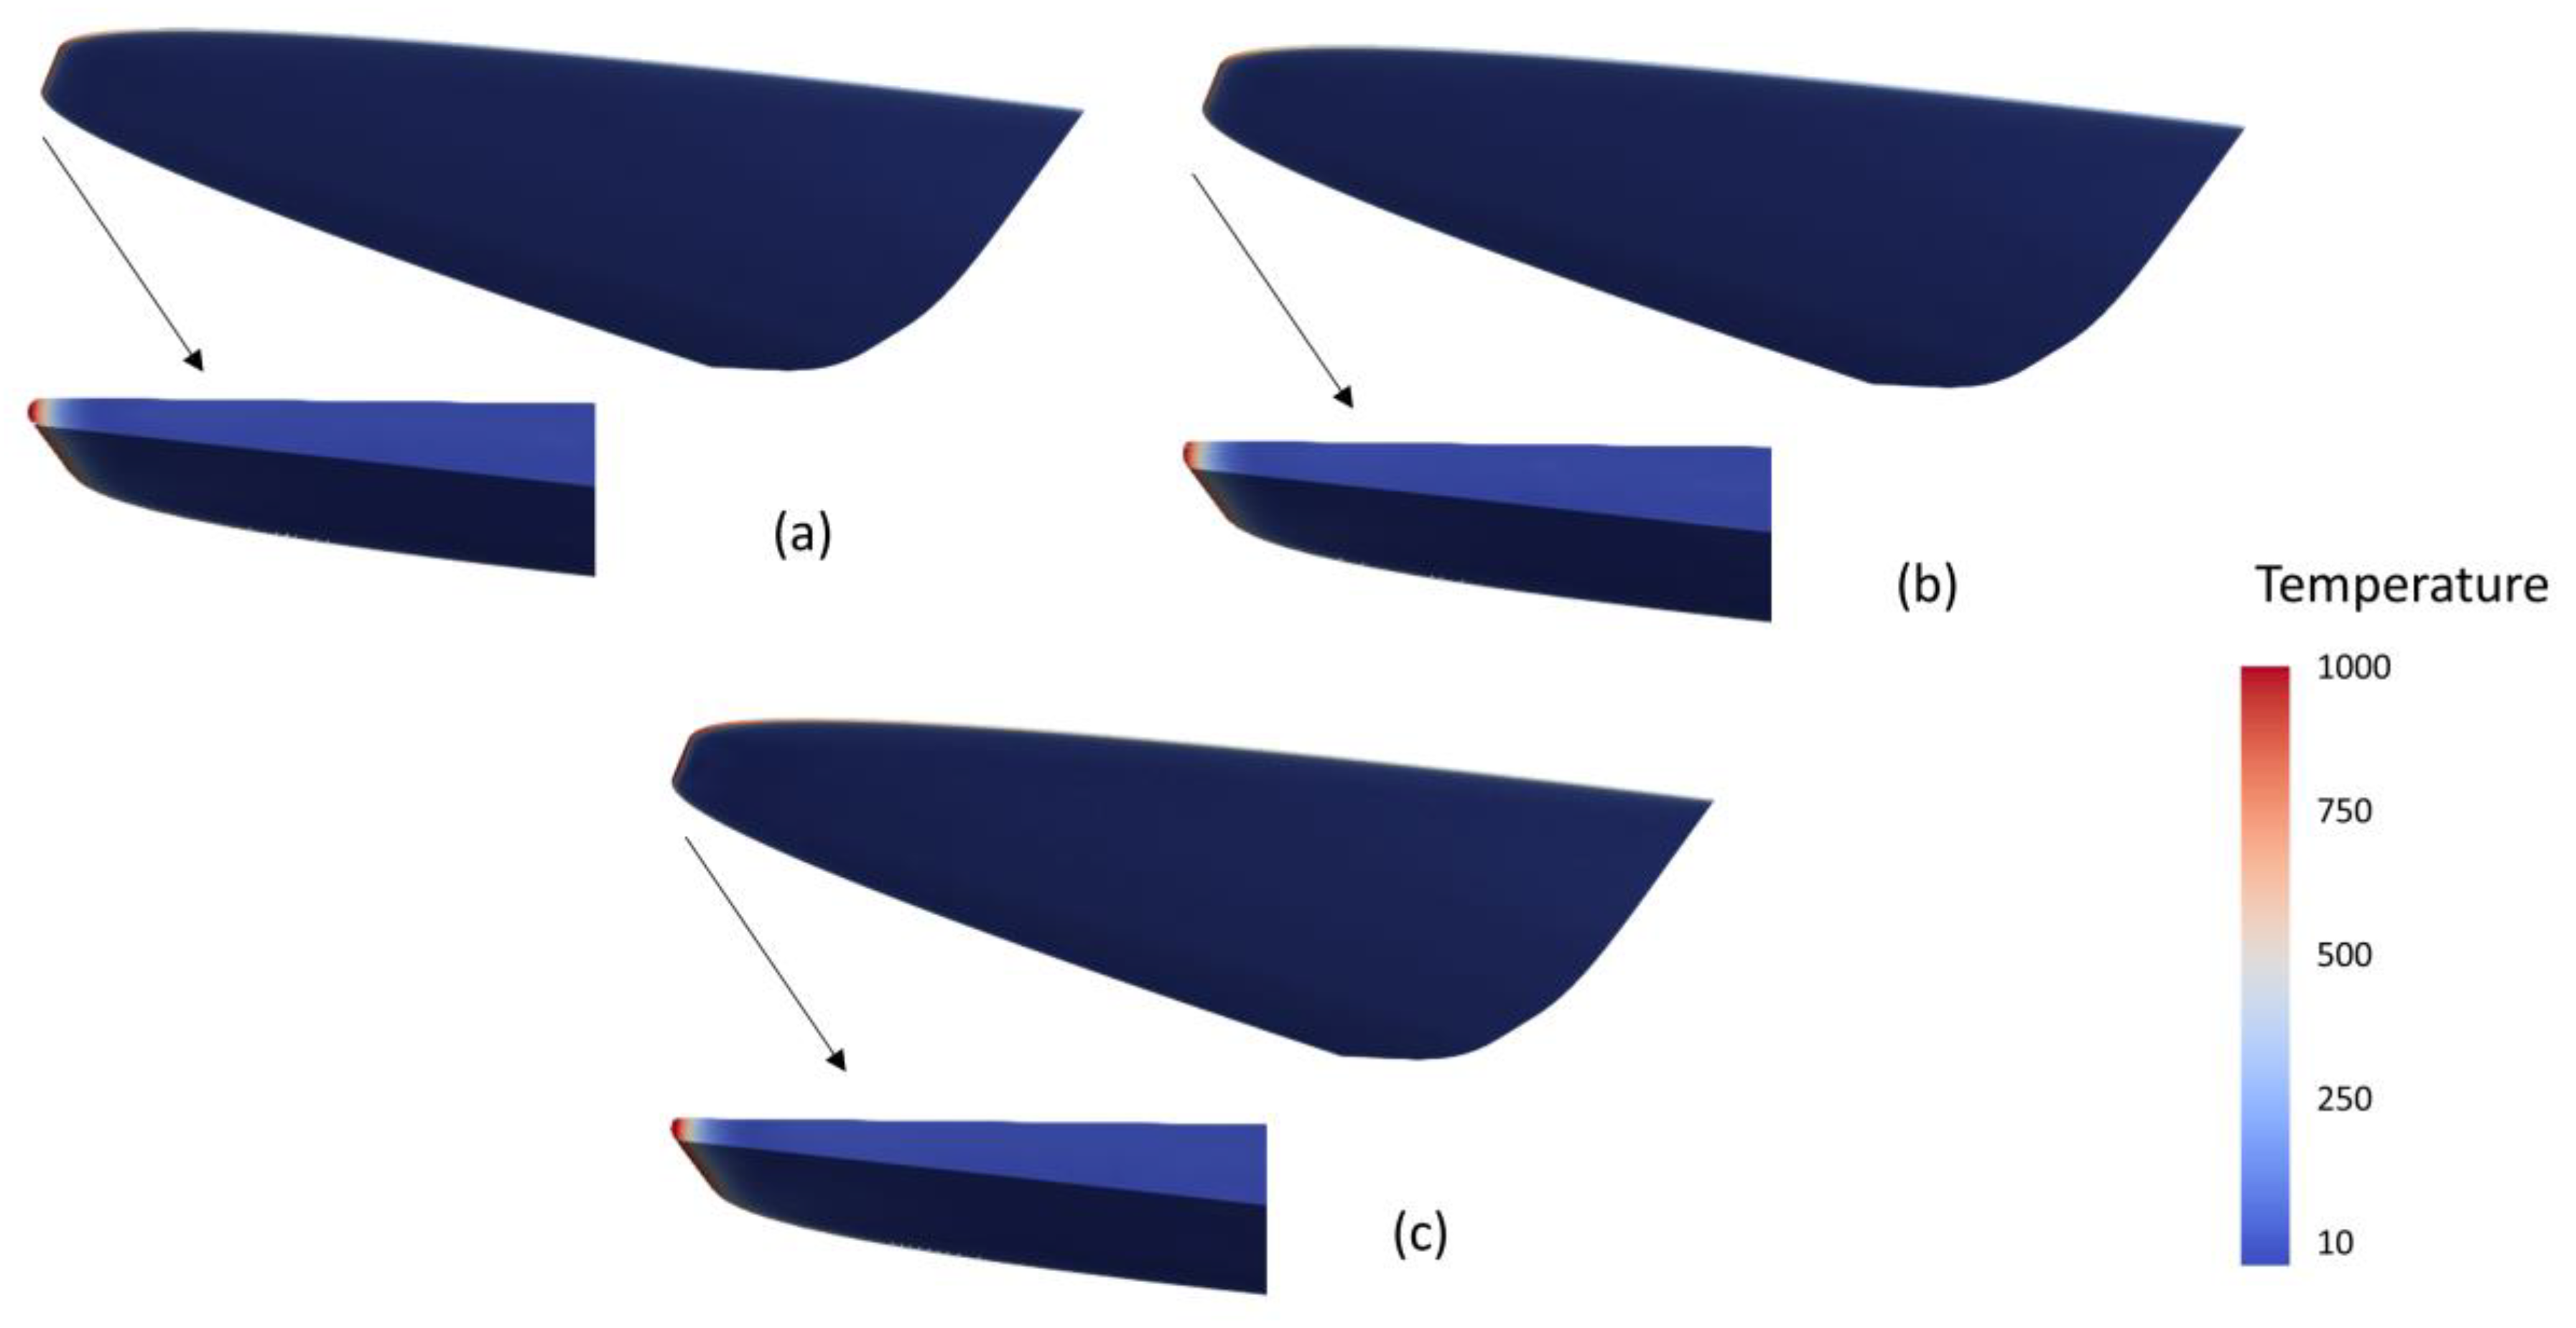
Figure 18 shows the three-dimensional temperature distribution after propulsion for 10 s. With the advancement of the aerodynamic heating time, the temperature of the high-temperature region of the leading-edge stagnation points gradually increased. The body temperature of the leading edge reached the maximum at the leading edge. It can be seen that the maximum temperature of the three-dimensional hypersonic vehicle based on the BCLE is lower than that of the HCLE by 3.9%, and the overall temperature gradient of the hypersonic vehicle is reduced. It is shown that the BCLE still has the effect of reducing the temperature in the lower surface of the hypersonic vehicle.
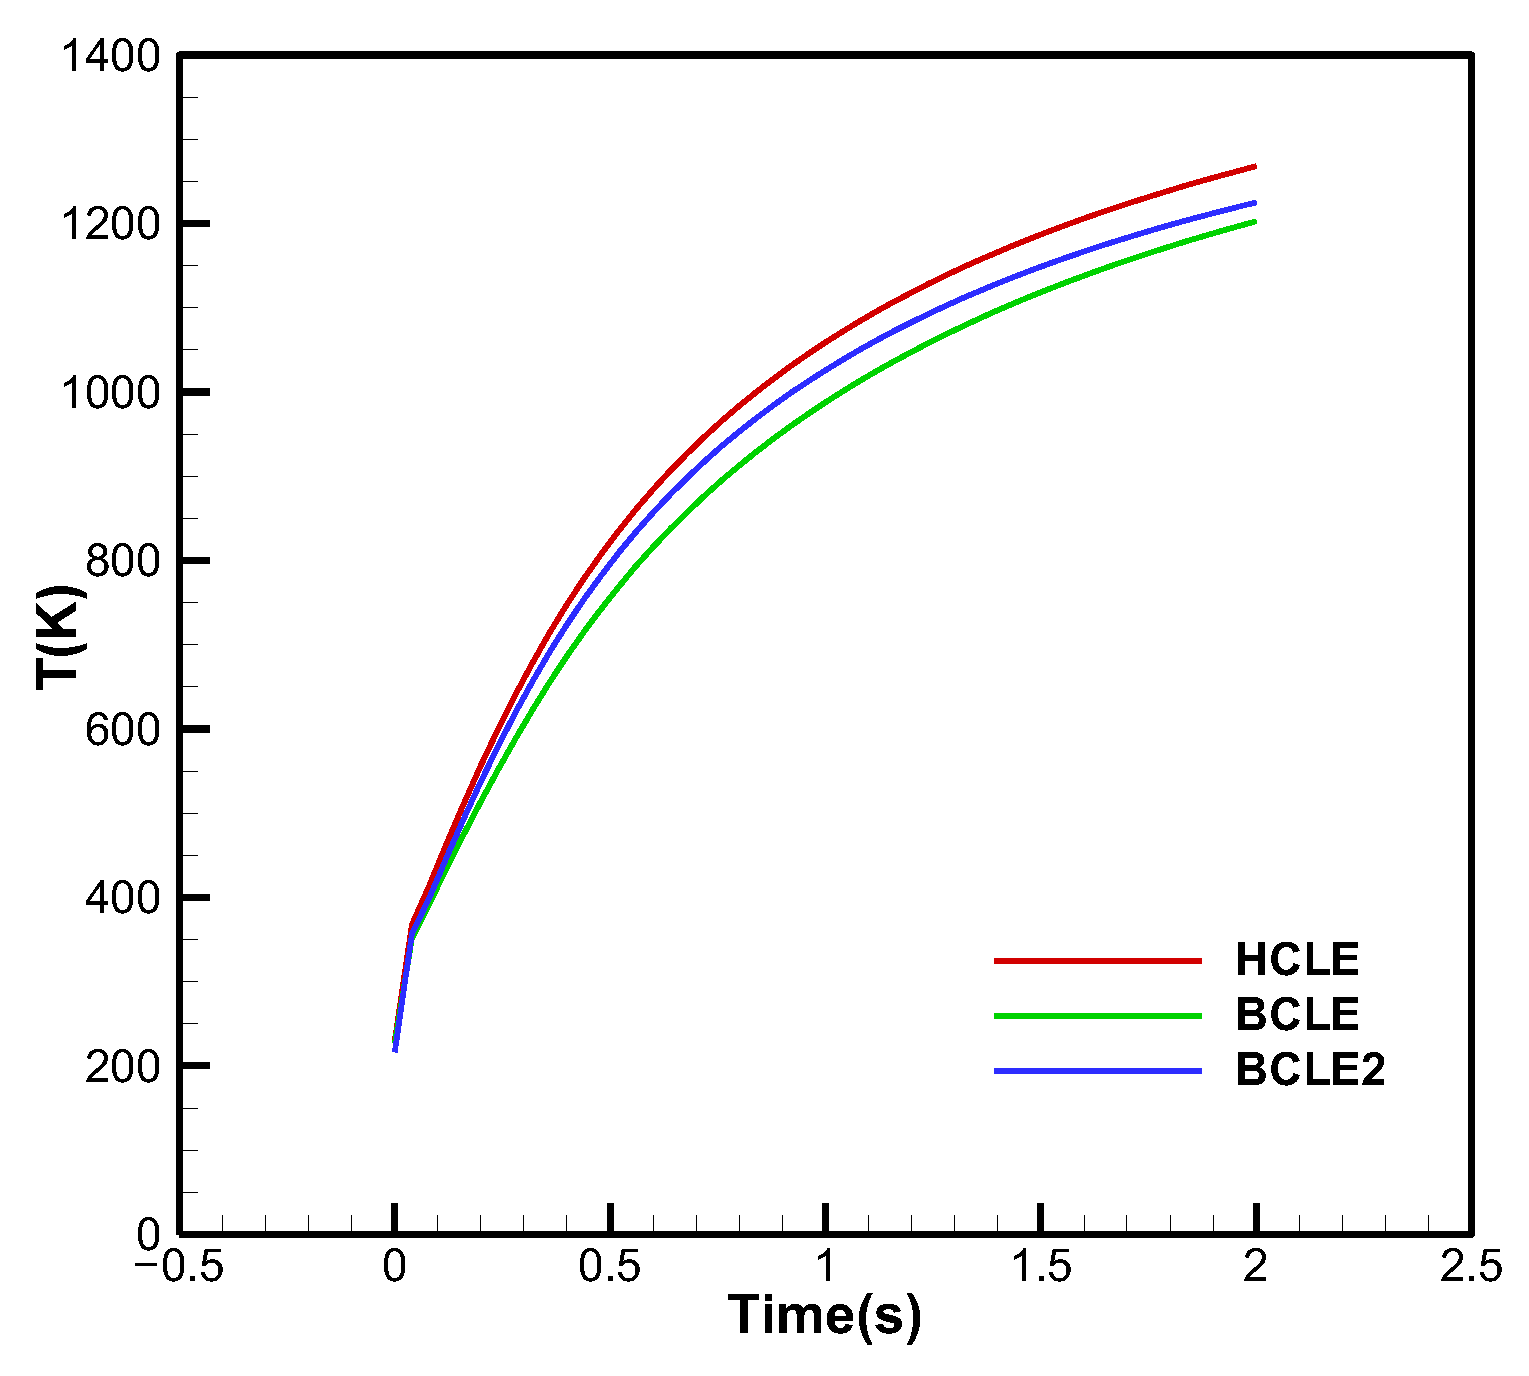
Figure 19 shows a comparison of the temperature at the stagnation point of the hypersonic vehicle. As time progresses, the stagnation-point temperature of BCLE is approximately 72 K lower at 1 s, and approximately 66 K lower at 2 s, than in the HCLE.
Table 3 shows the flow parameter results of the three models. First, the maximum heat flux and temperature of the BCLE are reduced compared with those of the HCLE by 5.2~8.9%, and the lift-to-drag ratios of the two models are close. Comparing the HCLE with the other two models, the maximum heat flux and maximum temperature are slightly lower than those of the HCLE. This shows that the BCLE model can reduce the blunt radius of the leading edge and increase the aerodynamic performance of the hypersonic vehicle without losing thermal performance. Compared with the other two models, the lift-to-drag ratio of the BCLE2 model is improved by 5.6%, and the maximum heat flux and maximum temperature are slightly lower than those of the HCLE by 1.5~3.4%.
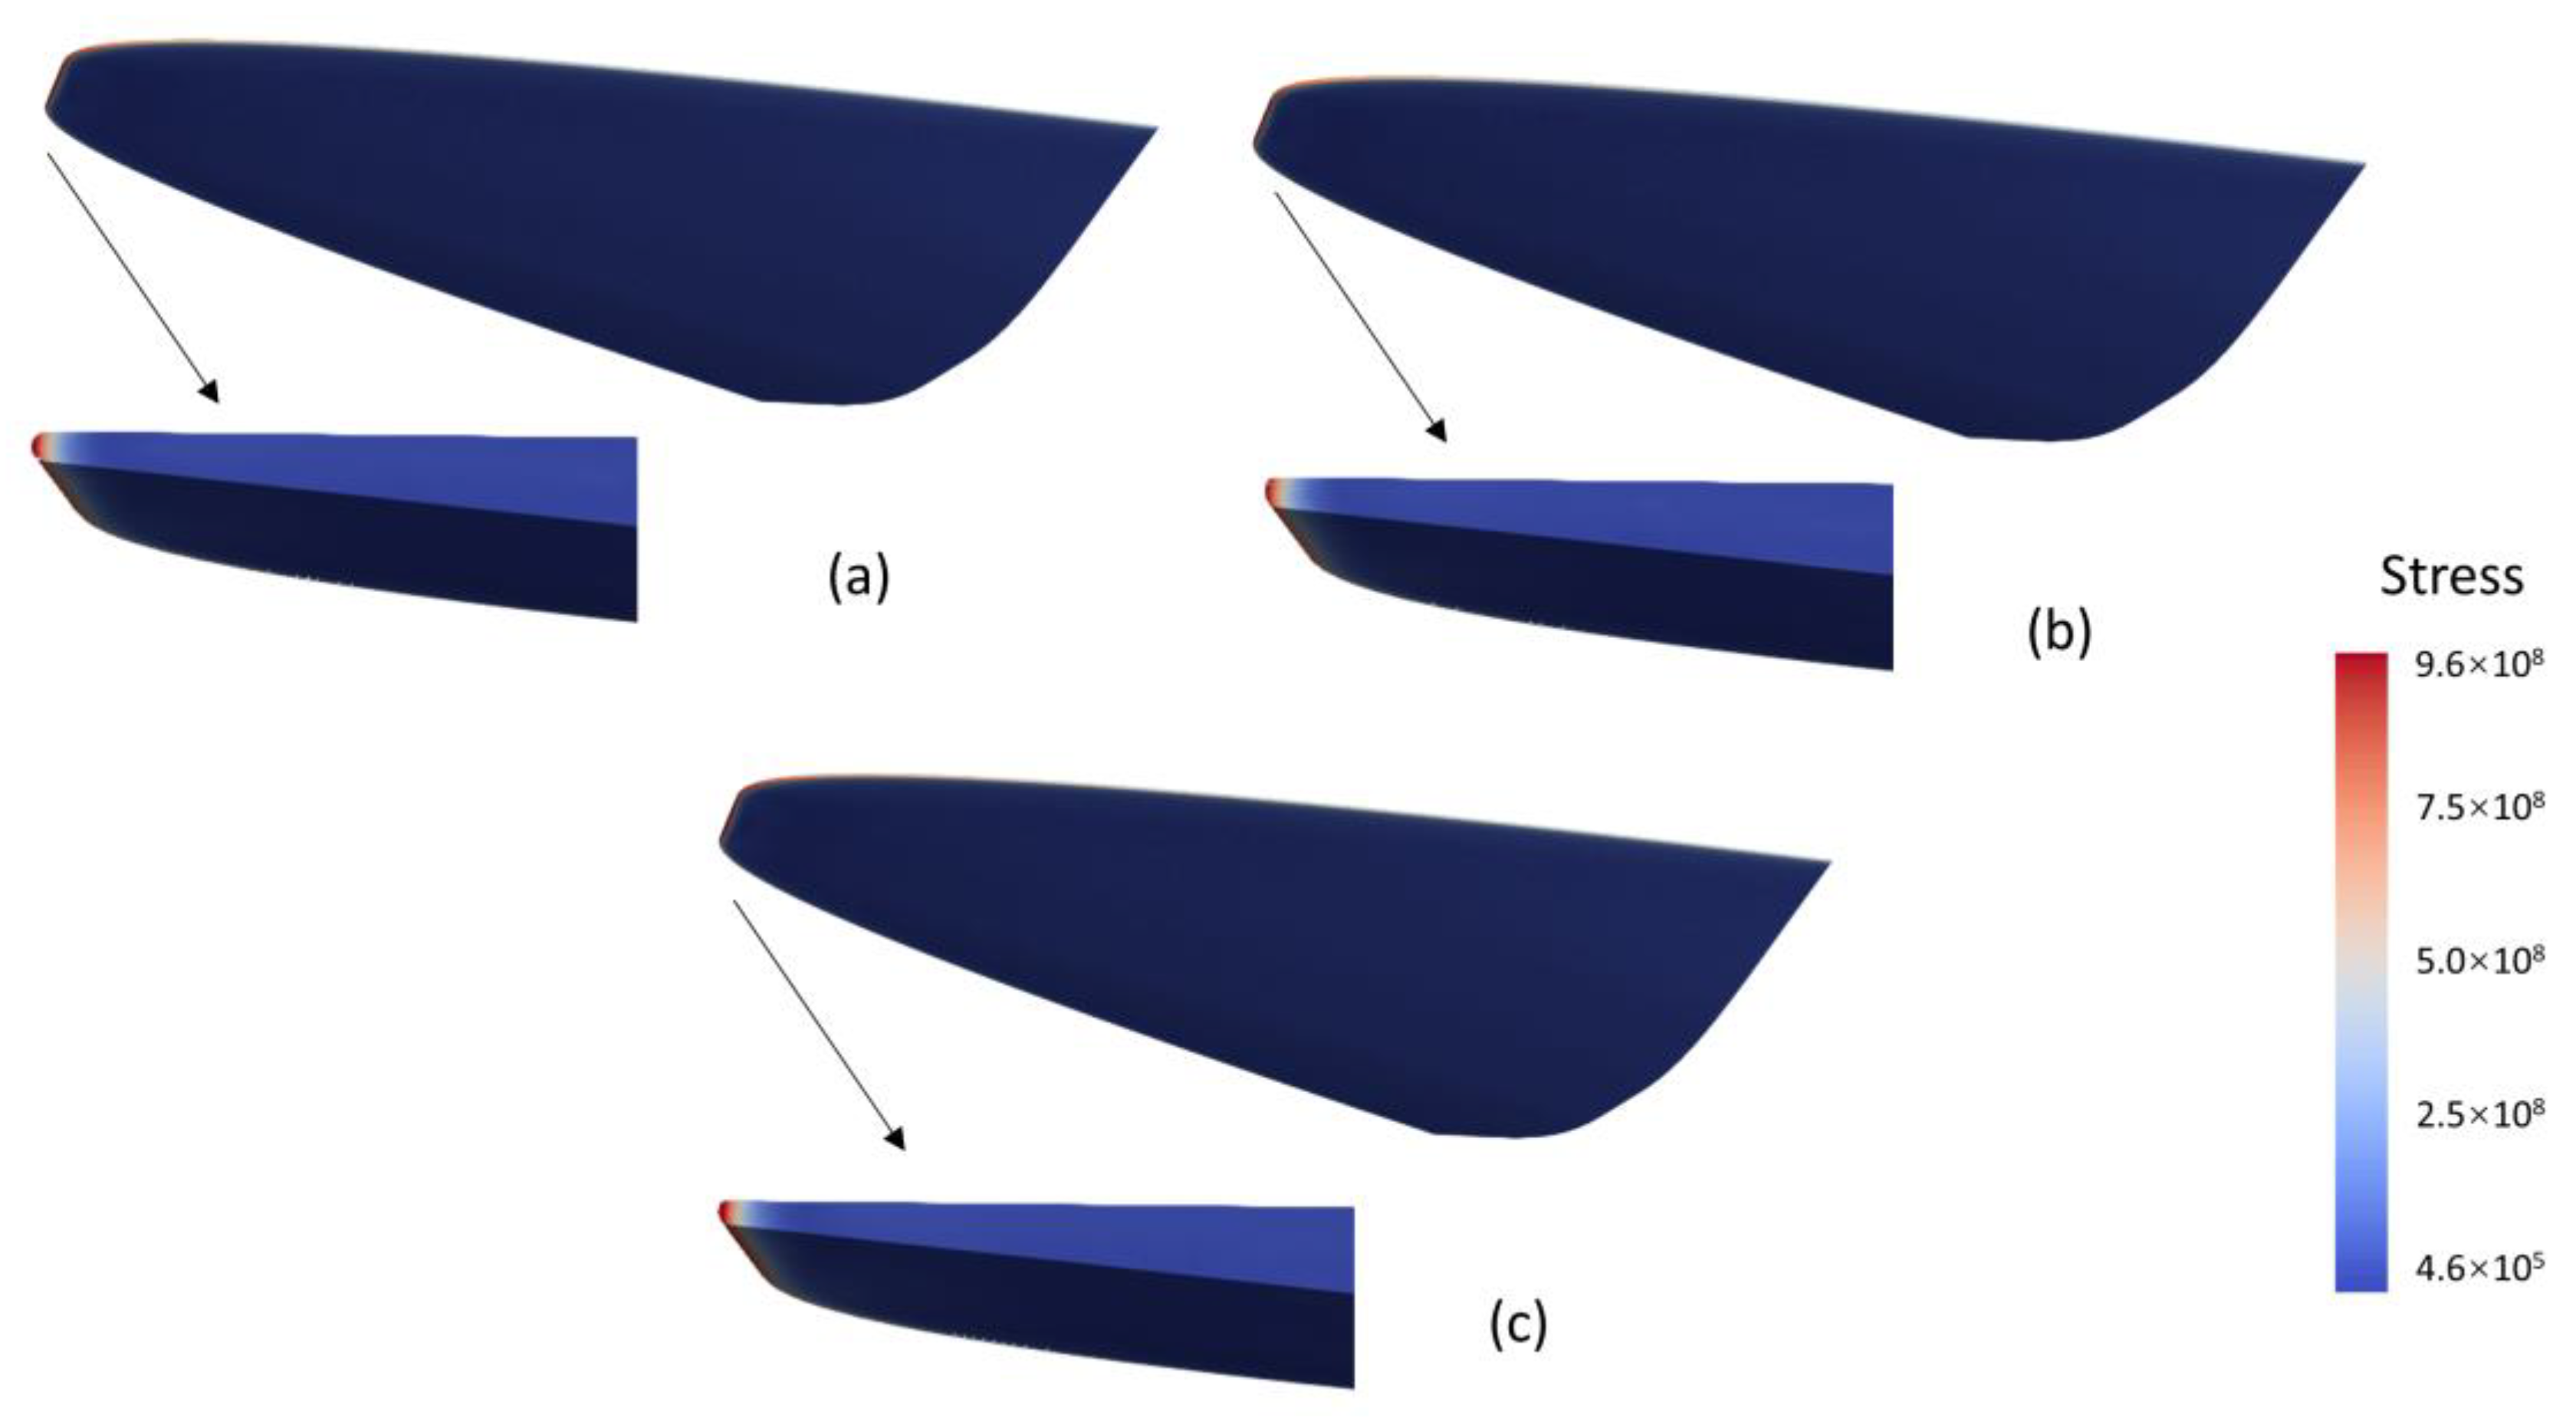
Figure 20 shows the results of the stress of the hypersonic vehicle. With the advancement of the aerodynamic heating time, the temperature of the high-temperature region of the leading-edge stagnation points gradually increased, resulting in the continuous increase in thermal strain and total deformation; meanwhile, the thermal strain of the high-temperature region of the stagnation point was also the largest. The stress concentration occurs inside the structure near the leading edge, and it gradually extends to the deep area inside the structure over time. The reduction in the BCLE and BCLE2 leading edges resulted in a reduction in stress and total deformation by 4.4~5.6%.

5. Conclusions

In conclusion, this study develops an aero-thermoelastic coupling method. Two testing cases are shown to study the leading edge of a hypersonic vehicle using this aero-thermoelastic coupling method. The results show that the stagnation-point temperature of BCLE is significantly lower than that of HCLE. The reduction in body temperature in the BCLE resulted in a reduction in thermal stress and total deformation. The BCLE is still effective in the positive angle-of-attack condition. The results show that the maximum heat flux and temperature of the BCLE are reduced to a certain extent compared with those of the HCLE, and the lift-to-drag ratios of the two models are close. Compared with the other two models, the lift-to-drag ratio of the BCLE2 model is improved by 5.6%, and the maximum heat flux and maximum temperature are slightly lower than those of the HCLE. This shows that the BCLE model can reduce the blunt radius of the leading edge of the hypersonic vehicle and increase the aerodynamic performance of the hypersonic vehicle without losing thermal performance.

Author Contributions

Writing—original draft preparation and methodology, L.C.; writing—review and editing, J.X. All authors have read and agreed to the published version of the manuscript.

Funding

This research was funded by the Priority Academic Program Development of Jiangsu Higher Education Institutions, and this study was co-supported by the Civil Airplane Technology Development Program (MJ-2020-F-10).

Data Availability Statement

Not applicable.

Conflicts of Interest

The authors declare no conflict of interest.

References

  1. Ohlhorst, C.W.; Glass, D.E.; Bruce, W.E.; Lindell, M.C.; Vaughn, W.L.; Smith, R.W.; Dirling, R.B.; Hogenson, P.A.; Nichols, J.M.; Risner, N.W.; et al. Development of X-43A Mach 10 Leading Edges. In Proceedings of the 56th International Astronautical Congress of the International Astronautical Federation, the International Academy of Astronautics, and the International Institute of Space Law, American Institute of Aeronautics and Astronautics, Fukuoka, Japan, 17 October 2005. [Google Scholar]
  2. Seager, C.; Agarwal, R.K. Shape Optimization of Axisymmetric Bodies in Hypersonic Flow for Reducing Drag and Heat Transfer. In Proceedings of the 53rd AIAA Aerospace Sciences Meeting, AIAA SciTech Forum; American Institute of Aeronautics and Astronautics, Kissimmee, FL, USA, 5–9 January 2015. [Google Scholar]
  3. Rodi, P.E. Integration of Optimized Leading Edge Geometries Onto Waverider Configurations. In Proceedings of the 53rd AIAA Aerospace Sciences Meeting; AIAA SciTech Forum; American Institute of Aeronautics and Astronautics, Kissimmee, FL, USA, 5–9 January 2015. [Google Scholar]
  4. Hinman, W.S.; Johansen, C.T.; Rodi, P.E. Optimization and Analysis of Hypersonic Leading Edge Geometries. Aerosp. Sci. Technol. 2017, 70, 549–558. [Google Scholar] [CrossRef]
  5. Santos, W.F.N. Bluntness Impact on Lift-to-Drag Ratio of Hypersonic Wedge Flow. J. Spacecr. Rockets 2009, 46, 329–339. [Google Scholar] [CrossRef]
  6. Liu, J.; Hou, Z.; Ding, G.; Chen, X.; Chen, X. Numerical and Experimental Study on Waverider with Blunt Leading Edge. Comput. Fluids 2013, 84, 203–217. [Google Scholar] [CrossRef]
  7. Fu, X.; Liu, J.; Ding, F.; Wang, S.; Dou, T. A Novel Method for Blunting the Leading Edge of Waverider with Specified Curvature. Int. J. Aerosp. Eng. 2020, 2020, 8885062. [Google Scholar] [CrossRef]
  8. Kamali, S.; Mavriplis, D.J.; Anderson, E.M. Development and Validation of a High-Fidelity Aero-Thermo-Elastic Analysis Capability. In Proceedings of the AIAA Scitech 2020 Forum, Orlando, FL, USA, 6–10 January 2020; Volume 34. [Google Scholar]
  9. Kadivar, M.; Tormey, D.; McGranaghan, G. A Review on Turbulent Flow over Rough Surfaces: Fundamentals and Theories. Int. J. Thermofluids 2021, 10, 100077. [Google Scholar] [CrossRef]
  10. Culler, A.; Crowell, A.; McNamara, J. Studies on Fluid-Structural Coupling for Aerothermoelasticity in Hypersonic Flow. In Proceedings of the 50th AIAA/ASME/ASCE/AHS/ASC Structures, Structural Dynamics, and Materials Conference; American Institute of Aeronautics and Astronautics, Palm Springs, CA, USA, 4 May 2009. [Google Scholar]
  11. McNamara, J.; Culler, A.; Crowell, A. Aerothermoelastic Modeling Considerations for Hypersonic Vehicles. In Proceedings of the 16th AIAA/DLR/DGLR International Space Planes and Hypersonic Systems and Technologies Conference; American Institute of Aeronautics and Astronautics, Bremen, Germany, 19 October 2009. [Google Scholar]
  12. Chen, L.; Zhou, Z.; Xia, J. One-Parameter Optimal Flux Reconstruction Schemes for Adaptive Mesh Refinement. AIAA J. 2022, 60, 1440–1450. [Google Scholar] [CrossRef]
  13. Xia, J.; Fu, H.; Tian, S.-L.; Chen, L. Highly Efficient Wall-Distance-Based Parallel Unstructured Overset Grid Assembly. AIAA J. 2021, 59, 5347–5359. [Google Scholar] [CrossRef]
  14. Nastac, G.; Tramel, R.W.; Nielsen, E.J. Improved Heat Transfer Prediction for High-Speed Flows over Blunt Bodies Using Adaptive Mixed-Element Unstructured Grids. In Proceedings of the AIAA SCITECH 2022 Forum, AIAA SciTech Forum, San Diego, CA, USA, 3–7 January 2022; American Institute of Aeronautics and Astronautics: Reston, VA, USA, 2022. [Google Scholar]
  15. Cui, P.; Zhou, G.; Zhang, Y.; Jia, H.; Wu, X.; Ma, M.; Li, H.; Chen, B. Improved Delayed Detached-Eddy Investigations on the Flow Control of the Leading-Edge Flat Spoiler of the Cavity in the Low-Aspect-Ratio Aircraft. Aerospace 2022, 9, 526. [Google Scholar] [CrossRef]
  16. Jameson, A.; Yoon, S. LU Implicit Schemes with Multiple Grids for the Euler Equations. In Proceedings of the 24th Aerospace Sciences Meeting; American Institute of Aeronautics and Astronautics, Reno, NV, USA, 6 January 1986. [Google Scholar]
  17. Zienkiewicz, O.C.; Taylor, R.L. The Finite Element Method, 7th ed.; Elsevier: Oxford, UK, 2013. [Google Scholar]
  18. Li, X.S.; Demmel, J.W. SuperLU_DIST: A Scalable Distributed-Memory Sparse Direct Solver for Unsymmetric Linear Systems. ACM Trans Math. Softw. 2003, 29, 110–140. [Google Scholar] [CrossRef]
  19. Chen, L.; Zhao, X. Characterization of Air Flow and Lung Function in the Pulmonary Acinus by Fluid-Structure Interaction in Idiopathic Interstitial Pneumonias. PLoS ONE 2019, 14, e0214441. [Google Scholar] [CrossRef] [PubMed] [Green Version]
  20. Chen, L.; Zhao, X. Surface Tension Effects on Pulmonary Acinus Mechanics in Idiopathic Pulmonary Fibrosis Patients. BASIC Clin. Pharmacol. Toxicol. 2019, 125, 36–37. [Google Scholar]
  21. Sheng, C.; Allen, C.B. Efficient Mesh Deformation Using Radial Basis Functions on Unstructured Meshes. AIAA J. 2013, 51, 707–720. [Google Scholar] [CrossRef]
  22. Liu, X.; Qin, N.; Xia, H. Fast Dynamic Grid Deformation Based on Delaunay Graph Mapping. J. Comput. Phys. 2006, 211, 405–423. [Google Scholar] [CrossRef]
Figure 1. A schematic diagram of the FSI iteration loop. The FSI coupling package is developed in the Python language. The FSI coupling package and solvers exchange data of displacement, temperature, force, and heat using the MPI.
Aerospace 09 00835 g001
Figure 2. Improved Delaunay graph mapping method: (a) Delaunay graph; (b) Deformed Delaunay graph; (c) Deformed grid.
Aerospace 09 00835 g002
Figure 3. Leading edge geometries. HCLE: hemi-cylindrical leading edge; BCLE: Bézier curve leading edge.
Aerospace 09 00835 g003
Figure 4. Fluid and structure grids for the leading edge: (a) Fluid grid; (b) Structure grid of HCLE; (c) Structure grid of BCLE.
Aerospace 09 00835 g004
Figure 5. Pressure contours in the flow field: (a) HCLE; (b) BCLE. The flow field can be divided into the far-field free-flow region and the bow-shock region. The bow shock of the BCLE is farther from the surface.
Aerospace 09 00835 g005
Figure 6. Temperature and heat flux at the fluid-structure interface: (a) Temperature of HCLE; (b) Temperature of BCLE; (c) Heat flux of HCLE; (d) Heat flux of BCLE. As time progresses, the wall temperature will continue to increase, and the stagnation-point temperature is higher than that of other parts.
Aerospace 09 00835 g006
Figure 7. Comparison of temperature at the fluid–structure interface: (a) T = 0.02 s; (b) T = 0.2 s; (c) T = 1.0 s; (d) T = 2.0 s. The stagnation-point temperature of the BCLE is lower than that of the HCLE.
Aerospace 09 00835 g007
Figure 8. Comparison of the temperature and stress contours, temperature and stress share same color scales respectively: (a) Temperature of HCLE; (b) Temperature of BCLE; (c) Stress of HCLE; (d) Stress of BCLE.
Aerospace 09 00835 g008
Figure 9. Comparison of temperature at the fluid–structure interface at AoA = 5°:(a) T = 0.02 s; (b) T = 0.2 s; (c) T = 1.0 s; (d) T = 2.0 s. The stagnation-point temperature of the BCLE is lower than that of the HCLE.
Aerospace 09 00835 g009
Figure 10. Comparison of the contours of temperature and stress at AoA = 5°, temperature and stress share same color scales respectively: (a) Temperature of HCLE; (b) Temperature of BCLE; (c) Stress of HCLE; (d) Stress of BCLE.
Aerospace 09 00835 g010
Figure 11. Comparison of temperature at the fluid–structure interface at AoA = 10°: (a) T = 0.02 s; (b) T = 0.2 s; (c) T = 1.0 s; (d) T = 2.0 s. The stagnation-point temperature of the BCLE is lower than that of the HCLE.
Aerospace 09 00835 g011
Figure 12. Comparison of the contours of temperature and stress at AoA = 10°, temperature and stress share same color scales respectively: (a) Temperature of HCLE; (b) Temperature of BCLE; (c) Stress of HCLE; (d) Stress of BCLE.
Aerospace 09 00835 g012
Figure 13. Geometry of the hypersonic vehicle.
Aerospace 09 00835 g013
Figure 14. The configuration of the leading edge of hypersonic vehicles: (a) HCLE; (b) BCLE.
Aerospace 09 00835 g014
Figure 15. Fluid and structure grids for hypersonic vehicles: (a) Fluid grid; (b) Section of fluid grid; (c) Structure grid.
Aerospace 09 00835 g015
Figure 16. Pressure contours in the flow field of the hypersonic vehicle.
Aerospace 09 00835 g016
Figure 17. Comparison of temperature at the upper surface of the hypersonic vehicle: (a) HCLE; (b) BCLE; (c) BCLE2. Compared with the other two models, the temperature gradient of the BCLE2 model is greatly reduced by 22%.
Aerospace 09 00835 g017
Figure 18. Comparison of temperatures of the hypersonic vehicles, temperature shares the same color scale: (a) HCLE; (b) BCLE; (c) BCLE2. The maximum temperature of the three-dimensional hypersonic vehicle based on the BCLE is lower than that of the HCLE by 3.9%, and the overall temperature gradient of the hypersonic vehicle is reduced.
Aerospace 09 00835 g018
Figure 19. Comparison of temperature at the stagnation point of the hypersonic vehicle.
Aerospace 09 00835 g019
Figure 20. Comparison of stress of the hypersonic vehicle: (a) HCLE; (b) BCLE; (c) BCLE2. The temperature of the high-temperature region of the leading-edge stagnation points gradually increased, resulting in the continuous increase in thermal strain and total deformation. The reduction in the BCLE and BCLE2 leading edges resulted in a reduction in stress and total deformation by 4.4~5.6%.
Aerospace 09 00835 g020
Table 1. Mesh convergence study parameters of the finite leading edge.
MeshCFD Mesh ElementsCSD Mesh ElementsMaximum Temperature (103 K)
Coarse2.3 M0.1 M1.581
Medium3.1 M0.2 M1.699
Fine4.4 M0.3 M1.727
Table 2. Mesh convergence study parameters of the hypersonic vehicle.
MeshCFD Mesh ElementsCSD Mesh ElementsMaximum Temperature (103 K)
Coarse12.6 M3.8 M1.202
Medium17.4 M5.2 M1.267
Fine24.3 M7.3 M1.274
Table 3. Flow parameter results of the three models.
ModelL/DMaximum Heat Flux
(105 W/m2)
Maximum Temperature (103 K)
HCLE4.6297.2501.267
BCLE4.6416.6081.201
BCLE24.8867.1401.224
Publisher’s Note: MDPI stays neutral with regard to jurisdictional claims in published maps and institutional affiliations.