
Investigation on Surface Roughness of PolyJet-Printed Airfoil Geometries for Small UAV Applications


Abstract
:1. Introduction
2. Materials and Methods
2.1. Production and Surface Roughness
2.2. Numerical Analysis
3. Results
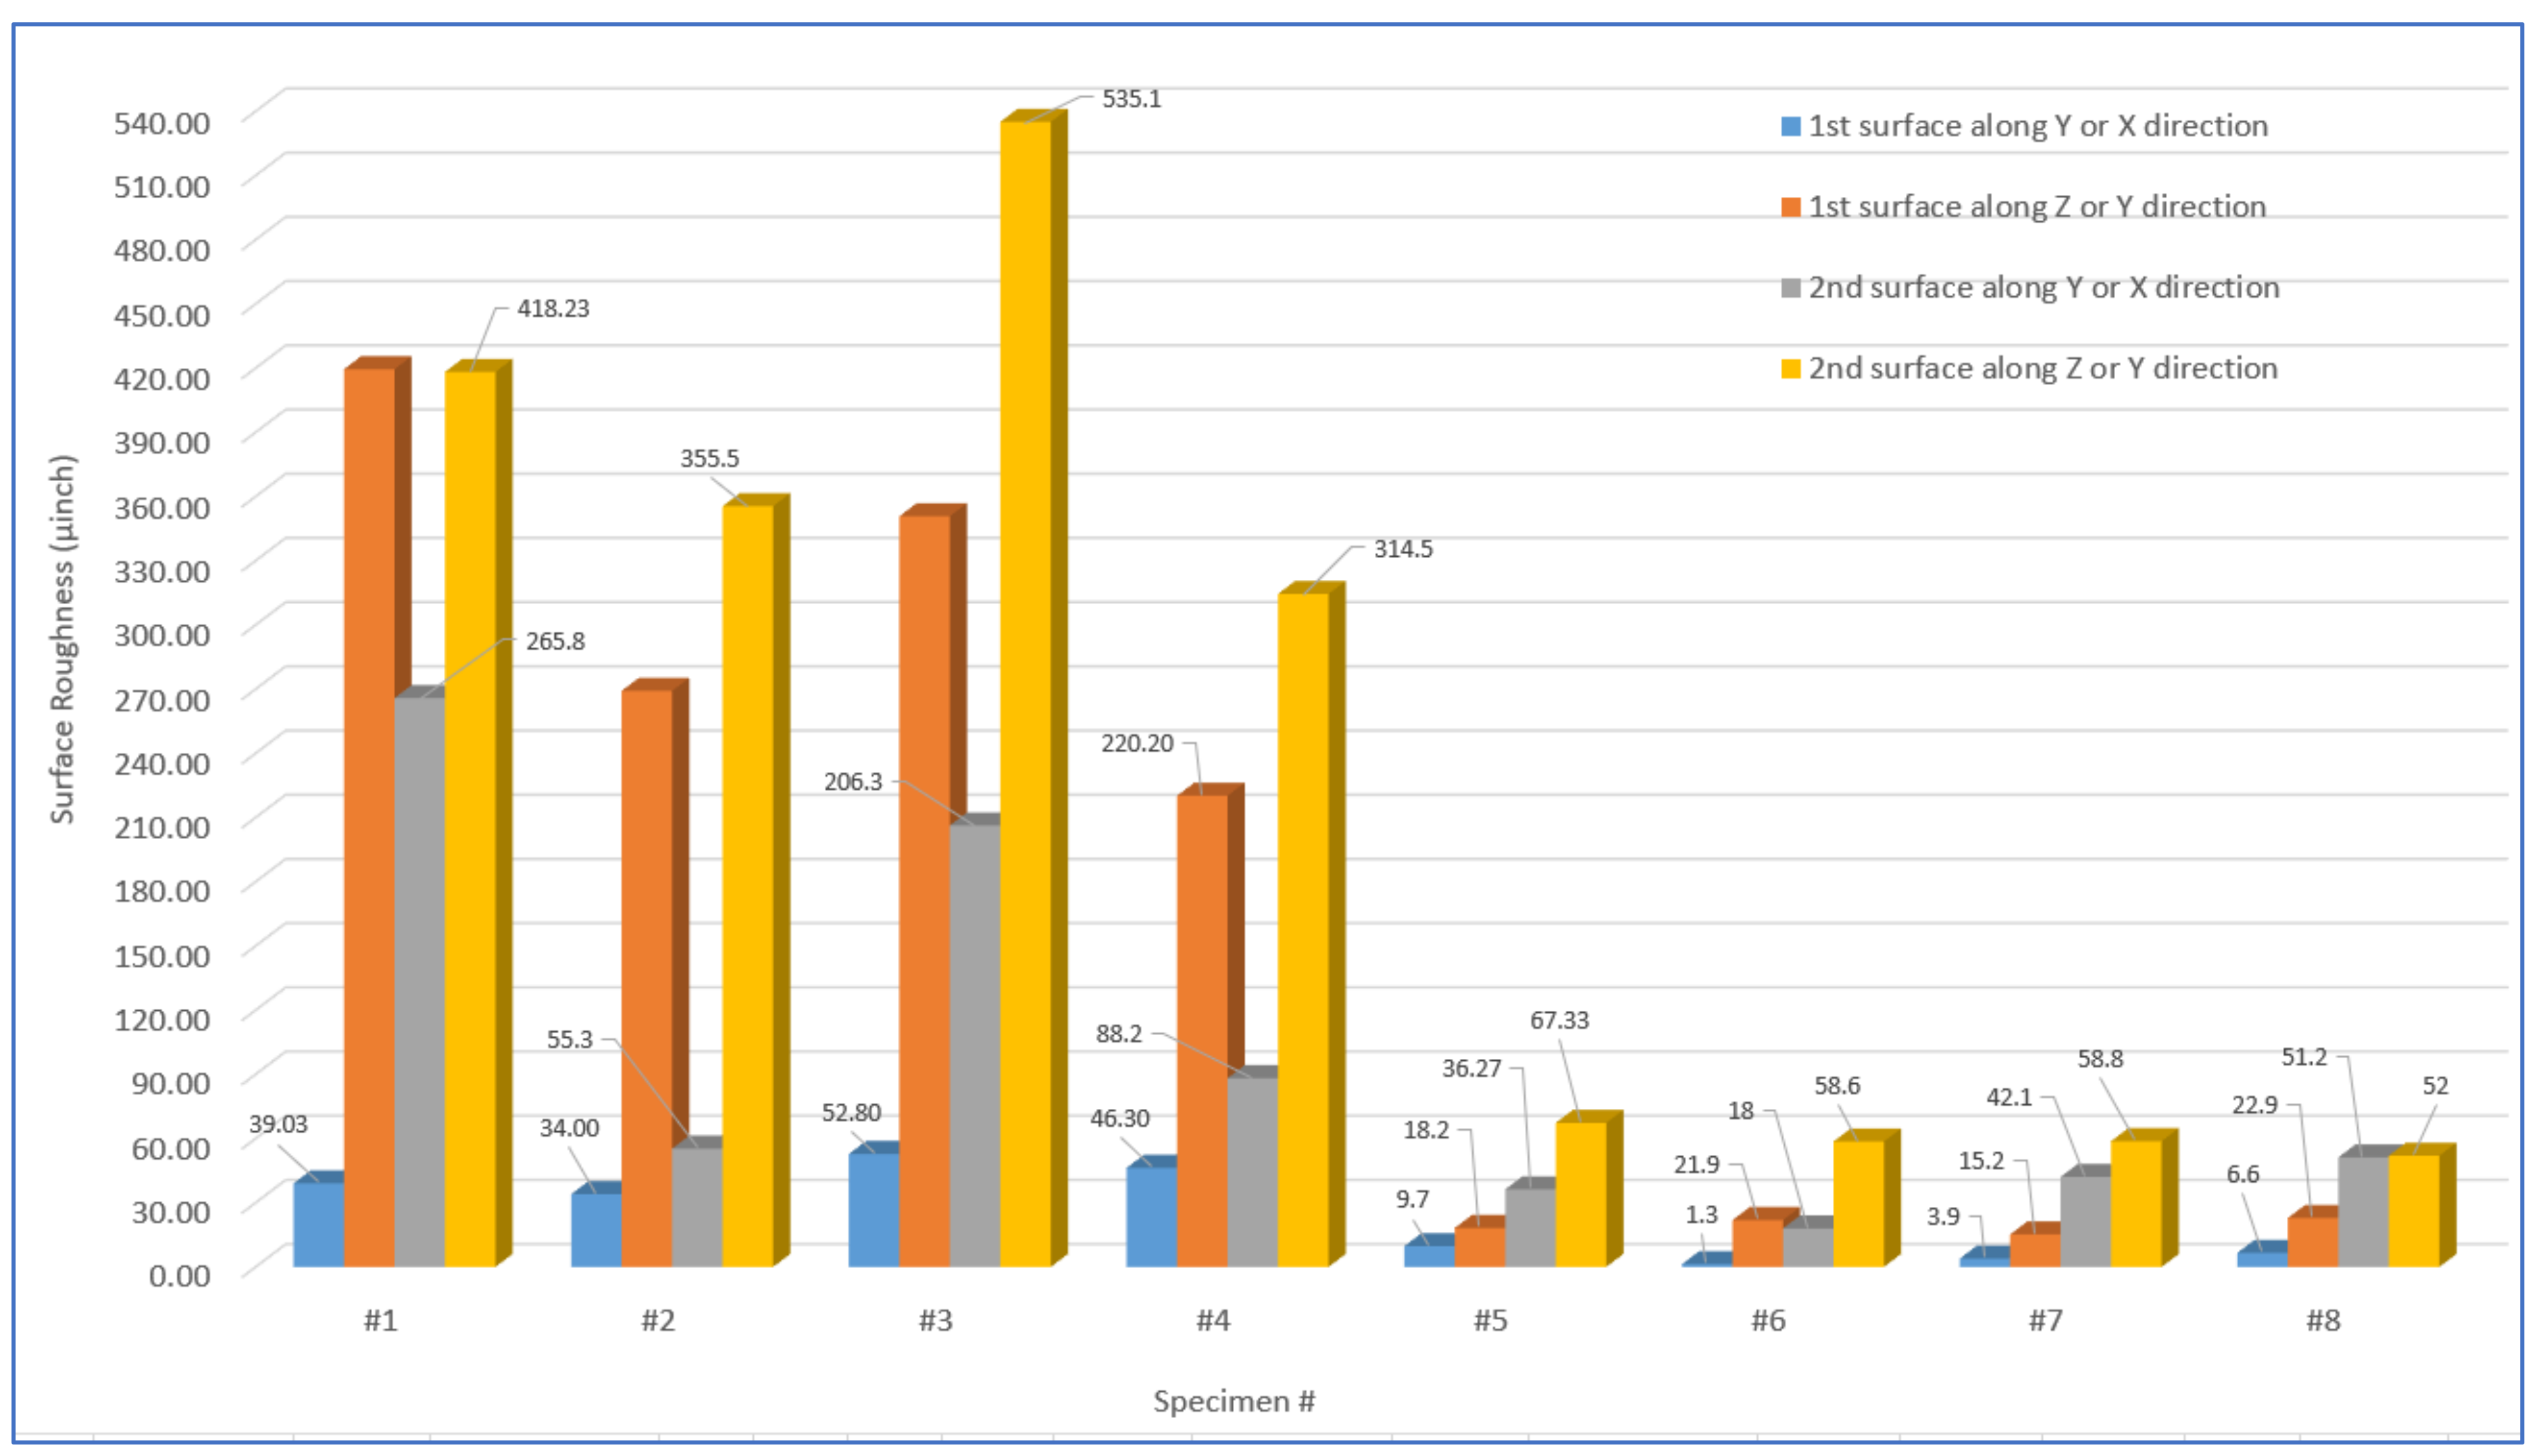
3.1. Production and Surface Roughness Results
3.2. Numerical Analysis Results
4. Discussion
4.1. Effect of Tray Location of Specimens on Surface Roughness
4.2. Effect of Build Orientation on Surface Roughness
4.3. Effect of Surface Finish Setting on Surface Roughness
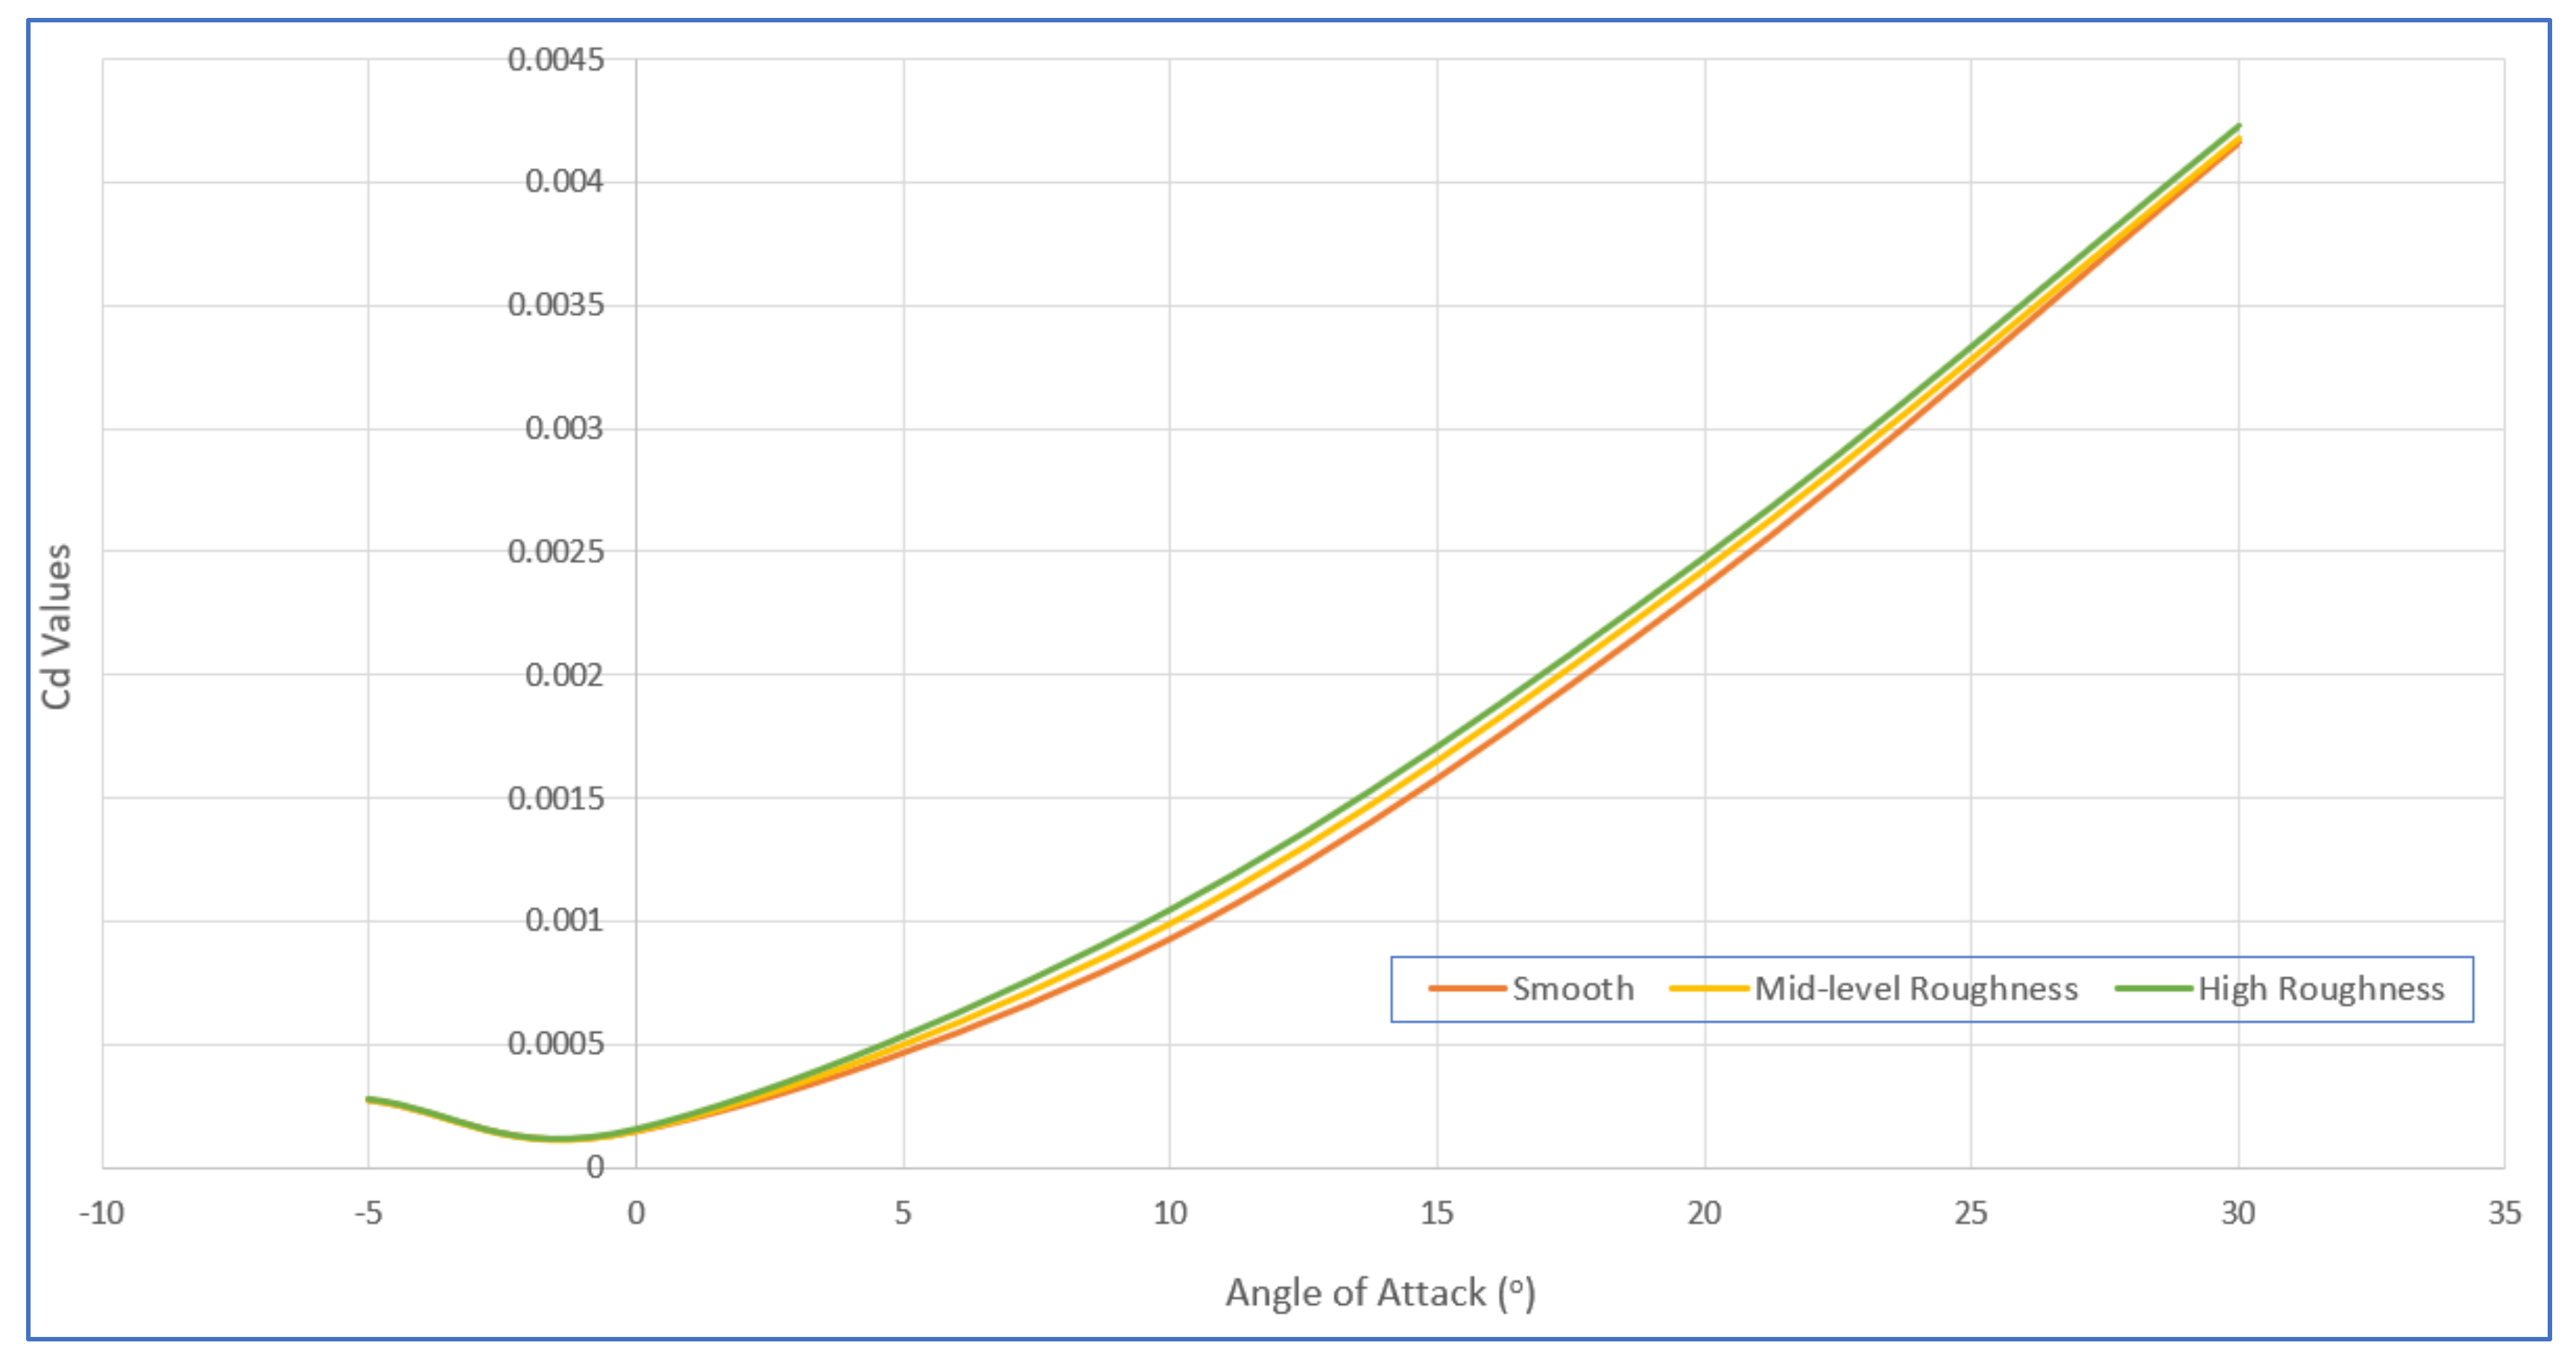
4.4. Effect of Surface Roughness on Flight Performance
5. Conclusions
- Airfoil geometries located along X direction have lower surface roughness values than geometries located along Y direction. Therefore, it is suggested to print airfoil geometries along X direction for better surface quality;
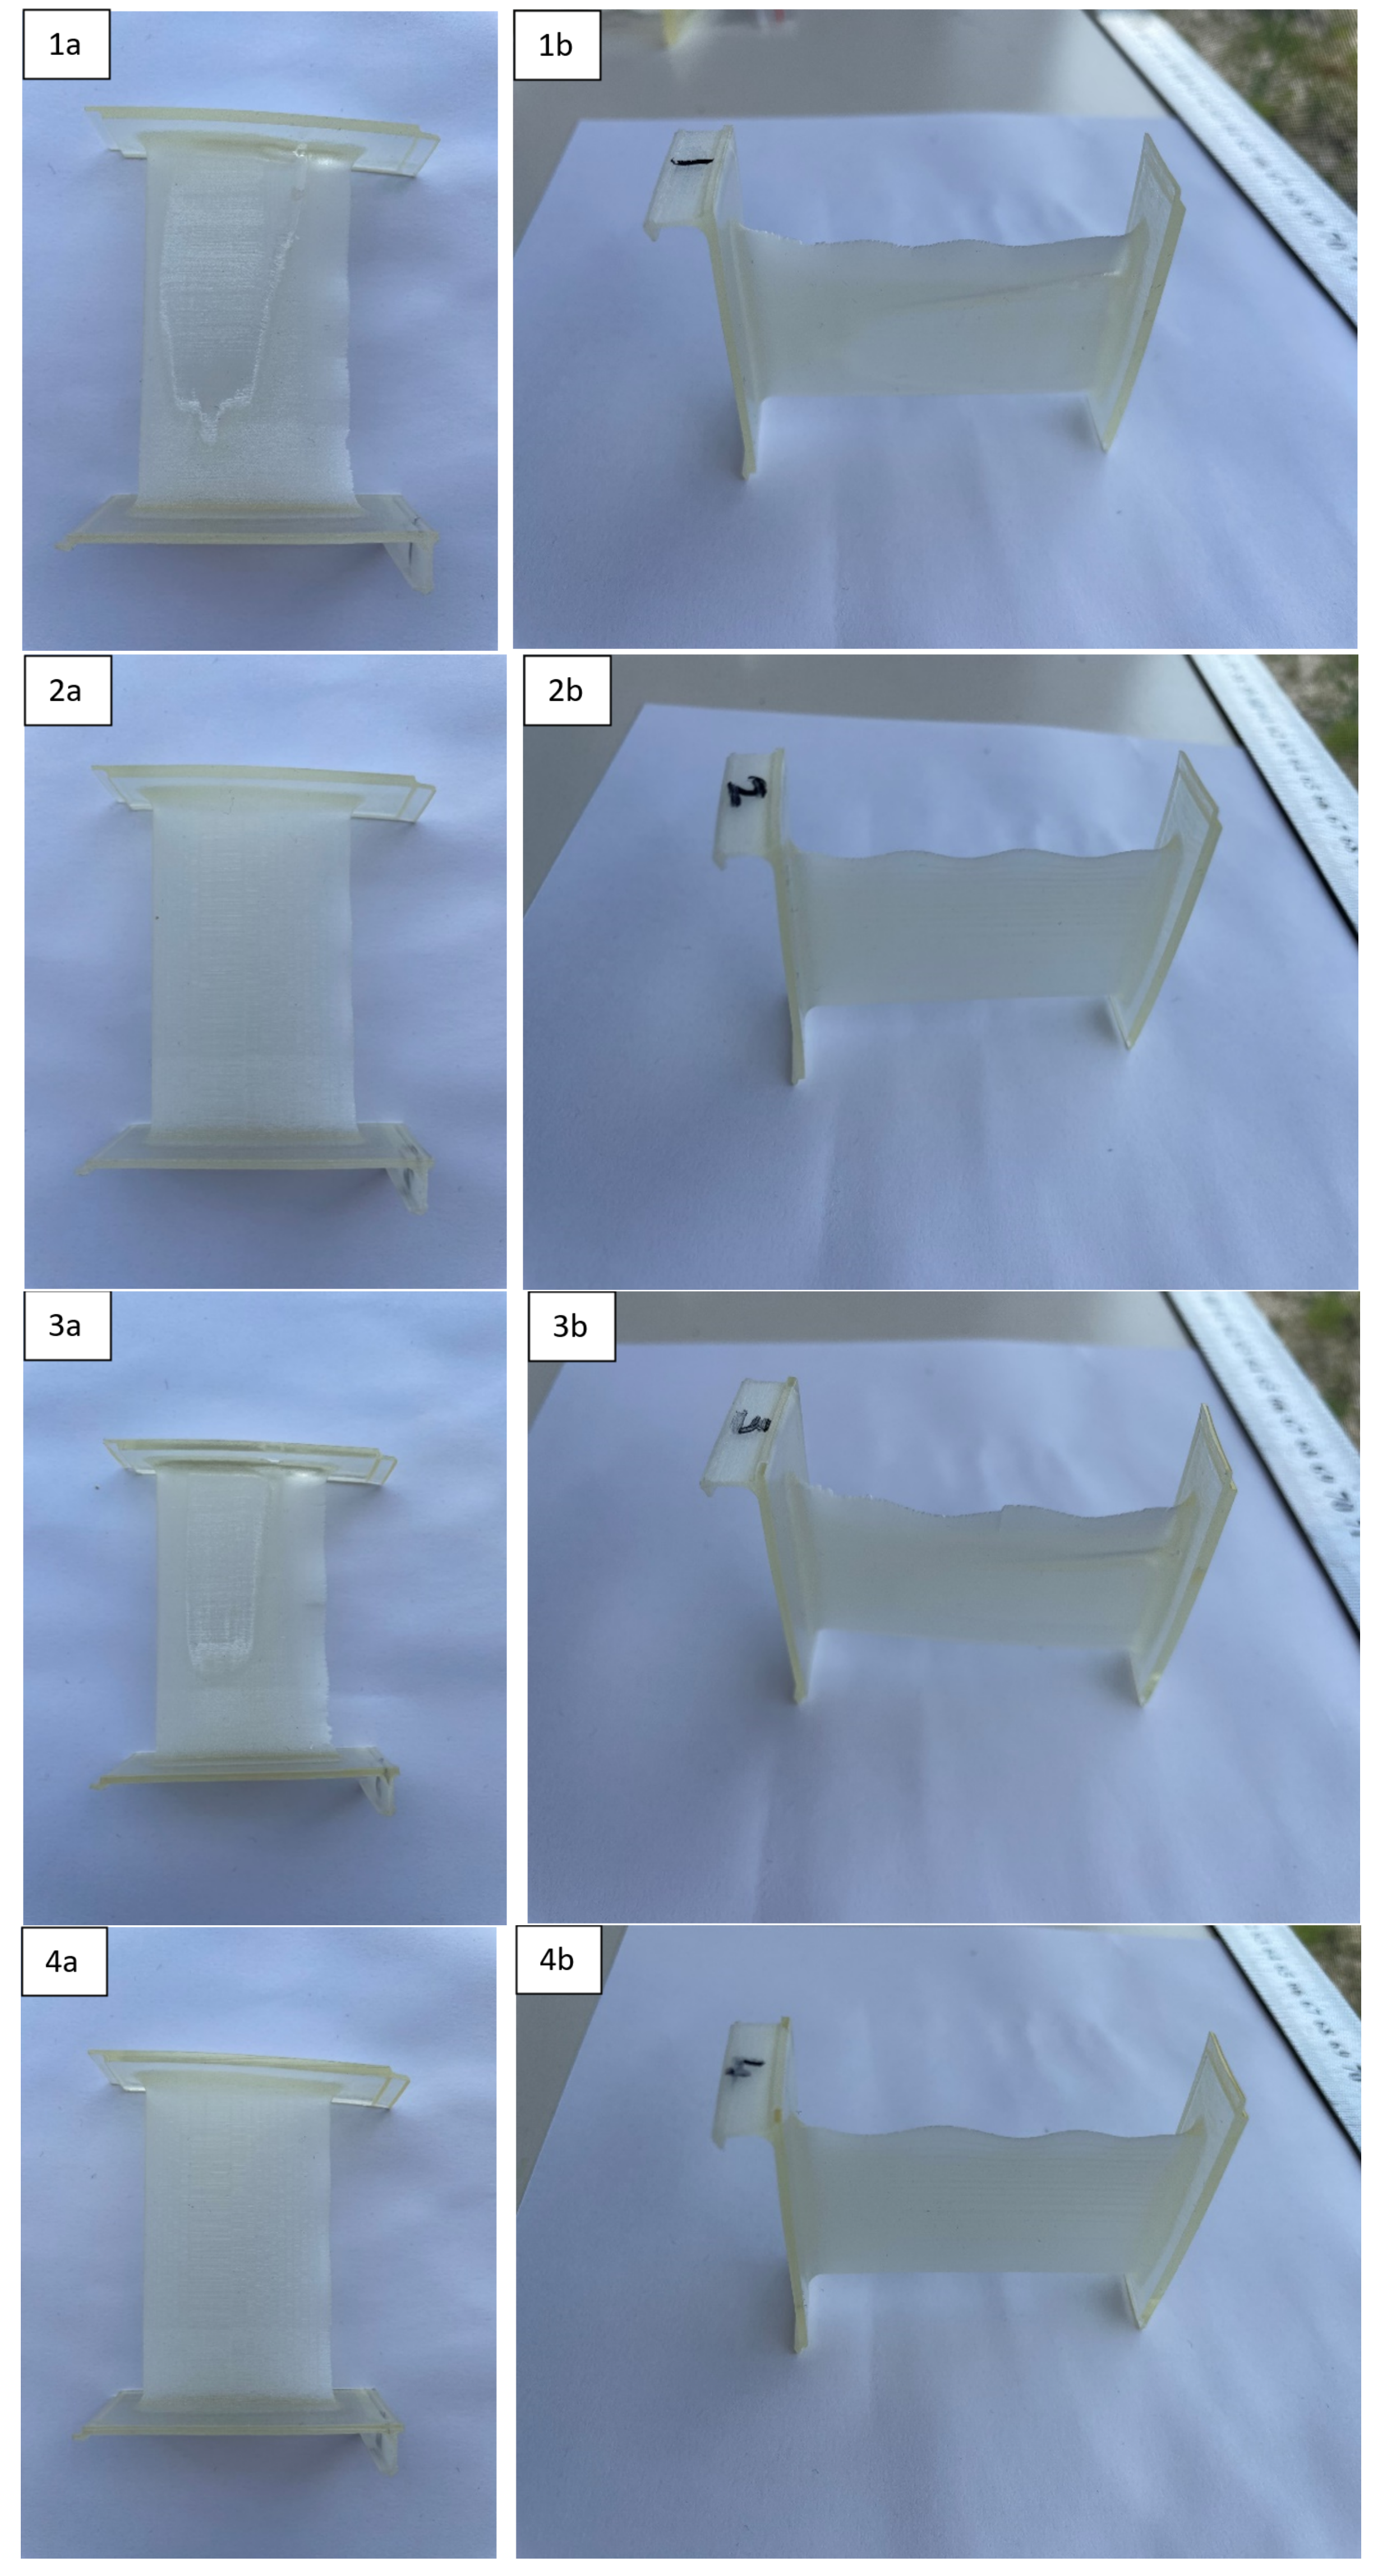
- Airfoil geometries with vertical build orientation have very high distortion especially on trailing edge areas and higher surface roughness values than geometries with horizontal build orientation. Therefore, it is suggested to print airfoil geometries with horizontal build orientation for lower distortion and better surface quality;
- It was observed that matte and glossy surface finish settings resulted in different surface roughness values in different surfaces, and it is very difficult to make a correlation between surface finish settings and surface roughness. However, in general, it can be suggested to print airfoil geometries with glossy surface finish setting for better surface quality.
- Surface roughness of the PolyJet-printed fixed-wing UAV wings affects the drag coefficient 7.5% in high velocity cruises. Thus, convenient build orientations should be selected to reduce the surface roughness for increasing the aerodynamic performance. By this, the limited cruise distance of UAVs can be increased. Thus, it is suggested that the build configuration of including Y axis tray location, horizontal build orientation and matte surface finish setting is the best option for aerodynamic performance in terms of surface roughness with the least surface roughness in the flow direction.
Author Contributions
Funding
Institutional Review Board Statement
Informed Consent Statement
Data Availability Statement
Conflicts of Interest
References
- Gupta, S.G.; Ghonge, M.M.; Jawandhiya, P.M. Review of unmanned aircraft system (UAS). Int. J. Adv. Res. Comp. Eng. Technol. 2013, 2, 1646–1658. [Google Scholar] [CrossRef]
- Shakhatreh, H.; Sawalmeh, A.H.; Al-Fuqaha, A.; Dou, Z.; Almaita, E.; Khalil, I.; Othman, N.S.; Khreishah, A.; Guizani, M. Unmanned aerial vehicles (UAVs): A survey on civil applications and key research challenges. IEEE Access 2019, 7, 48572–48634. [Google Scholar] [CrossRef]
- Rahman, M.F.F.; Fan, S.; Zhang, Y.; Chen, L. A comparative study on application of unmanned aerial vehicle systems in agriculture. Agriculture 2021, 11, 22. [Google Scholar] [CrossRef]
- Giordan, D.; Adams, M.S.; Aicardi, I.; Alicandro, M.; Allasia, P.; Baldo, M.; De Berardinis, P.; Dominici, D.; Godone, D.; Hobbs, P.; et al. The use of unmanned aerial vehicles (UAVs) for engineering geology applications. Bull. Eng. Geol. Environ. 2020, 79, 3437–3481. [Google Scholar] [CrossRef] [Green Version]
- PS, R.; Jeyan, M.L. Mini unmanned aerial systems (UAV)—A review of the parameters for classification of a mini UAV. Int. J. Aviat. Aeronaut. Aerosp. 2020, 7, 5. [Google Scholar] [CrossRef]
- Hassanalian, M.; Abdelkefi, A. Classifications, applications, and design challenges of drones: A review. Prog. Aerosp. Sci. 2017, 91, 99–131. [Google Scholar] [CrossRef]
- Herzog, D.; Seyda, V.; Wycisk, E.; Emmelmann, C. Additive manufacturing of metals. Acta Mater. 2016, 117, 371–392. [Google Scholar] [CrossRef]
- Najmon, J.C.; Raeisi, S.; Tovar, A. Review of additive manufacturing technologies and applications in the aerospace industry. In Additive Manufacturing for the Aerospace Industry; Froes, F., Boyer, R., Eds.; Elsevier: Amsterdam, The Netherlands, 2019; pp. 7–31. [Google Scholar]
- Gülcan, O.; Günaydın, K.; Tamer, A. The state of the art of material jetting—A critical review. Polymers 2021, 13, 2829. [Google Scholar] [CrossRef]
- Leary, M. Design for Additive Manufacturing; Elsevier: Amsterdam, The Netherlands, 2020; p. 270. [Google Scholar]
- Pilipović, A.; Baršić, G.; Katić, M.; Havstad, M.R. Repeatability and reproducibility assessment of a PolyJet technology using x-ray computed tomography. Appl. Sci. 2020, 10, 7040. [Google Scholar] [CrossRef]
- Gardan, J. Additive manufacturing technologies: State of the art and trends. Int. J. Prod. Res. 2016, 54, 3118–3132. [Google Scholar] [CrossRef]
- O’Neill, P.; Jolivet, L.; Kent, N.J.; Brabazon, D. Physical integrity of 3D printed parts for use as embossing tools. Adv. Mater. Process. Technol. 2017, 3, 308–317. [Google Scholar] [CrossRef] [Green Version]
- Stansbury, J.W.; Idacavage, M.J. 3D printing with polymers: Challenges among expanding options and opportunities. Dent. Mater. 2016, 32, 54–64. [Google Scholar] [CrossRef] [PubMed]
- Cazón, A.; Morer, P.; Matey, L. PolyJet technology for product prototyping: Tensile strength and surface roughness properties. Proc. Inst. Mech. Eng. Part B J. Eng. Manuf. 2014, 228, 1664–1675. [Google Scholar] [CrossRef]
- Kechagias, J.; Iakovakis, V.; Giorgo, E.; Stavropoulos, P.; Koutsomichalis, A.; Vaxevanidis, N.M. Surface roughness optimization of prototypes produced by PolyJet direct 3d printing technology. In Proceedings of the International Conference on Engineering and Applied Sciences Optimization, Kos Island, Greece, 4–6 June 2014. [Google Scholar]
- Aslani, K.; Vakouftsi, F.; Kechagias, J.D.; Mastorakis, N.E. Surface roughness optimization of Poly-Jet 3D printing using grey taguchi method. In Proceedings of the International Conference on Control Artificial Intelligence, Robotics & Optimization (ICCAIRO), Athens, Greece, 3–5 May 2019; pp. 213–218. [Google Scholar]
- Beltrán, N.; Carriles, F.; Álvarez, B.J.; Blanco, D.; Rico, J.C. Characterization of factors influencing dimensional and geometric errors in PolyJet manufacturing of cylindrical features. Procedia Eng. 2015, 132, 62–69. [Google Scholar] [CrossRef] [Green Version]
- Kumar, K.; Kumar, G.S. A study on surface roughness of rapid prototypes fabricated using PolyJet 3D printing system. In Proceedings of the International Conference on Computer Aided Engineering (CAE 2013), Madras, India, 19–21 December 2012; pp. 1–6. [Google Scholar]
- Kumar, K.; Kumar, G.S. An experimental and theoretical investigation of surface roughness of poly-jet printed parts. Virtual Phys. Prototyp. 2015, 10, 23–34. [Google Scholar] [CrossRef]
- Kechagias, J.; Stavropoulos, P. An investigation of sloped surface roughness of direct poly-jet 3D printing. In Proceedings of the International Conference on Industrial Engineering-INDE, Zakynthos Island, Greece, 16–20 July 2015; pp. 150–153. [Google Scholar]
- Khoshkhoo, A.; Carrano, A.L.; Blersch, D.M. Effect of surface slope and build orientation on surface finish and dimensional accuracy in material jetting processes. Procedia Manuf. 2018, 26, 720–730. [Google Scholar] [CrossRef]
- Vidakis, N.; Petousis, M.; Vaxevanidis, N.; Kechagias, J. Surface roughness investigation of Poly-Jet 3D printing. Mathematics 2020, 8, 1758. [Google Scholar] [CrossRef]
- Kent, N.J.; Jolivet, L.; O’Neill, P.; Brabazon, D. An evaluation of components manufactured from a range of materials, fabricated using PolyJet technology. Adv. Mater. Process. Technol. 2017, 3, 318–329. [Google Scholar] [CrossRef] [Green Version]
- Matte or Glossy? Which Finish to Use for Your 3D Prints and When. Available online: https://grabcad.com/tutorials/matte-or-glossy-which-finish-to-use-for-your-3d-prints-and-when (accessed on 13 September 2021).
- Pugalendhi, A.; Ranganathan, R.; Chandrasekaran, M. Effect of process parameters on mechanical properties of VeroBlue material and their optimal selection in PolyJet technology. Int. J. Adv. Manuf. Technol. 2020, 108, 1049–1059. [Google Scholar] [CrossRef]
- Moore, J.P.; Williams, C.B. Fatigue properties of parts printed by PolyJet material jetting. Rapid Prototyp. J. 2015, 21, 675–685. [Google Scholar] [CrossRef]
- Ferro, C.; Grassi, R.; Seclì, C.; Maggiore, P. Additive manufacturing offers new opportunities in UAV research. Procedia CIRP 2016, 41, 1004–1010. [Google Scholar] [CrossRef] [Green Version]
- Kim, S.-Y.; Shin, Y.-S.; Jung, H.-D.; Hwang, C.-J.; Baik, H.-S.; Cha, J.-Y. Precision and trueness of dental models manufactured with different 3-dimensional printing techniques. Am. J. Orthod. Dentofac. Orthop. 2018, 153, 144–153. [Google Scholar] [CrossRef] [PubMed] [Green Version]
- Maurya, N.K.; Rastogi, V.; Singh, P. Comparative study and measurement of form errors for the component printed by FDM and polyjet process. Instrum. Mes. Métrologie 2019, 18, 353–359. [Google Scholar] [CrossRef]
- Dizon, J.R.C.; Valino, A.D.; Souza, L.R.; Espera, A.H.; Chen, Q.; Advincula, R.C. 3D printed injection molds using various 3D printing technologies. Mater. Sci. Forum 2020, 1005, 150–156. [Google Scholar] [CrossRef]
- Lee, K.Y.; Cho, J.W.; Chang, N.Y.; Chae, J.M.; Kang, K.H.; Kim, S.C.; Cho, J.H. Accuracy of three-dimensional printing for manufacturing replica teeth. Korean J. Orthod. 2015, 45, 217–225. [Google Scholar] [CrossRef] [Green Version]
- Hosseinabadi, H.G.; Bagheri, R.; Gray, L.A.; Altstädt, V.; Drechsler, K. Plasticity in polymeric honeycombs made by photo-polymerization and nozzle based 3D-printing. Polym. Test. 2017, 63, 163–167. [Google Scholar] [CrossRef]
- Li, Y.; Linke, B.S.; Voet, H.; Falk, B.; Schmitt, R.; Lam, M. Cost, sustainability and surface roughness quality–A comprehensive analysis of products made with personal 3D printers. CIRP J. Manuf. Sci. Technol. 2017, 16, 1–11. [Google Scholar] [CrossRef] [Green Version]
- Queral, V.; Rincón, E.; Mirones, V.; Rios, L.; Cabrera, S. Dimensional accuracy of additively manufactured structures for modular coil windings of stellarators. Fusion Eng. Des. 2017, 124, 173–178. [Google Scholar] [CrossRef]
- Tan, W.S.; Suwarno, S.R.; An, J.; Chua, C.K.; Fane, A.G.; Chong, T.H. Comparison of solid, liquid and powder forms of 3D printing techniques in membrane spacer fabrication. J. Membr. Sci. 2017, 537, 283–296. [Google Scholar] [CrossRef]
- Budzik, G.; Woźniak, J.; Paszkiewicz, A.; Przeszłowski, Ł.; Dziubek, T.; Dębski, M. Methodology for the quality control process of additive manufacturing products made of polymer materials. Materials 2021, 14, 2202. [Google Scholar] [CrossRef]
- Goh, G.D.; Agarwala, S.; Goh, G.L.; Dikshit, V.; Yeong, W.Y. Additive manufacturing in unmanned aerial vehicles (UAVs): Challenges and potential. Aerosp. Sci. Technol. 2017, 63, 140–151. [Google Scholar] [CrossRef]
- Villa, T.F.; Gonzalez, F.; Miljievic, B.; Ristovski, Z.D.; Morawska, L. An overview of small unmanned aerial vehicles for air quality measurements: Present applications and future prospectives. Sensors 2016, 16, 1072. [Google Scholar] [CrossRef] [PubMed] [Green Version]
- Tamila, Y. Using the ANSYS Workbench software for designing of the miniature unmanned aerial vehicles. Proceedings of Computer Science & Engineering, Lviv, Ukraine, 21–23 November 2013. [Google Scholar]
- Anderson, J.D., Jr. Fundamentals of Aerodynamics; Tata McGraw-Hill Education: New York, NY, USA, 2010; ISBN 0070700125. [Google Scholar]
- Carmichael, B.H. Low Reynolds Number Airfoil Survey; NASA Report No. 165803; NASA: Washington, DC, USA, 1981. [Google Scholar]
- Eisenbeiss, H. A mini unmanned aerial vehicle (UAV): System overview and image acquisition. Int. Arch. Photogramm. Remote Sens. Spat. Inf. Sci. 2004, 36, 1–7. [Google Scholar]
- Chmielewski, P.; Sibilski, K. Ground Speed Optical Estimator for Miniature UAV. Sensors 2021, 21, 2754. [Google Scholar] [CrossRef] [PubMed]
- Mittal, P.; Muneshwar, R.N. Market analysis and potential of uav systems for monitoring & cartography in ecology, agriculture & forestry. Sci. Youth 2012, 11–12, 135–137. [Google Scholar]
- Ni, D.; Yu, G.; Rathinam, S. Unmanned aircraft system and its applications in transportation. J. Adv. Transport. 2017, 2017, 7156153. [Google Scholar] [CrossRef] [Green Version]
- Xiaoyu, S.; Zhenyu, G.; Ruizhi, M.; Jie, L.; Chengwei, Y. Reinforcement-learning-based miniature UAV identification. In Proceedings of the IEEE International Conference on Unmanned Systems (ICUS), Beijing, China, 27–29 October 2017; pp. 237–242. [Google Scholar]
- Dündar, Ö.; Bilici, M.; Ünler, T. Design and performance analyses of a fixed wing battery VTOL UAV. Eng. Sci. Technol. Int. J. 2020, 23, 1182–1193. [Google Scholar] [CrossRef]
- Fluent, A. Fluent 14.0 User’s Guide; ANSYS FLUENT Inc.: Lebanon, NH, USA, 2011. [Google Scholar]
- Sadikin, A.; Yunus, N.A.M.; Abd Hamid, S.A.; Md Salleh, S.; Rahman, M.N.A.; Mahzan, S.; Ayop, S.S. A comparative study of turbulence models on aerodynamics characteristics of a NACA0012 airfoil. Int. J. Integ. Eng. 2018, 1, 10. [Google Scholar] [CrossRef] [Green Version]
- Versteeg, H.; Malalasekera, W. An Introduction to Computational Fluid Dynamics: The Finite Volume Method; Pearson Education: London, UK, 2007; ISBN 0131274988. [Google Scholar]
- Pang, A.L.J.; Skote, M.; Lim, S.Y. Modelling high Re flow around a 2D cylindrical bluff body using the k-ω (SST) turbulence model. Prog. Comput. Fluid Dyn. Int. J. 2016, 16, 48–57. [Google Scholar] [CrossRef]
- Bons, J.P. A review of surface roughness effects in gas turbines. ASME J. Turbomach. 2010, 132, 021004. [Google Scholar] [CrossRef]
- Pattanapol, W.; Wakes, S.J.; Hilton, M.J.; Dickinson, K.J.M. Modeling of surface roughness for flow over a complex vegetated surface. Int. J. Math. Phys. Eng. Sci. 2008, 2, 18–26. [Google Scholar]
- Adams, T.; Grant, C.; Watson, H. A simple algorithm to relate measured surface roughness to equivalent sand-grain roughness. Int. J. Mech. Eng. Mechatron. 2012, 1, 66–71. [Google Scholar] [CrossRef]
- Chakroun, W.; Al-Mesri, I.; Al-Fahad, S. Effect of surface roughness on the aerodynamic characteristics of a symmetrical airfoil. Wind Eng. 2004, 28, 547–564. [Google Scholar] [CrossRef]
- Hummel, F.; Lötzerich, M.; Cardamone, P.; Fottner, L. Surface roughness effects on turbine blade aerodynamics. ASME J. Turbomach. 2005, 127, 453–461. [Google Scholar] [CrossRef]


| Specimen # | Tray Location | Build Orientation | Surface Finish Setting |
|---|---|---|---|
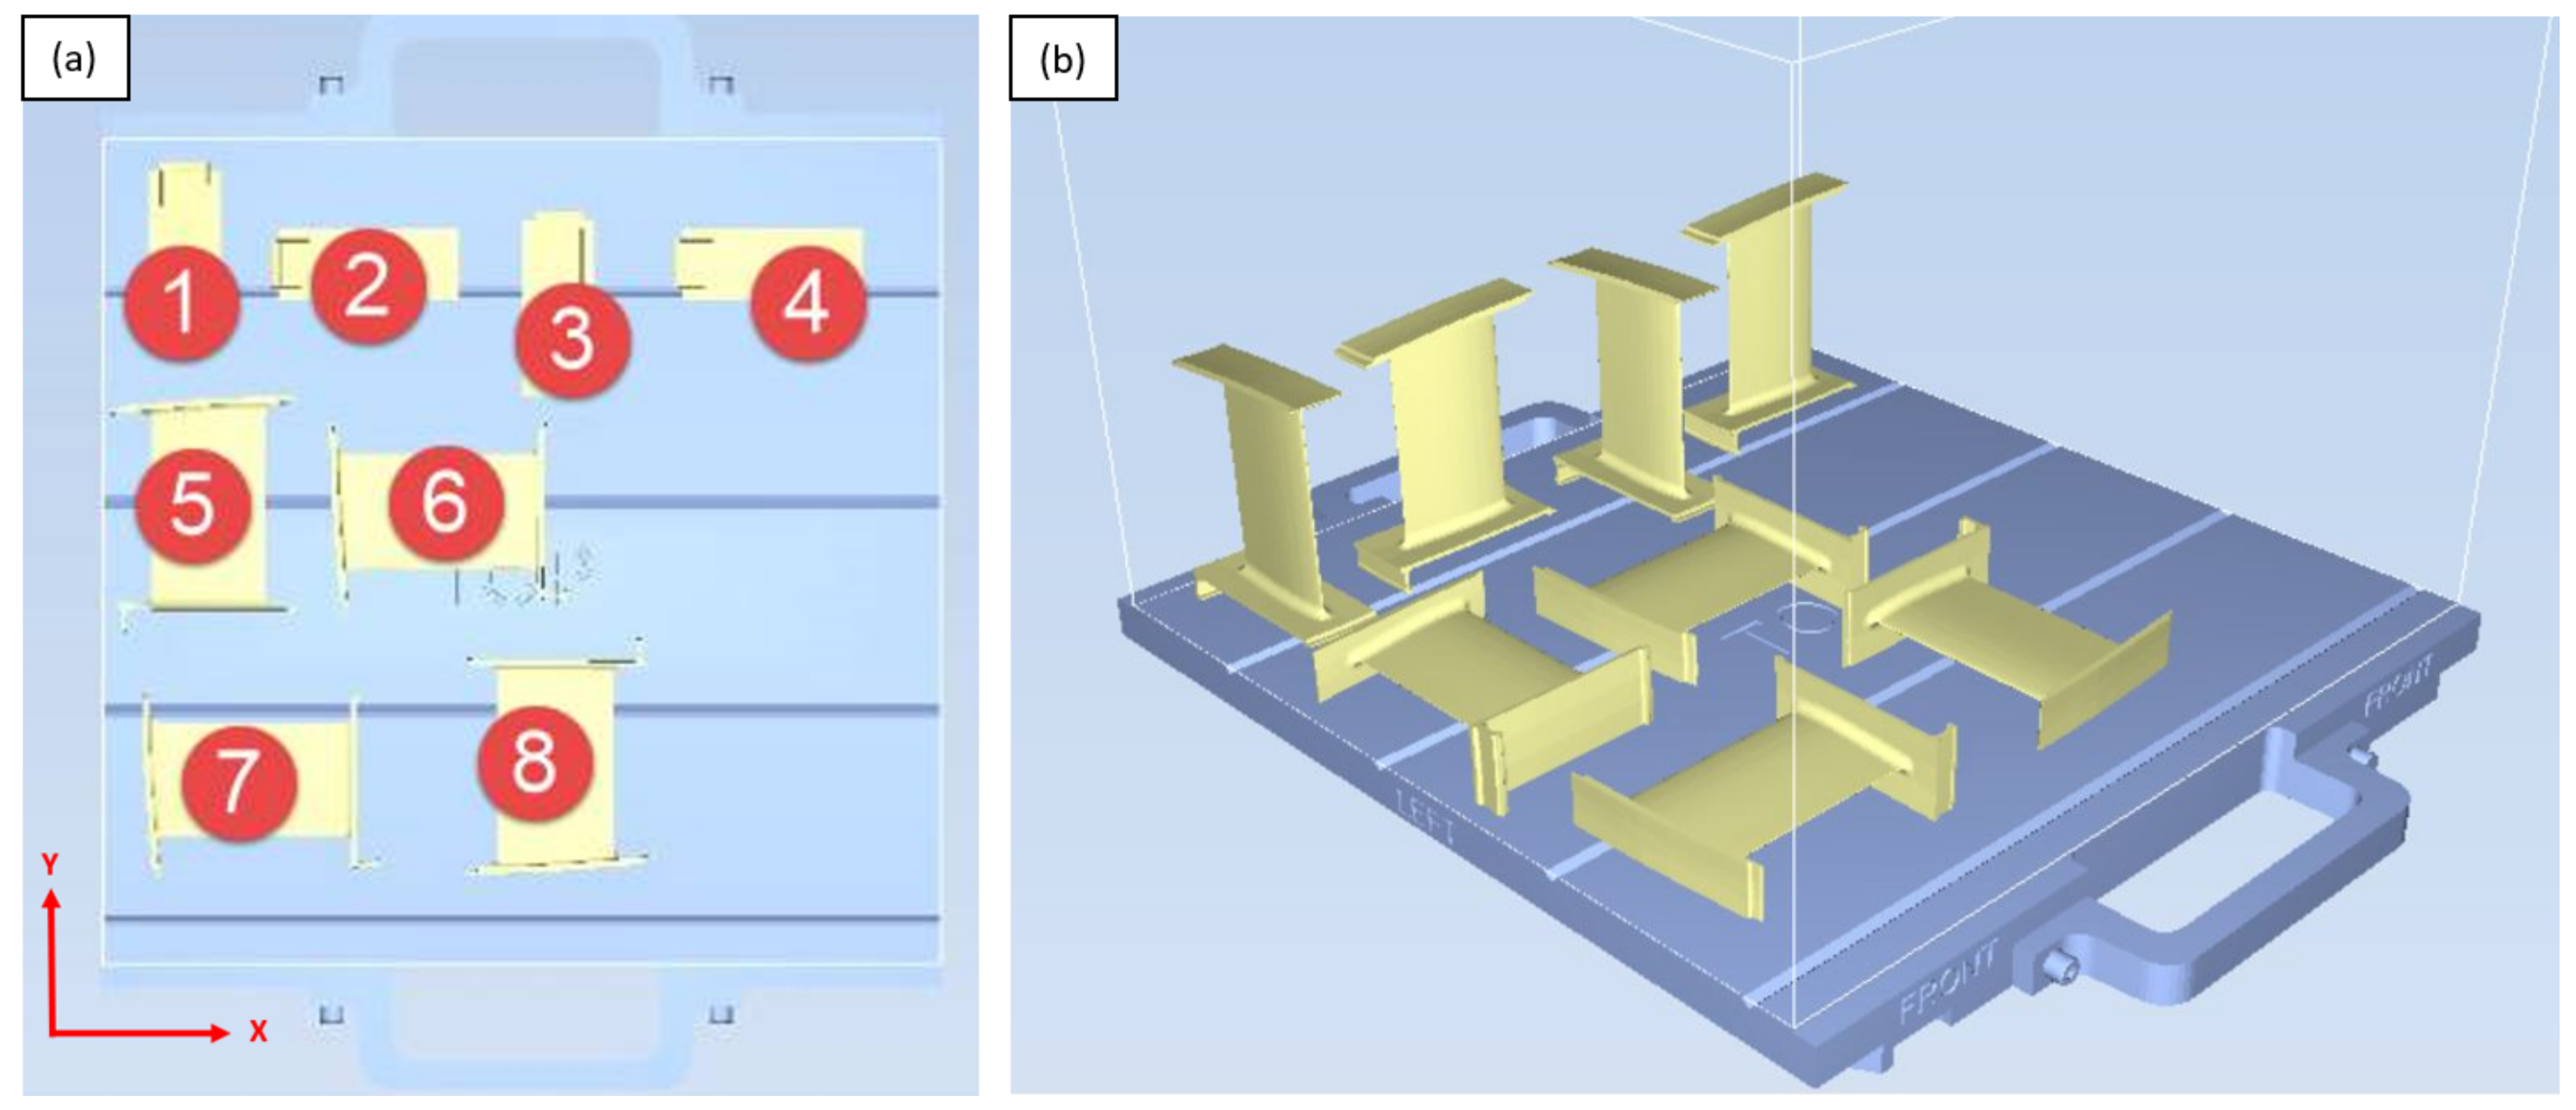
| 1 | Along Y axis | Vertical | Matte |
| 2 | Along X axis | Vertical | Matte |
| 3 | Along Y axis | Vertical | Glossy |
| 4 | Along X axis | Vertical | Glossy |
| 5 | Along Y axis | Horizontal | Matte |
| 6 | Along X axis | Horizontal | Matte |
| 7 | Along X axis | Horizontal | Glossy |
| 8 | Along Y axis | Horizontal | Glossy |
| Low Velocity | Mid-Level Velocity | High Velocity |
|---|---|---|
| 40 km/h | 65 km/h | 90 km/h |
| MAC | Wing Area | Viscosity | Density |
|---|---|---|---|
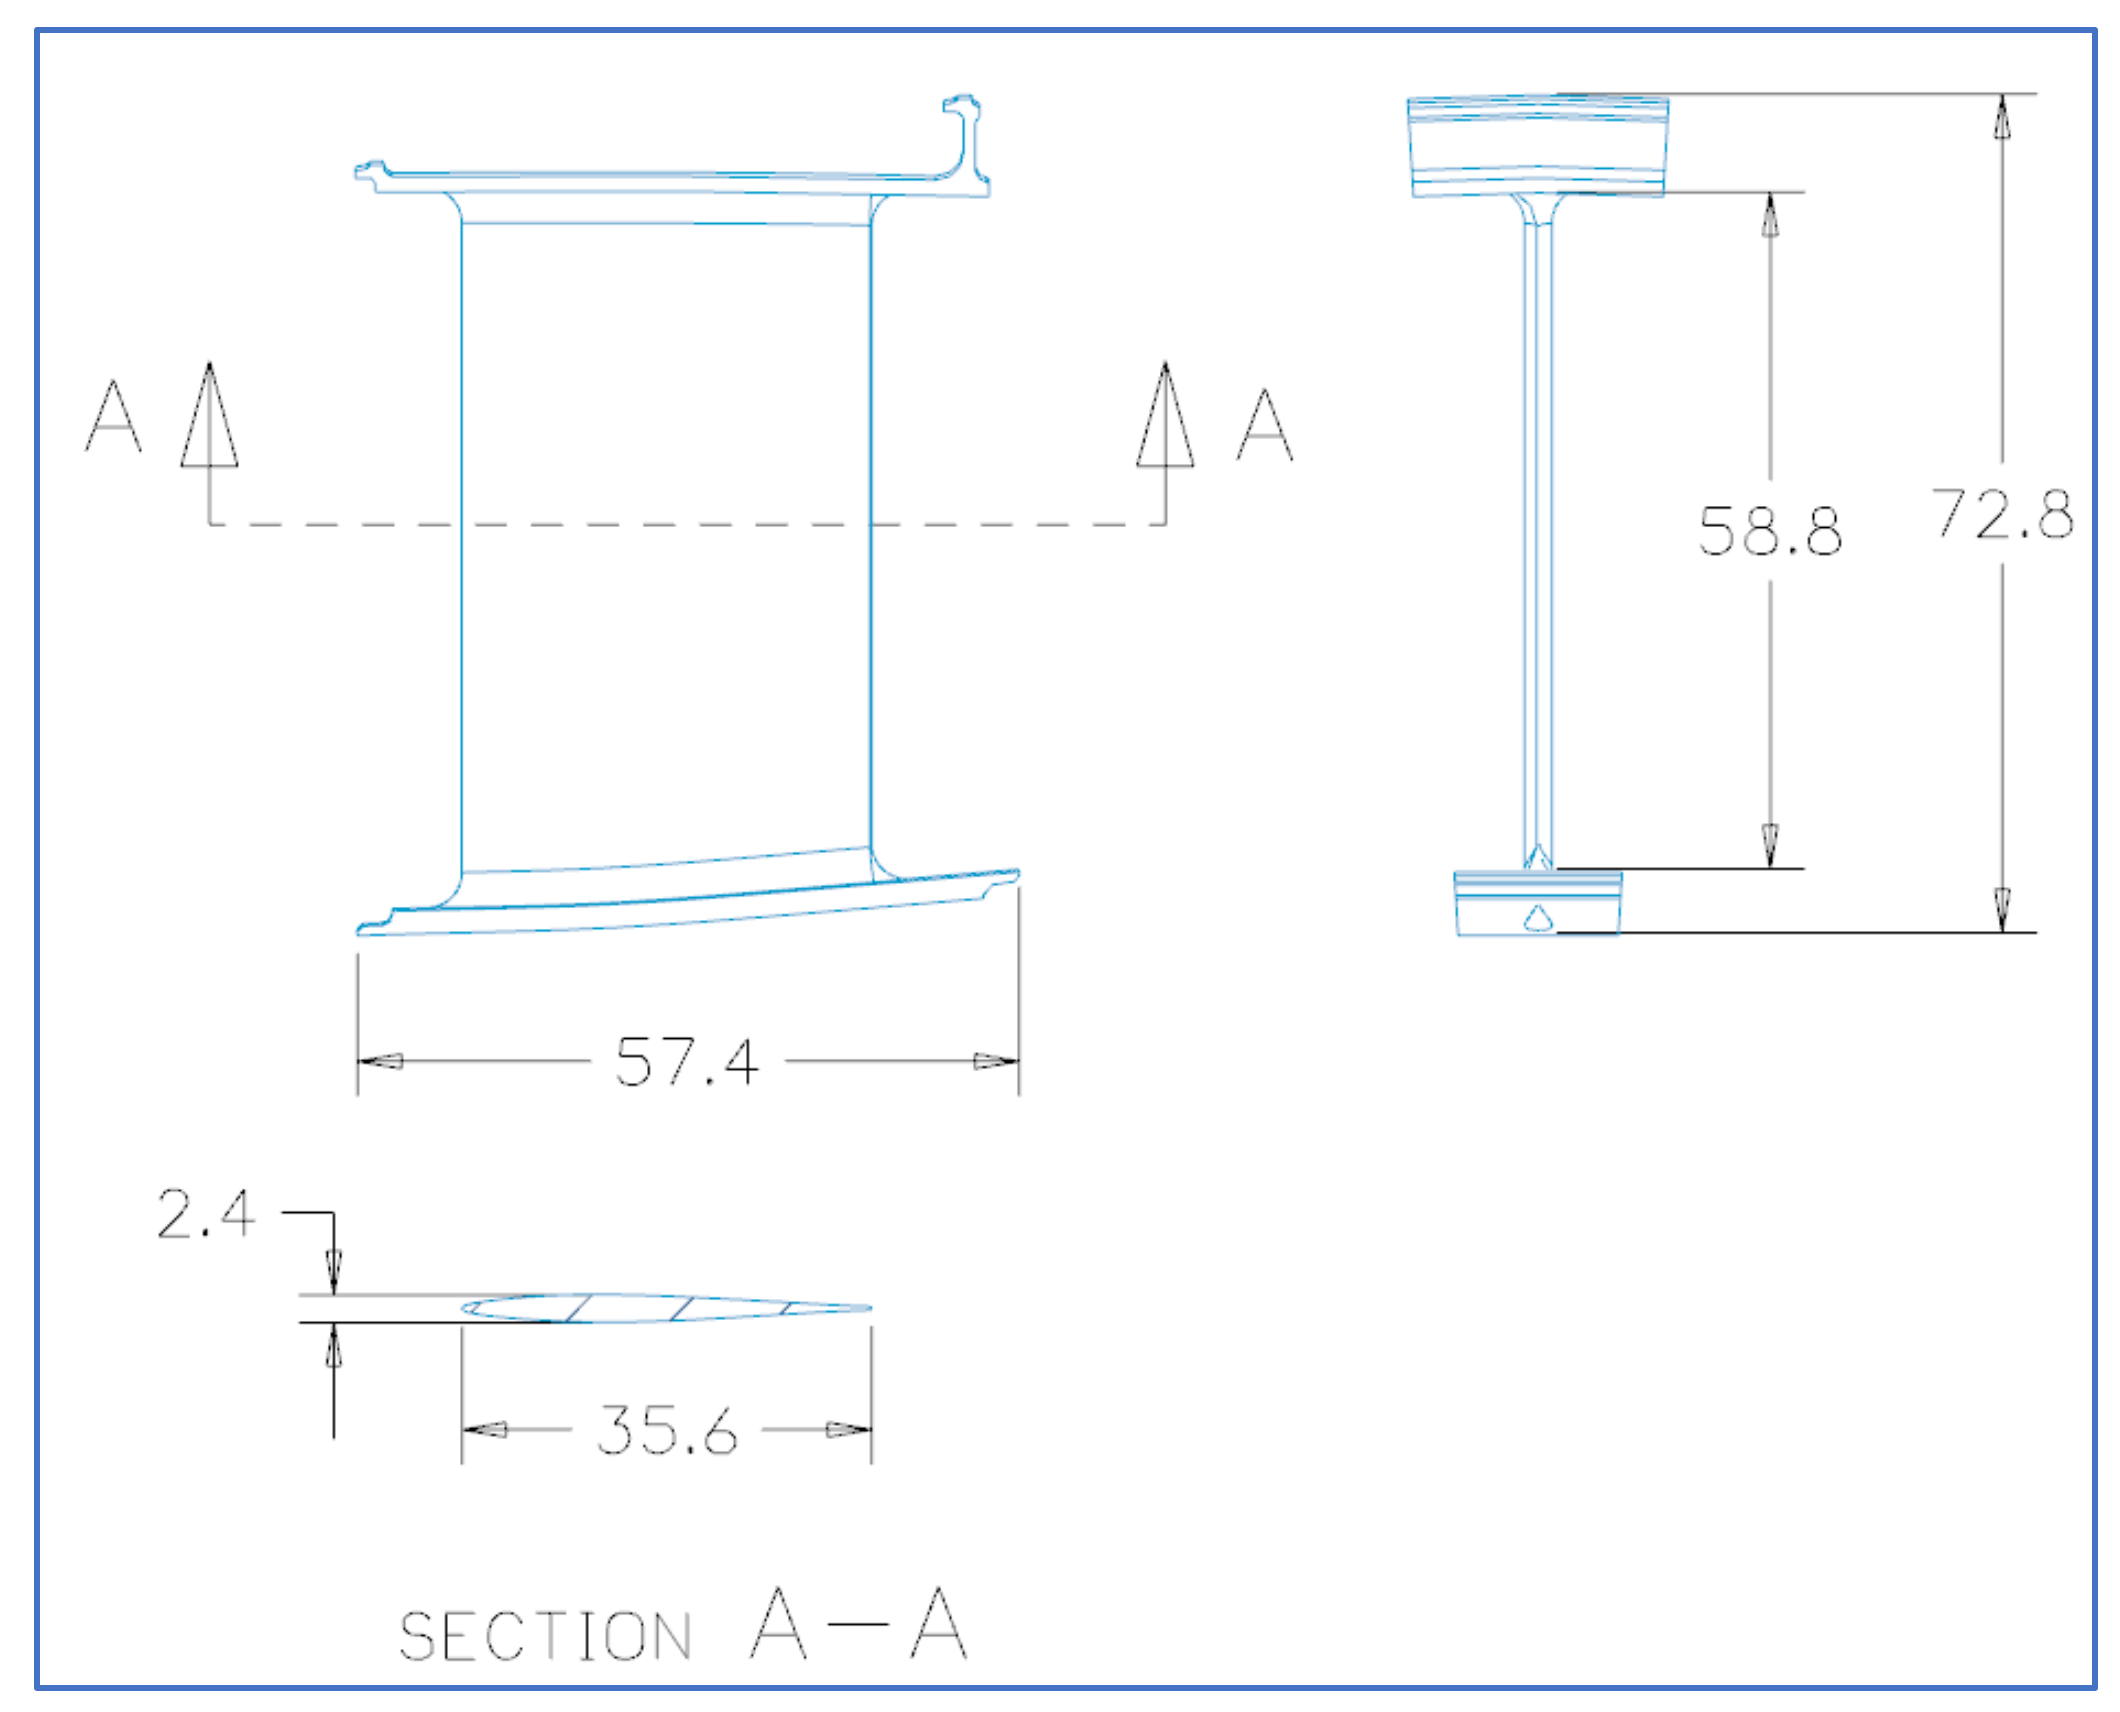
| 35.6 mm | 3500 mm2 | 1.7894 × 10⁻⁵ kg/m.s | 1.225 kg/m3 |
| Specimen # | Measurement Directions Along | Measurement # | 1st Surface * | 1st Surface * | 2nd Surface * | 2nd Surface * |
|---|---|---|---|---|---|---|
| 1 | Y and Z | 1st | 59.6 | 16.6 | 341.7 | 477.1 |
| 2nd | 46.9 | 554.0 | 255.1 | 408.3 | ||
| 3rd | 10.6 | 687.9 | 200.6 | 369.3 | ||
| Average | 39.03 | 419.5 | 265.8 | 418.23 | ||
| 2 | X and Z | 1st | 35.9 | 248.7 | 51.7 | 377.3 |
| 2nd | 33.7 | 269.9 | 50.8 | 290.7 | ||
| 3rd | 32.5 | 289 | 63.4 | 398.4 | ||
| Average | 34.0 | 269.2 | 55.3 | 355.5 | ||
| 3 | Y and Z | 1st | 69.2 | 324.3 | 243.3 | 550.9 |
| 2nd | 52 | 387.5 | 148.5 | 506.7 | ||
| 3rd | 37.1 | 340.5 | 227.1 | 547.7 | ||
| Average | 52.8 | 350.8 | 206.3 | 535.1 | ||
| 4 | X and Z | 1st | 40.8 | 208.8 | 101.5 | 336.2 |
| 2nd | 44.8 | 230.7 | 90.1 | 323.2 | ||
| 3rd | 53.4 | 221 | 73.1 | 284.2 | ||
| Average | 46.3 | 220.2 | 88.2 | 314.5 | ||
| 5 | X and Y | 1st | 9.1 | 19.6 | 41.5 | 54.0 |
| 2nd | 9.3 | 14.5 | 33.2 | 59.0 | ||
| 3rd | 10.7 | 20.5 | 34.1 | 89.0 | ||
| Average | 9.7 | 18.2 | 36.27 | 67.33 | ||
| 6 | X and Y | 1st | 1.9 | 23.0 | 20.3 | 57.2 |
| 2nd | 1.1 | 23.8 | 22.6 | 48.2 | ||
| 3rd | 1.0 | 18.9 | 11.2 | 70.4 | ||
| Average | 1.3 | 21.9 | 18.0 | 58.6 | ||
| 7 | X and Y | 1st | 0.8 | 15.5 | 31.6 | 48.6 |
| 2nd | 10.2 | 14.5 | 59.1 | 52.3 | ||
| 3rd | 0.8 | 15.6 | 35.6 | 75.6 | ||
| Average | 3.9 | 15.2 | 42.1 | 58.8 | ||
| 8 | X and Y | 1st | 5.3 | 24.5 | 61.7 | 74.6 |
| 2nd | 7.7 | 21.7 | 43.8 | 55.4 | ||
| 3rd | 6.7 | 22.6 | 48.0 | 26.1 | ||
| Average | 6.6 | 22.9 | 51.2 | 52.0 |
| Velocity | Ra Value (µinch) | CD | CD Diff. (%) | CL | CL Diff. (%) |
|---|---|---|---|---|---|
| 90 km/h | 0 | 1.43 × 10⁻⁴ | - | 1.24 × 10⁻⁴ | - |
| 265.08 | 1.54 × 10⁻⁴ | 7.48 | 9.83 × 10⁻⁵ | −20.66 | |
| 65 km/h | 0 | 8.21 × 10⁻⁵ | - | 6.371 × 10⁻⁵ | - |
| 265.08 | 8.52 × 10⁻⁵ | 3.71 | 5.358 × 10⁻⁵ | −18.90 | |
| 40 km/h | 0 | 3.67 × 10⁻⁵ | - | 2.403 × 10⁻⁵ | - |
| 265.08 | 3.72 × 10⁻⁵ | 1.26 | 2.199 × 10⁻⁵ | −9.29 |
| Angle of Attack (°) | Ra Value (µinch) | CD | CD Diff. with Smooth (%) | CL | CL Diff. with Smooth (%) |
|---|---|---|---|---|---|
| −5 | 0 | 2.70 × 10⁻⁴ | −3.92 × 10⁻³ | ||
| 88.20 | 2.73 × 10⁻⁴ | 1.18 | −3.99 × 10⁻³ | 1.74 | |
| 265.08 | 2.76 × 10⁻⁴ | 2.37 | −4.00 × 10⁻³ | 1.83 | |
| 0 | 0 | 1.43 × 10⁻⁴ | 1.24 × 10⁻⁴ | ||
| 88.20 | 1.47 × 10⁻⁴ | 2.89 | 1.07 × 10⁻⁴ | −13.65 | |
| 265.08 | 1.54 × 10⁻⁴ | 7.48 | 9.83 × 10⁻⁵ | −20.66 | |
| 5 | 0 | 2.42 × 10⁻⁴ | 3.94 × 10⁻³ | ||
| 88.20 | 2.45 × 10⁻⁴ | 1.02 | 3.91 × 10⁻³ | −0.75 | |
| 265.08 | 2.46 × 10⁻⁴ | 1.32 | 3.89 × 10⁻³ | −1.13 | |
| 10 | 0 | 9.25 × 10⁻⁴ | 6.16 × 10⁻³ | ||
| 88.20 | 9.88 × 10⁻⁴ | 6.81 | 6.00 × 10⁻³ | −2.66 | |
| 265.08 | 1.05 × 10⁻³ | 12.96 | 5.85 × 10⁻³ | −5.10 | |
| 15 | 0 | 1.63 × 10⁻³ | 5.39 × 10⁻³ | ||
| 88.20 | 1.64 × 10⁻³ | 1.06 | 5.33 × 10⁻³ | −1.06 | |
| 265.08 | 1.67 × 10⁻³ | 2.47 | 5.29 × 10⁻³ | −1.79 | |
| 20 | 0 | 2.36 × 10⁻³ | 6.14 × 10⁻³ | ||
| 88.20 | 2.42 × 10⁻³ | 2.79 | 5.99 × 10⁻³ | −2.43 | |
| 265.08 | 2.48 × 10⁻³ | 5.10 | 5.77 × 10⁻³ | −6.04 | |
| 25 | 0 | 3.20 × 10⁻³ | 6.78 × 10⁻³ | ||
| 88.20 | 3.32 × 10⁻³ | 3.65 | 6.54 × 10⁻³ | −3.63 | |
| 265.08 | 3.44 × 10⁻³ | 7.40 | 6.26 × 10⁻³ | −7.69 | |
| 30 | 0 | 4.16 × 10⁻³ | 6.83 × 10⁻³ | ||
| 88.20 | 4.17 × 10⁻³ | 0.26 | 6.72 × 10⁻³ | −1.69 | |
| 265.08 | 4.23 × 10⁻³ | 1.66 | 6.70 × 10⁻³ | −1.98 |
Publisher’s Note: MDPI stays neutral with regard to jurisdictional claims in published maps and institutional affiliations. |
© 2022 by the authors. Licensee MDPI, Basel, Switzerland. This article is an open access article distributed under the terms and conditions of the Creative Commons Attribution (CC BY) license (https://creativecommons.org/licenses/by/4.0/).
Share and Cite
Gülcan, O.; Günaydın, K.; Çelik, A. Investigation on Surface Roughness of PolyJet-Printed Airfoil Geometries for Small UAV Applications. Aerospace 2022, 9, 82. https://doi.org/10.3390/aerospace9020082
Gülcan O, Günaydın K, Çelik A. Investigation on Surface Roughness of PolyJet-Printed Airfoil Geometries for Small UAV Applications. Aerospace. 2022; 9(2):82. https://doi.org/10.3390/aerospace9020082
Chicago/Turabian StyleGülcan, Orhan, Kadir Günaydın, and Alican Çelik. 2022. "Investigation on Surface Roughness of PolyJet-Printed Airfoil Geometries for Small UAV Applications" Aerospace 9, no. 2: 82. https://doi.org/10.3390/aerospace9020082
APA StyleGülcan, O., Günaydın, K., & Çelik, A. (2022). Investigation on Surface Roughness of PolyJet-Printed Airfoil Geometries for Small UAV Applications. Aerospace, 9(2), 82. https://doi.org/10.3390/aerospace9020082