1. Introduction
The planetary boundary layer is the connecting layer between a planet’s surface and its atmosphere. Understanding atmospheric processes within this layer is of interest from both a scientific and operational point of view. Convection is believed [
1] to be a major transportation process uplifting dust from the surface into the upper atmosphere. In this model, dust is lifted by wind shear at the interface to the soil but remains trapped within the first meters above the surface. Radiative heating and the resulting convective uplift provide a transportation path into higher altitudes where the dust enters planetary scale circulations. Plumes and vortices extend to heights of 5 km to 10 km into the atmosphere. In [
2], it was shown with simulation studies that topographic peaks enforce thermal convection with anabatic flows during the daytime, causing plumes to rise beyond the surrounding boundary layer. On the other hand, turbulences caused by such convective instabilities and from the vertical shear of horizontal wind are a potential hazard for approaching landing systems, which have to go through several configuration changes in the breaking process while passing through this final atmospheric layer before touchdown. Previous landings stayed clear of larger topographic formations to circumnavigate potential adverse effects on landing safety from the surface properties itself but also from associated atmospheric hazards [
3]. Over the past decades, several numerical atmosphere models with resolutions from global to regional and local came into use. They have been applied to investigate fundamental research questions, including the aforementioned, and to provide mission analysis support for landing and surface missions. Examples are the Mars Weather Research and Forecasting model (MarsWRF, [
4]) and the Mars Regional Atmospheric Modeling System (MRAMS, [
5]) which have been used for Mars Science Laboratory (MSL) rover landing [
6], and Perseverance rover surface and science operation planning [
7], as one of the most recent applications. Science and exploration objectives for future missions, however, demand landings closer to such interesting topographic formations [
8], which in turn requires a deeper understanding of local and mesoscale weather phenomena at those sites.
The aforementioned analyses are based on numerical simulations and what little in situ observational data is available to validate the underlying models and its predictions. Related investigations obtaining such in situ observational data have been requested by the Mars Exploration Program Advisory Group (MEPAG) in its 2018 update [
9]. These are formulated under goal II, “Understand processes of climate of Mars”, and goal IV, “Prepare for human exploration”. The underlying investigations are cross-cutting and specifically call to:
“Measure the state and variability of the lower atmosphere” (investigation A1.1),
“Measure the forcings that control the dynamics and thermal structure” (A1.3),
“Monitor dust and aerosol activity, capture the frequency of events, define the duration, horizontal extent and evolution of extreme events” (B1.1),
“Characterize near-surface meteorology (B1.2)”, and
“Profile near-surface winds (<15 km) with a precision of <2 m/s in representative regions” (B1.4).
The concept investigated in this study responds to those stipulated investigations with a balloon-type probe, associated specific research objectives and a suite of sensors as strawman instrumentation. These are outlined in the following chapter. It is worth noting that Martian balloon-system concepts are not new and have been proposed repeatedly over the past decades. Their mission objectives and purposes, however, have changed over time. Early concepts in the pre-rover era, such as the Mars ‘94/’96 mission proposal [
10], considered balloons as platforms to access different sites, including intermittent surface contact, along their flight path for not just meteorologically oriented instrumentation but also instrumentation that nowadays is more meaningfully accommodated with rover missions. With the advancement of rovers, the objectives gradually shifted from general purpose instrument carriers towards more specific objectives for aerial platforms, including high-resolution remote sensing applications, but without surface-contact science instrumentation, as considered in the Mars 2001 Aerobot concept [
11]. All of them shared one commonality: a payload and gondola mass of the order of several kilograms, which required accordingly large balloon hulls with dimensions in the order of several tens of meters. It is still commonly recognized that such large systems cannot be safely inflated on or from the ground without inadvertent contact to the ground and/or spacecraft parts. In [
12], ground inflation was described as ‘impractical and mass intensive’, which is certainly true when the sole and exclusive use of a landing system is to deliver a balloon-probe. Aerial inflation has been considered instead as a more manageable alternative, which only requires a dedicated entry and descent element for its delivery [
13]. It has been successfully demonstrated in terrestrial tests [
14] but introduces new risk contributors by relying on completing the deployment process within the few minutes of the entry and descent timeline. The main motivations for revisiting a balloon-probe concept are the ongoing and strong scientific need, specifically from atmospheric sciences, and the enormous progress in the miniaturization of electronics and sensors, which already enabled other aerial platforms such as JPL’s Ingenuity helicopter drone. This companion [
15] of NASA/JPL’s Perseverance rover is a technology demonstration that successfully demonstrated controlled aerial mobility on Mars. Data gained from this flight experiment will quite certainly significantly improve associated design methodology, technologies and operational concepts for future, even more capable helicopter systems. Such advanced systems are expected [
15] to have a daily range capability of 2 km to 10 km and a service ceiling of several hundred meters with a payload capacity of up to 5 kg. Roles and ‘work share’ between such drones and balloons or potential ‘lighter-than-air’ systems are therefore important to clarify, based on their respective capabilities, for upcoming missions and are therefore addressed in the discussion section of this publication.
The subsequent chapter ‘Scientific concept of operations, instrumentation and mission profile’ elaborates on the scientific objectives and associated mission design. The chapter ‘Baseline system design’ includes details on the baseline system design and the resulting balloon hull when using present day technology for the balloon probe. The resulting, comparatively small, probe makes accommodation on a lander deck among other payloads feasible and thereby avoids the reliance on an exclusive Entry, Descent and Landing (EDL) system. Its size also enables deployment off the ground with manageable risk levels. Given its importance in the technical and programmatical risk assessment, the chapter ‘Probability of a safe deployment and risk mitigation’ is dedicated to the method of estimating the deployment success probability and the associated risk mitigation strategies.
2. Scientific Concept of Operations, Instrumentation and Mission Profile
The investigated experiment concept responds to the aforementioned MEPAG high level investigations with its following instrument objectives:
Observe the interaction of the atmosphere with the surface with simultaneous measurements of radiative heat and turbulent fluxes, and hence the forcings and effects of the transportation process of dust and other aerosols from the ground into the atmosphere. It tests the hypothesis of deep convective plumes being a major path for dust uplift.
Monitor the magnitude, spectrum and spatial extent of turbulent zones caused by convective instabilities and vertical shear of the horizontal wind. It shall provide data of to what degree the magnitude and extent are correlated with the topographic relief underneath.
Provide temporally and spatially highly resolved data usable for validation and improvement of numerical, model-based predictions [
2] of mesoscale phenomena. It shall fill the data gap for regions not yet accessed (or not yet accessible) by landers or rovers. Validation of orbiter global observational data by measurements of synoptic-scale circulation.
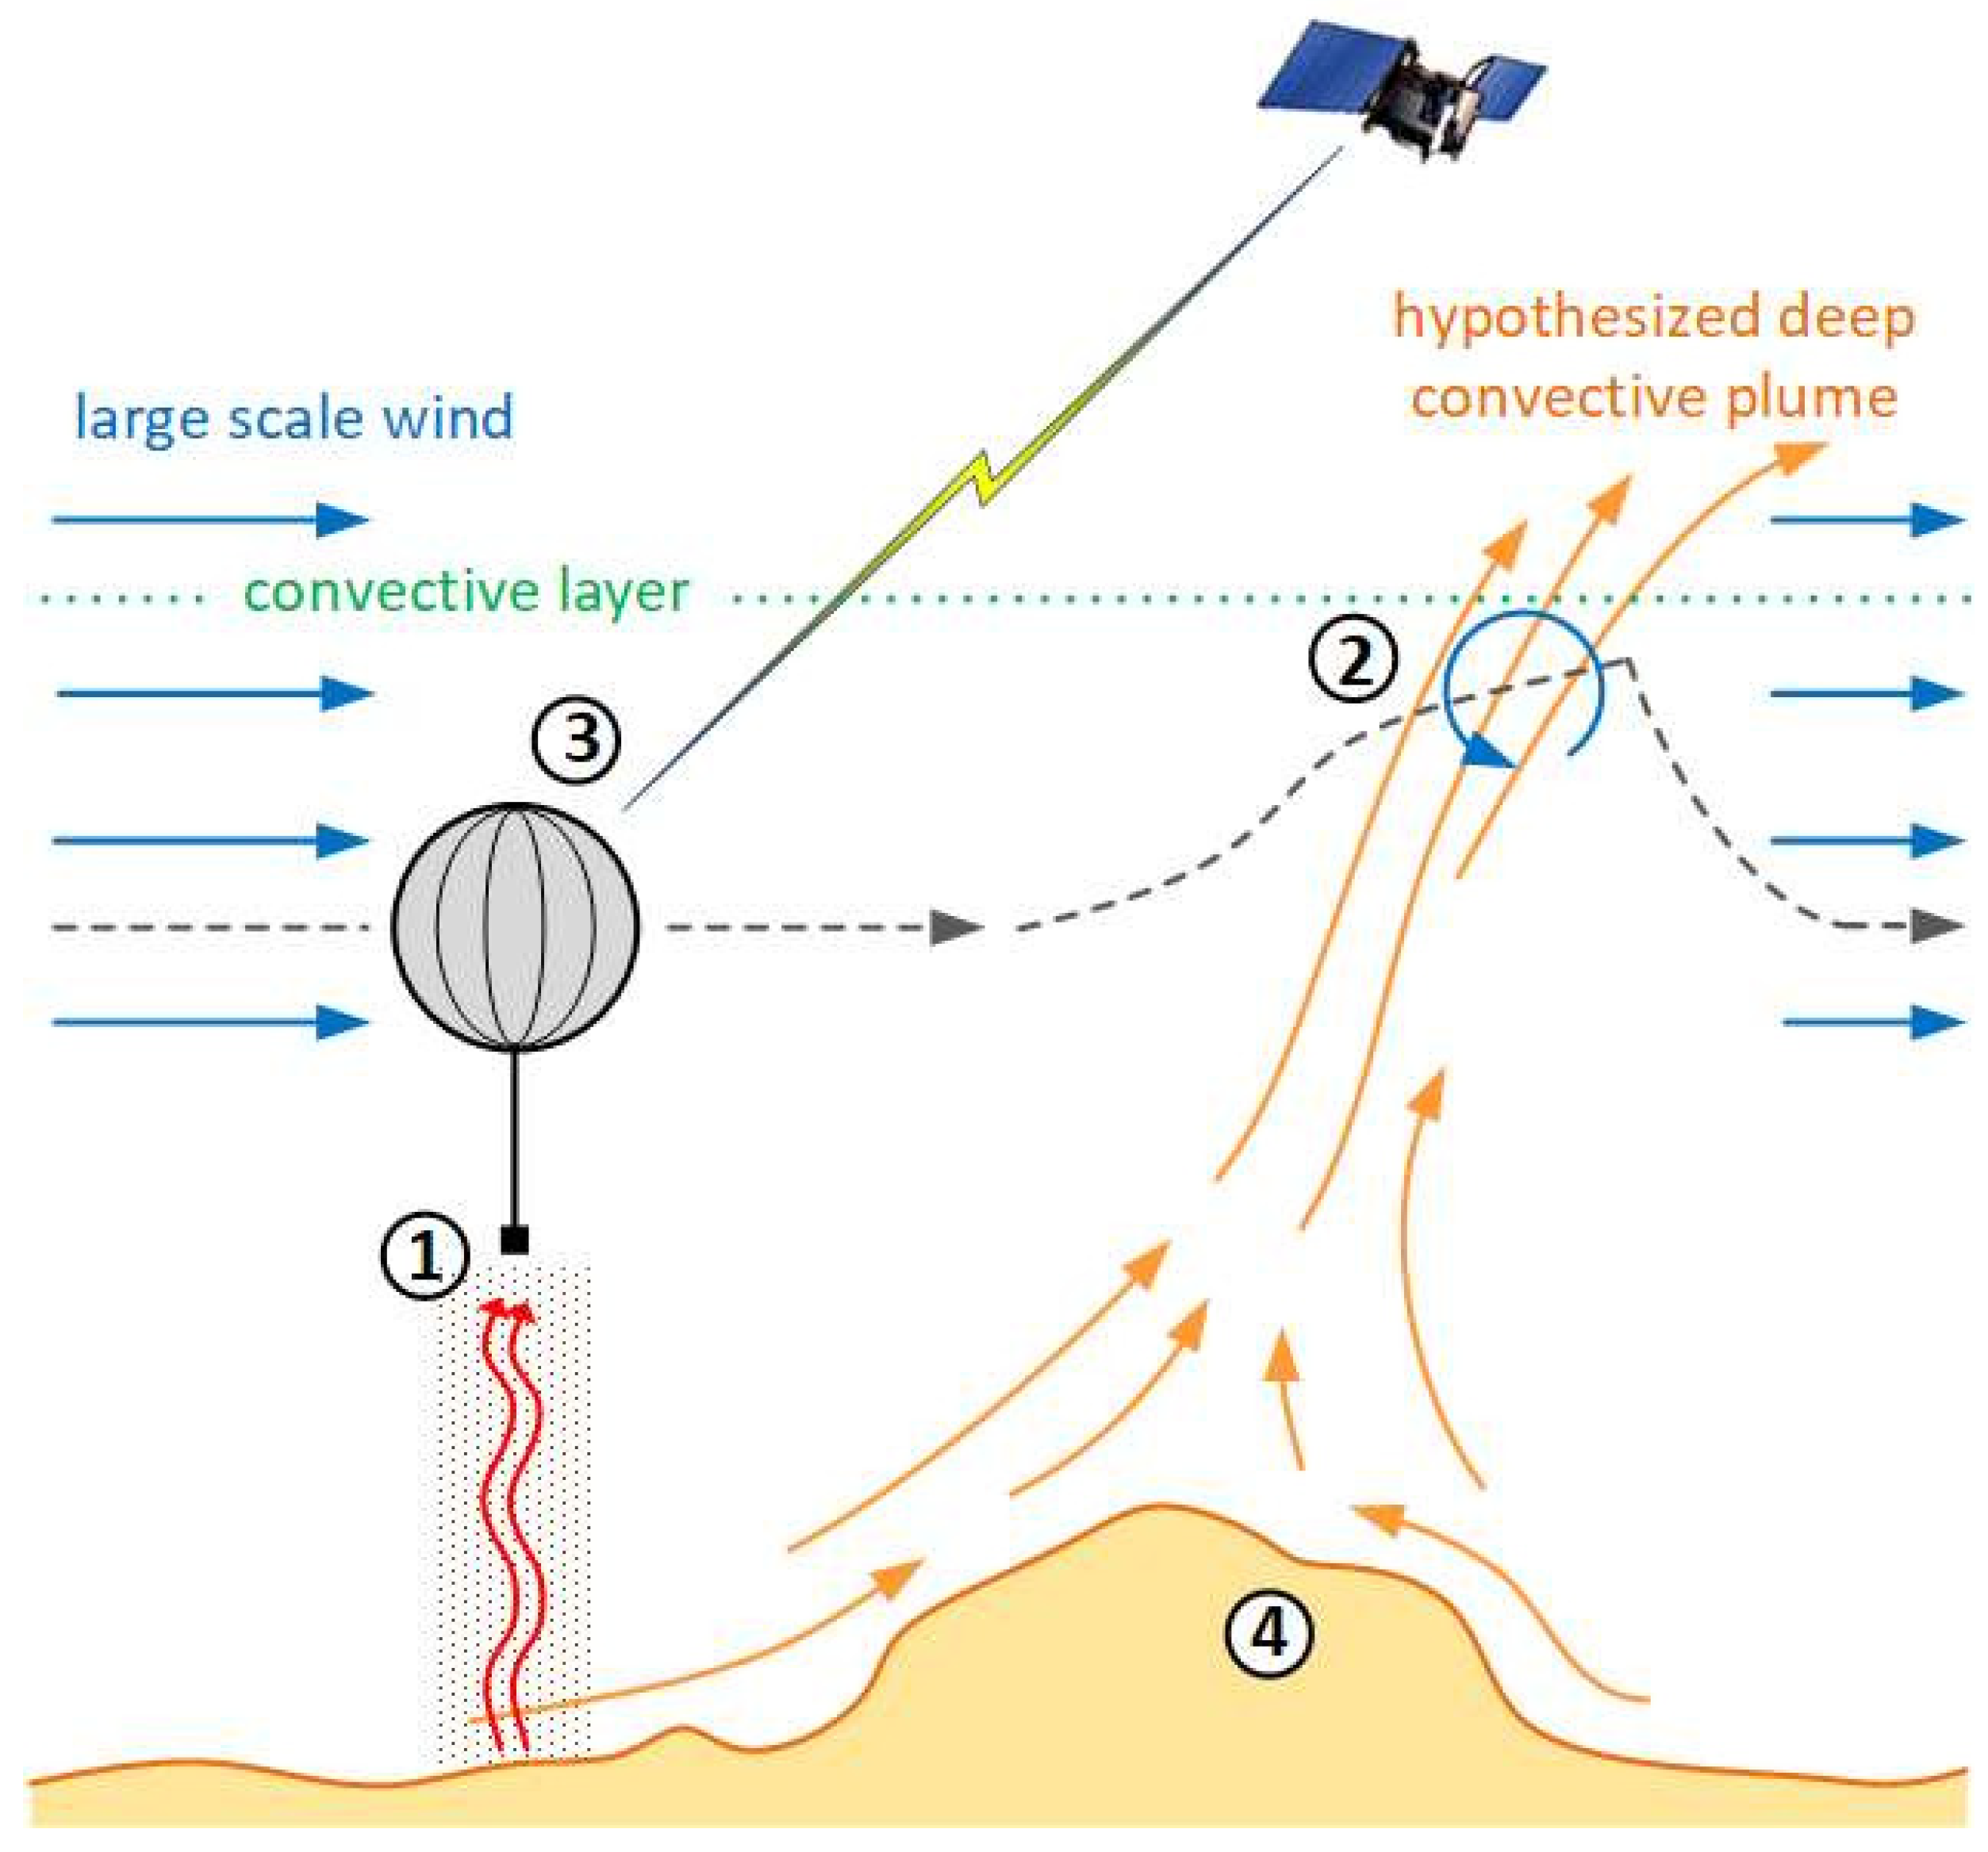
The associated scientific concept of operations is illustrated in
Figure 1. Measurements of upwelling radiation ① are performed in the 7 to 16 µm wavelength range to determine soil surface temperature, the temperature of the air column underneath the gondola and the aerosol (dust) content. Onboard humidity and temperature sensors measure the relative humidity at the balloon altitude. The whole balloon system acts as a wind sensitive probe ② to detect vertical wind velocity components. The vertical wind component and turbulence spectra are measured by baro-integrated inertial data and differential air data around the gondola, respectively. Large scale horizontal wind components are deduced from the balloon trajectory obtained from radio tracking ③. Balloon position allows the correlation of measurements to orographic features and thermo-physical surface properties ④. Altogether, these measurements allow a simultaneous monitoring of key driving forces—thermal gradients and orography—and the magnitude of resulting vertical turbulent fluxes.
The probe shall have a lifetime of at least two Martian days and shall traverse a distance of at least 1000 km, whatever mark is achieved later. This shall ensure that repeated diurnal effects can be observed, a diversity of topographic features is crossed and large-scale wind patterns can be resolved. It shall probe the daytime convective layer, which requires a cruising altitude of less than 5000 m above ground level. The implications for the system and mission design are twofold:
As an obviously necessary condition, the power and thermal budgets must support such a mission,
The balloon design altitude then depends on the selected launch site and expected operations area to provide flight altitude above ground level, satisfying the requirement to probe the convective layer while mitigating the risk of drifting into terrain.
The ’expected operations area’ can be constrained in the initial design phase from Global Circulation Models (GCM) and refined with higher-fidelity circulation and climate models in the subsequent phase. This aspect is also addressed in
Section 2.2 ‘Mission profile and trajectory simulation’.
2.1. Scientific Instrumentation
The types of measurements required to address the above-mentioned scientific objectives allow us to define a strawman payload and to refer to existing flight hardware. It is assumed that the instrumented gondola can be designed around this or similar state-of-the-art sensors. The required budget of this strawman instrumentation is considered in
Section 3.1 ‘Gondola’ for system sizing.
Radiometer: The radiometer of this balloon-probe is a nadir-looking, multi-spectral sensor using thermopiles as sensing elements. The radiometer design, whose technical parameters are taken as a baseline for this concept study, is based on DLR’s radiometer technology [
16] and was flown on the InSight mission [
17]. In this application, it will measure the radiative flux in three wavelength bands. Those are selected to support the retrieval of the following surface and atmospheric properties underneath the gondola:
15 µm CO2-temperature average temperature of the air column
9.35 µm Aerosol (dust) maximum proxy for the opacity of the atmosphere
7.94 µm Aerosol minimum surface temperature
Direct measurements of the radiative fluxes comparatively close to the surface-to-atmosphere interface provide ground-truth data complementary to orbiter-based spectrometer measurements. Additionally, the determination of the surface temperature and the average air column temperature—including the air temperature measurement at the balloon’s altitude—allow a reconstruction of the actual thermal gradient [
18] of the boundary layer and hence a major diagnostic parameter to assess the atmospheric stability in the traversed area.
Pressure, temperature and humidity sensors: The basic meteorology instrument suite is based on Micro Electrical Mechanical System (MEMS) sensors and measures the atmospheric pressure, temperature and humidity. The pressure sensor consists of an integrated Vaisala Barocap
® and Thermocap
® sensor head which has flown on previous Mars missions through the Finnish Meteorological Institute [
19,
20]. It features a measurement range of 0 to 1400 Pa, with an uncertainty on single readings of less than 2.7 Pa. The temperature- and humidity-sensing boom refers to a design proposed by the DLR and which is described by [
21]. A capacitive and a coulometric humidity sensor will be adapted to the conditions during the balloon flight. The capacitive polymer sensor (SHT 75) was already tested successfully under simulated Martian conditions [
22,
23]. The coulometric sensor has been found to work under Martian conditions in tests at DLR. The lower measuring limit of both sensors is 0.2 ppm, depending on the temperature for SHT75. Thin film or glass potted PT100 sensors in a four-wire measurement configuration can be used as temperature sensors with high accuracy [
17,
24].
Vertical wind speed and turbulence detection: A triad of accelerometers and gyros sense the motions of the gondola when the entire flight system is excited by turbulent flow. Integration of these inertial measurements together with the barometric altitude measurements provide an estimate of the vertical motion of the balloon-system, whereas the high-frequency portions in the inertial signal are indicative to the prevailing turbulence. Such a baro-aided inertial measurement is a common method, e.g., as described in [
25], in vertical positioning, but requires a due consideration of the super-imposed swinging mode of the gondola suspended underneath the balloon. The (vertical) air flow measurement around the gondola considers hot wire anemometric sensing as a baseline concept. It facilitates measurements similar to those described by [
26,
27], which used a propeller anemometer for this purpose, however.
Large-scale horizontal wind measurements: Wind speeds of mesoscale patters are derived from the balloon-system’s trajectory which is obtained from position tracking information. The balloon’s position is obtained by the radio tracking services, carried out by the fleet of Mars orbiters, which also act as relay satellites to the balloon-system. Radio tracking is enabled by the orbiter’s Electra UHF radios which feature a highly stable Doppler radio ranging function [
28] for such purposes. This requires the implementation of the CCSDS Proximity Link-1 protocol in the balloon’s communication subsystem (refer also to
Section 3.1 ‘Gondola‘).
Camera: A nadir-looking camera is considered primarily for event monitoring, and to support and augment the post-flight trajectory reconstruction. For the latter purpose, the camera takes periodic images along the flight path to augment and/or complement the radio tracking position determination by means of terrain-relative navigation techniques. For event monitoring, the image acquisition is triggered by mission events—e.g., after release from the lander deck—or on demand by rapid changes in environmental data—e.g., pressure changes—which could be indicative of certain weather phenomena such as dust devils. The camera considers a comparatively low VGA-resolution of 640 × 480 px to relax the data and power budget, taking an Omnivision camera cube [
29] as a budget sizing reference. The actual optics field-of-view angle must be a trade-off between surface feature resolution and landscape overview for event documentation and terrain-relative position estimation.
2.2. Mission Profile and Trajectory Simulation
A balloon flight and systems concept simulator has been implemented to enable a detailed mission analysis for different mission scenarios and/or system configurations. The simulator consists of three modules (also shown as block diagrams in
Figure 2) which are (i) the flight dynamics model and (ii) a thermal model, describing the temperature evolution of the balloon hull and the lifting gas, as well as the gondola’s avionic and battery core and its surrounding multi-layer insulation. In combination, they describe the balloon system model. Module (iii) contains an (externally sourced) environmental model of Mars.
The flight dynamics model considers a super-pressure sphere and calculates its motion states, hull pressure and hull volume evolution based on the ambient atmospheric conditions and the lifting gas’ thermal state. The flight dynamics model uses equations of motion described in [
30]. An algebraic equation describes the evolution of the hull volume. The entire system is regarded as point mass and does not model the relative degrees of freedom between the hull and the gondola suspended underneath. The thermal state of the system is based on a balloon hull and lifting gas model described in [
31] and considers the atmosphere temperature, the direct and reflected solar fluxes, and the surface and sky’s thermal radiation at local time of flight. The thermal model includes a model of the gondola [
32], which is likewise driven by the ambient atmospheric thermal and radiative states. Instrument mass, hull volume and hull thermo-optical properties considered in this simulation are shown in the figures given in the following system baseline chapter. Those environmental parameters are provided by the Mars Climate Database (MCD), version 5.3. This model is based on the Global Circulation Model (GCM) numerical simulations to describe diurnal and seasonal cycles and variations in the Martian atmosphere in a grid with a resolution of 32 pix/deg or ~1.852 km/pix. Detailed information about the background and functions of the MCD is given in [
33,
34]. The terrain model uses the blended High-Resolution Stereo Camera (HRSC) and Mars Orbiter Laser Altimeter (MOLA) high-resolution data set published in [
35]. The system model in its present form and together with MCD is a flight performance simulator usable for mission and system design. It allows assessments on flight altitude, ranges and directions which can generally be expected based on the global circulation pattern for a given date and site and make it a starting point for this general feasibility assessment. It has, however, no predictive capability about the actual trajectory the balloon would follow if actually launched. This would require replacing the GCM in the environment module with regional or mesoscale models (e.g., models as referenced in the introduction section) following a down-selection of the candidate landing and operations site.
Simulation Results
The balloon’s trajectory depends fundamentally on the date and place of a mission implementation. To assess flight profiles which could be expected from such a mission, this analysis assumes, in a ‘what-if’ scenario, a launch from a Jezero crater landing site at 18.5° N and 77.5° E in the northern summer and winter season with Ls = 60° and Ls = 240° and at 04:00 LTST. The simulated flight time is 50 h.
Figure 3 shows the proto-typical flight profiles of the conceptualized flight system. It ascends to a flight altitude approximately 2000 m above the reference geoid and a height above ground of initially 4000 m. The balloon is taken there by the large-scale winds into a generally north-westerly direction. The trajectories appear as a series of arcs and circles, driven by the diurnal and local circulation pattern and show what generally can be expected in this scenario due to prevailing global circulation and climate. The overflown track distance is coincidentally nearly 2000 km for both cases with a difference of approx. 15 km below figure resolution. The altitude/elevation chart also displays the predicted ceiling of the daytime convective layer. The flight system’s design altitude is deliberately chosen to allow the observation of the convective layer’s build-up and passage through its late-day upper extend.
The ‘drivers’ for the trajectories in terms of large-scale wind components and atmospheric density are given with more detail in
Figure 4 for the Ls = 60° scenario (similar charts for the Ls = 240° scenario are provided in
Appendix A for completeness). Diagram (a) and (b) show the variations of meridional and zonal wind components over altitude and along the mission time. The balloon’s flight altitude centers around the designed-to density altitude, whose diurnal variations let the balloon climb/descend in the geodetic frame.
3. Baseline System Design
This section introduces a baseline design of the balloon probe in response to the instruments’ scientific objectives and strawman sensor suite. It starts with a conceptualization of the gondola which integrates the sensor suite as well as its supporting avionics, structure and mechanisms. The balloon hull’s dimension depends on the system’s total mass, including the gondola and the balloon itself, and the altitude requirement prescribed by the concept of operations. In turn, the resulting hull volume and surface area drive the sizing of the lifting gas pressure vessel and of the balloon storage container. The resulting overall configuration and mass budget are summarized at the end of this chapter.
3.1. Gondola
The sensor suite and its data output are controlled and handled by an onboard computer using a system-on-chip architecture based on an ARM Cortex micro-controller. The communication subsystem is determined by the need to use the existing fleet of Mars orbiters as data relay and tracking nodes through their Electra radio units [
28]. Consequently, communication will be provided by a software-defined radio transmitting in UHF band in 100 mW output power with the protocol based CCSDS Proximity Link 1 standard. Data transmission will be done with rates between 2 kbps and 8 kbps over communication slant ranges between 1000 km and 400 km as the science case is not imaging-intensive and follows a similar scheme as shown by [
37]. The entire avionics and sensors demand of electrical power is estimated to be P
avg = 470 mW (P
peak = 730 mW), including maturity margins. Energy is provided in this concept by a primary battery package in 2s5p configuration containing 25 Wh (at −40 °C condition) to enable >50 h of continuous operation. The battery is based on LiSOCl2-cell technology, which is baselined here due to their proven high energy content and low temperature rating down to −60 °C. The gondola’s thermal design is passive and relies on a multi-layer insulation with α = 0.11 and ε = 0.03. The thermal mathematical model of the gondola is coupled with the flight dynamics model and the Mars Climate Database MCD, which determines the environmental conditions. The resulting temperature profiles for the simulated flights are shown in
Figure 5 and indicate a temperature variation of the gondola core of about 260 K to 310 K along the mission progress. A mechanism to unreel the suspension cord complements the gondola assembly. The gondola has a cylindrical shape with a diameter of 90 mm and a height of 120 mm, and an estimated mass of 600 g.
3.2. Balloon Hull
The key performance parameter for the hull is the achievable floating altitude for a given gondola mass. The floating altitudes for different hull diameters are depicted in
Figure 6 as a function of the gondola mass. This functional relation considers an exponential atmospheric density model and the dependency to the hull’s own mass for initial sizing. A 7 m diameter hull is selected to provide a nominal floating altitude of approximately 2000 m above the MOLA reference datum.
The hull is realized as a 20-gore super-pressure sphere. This shape is favored over more complex shapes such as the onion or pumpkin shape [
38] due to the comparatively low mass of the gondola and the better compatibility with the packing and folding scheme used for this particular project. The balloon hull shall consist of a thin-sheet polymer with an average thickness of 5.5 µm. Polyimide and PET have been assessed for this purpose and found to provide sufficient mechanical properties. The gores are glued to each other with an overlap butt joint using acrylic transfer glue. A seal tape is applied onto each seam to ensure gas tightness and improved load and stress distribution. The thermo-optical properties are determined by an aluminized surface with α = 0.11 and ε = 0.03, yielding a suitable temperature profile with a mean lifting gas temperature continuously above the ambient air temperature during the diurnal cycle. A laboratory ground test article of such a hull design at an approximate scale of 1:2 with a film thickness of 6 µm is shown in
Figure 7.
3.3. Balloon Support System
The intended automatized inflation and lift-off sequence requires a hull packing technique which avoids unintended contact with the surface or surrounding spacecraft structure. Hence, any folding pattern which would require unpacking before inflation is unsuitable. In this application, a technique is employed which unfolds the hull during its inflation according to the amount of lifting gas being filled in. This underlying folding pattern uses an ‘inverted-cone’ fold, originally investigated by [
39] as optimized packing for automotive airbags. Although the automotive airbag and the balloon have different inflation dynamics, they have in common that they both achieve a tight packing in a cylindrical housing of defined height and diameter. For both, reproducible and undistorted expansion is possible through their inflation media. In contrast to the airbag application, the packing and inflation scheme releases only the amount of soft-sheet material momentarily filled by the expanding gas. The balloon hull container houses a set of nested cylindrical baffles which can retain and guide the hull during extraction, seen in
Figure 8a. This particular test container with a sub-scale 1 m diameter balloon was used to investigate fundamental effects of container/baffle height and spacing. The associated inflation sequence is shown in
Figure 8(b1–b5). The container’s central cone provides the mechanical interface to the balloon’s bottom cap with its valve body, as seen in
Figure 8c.
The full-scale hull of the 7 m flight version would be folded into a cylindrical container with a diameter and height of 600 mm each. This container is assembled together with the required helium pressure vessel with a capacity of 4.7 L at 34 MPa, feedlines, a flow control unit, back-end electronics and harness into the balloon support system. The central cone in this full-scale variant will additionally house the gondola and its release mechanism.
3.4. Budgets and Configuration
The resulting instrument configuration with its main elements is shown in
Figure 9a. The actual routing of harnesses and feedlines depend on the integration with the hosting landing vehicle. The figure’s part (b) sketches the balloon in a ready-to-launch configuration with a notional accommodation on the mother craft. The latter refers to the still preliminary concept of a Sample Retrieval Lander, such as outlined, e.g., in [
40], as part of the Mars Sample Return scenario. The flight train in cruise configuration with a fully inflated hull and suspended gondola is shown in part (c).
Table 1 summarizes the concept’s current best estimate of all instruments and components together with their respective masses, leading to a total instrument mass of 14.9 kg including margins. The balloon flight element alone has a mass of approximately 2.3 kg.
4. Probability of a Safe Deployment and Risk Mitigation
The balloon hull extraction and inflation process is probably the most critical singular event to be mastered in any balloon mission sequence. The sequence (
Figure 8(b1–b5)) shows that at a certain point the entire hull gets clear of the container while lifting gas is still being supplied until reaching its target lifting gas load. During this period, the hull is very susceptible to being blown against surrounding objects on the ground or adjacent parts of the lander spacecraft by the surface winds. Contrarily, the maximum allowable blow-down angle is constrained by the available obstacle free safety cone (
Figure 10) of the hosting spacecraft, which is a major limiting factor for the safe wind speed limit.
To simulate the magnitude of this effect, the static blow-down angle, determined by the hull’s mass distribution, its drag and buoyancy, is calculated as a function of the momentary fill ratio Φ. The general flow regime is determined by the Knudsen number Kn, relating the molecular mean free path at Mars surface pressure conditions to the balloon hull diameter as characterizing dimension of the probe. With Kn ≈ 1.4∙10−5 << 0.01, the flow conditions can be described as continuum flow. The flow characterizing Reynolds number for the hull of 7 m diameter, Mars surface atmospheric conditions and wind speeds between 1 m/s and 10 m/s is of the order of Re ≈ 104 to 105.
The static blow-down angle β is described by the implicit function (Equation (1)) with K being the relation of contribution moments around the hold-down point at the bottom cap. The parameters L, W and D introduce the functions for lift (buoyancy only), weight and drag. The parameter (letter) l is the distance between this hold-down (pivot) point and the centers of lift, mass and pressure (subscripts CoL, CoM and CoP, respectively). The calculation of dimensions and projected areas relies thereby on the assumption, that the geometry remains in a ‘droplet’-like shape, as seen in
Figure 8.
The coefficient of drag C
D is at this study level only approximated from datasets for geometric primitive bodies in the relevant Reynolds regime (tables and charts from [
41] have been used), morphing between a conical shape and a sphere. It is expected to range between C
D ≈ 0.2 to 0.45, with the lower value representing a high blow-down angle with low fill ratio and the upper bound representing the low blow-down angle and a full inflation. Implicitly, this given number assumes that the flow condition stays in a subcritical regime as the Re number suggests an aerodynamically clean body. This assumption quite certainly does not hold true as the folds and wrinkles of the under-inflated hull are likely to trigger transitions from laminar to turbulent flows already in this regime. This could result in further reduction in the drag coefficient which would be beneficial to further reducing the blow-down angle but is here not quantifiable and hence not considered. For conservativism, especially at the critical high blow-down limits, a C
D = 0.45 has been taken consistently for all orientations.
For illustration, the resulting hull deflections for different fill ratios at a wind speed of V
w = 4 m/s are shown in
Figure 11. An entire set of blow-down angle iso-lines across this range of fill ratios and over a range of wind speeds is depicted in
Figure 12 (top).
The probability of achieving a deployment below a safe wind speed limit V
wlim can be assessed by using a metric also known as “survivability” [
42]. The probability P
safe (Equation (2)) of being inside safe wind limits is expressed as “not being unsafe”, where P
unsafe is determined by the susceptibility to adverse wind conditions, denoted as P
s, and vulnerability to those conditions, denoted as P
v.
Previous Mars surface missions have provided meteorological data sets for surface winds which allow us to derive weather statistics which can be used to estimate the probability of exceeding a certain wind speed limit V
wlim. The frequency of occurrence of certain wind speeds within an observation period can be described by the Weibull distribution function. Accordingly, the probability that a prevailing wind speed exceeds the wind speed limit is expressed by Equation (3) with the Weibull distribution parameters c, being the scale wind speed [m/s], and k, being a dimensionless shape parameter.
Its application as a Mars surface wind model is discussed in [
43], and Viking lander hourly averaged wind data was evaluated to provide estimates of the scale and shape parameter for the Viking sites. Those estimates are over observation episodes of several days. Similar analyses were published in [
44] for the Mars Science Laboratory’s Gale crater site, taking profit of higher frequent measurements of its environment monitoring station. The higher sampling rate provides a better resolution of the unsteadiness in the prevailing wind. Diurnal variations are accounted for by selecting the observation episodes as windows of several hours, whose duration is denoted here with the parameter w. Within an observation period, the likelihood of occurrence over time is uniform, meaning it disregards the preference of certain winds towards a point in time within that period. The resulting probability to be exposed to a certain wind condition is given by Equation (4) where d denotes the duration of inflation.
Consequently, the probability to stay inside safe limits can be increased by designing for a higher wind tolerance (larger V
wlim) and/or to avoid adverse wind conditions my minimizing the exposure time with a short inflation duration d. The resulting probabilities as functions of the parameters V
wlim and d are plotted in
Figure 12 (bottom). As an example, this set of curves is based on the Weibull distribution parameters c = 5.29 m/s and k = 1.95, taken from [
44], notionally assuming wind condition as observed in the Gale crater in a 00:00 to 03:00 LTST nighttime period. The analyses given in [
43,
44] indicate that the northern hemisphere spring season and nighttime provide generally the most favorable wind conditions for balloon launch operations.
Read-out example: the wind speed limit would be 4 m/s if the obstacle-free cone is 75° and the fill ratio at hull release is 0.8. The required minimum success probability shall be higher than 95%. The duration for the hull inflation must be less than 15 min then.
The risk of an unsuccessful deployment is determined by the probability of an unsafe deployment and the severity level of such an event. The worst-case outcome of an unsafe deployment would be not just a failure of the balloon mission itself but the potential catastrophic impairment of the hosting mission by entanglement of the balloon hull with the carrier spacecraft. The corresponding mitigation strategy must be developed in a mission-specific context and could comprise design and operational measures such as detaching and depositing the whole balloon launch system from the main spacecraft for a launch at a safe distance. Alternatively, if staying on the hosting spacecraft, the balloon launch could be scheduled at the final end of the main mission’s timeline.
5. Discussion and Concluding Remarks
The increasing resolution and capability of orbiter-based remote sensing instruments and the emergence of drones seem to make balloon probes obsolete on a first view. Indeed, many scientific use cases proposed for earlier balloon concepts have been taken over by orbiters, rovers and (upcoming) drones today. The largest commonality between helicopter drones and balloons (or generally all Mars aerial platforms) is the general effort to be made to create sufficient lift in the thin Martian atmosphere to carry meaningful payloads. Both profit from recent advances in micro-electronics and sensor miniaturization to reduce weight and the required amount of lift. The largest difference is obviously the way lift is generated which enables completely different flight capabilities of the entire vehicle. Rotors are energetically the most expensive way to lift a vehicle but are key for a degree of controllability and targeted site access unmatched by any other flight system concept. In that regard, balloons mark the other end of the extreme: generating lift from buoyancy is energetically inexpensive and enables sustained flight over long durations but this comes at the price of no controllability at all (concepts for hybrid systems, such as variable altitude aerobots and powered air ships exist and try to combine those different capabilities).
The scientific rationale for this concept stems from the high priority investigations required by MEPAG. Specific investigations relate to the highly variable Mars Boundary Layer (MBL) and the direct interaction between the surface and the lower atmosphere. While orbital experiments to study the Martian lower atmosphere and meteorological analyses aboard landers are well established, there are no in situ measurements (temperature, pressure, humidity, dust opacity, wind properties, etc.) of the state of the near-surface lower atmosphere between 1 to 10 km altitude except for results during the descent of some lander probes. These investigations can be addressed with a balloon probe drifting through the atmospheric boundary layer, filling the gap in temporal and spatial coverage between global orbiter surveyance and local observations by stationary landers or shorter-ranged rover/drones. The wind drifting is part of the sensing principle to resolve the large-scale wind pattern. The choice of a balloon probe for this purpose is therefore driven by the science case and not for technology demonstration in the first hand. Nevertheless, it involves the implementation of technologies not yet demonstrated in the context of Mars exploration, whose demonstration could pave the way for more advanced lighter-than-air vehicles.
A strawman sensor suite suitable for serving the outlined scientific concept of operations is based on state-of-the-art, proven technology.
The conceptual design and the mission simulation show that the proposed balloon probe could roam the Martian boundary layer for at least two days. The northern spring to summer season around Ls = 60° tends to be advantageous over the autumn/winter season in terms of traversed distance and access to the daily convective layer but remain subject to a more detailed analysis based on refined science requirements. Lander and rover missions have acquired large data sets of surface meteorological conditions over the past decades. Derived surface wind statistics allow for a quite clear view on the conditions to be expected on the Martian surface and enable a design for a balloon launch off the surface.
The proposed deployment risk analysis scheme supports a managed and risk-informed design and operational concept development and provides the nucleus for trade-offs between—ultimately to-be-demonstrated—deployment wind speed limits, available obstacle free instrument accommodation options, inflation process design parameters, expected landing site surface wind environment and programmatically required safety levels. The aerodynamic coefficients describing the forces acting on the balloon hull during inflation under wind conditions have been identified as a major uncertain item and have been conservatively estimated for the initial assessment of expected blow-down angles. Deriving those parameters from computational physics by modelling the interactions between the thin-walled, flexible hull and the flow around it will demand great aeroelastic modelling and simulation effort. The Reynolds regime between Re ≈ 104 to 105 can be realized under Earth atmospheric surface pressure conditions with a subscale balloon hull model as used here already for the subscale inflation tests. Its dimensions and the resulting required flow velocities in the order of 1 m/s enable an experimental determination of the governing aerodynamics and its describing parameters with available wind tunnel infrastructure.
The achieved level of definition of this probe concept and lack of specific hosting mission context, however, do not allow a firm statement of achievable deployment safety probability yet. Hence, this concept should not be regarded as a ‘proposal’ in a programmatic sense. However, with all due respect to the remaining uncertainties from the still low maturity, this feasibility study concludes that such a balloon probe mission is in reach of technical possibility.
The reference mission scenario used to calculate trajectory and provide an accommodation example of the instrument on a lander deck assumed a Mars sample return framework. The Jezero site is meanwhile being characterized by Perseverance, and the gathered data, including surface winds, can be used for risk assessment and deployment strategy development.
The MSR sample retrieval mission is a short duration mission, and the balloon could be launched as a secondary mission payload after the departure of the Mars Ascent Vehicle. The Jezero crater and surrounding regions provide the necessary topographic feature-rich environment to fulfill this probe’s scientific objectives. Therefore, it could be worth designing the MSR mission as a hosting platform for a secondary, but nevertheless ambitious, aerial system.
Ultimately, with Jezero crater being a scientifically rich target and both surface and air space being well characterized by rover and aerial platforms, it is not unreasonable to imagine that this site could also become a candidate for the first human mission target.


 ,
, 


