Investigating the Time-Varying Nature of Medication Adherence Predictors: An Experimental Approach Using Andersen’s Behavioral Model of Health Services Use
Abstract
1. Introduction
2. Methods
2.1. Group-Based Trajectory Models (GBTMs) of Medication Adherence
2.2. Predictors of Medication Adherence Trajectories
2.3. Time-Stable Predictors
2.4. Time-Varying Predictors
3. Results
3.1. Time-Fixed Predictors of Medication Adherence Trajectories
3.2. Time-Varying Predictors of Medication Adherence Trajectories
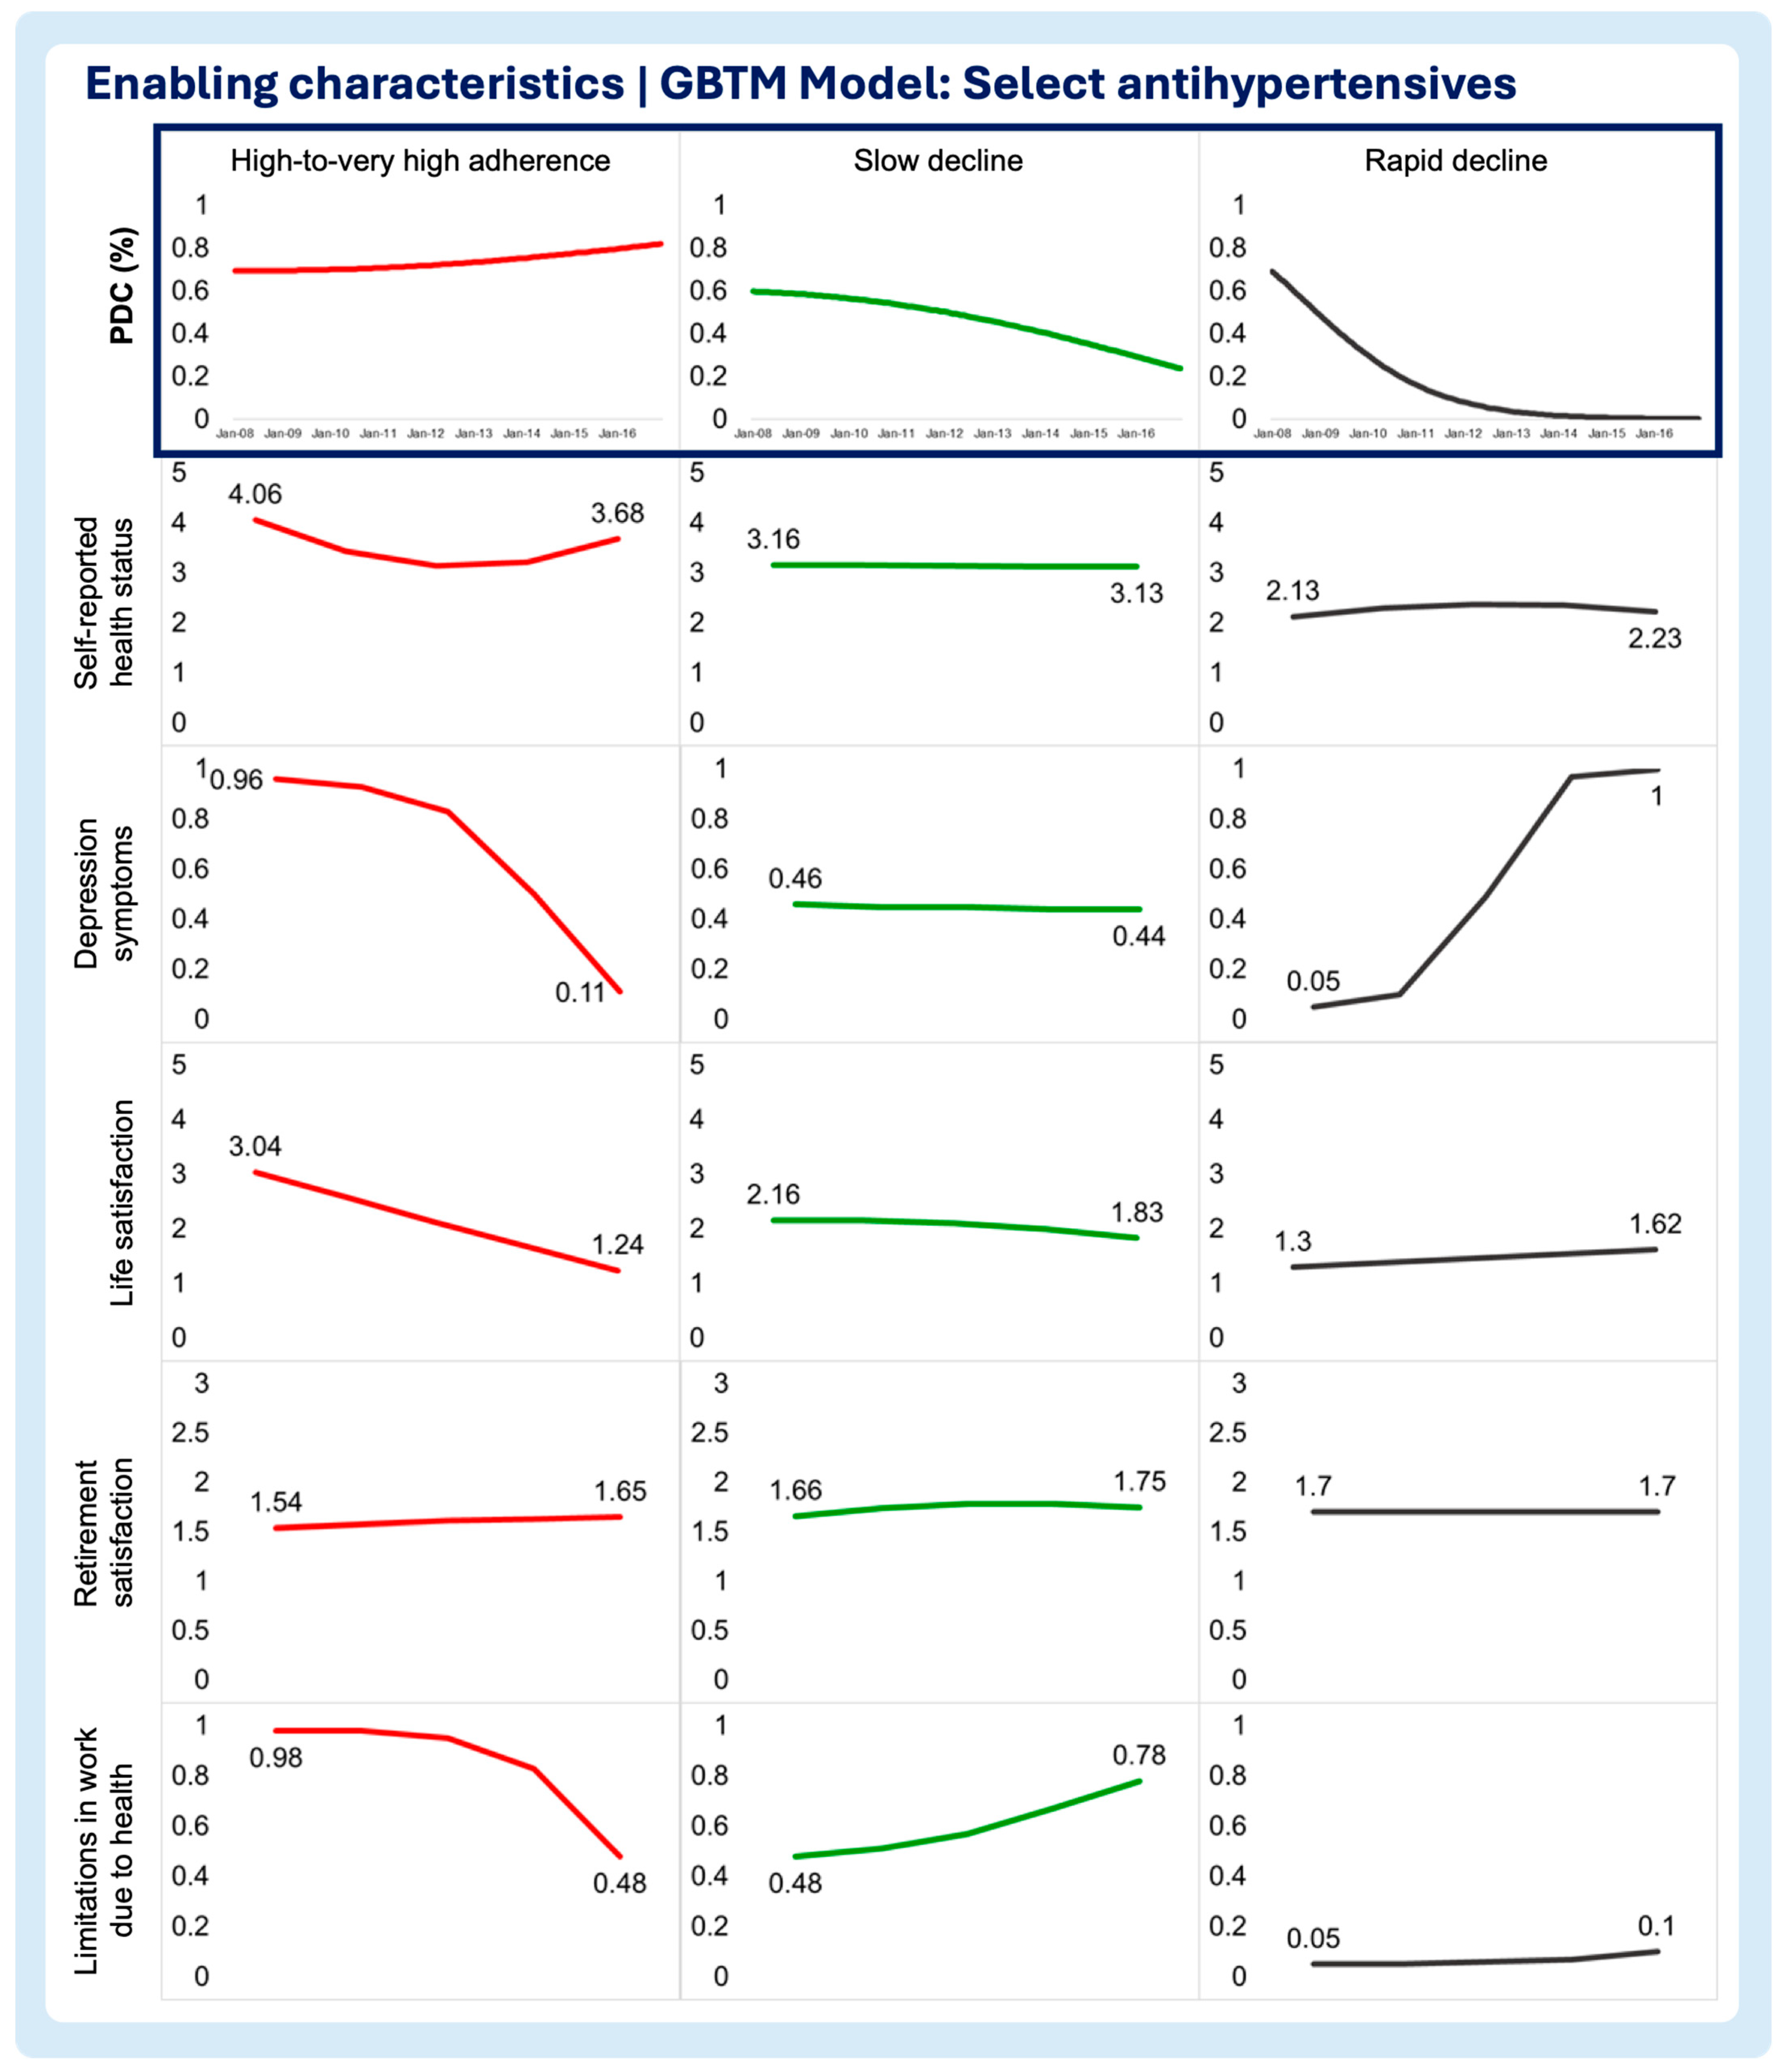
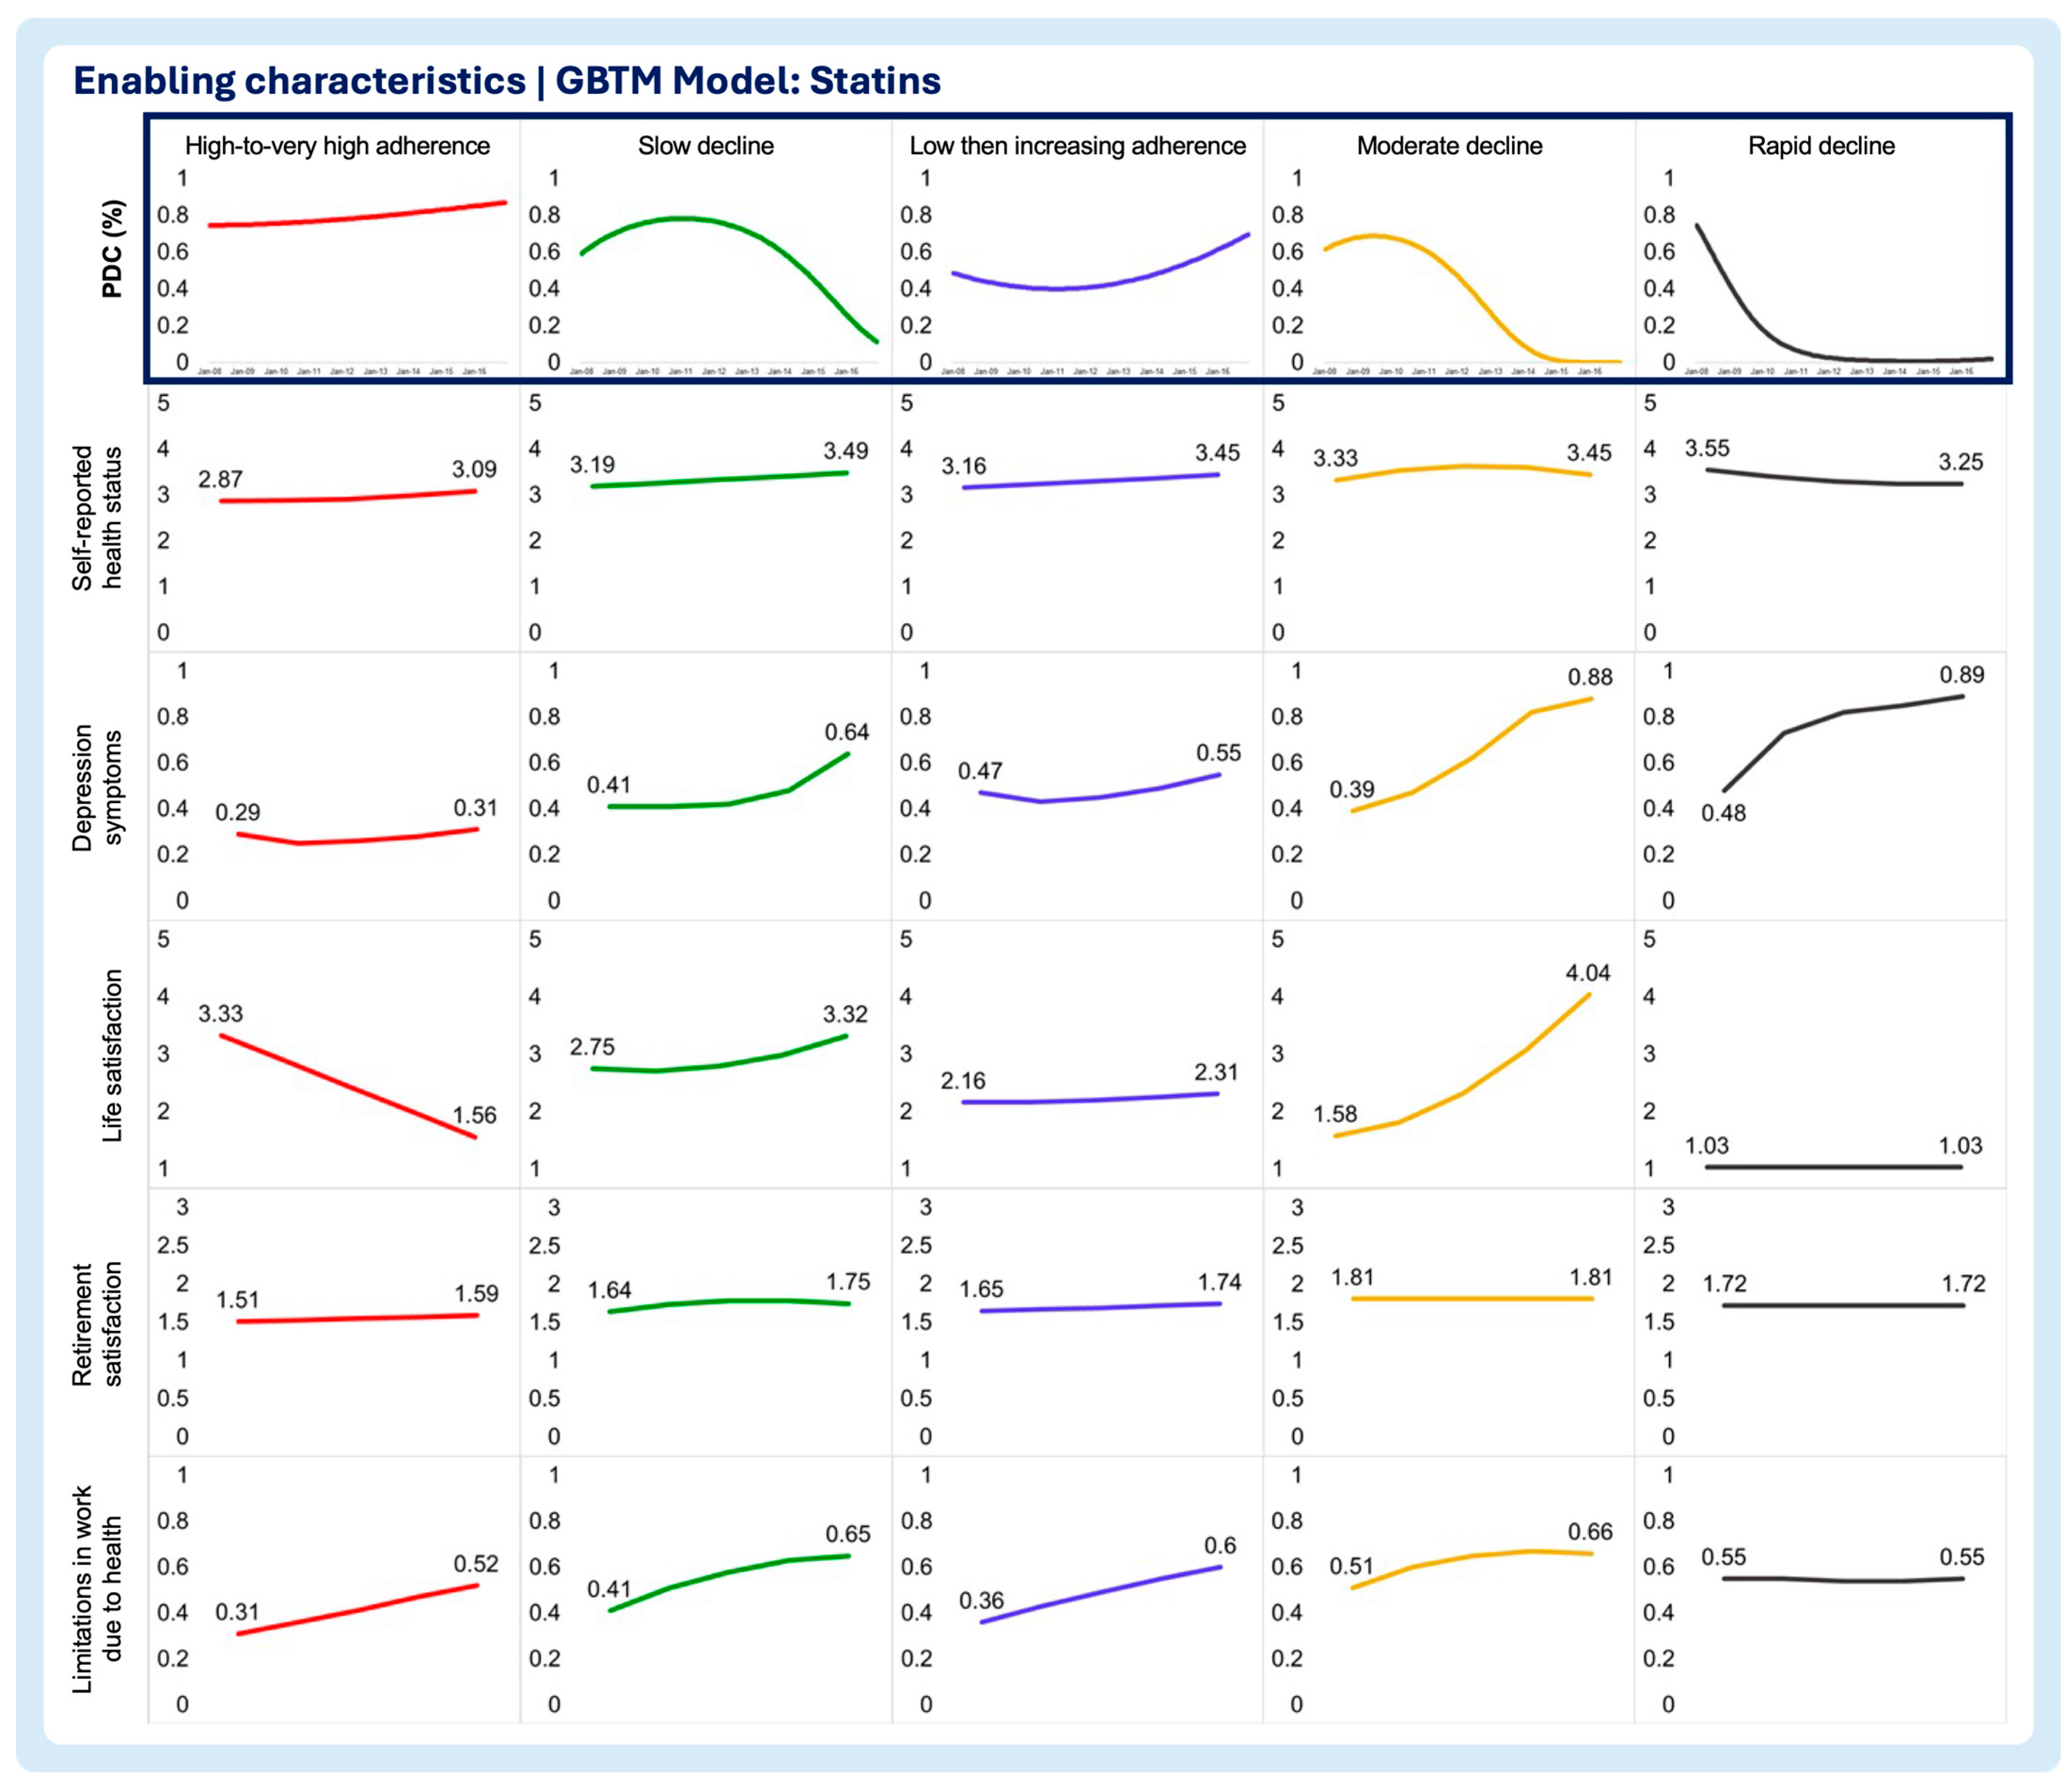
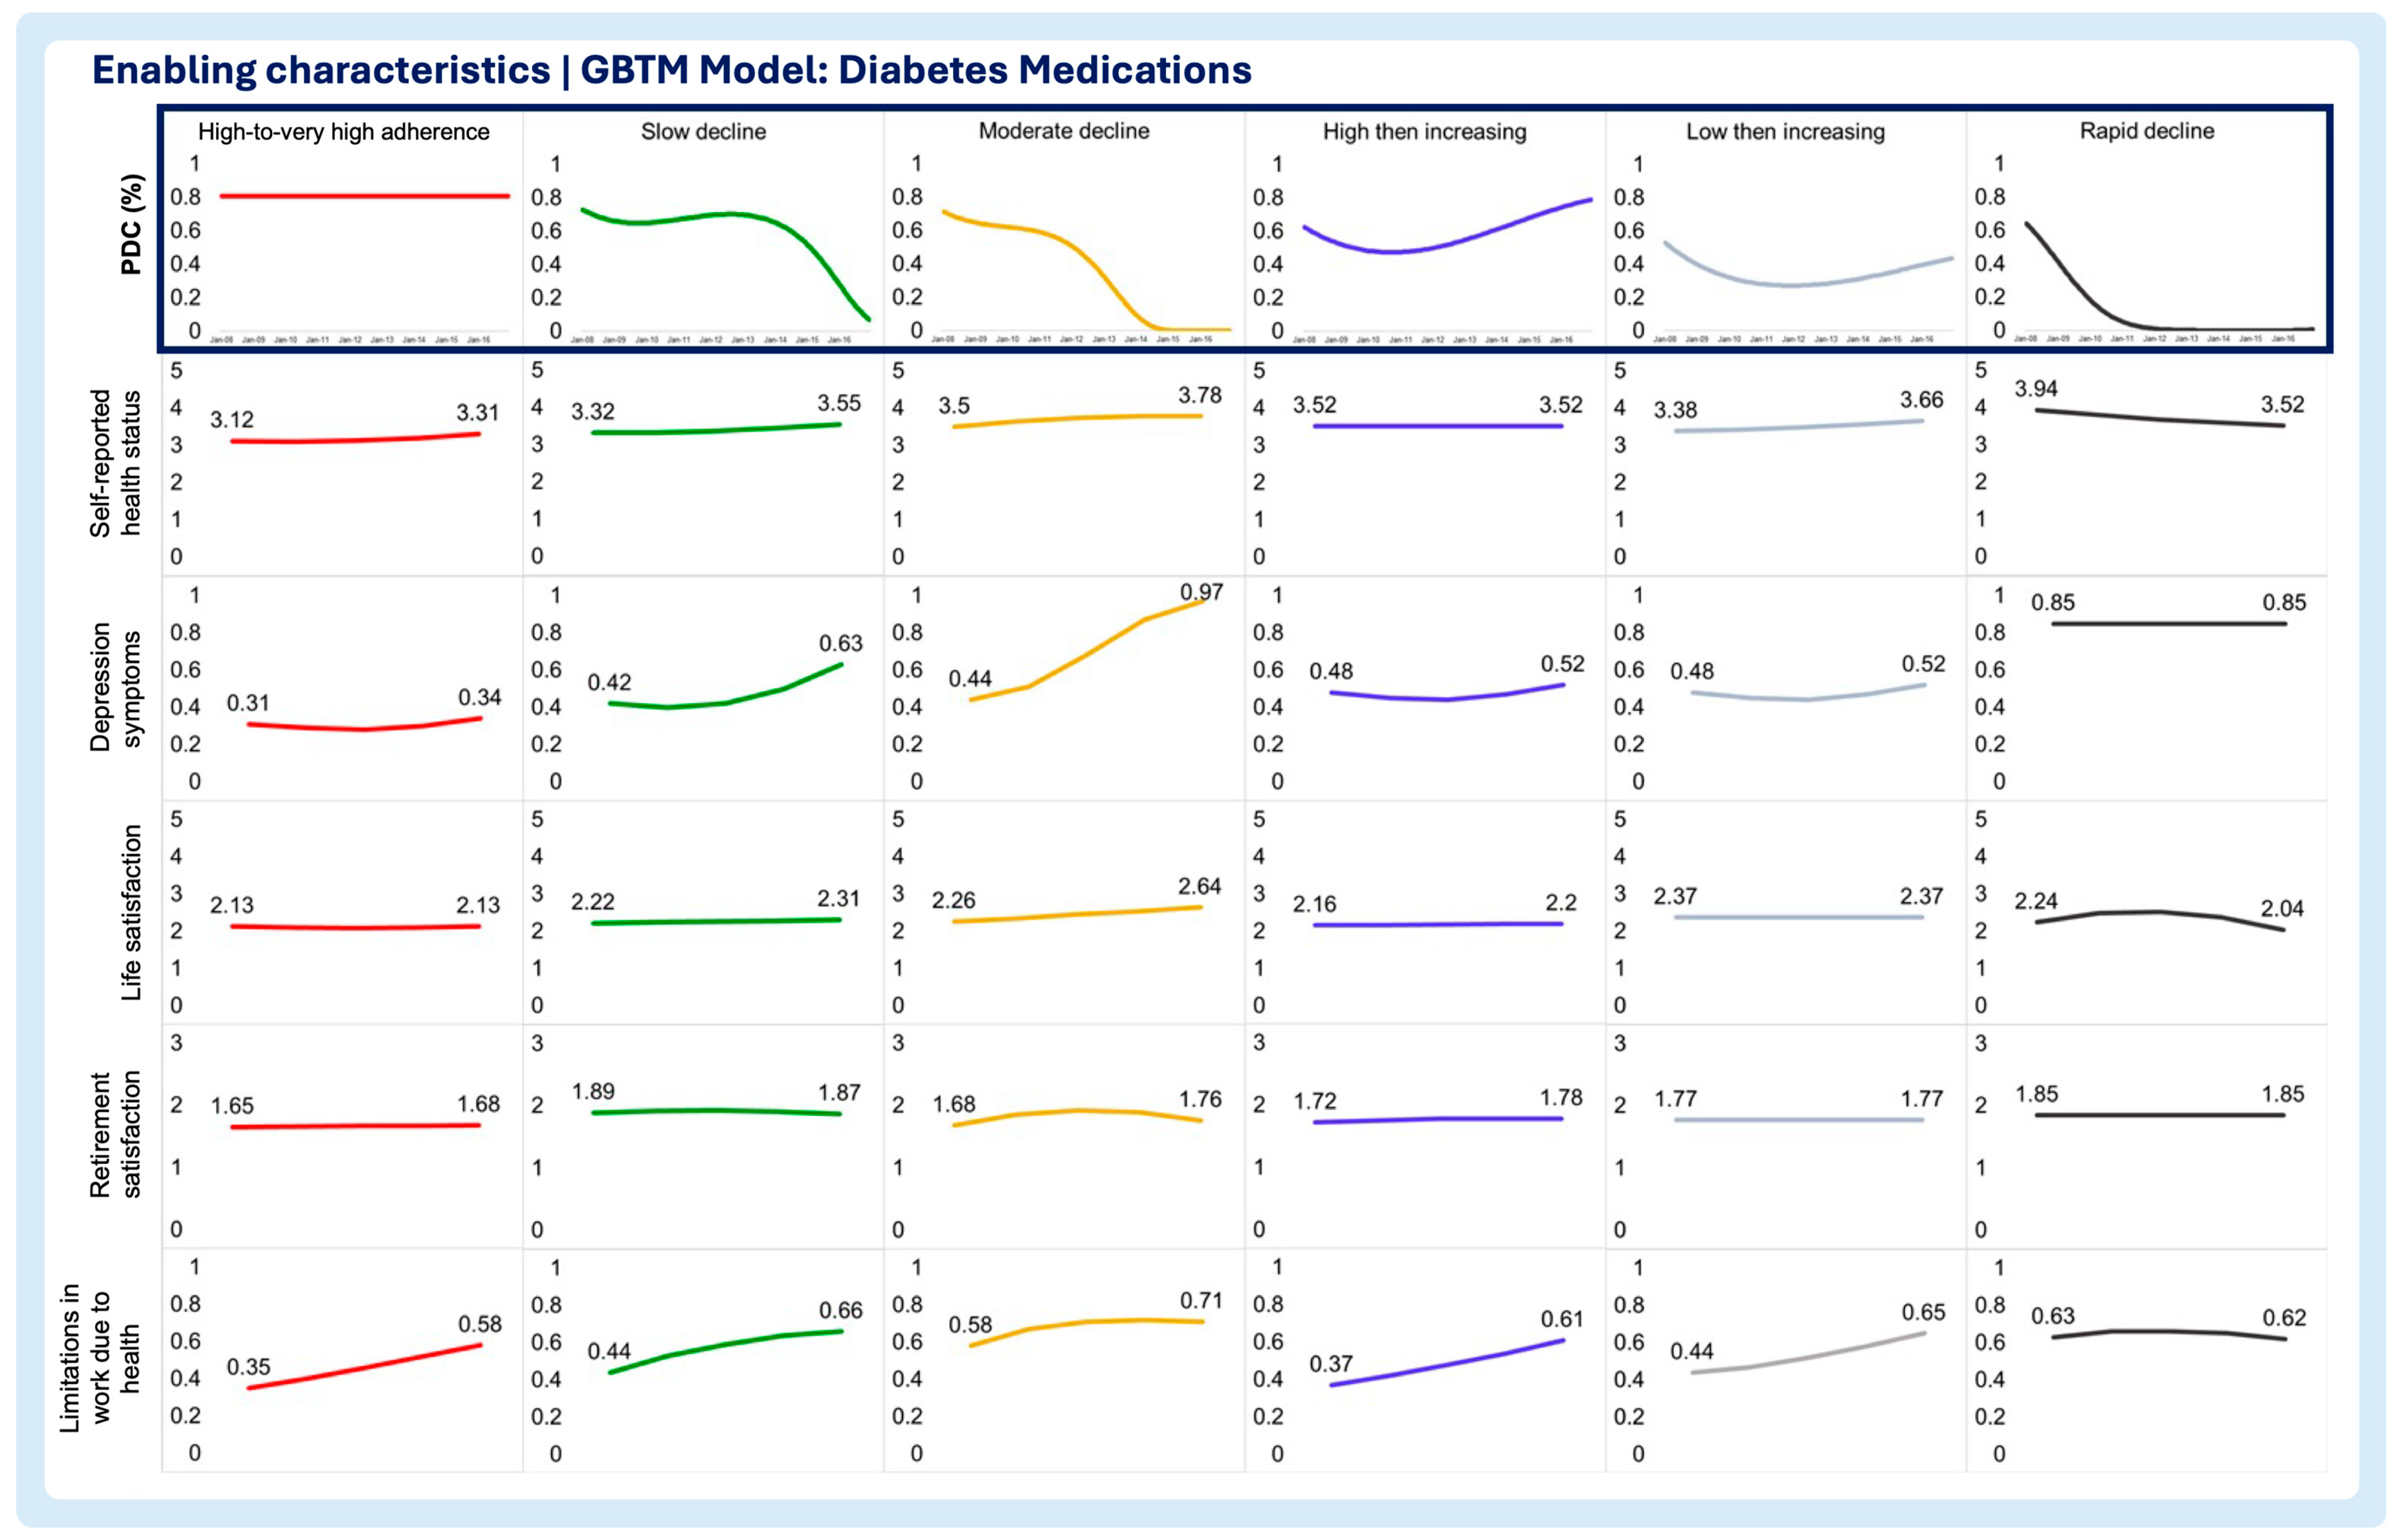
- Enabling characteristics
- Self-reported health status
- Depression symptoms
- Life satisfaction
- Retirement satisfaction
- Limitations in work due to health
- 2.
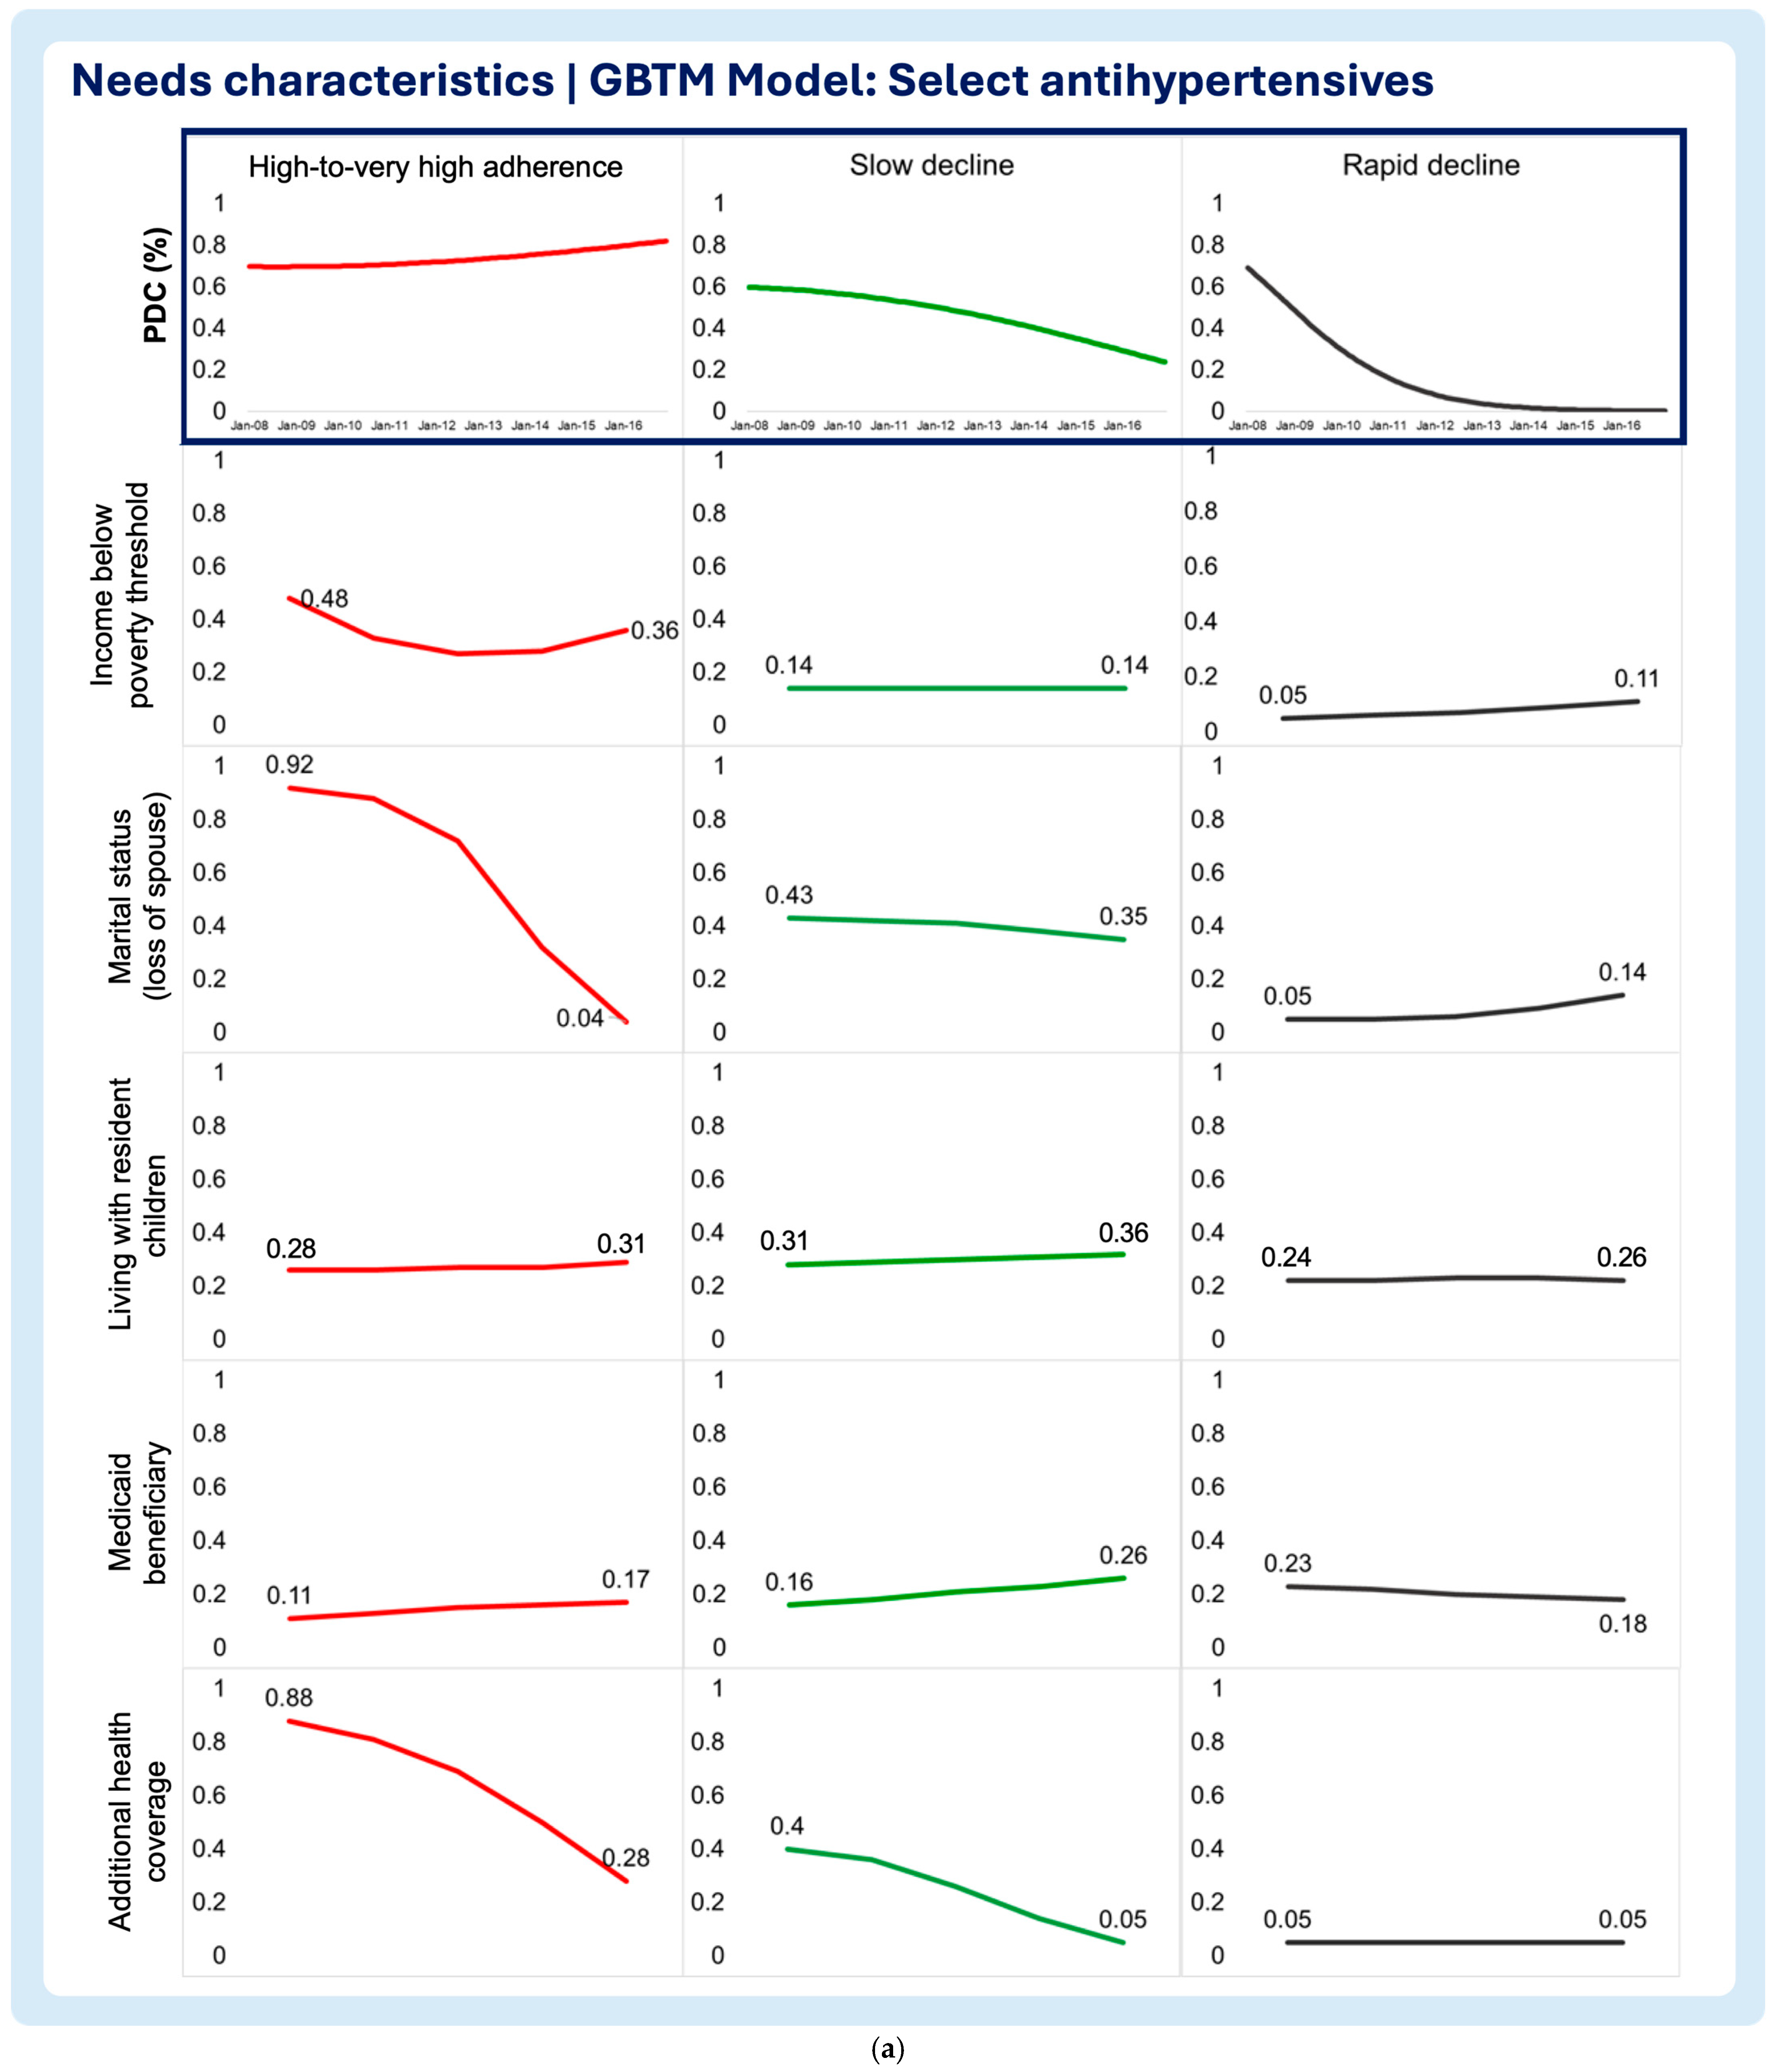
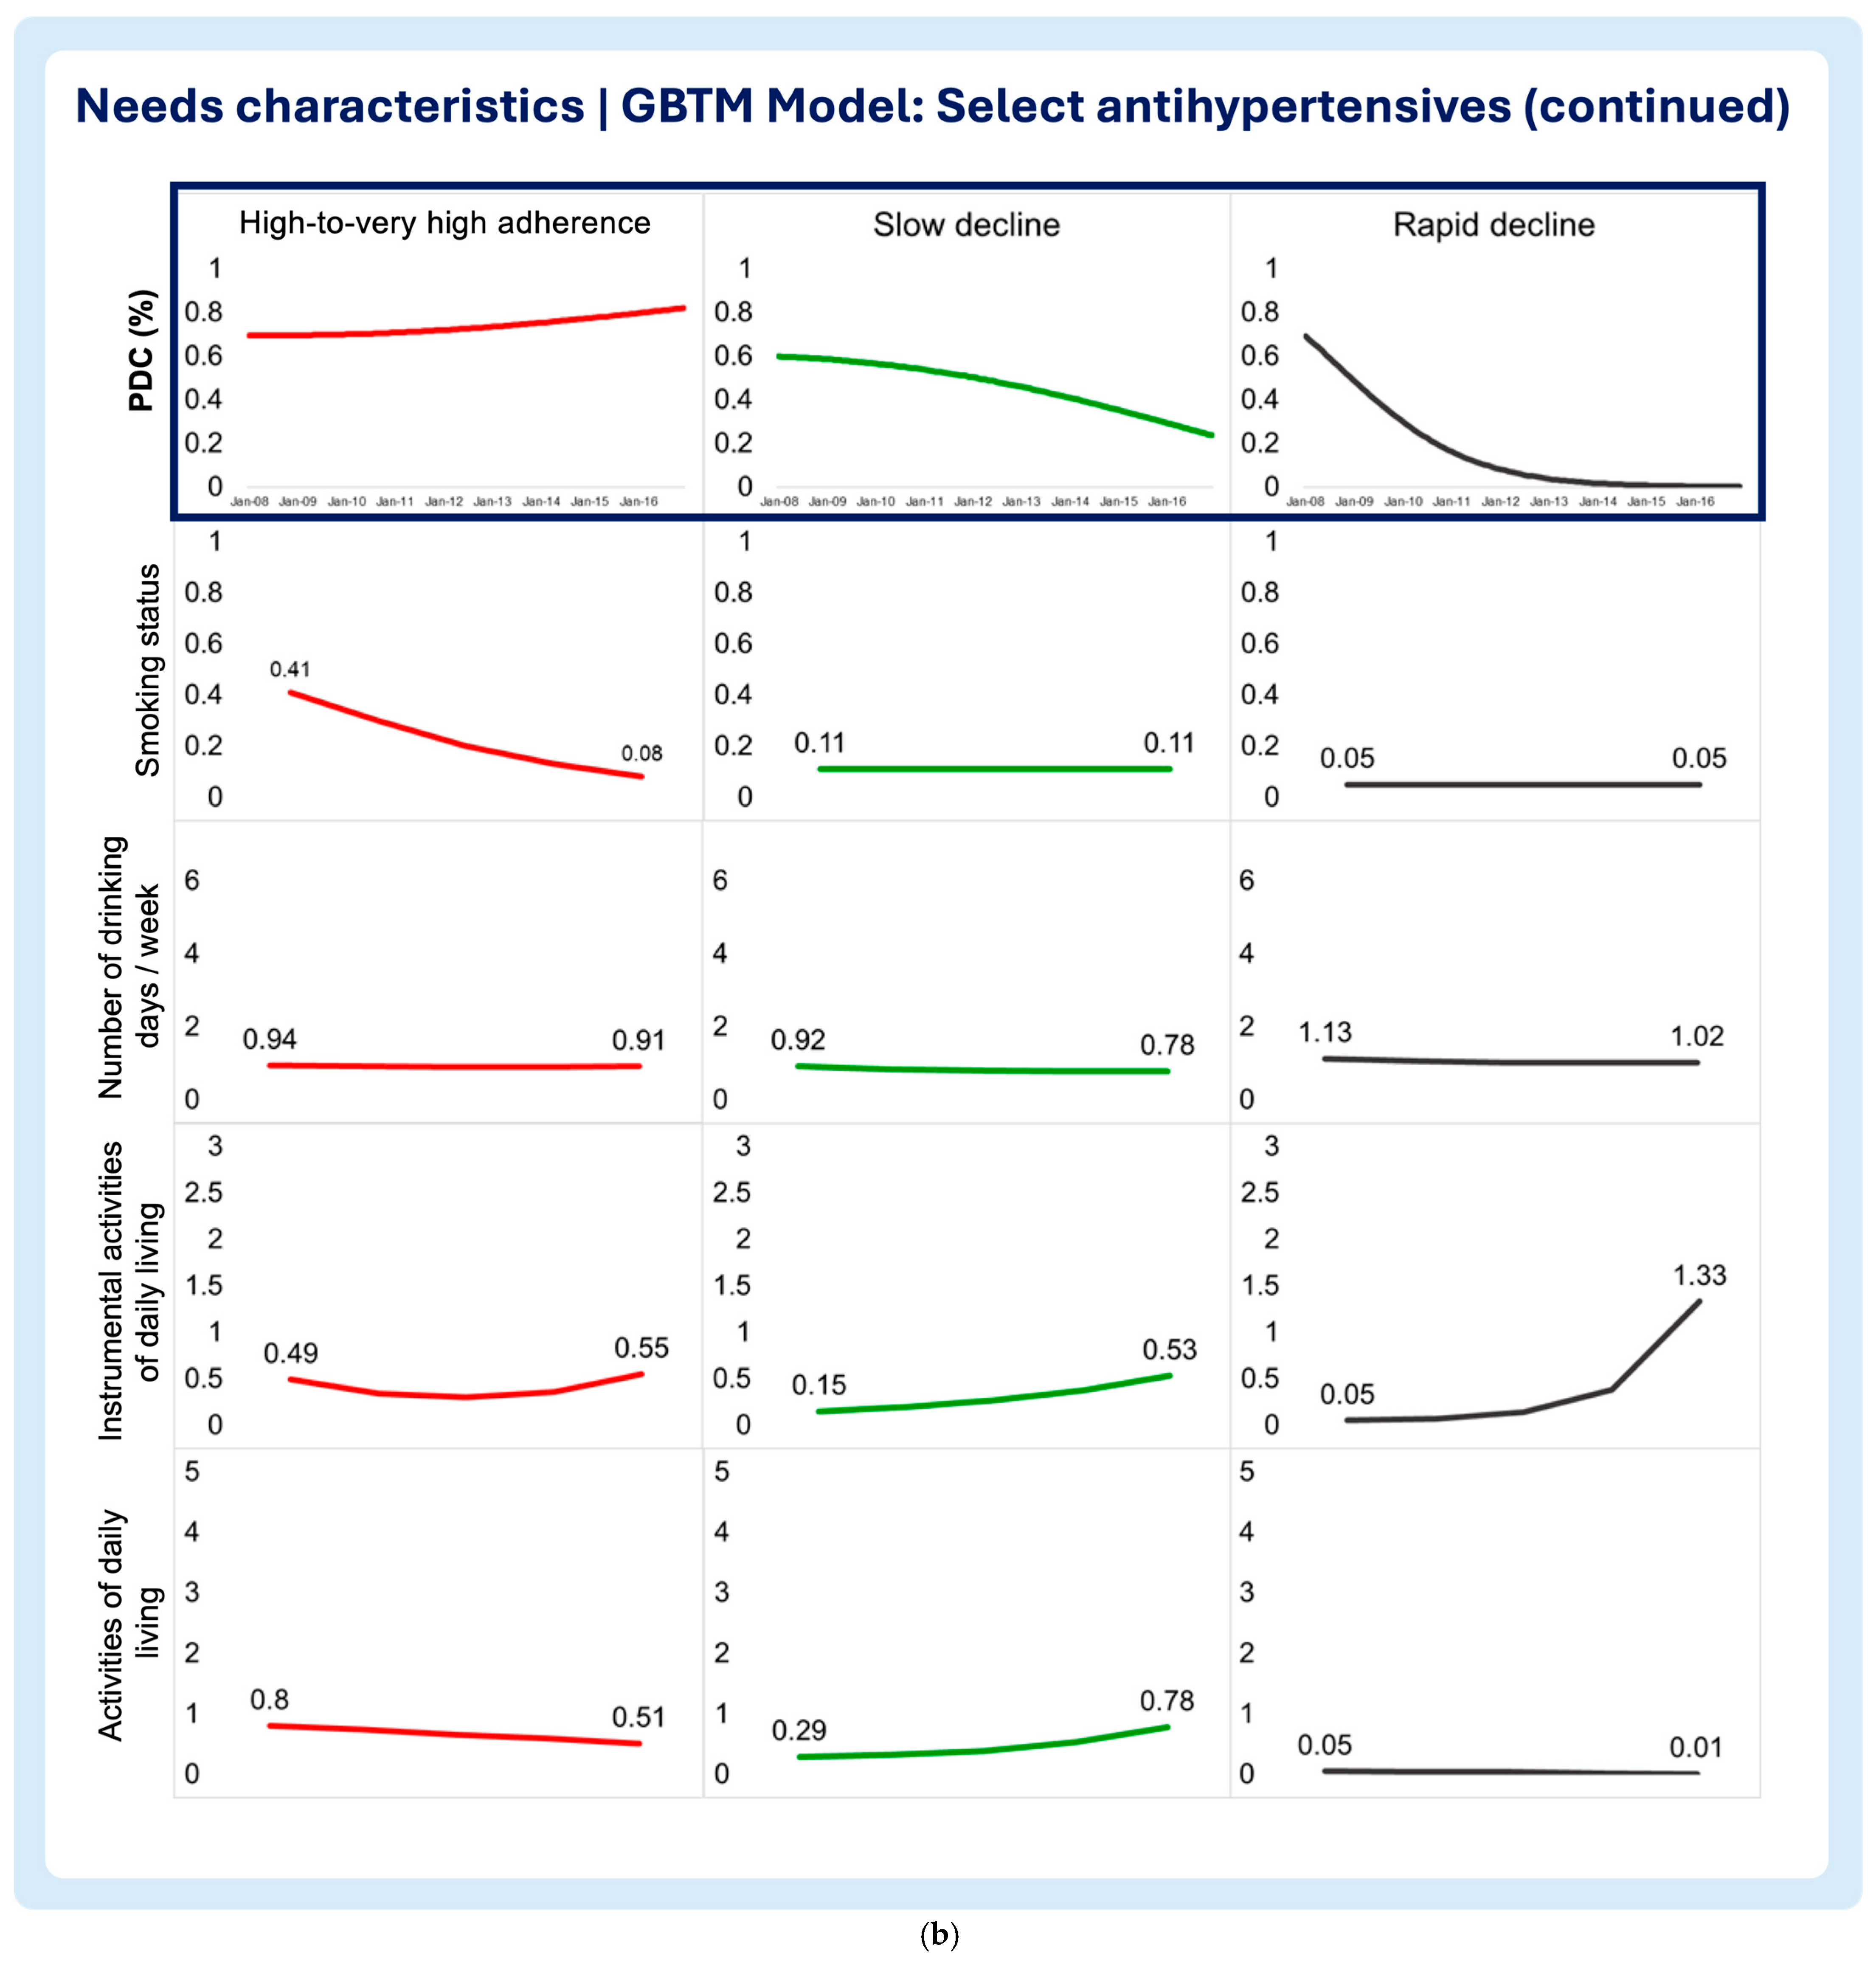
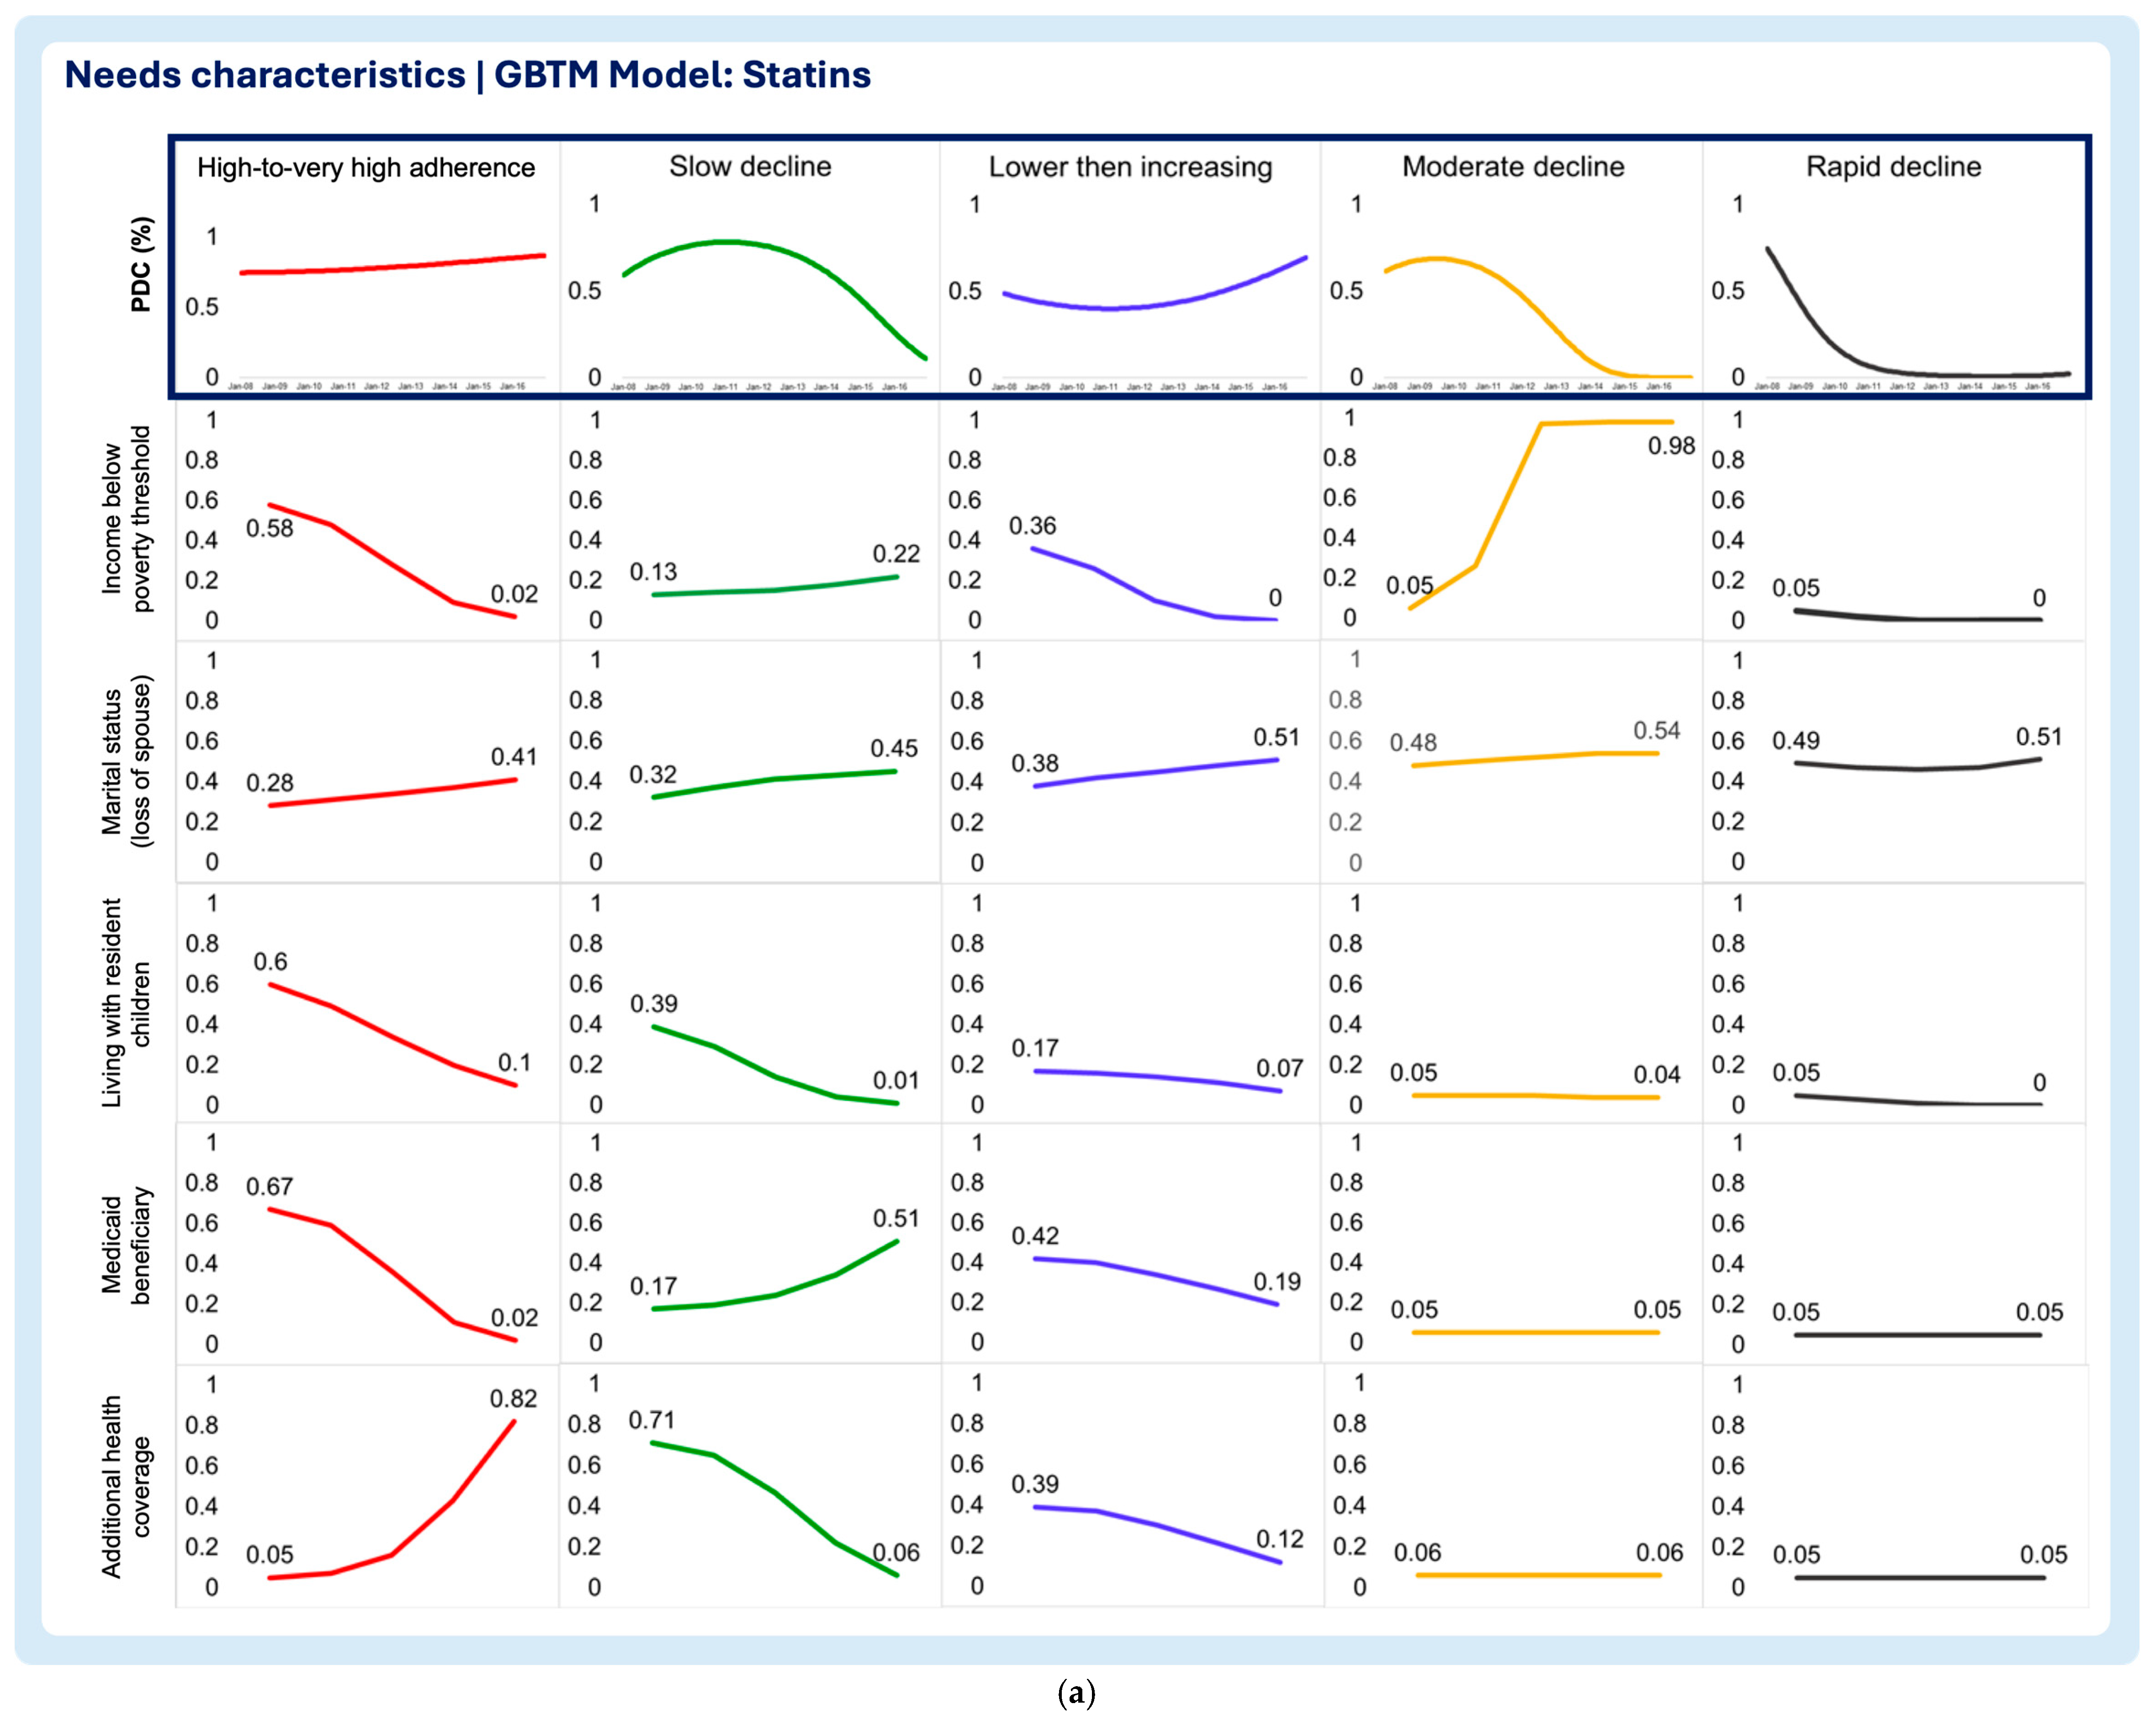
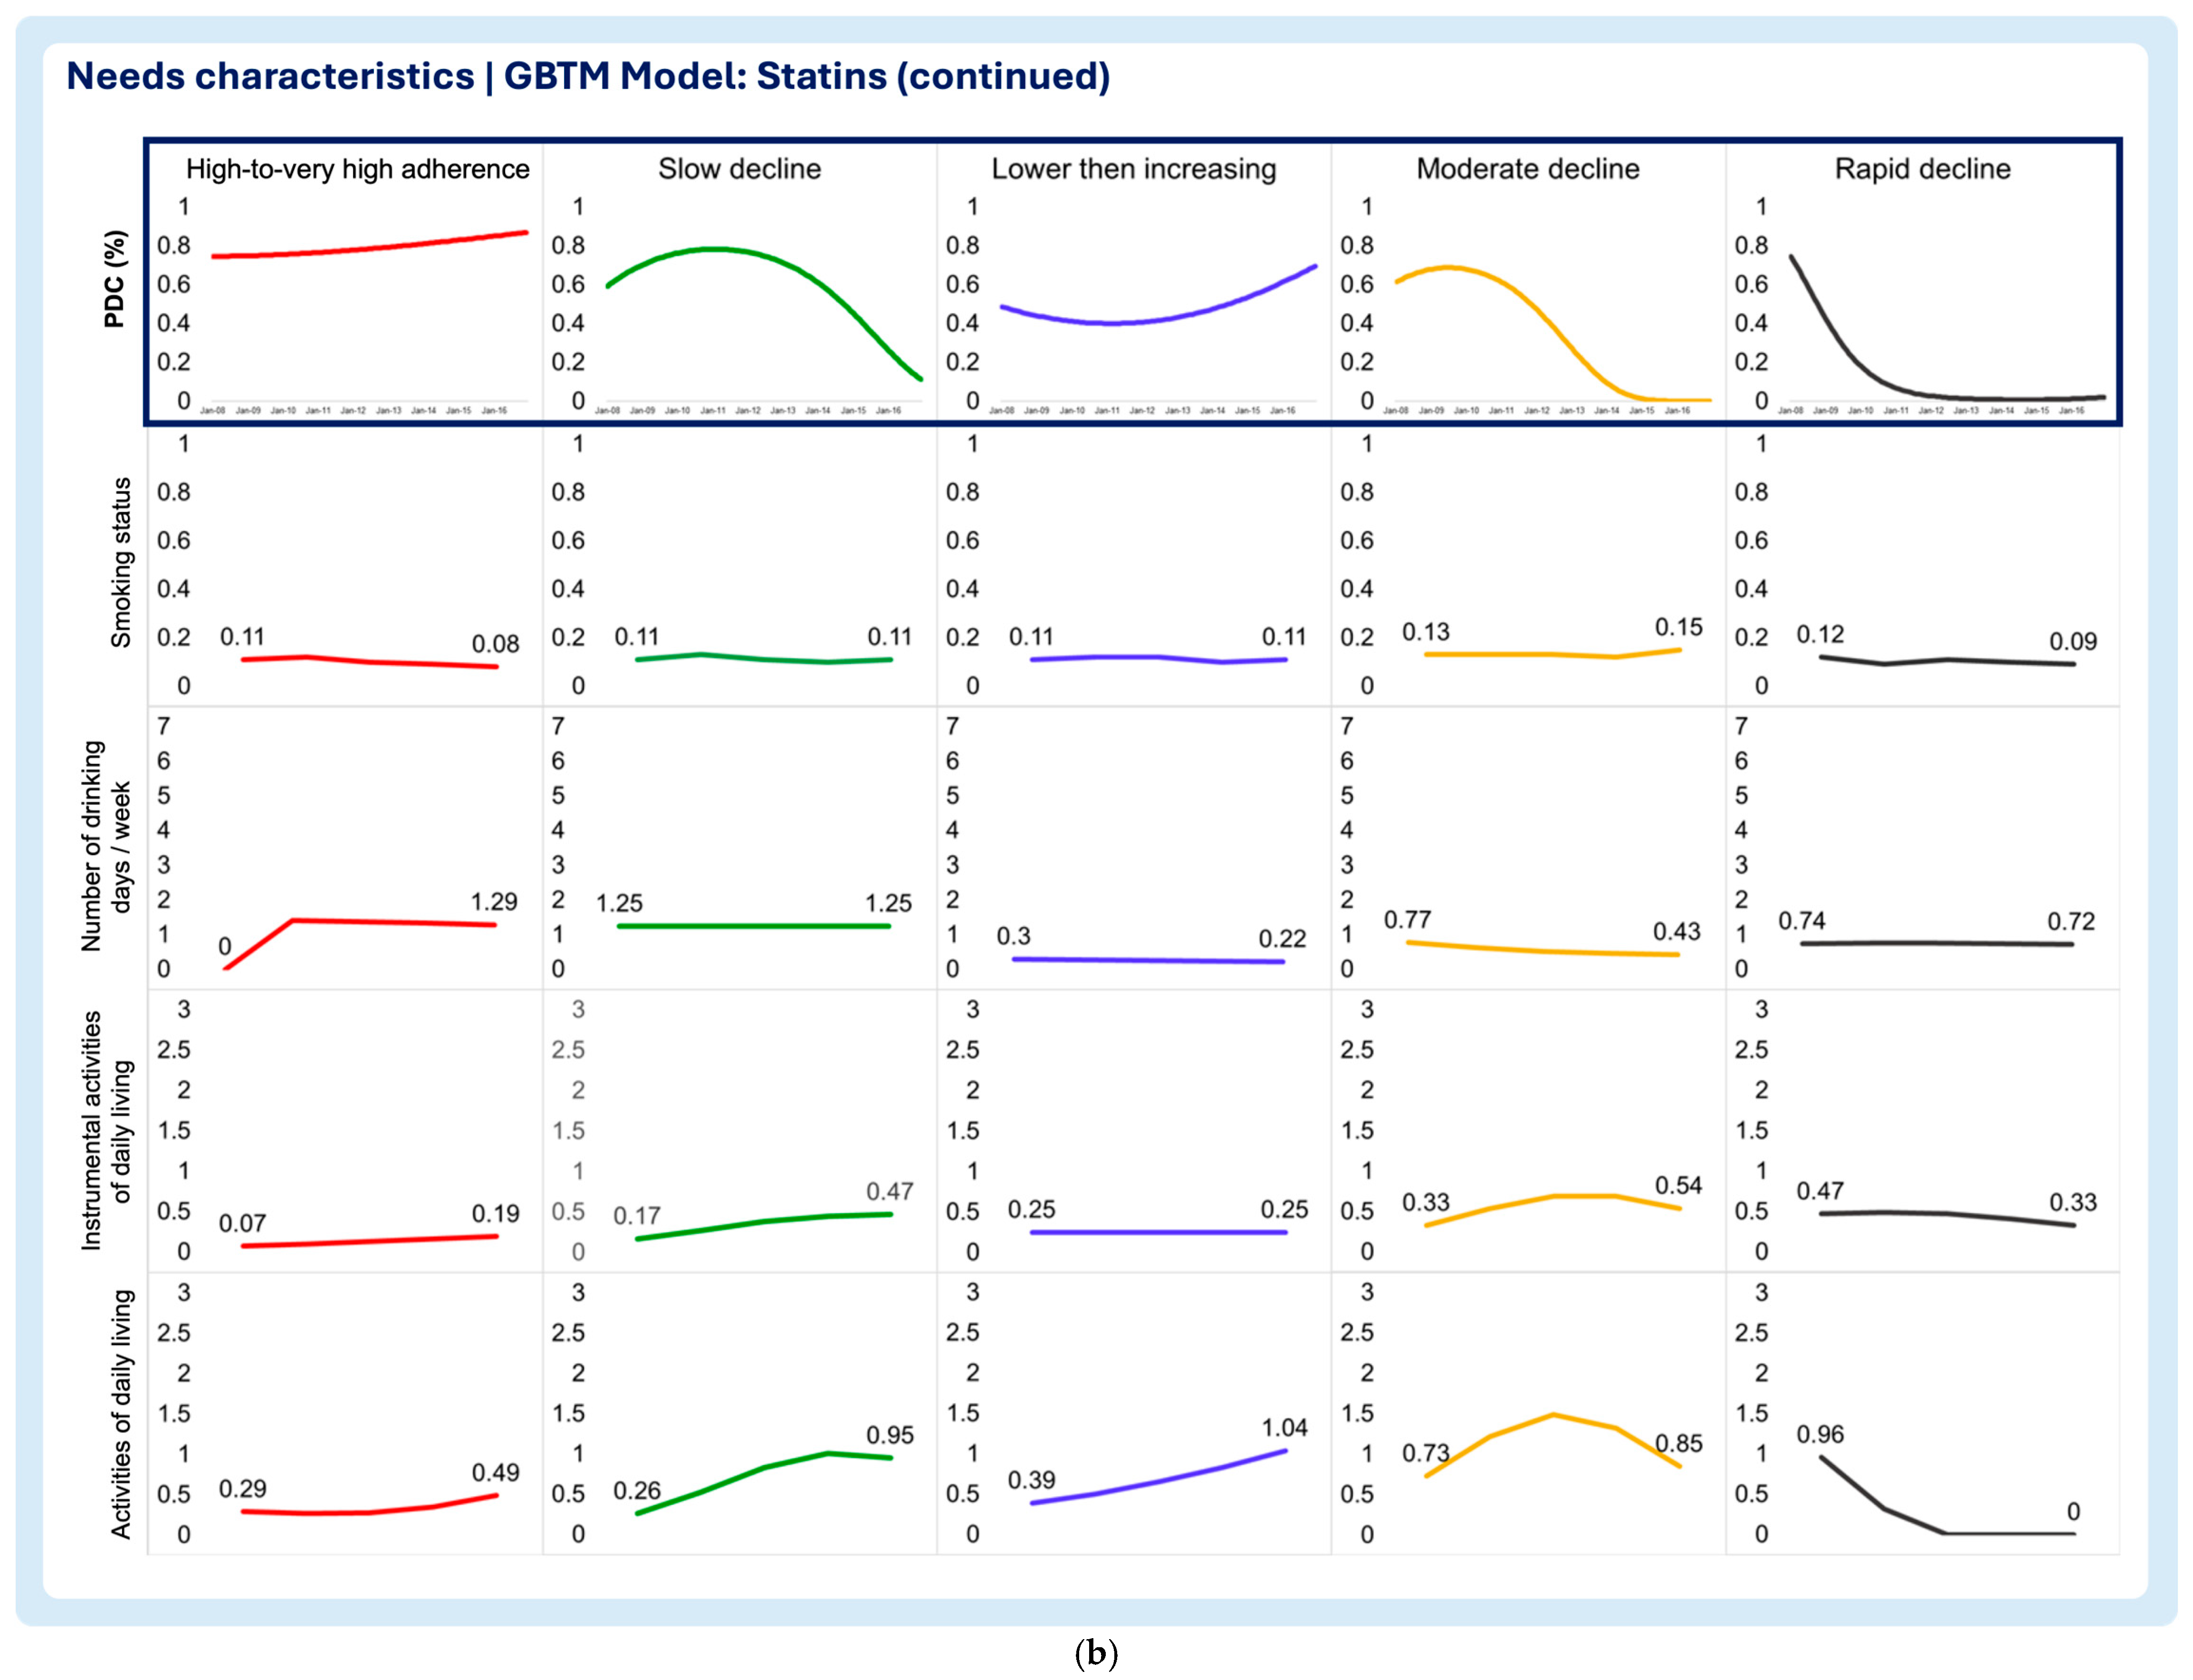
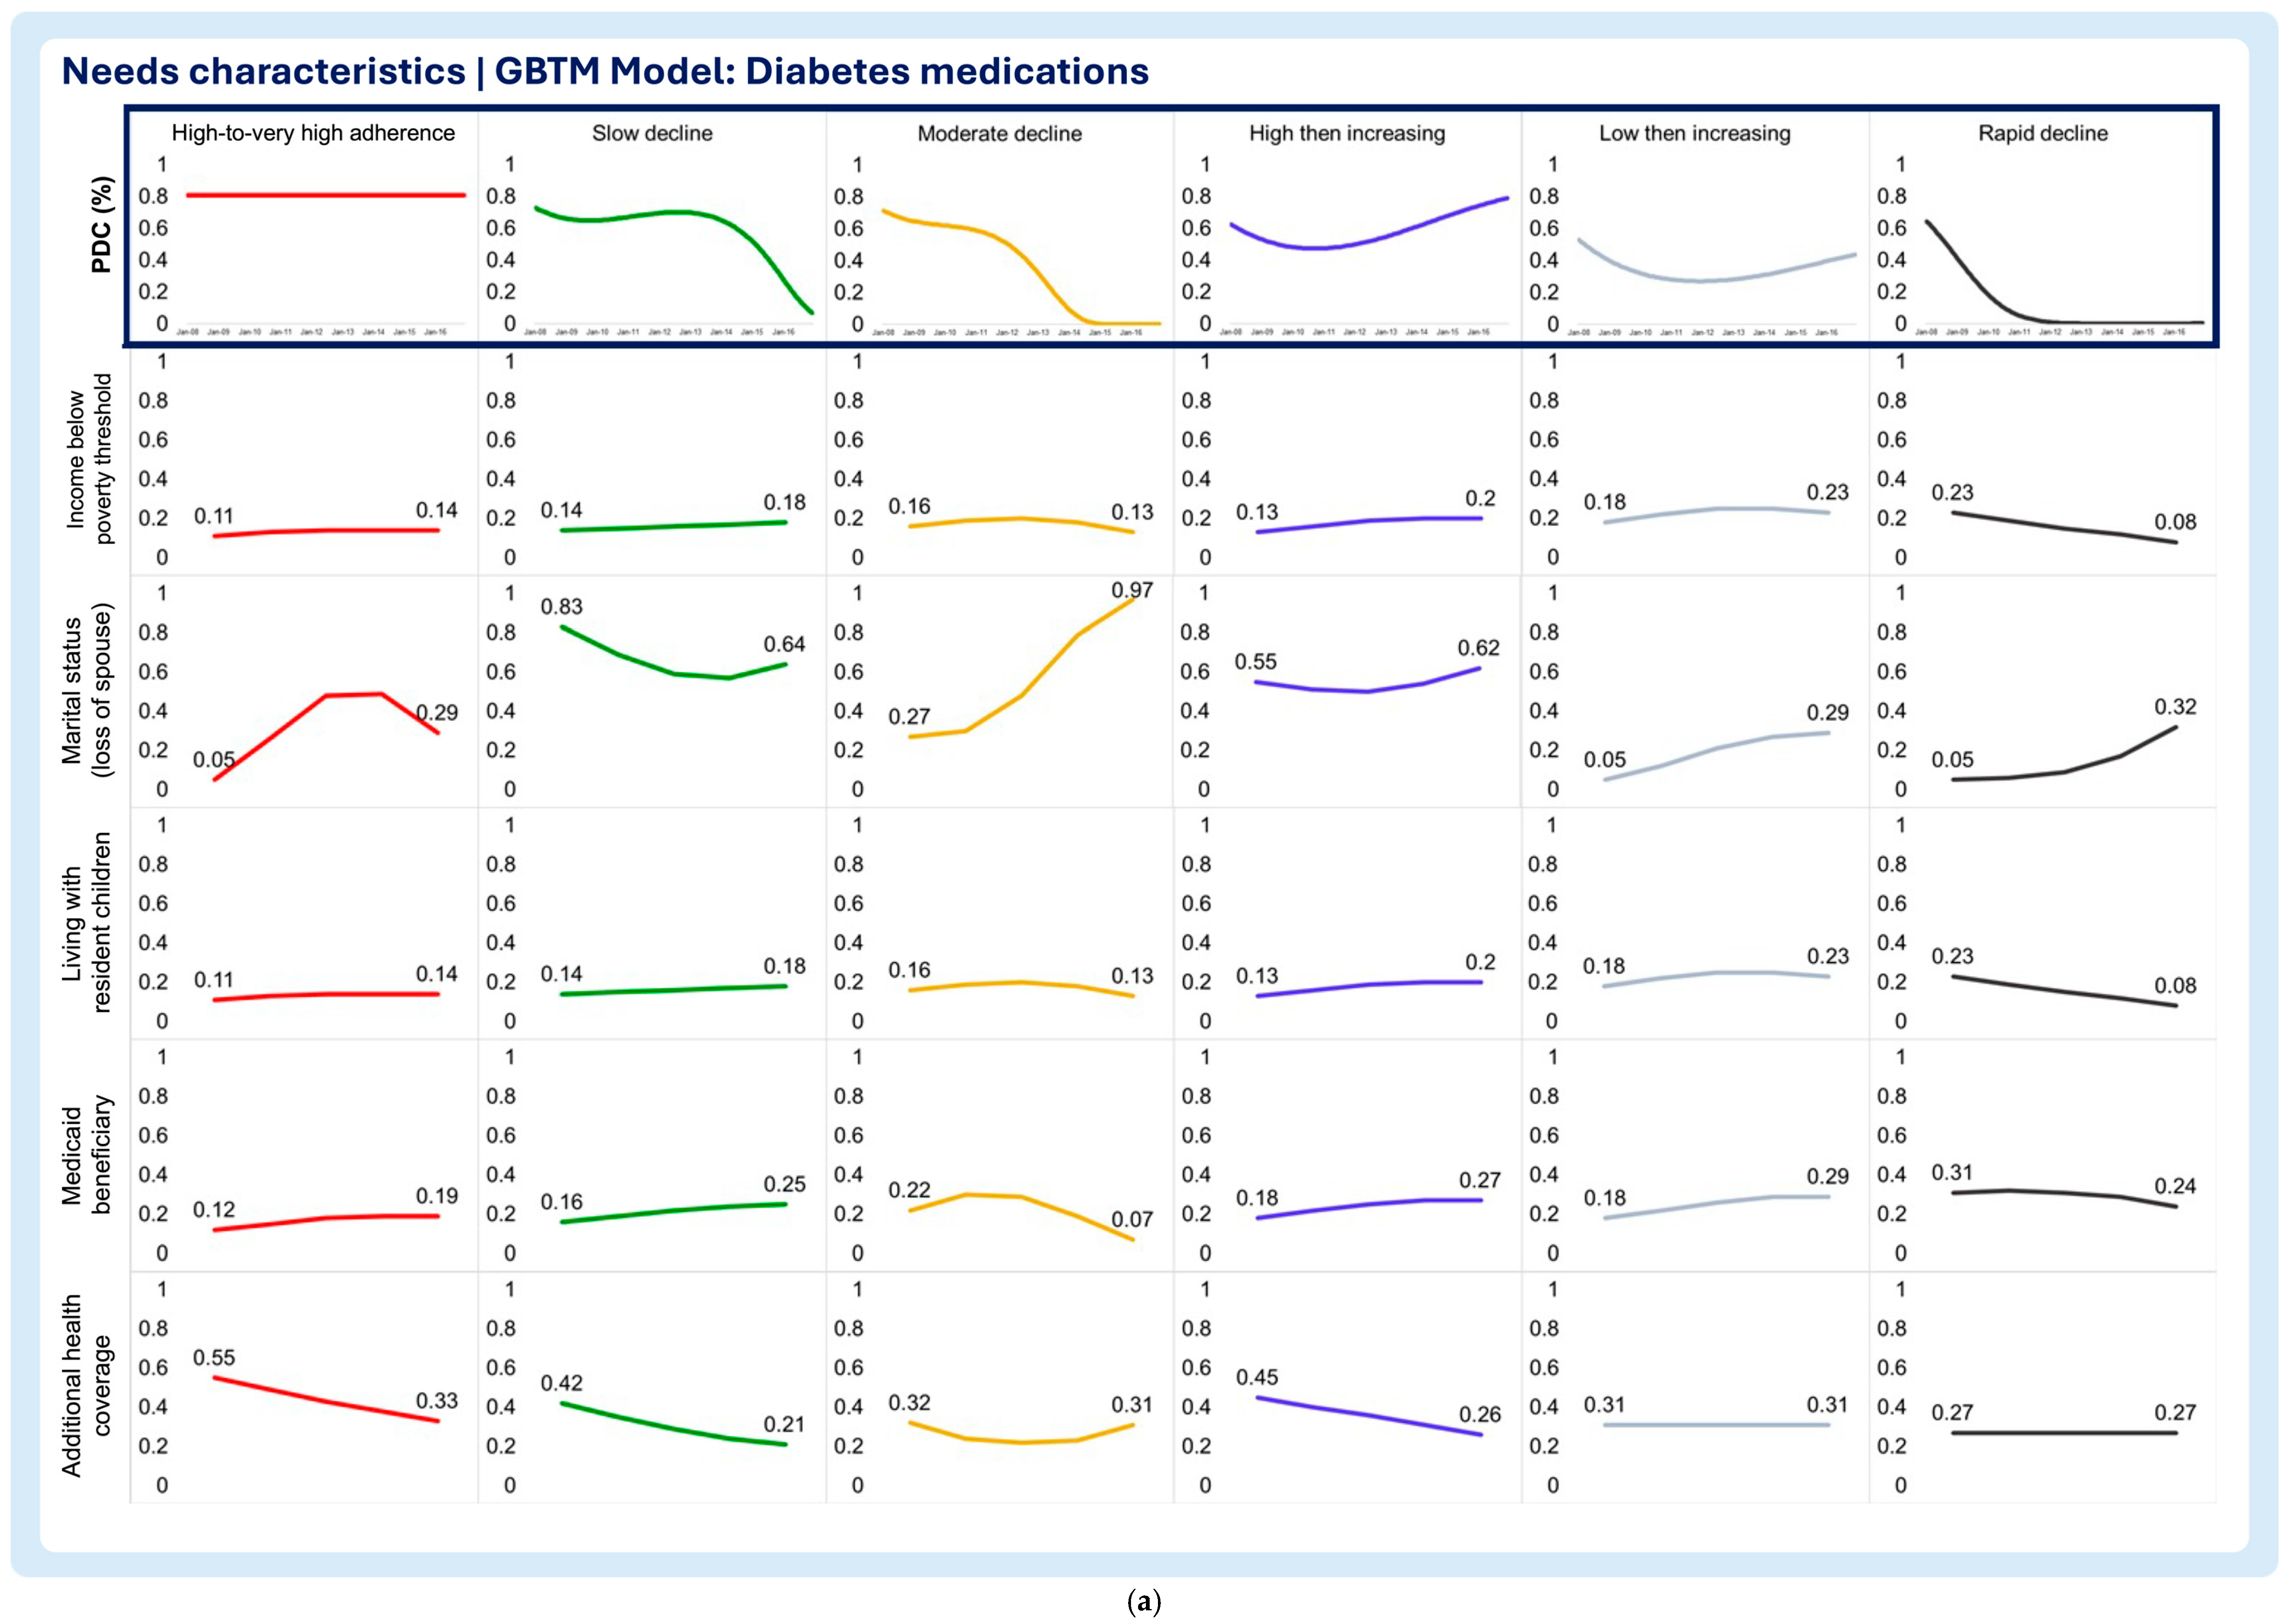
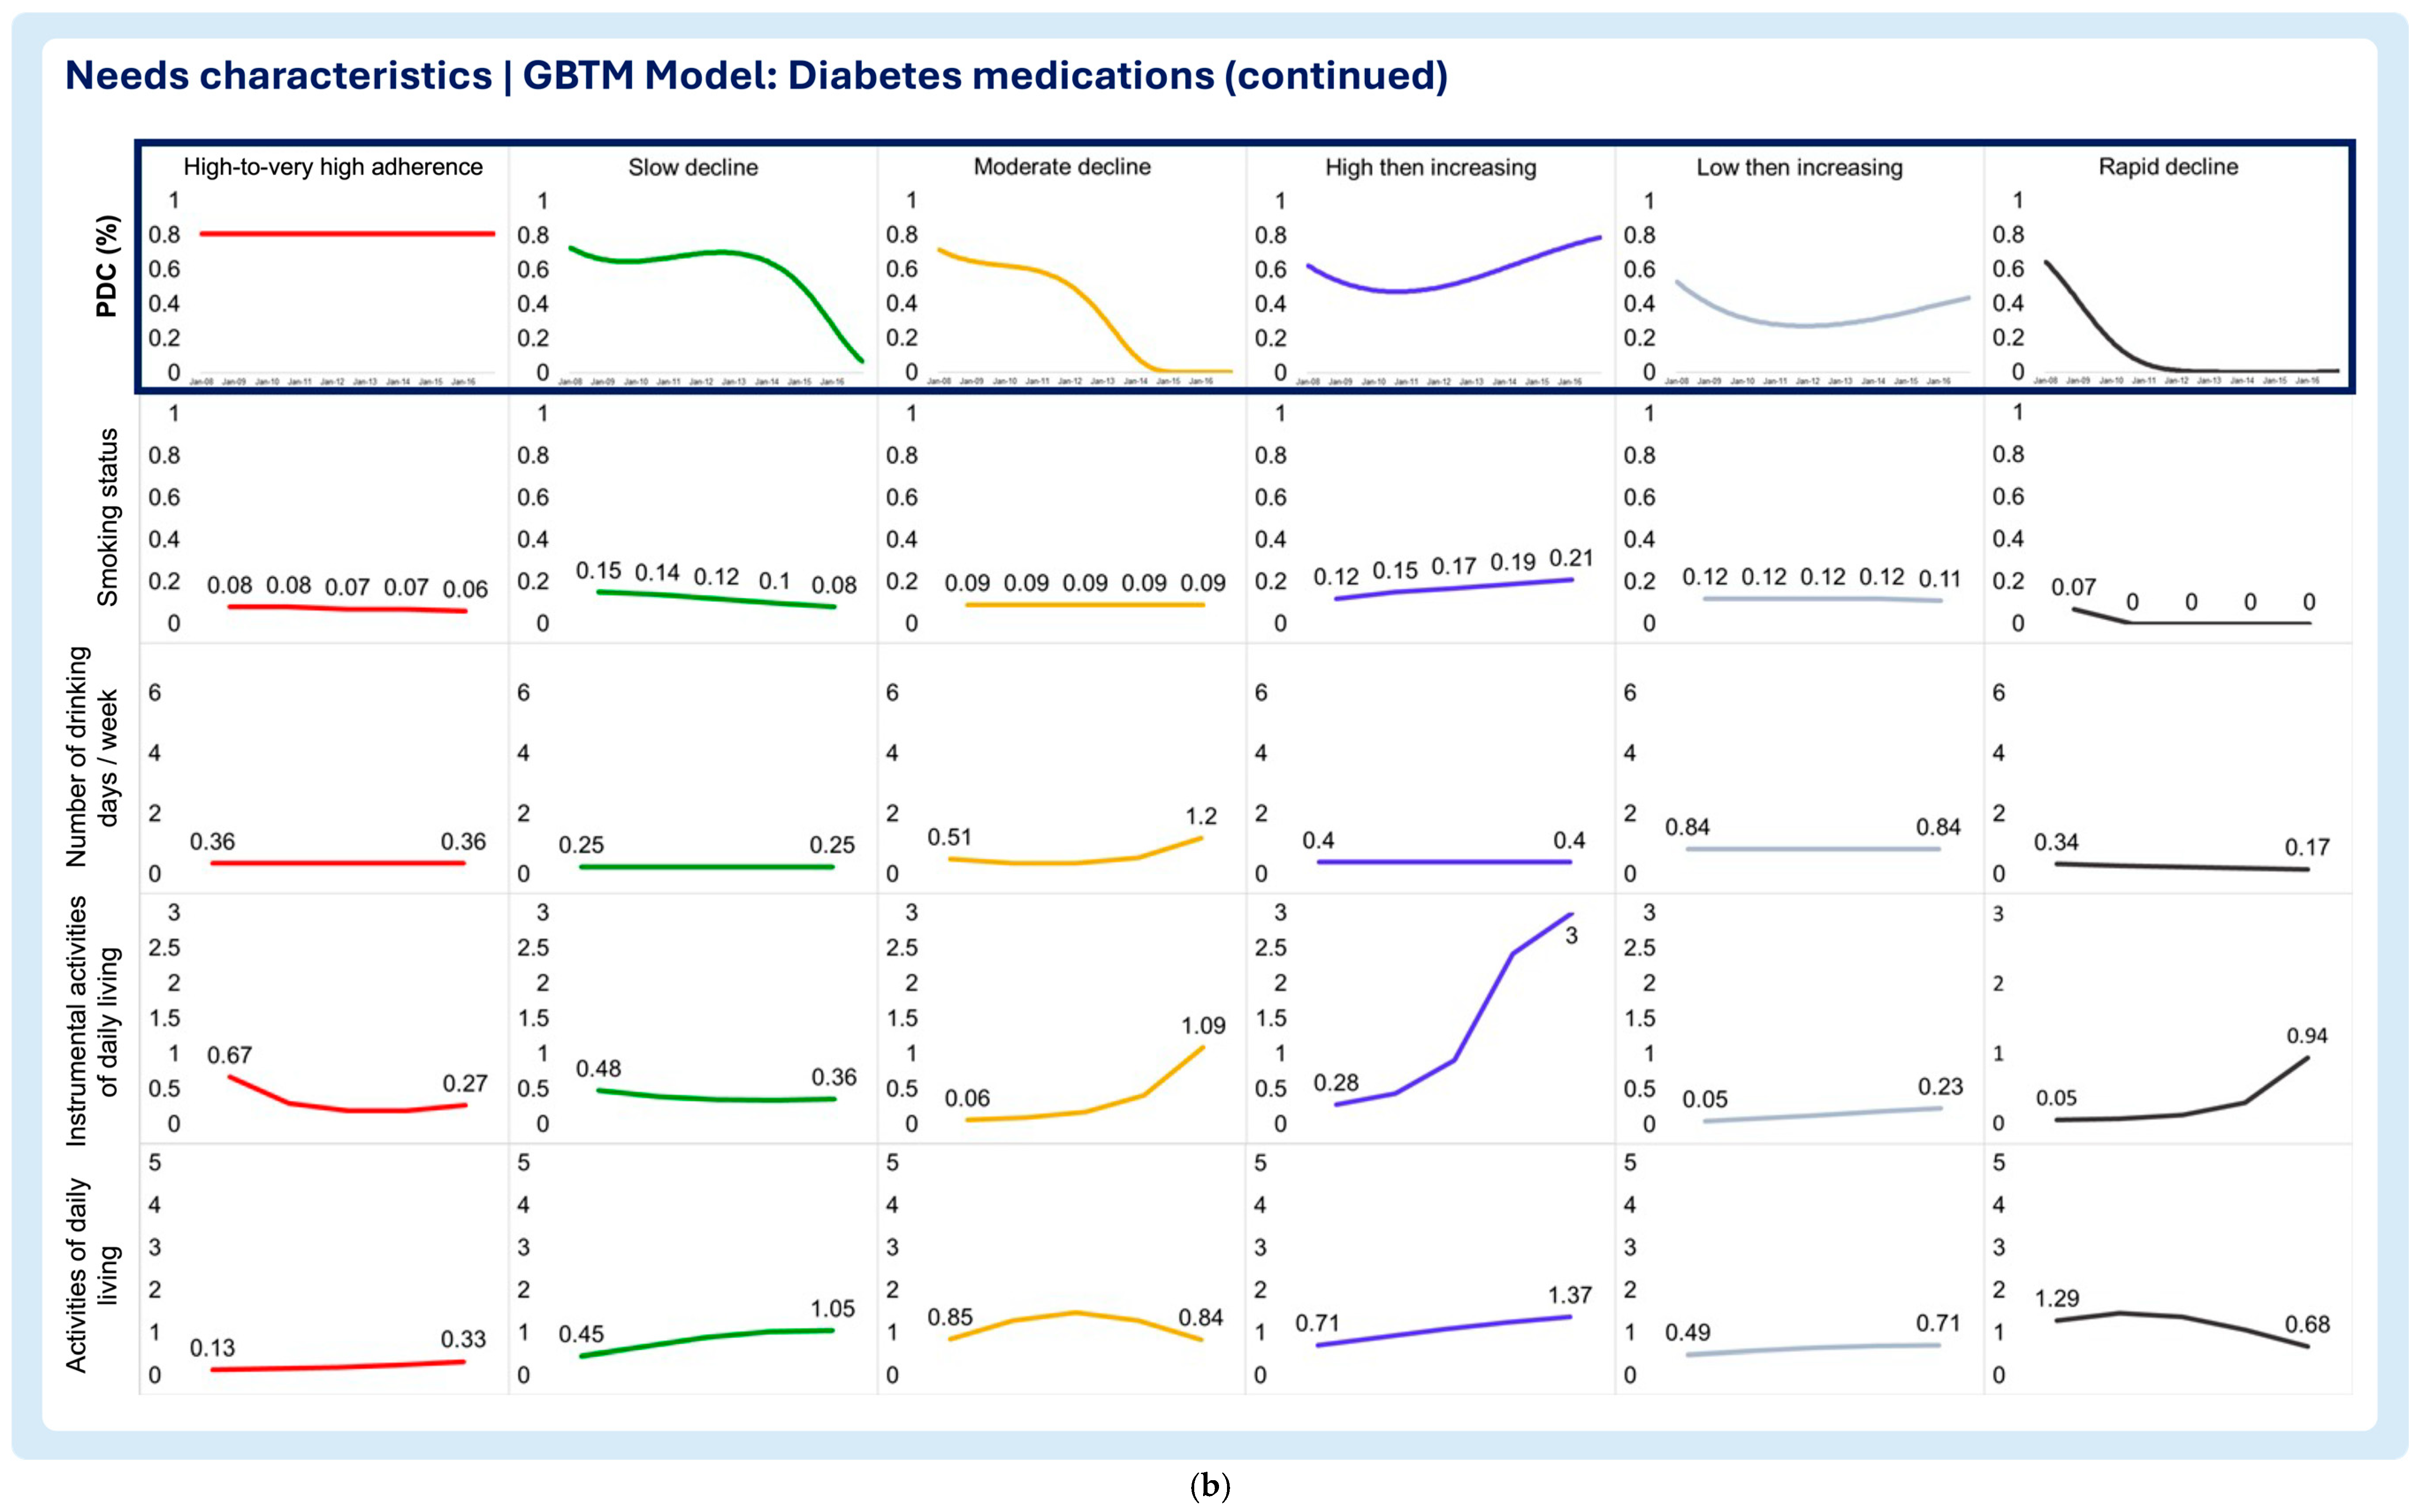
- Need characteristics
- Household income below poverty threshold
- Marital status (loss of spouse)
- Living with resident children
- Medicaid beneficiary
- Additional health coverage
- Smoking status
- Number of drinking days/week
- Instrumental activities of daily living (IADLs)
- Activities of daily living (ADLs)
4. Discussion
Limitations
5. Conclusions
Author Contributions
Funding
Institutional Review Board Statement
Informed Consent Statement
Data Availability Statement
Conflicts of Interest
Abbreviations
| GBTM | Group-based trajectory modeling |
| PDC | Proportion of days covered |
| HRS | Health and Retirement Study |
| VIF | Variance inflation factor |
| ADLs | Activities of Daily Living |
| IADLs | Instrumental Activities of Daily Living |
Appendix A
| Characteristic | Covariates | Measurement Approach |
|---|---|---|
| Enabling characteristics | Self-reported health status | 5-point scale: 1—Excellent 2—Very good 3—Good 4—Fair 5—Poor |
| Depression symptoms | CES-D 8-Item Scale. Per Steffick and colleagues, a score > 3 is indicative of clinical depression [24] 0—No depression symptoms (CES-D score ≤ 3) 1—With depression symptoms (CES-D score > 3) | |
| Life satisfaction | 5-point scale: 1—Completely satisfied 2—Very satisfied 3—Somewhat satisfied 4—Not very satisfied 5—Not at all satisfied | |
| Retirement satisfaction | 3-point scale: 1—Very satisfying 2—Moderately satisfying 3—Not at all satisfying | |
| Limitations in work due to health | Yes (1)/No (0) | |
| Need characteristics | Poverty threshold | Below (1)/Above (0) |
| Family structure | ||
| Yes (1)/No (0) | |
| Yes (1)/No (0) | |
| Medicaid beneficiary | Yes (1)/No (0) | |
| Additional health coverage | Yes (1)/No (0) | |
| Substance abuse | ||
| Yes (1)/No (0) | |
| Number of drinking days/week | |
Assistance with activities
| Number of activities requiring assistance/cannot perform |
Appendix B
| GBTM Model | Select Hypertensives | Statins | Diabetes | |||
|---|---|---|---|---|---|---|
| Covariate | VIF | R2 | VIF | R2 | VIF | R2 |
| Predisposing and antecedents | ||||||
| Sex: Female | 1.170 | 0.144 | 1.150 | 0.130 | 1.220 | 0.179 |
| Birthplace: Foreign-born | 1.430 | 0.299 | 1.470 | 0.320 | 1.590 | 0.372 |
| Race: Non-white | 1.200 | 0.165 | 1.180 | 0.153 | 1.190 | 0.162 |
| Ethnicity: Hispanic | 1.530 | 0.347 | 1.550 | 0.357 | 1.740 | 0.425 |
| Education: Not college-educated | 1.820 | 0.451 | 1.850 | 0.459 | 1.790 | 0.440 |
| Enabling characteristics | ||||||
| Self-reported Health Status | 1.550 | 0.355 | 1.500 | 0.332 | 1.470 | 0.319 |
| Depression Symptoms | 1.930 | 0.482 | 2.010 | 0.502 | 1.960 | 0.490 |
| Life Satisfaction | 1.280 | 0.216 | 1.260 | 0.204 | 1.260 | 0.205 |
| Retirement Satisfaction | 1.310 | 0.237 | 1.320 | 0.242 | 1.240 | 0.191 |
| Limitations in Work Due to Health | 1.270 | 0.211 | 1.290 | 0.224 | 1.300 | 0.232 |
| Need characteristics | ||||||
| Household income below poverty index | 1.340 | 0.252 | 1.330 | 0.251 | 1.340 | 0.256 |
| Marital spouse: Loss of spouse | 1.220 | 0.182 | 1.200 | 0.169 | 1.280 | 0.218 |
| Number of resident children | 1.080 | 0.074 | 1.080 | 0.075 | 1.060 | 0.057 |
| Medicaid eligibility | 1.320 | 0.245 | 1.320 | 0.241 | 1.360 | 0.263 |
| Additional health coverage | 1.130 | 0.118 | 1.120 | 0.110 | 1.180 | 0.155 |
| Smoking status: Smoker | 1.050 | 0.051 | 1.060 | 0.054 | 1.030 | 0.029 |
| Number of drinking days/week | 1.140 | 0.119 | 1.100 | 0.093 | 1.080 | 0.070 |
| Instrumental activities of daily living | 1.360 | 0.263 | 1.410 | 0.289 | 1.550 | 0.356 |
| Activities of daily living | 1.510 | 0.336 | 1.510 | 0.339 | 1.760 | 0.432 |
| Mean VIF | 1.381 | 1.389 | 1.410 | |||
References
- Arlt, S.; Lindner, R.; Rosler, A.; von Renteln-Kruse, W. Adherence to medication in patients with dementia: Predictors and strategies for improvement. Drugs Aging 2008, 25, 1033–1047. [Google Scholar] [CrossRef] [PubMed]
- Bowry, A.D.; Shrank, W.H.; Lee, J.L.; Stedman, M.; Choudhry, N.K. A systematic review of adherence to cardiovascular medications in resource-limited settings. J. Gen. Intern. Med. 2011, 26, 1479–1491. [Google Scholar] [CrossRef] [PubMed]
- Coletti, D.J.; Stephanou, H.; Mazzola, N.; Conigliaro, J.; Gottridge, J.; Kane, J.M. Patterns and predictors of medication discrepancies in primary care. J. Eval. Clin. Pract. 2015, 21, 831–839. [Google Scholar] [CrossRef] [PubMed]
- Gard, P.R. Non-adherence to antihypertensive medication and impaired cognition: Which comes first? Int. J. Pharm. Pract. 2010, 18, 252–259. [Google Scholar] [CrossRef]
- Hudani, Z.K.; Rojas-Fernandez, C.H. A scoping review on medication adherence in older patients with cognitive impairment or dementia. Res. Soc. Adm. Pharm. 2016, 12, 815–829. [Google Scholar] [CrossRef]
- Lenti, M.V.; Selinger, C.P. Medication non-adherence in adult patients affected by inflammatory bowel disease: A critical review and update of the determining factors, consequences and possible interventions. Expert Rev. Gastroenterol. Hepatol. 2017, 11, 215–226. [Google Scholar] [CrossRef]
- Warren, J.R.; Falster, M.O.; Fox, D.; Jorm, L. Factors influencing adherence in long-term use of statins. Pharmacoepidemiol. Drug Saf. 2013, 22, 1298–1307. [Google Scholar] [CrossRef]
- World Health Organization. Adherence to Long-Term Therapies: Evidence for Action; World Health Organization: Geneva, Switzerland, 2020; Available online: https://apps.who.int/medicinedocs/pdf/s4883e/s4883e.pdf (accessed on 20 January 2020).
- McCarthy, R. The price you pay for the drug not taken. Bus. Health 1998, 16, 27–28, 30, 32–33. [Google Scholar]
- Osterberg, L.; Blaschke, T. Adherence to medication. N. Engl. J. Med. 2005, 353, 487–497. [Google Scholar] [CrossRef]
- New England Healthcare Institute. Thinking Outside the Pillbox: A System-Wide Approach to Improving Patient Medication Adherence for Chronic Disease. Available online: https://www.nehi.net/writable/publication_files/file/pa_issue_brief_final.pdf (accessed on 14 March 2020).
- Viswanathan, M.; Golin, C.E.; Jones, C.D.; Ashok, M.; Blalock, S.J.; Wines, R.C.; Coker-Schwimmer, E.J.; Rosen, D.L.; Sista, P.; Lohr, K.N. Interventions to Improve Adherence to Self-administered Medications for Chronic Diseases in the United States. Ann. Intern. Med. 2012, 157, 785–795. [Google Scholar] [CrossRef]
- Brown, M.T.; Bussell, J.K. Medication adherence: WHO cares? Mayo Clin. Proc. 2011, 86, 304–314. [Google Scholar] [CrossRef] [PubMed]
- Andersen, R.M. Revisiting the behavioral model and access to medical care: Does it matter? J. Health Soc. Behav. 1995, 36, 1–10. [Google Scholar] [CrossRef] [PubMed]
- Andersen, R.M.; Davidson, P.L.; Baumeister, S.E. Improving access to care in America. In Changing the US Health Care System: Key Issues in Health Services Policy and Management, 3rd ed.; Jossey-Bass: Hoboken, NJ, USA, 2007; pp. 3–31. [Google Scholar]
- Babitsch, B.; Gohl, D.; von Lengerke, T. Re-revisiting Andersen’s Behavioral Model of Health Services Use: A systematic review of studies from 1998–2011. Psychosoc. Med. 2012, 9, Doc11. [Google Scholar] [CrossRef]
- Alhazami, M.; Pontinha, V.M.; Patterson, J.A.; Holdford, D.A. Medication Adherence Trajectories: A Systematic Literature Review. J. Manag. Care Spec. Pharm. 2020, 26, 1138–1152. [Google Scholar] [CrossRef]
- Ajrouche, A.; Estellat, C.; De Rycke, Y.; Tubach, F. Trajectories of Adherence to Low-Dose Aspirin Treatment Among the French Population. J. Cardiovasc. Pharmacol. Ther. 2020, 25, 37–46. [Google Scholar] [CrossRef] [PubMed]
- Dillon, P.; Stewart, D.; Smith, S.M.; Gallagher, P.; Cousins, G. Group-Based Trajectory Models: Assessing Adherence to Antihypertensive Medication in Older Adults in a Community Pharmacy Setting. Clin. Pharmacol. Ther. 2018, 103, 1052–1060. [Google Scholar] [CrossRef]
- Feldman, C.H.; Collins, J.; Zhang, Z.; Subramanian, S.; Solomon, D.H.; Kawachi, I.; Costenbader, K.H. Dynamic patterns and predictors of hydroxychloroquine nonadherence among Medicaid beneficiaries with systemic lupus erythematosus. Semin. Arthritis Rheum. 2018, 48, 205–213. [Google Scholar] [CrossRef]
- Franklin, J.M.; Krumme, A.A.; Shrank, W.H.; Matlin, O.S.; Brennan, T.A.; Choudhry, N.K. Predicting adherence trajectory using initial patterns of medication filling. Am. J. Manag. Care 2015, 21, e537–e544. [Google Scholar]
- Franklin, J.M.; Shrank, W.H.; Pakes, J.M.; Sanfélix-Gimeno, G.; Matlin, O.S.; Brennan, T.A.M.; Choudhry, N.K. Group-based trajectory models: A new approach to classifying and predicting long-term medication adherence. Med. Care 2013, 51, 789–796. [Google Scholar] [CrossRef]
- Hernandez, I.; He, M.; Chen, N.; Brooks, M.M.; Saba, S.; Gellad, W.F. Trajectories of Oral Anticoagulation Adherence Among Medicare Beneficiaries Newly Diagnosed With Atrial Fibrillation. J. Am. Heart Assoc. 2019, 8, e011427. [Google Scholar] [CrossRef]
- Nagin, D.S.; Jones, B.L.; Passos, V.L.; Tremblay, R.E. Group-based multi-trajectory modeling. Stat. Methods Med. Res. 2018, 27, 2015–2023. [Google Scholar] [CrossRef] [PubMed]
- Nagin, D.S. Group-Based Modeling of Development; Harvard University Press: Cambridge, MA, USA, 2005. [Google Scholar]
- Nagin, D.S. Group-based trajectory modeling: An overview. Ann. Nutr. Metab. 2014, 65, 205–210. [Google Scholar] [CrossRef]
- Pontinha, V.M.; Patterson, J.A.; Dixon, D.L.; Carroll, N.V.; Mays, D.; Barnes, A.; Farris, K.B.; Holdford, D.A. Longitudinal medication adherence group-based trajectories of aging adults in the US: A retrospective analysis using monthly proportion of days covered calculations. Res. Soc. Adm. Pharm. 2023, 20, 363–371. [Google Scholar] [CrossRef]
- RAND Center for the Study of Aging. RAND HRS Longitudinal File 2016 (V2) Documentation. Available online: https://hrsdata.isr.umich.edu/sites/default/files/documentation/codebooks/randhrs1992_2016v2.pdf (accessed on 3 May 2020).
- StataCorp LLC. Stata Statistical Software: Release 17; StataCorp LLC: College Station, TX, USA, 2021. [Google Scholar]
- Jones, B.L.; Nagin, D.S. A Note on a Stata Plugin for Estimating Group-based Trajectory Models. Sociol. Methods Res. 2013, 42, 608–613. [Google Scholar] [CrossRef]
- Maddala, G.S. Qualitative and Limited Dependent Variable Models in Econometrics; Cambridge University Press: Cambridge, UK, 1983; p. 498. [Google Scholar]
- Hsiao, C. Logit and probit models. In The Econometrics of Panel Data; Springer: Berlin/Heidelberg, Germany, 1996; pp. 410–428. [Google Scholar]
- Montgomery, D.C. Introduction to Linear Regression Analysis, 5th ed.; Wiley: Hoboken, NJ, USA, 2013. [Google Scholar]
- Kutner, M.H.; Nachtsheim, C.; Neter, J. Applied Linear Regression Models, 4th ed.; McGraw-Hill/Irwin: Boston, MA, USA; New York, NY, USA, 2004. [Google Scholar]
- Burckhardt, P.; Nagin, D.S.; Padman, R. Multi-Trajectory Models of Chronic Kidney Disease Progression. AMIA Annu. Symp. Proc. 2016, 2016, 1737–1746. [Google Scholar] [PubMed]
- Durand, H.; Hayes, P.; Harhen, B.; Conneely, A.; Finn, D.P.; Casey, M.; Murphy, A.W.; Molloy, G.J. Medication adherence for resistant hypertension: Assessing theoretical predictors of adherence using direct and indirect adherence measures. Br. J. Health Psychol. 2018, 23, 949–966. [Google Scholar] [CrossRef] [PubMed]
- Stentzel, U.; Berg, N.v.D.; Schulze, L.N.; Schwaneberg, T.; Radicke, F.; Langosch, J.M.; Freyberger, H.J.; Hoffmann, W.; Grabe, H.-J. Predictors of medication adherence among patients with severe psychiatric disorders: Findings from the baseline assessment of a randomized controlled trial (Tecla). BMC Psychiatry 2018, 18, 155. [Google Scholar] [CrossRef]
- Woolpert, K.M.; Schmidt, J.A.; Ahern, T.P.; Hjorth, C.F.; Farkas, D.K.; Ejlertsen, B.; Collin, L.J.; Lash, T.L.; Cronin-Fenton, D.P. Clinical factors associated with patterns of endocrine therapy adherence in premenopausal breast cancer patients. Breast Cancer Res. 2024, 26, 59. [Google Scholar] [CrossRef]
- Fatima, B.; Mohan, A.; Altaie, I.; Abughosh, S. Predictors of adherence to direct oral anticoagulants after cardiovascular or bleeding events in Medicare Advantage Plan enrollees with atrial fibrillation. J. Manag. Care Spec. Pharm. 2024, 30, 408–419. [Google Scholar] [CrossRef]
- Chang, C.-Y.; Jones, B.L.; Hincapie-Castillo, J.M.; Park, H.; Heldermon, C.D.; Diaby, V.; Wilson, D.L.; Lo-Ciganic, W.-H. Association between trajectories of adherence to endocrine therapy and risk of treated breast cancer recurrence among US nonmetastatic breast cancer survivors. Br. J. Cancer 2024, 130, 1943–1950. [Google Scholar] [CrossRef]
- Wabe, N.; Timothy, A.; Urwin, R.; Xu, Y.; Nguyen, A.; Westbrook, J.I. Analysis of Longitudinal Patterns and Predictors of Medicine Use in Residential Aged Care Using Group-Based Trajectory Modeling: The "MEDTRAC-Cardiovascular" Longitudinal Cohort Study. Pharmacoepidemiol. Drug Saf. 2024, 33, e5881. [Google Scholar] [CrossRef] [PubMed]
- Schmidt, J.A.; Woolpert, K.M.; Hjorth, C.F.; Farkas, D.K.; Ejlertsen, B.; Cronin-Fenton, D. Social Characteristics and Adherence to Adjuvant Endocrine Therapy in Premenopausal Women With Breast Cancer. J. Clin. Oncol. 2024, 42, 3300–3307. [Google Scholar] [CrossRef]
- Mohan, A.; Chen, H.; Deshmukh, A.A.; Wanat, M.; Essien, E.J.; Paranjpe, R.; Fatima, B.; Abughosh, S. Group-based trajectory modeling to identify adherence patterns for direct oral anticoagulants in Medicare beneficiaries with atrial fibrillation: A real-world study on medication adherence. Int. J. Clin. Pharm. 2024, 46, 1525–1535. [Google Scholar] [CrossRef] [PubMed]
- Ishiwata, R.; AlAshqar, A.; Miyashita-Ishiwata, M.; Borahay, M.A. Dispensing patterns of antidepressant and antianxiety medications for psychiatric disorders after benign hysterectomy in reproductive-age women: Results from group-based trajectory modeling. Womens Health 2024, 20, 17455057241272218. [Google Scholar] [CrossRef]
- Huang, W.; Ahmed, M.M.; Morris, E.J.; Yang, L.; O’Neal, L.; Hernandez, I.; Bian, J.; Kimmel, S.E.; Smith, S.; Guo, J. Trajectories of Sacubitril/Valsartan Adherence Among Medicare Beneficiaries With Heart Failure. JACC Adv. 2024, 3, 100958. [Google Scholar] [CrossRef] [PubMed]
- Abegaz, T.M.; Shehab, A.; Gebreyohannes, E.A.; Bhagavathula, A.S.; Elnour, A.A. Nonadherence to antihypertensive drugs: A systematic review and meta-analysis. Medicine (Baltimore) 2017, 96, e5641. [Google Scholar] [CrossRef]
- Ruksakulpiwat, S.; Schiltz, N.K.; Irani, E.; Josephson, R.A.; Adams, J.; Still, C.H. Medication Adherence of Older Adults with Hypertension: A Systematic Review. Patient Prefer. Adherence 2024, 18, 957–975. [Google Scholar] [CrossRef]
- Cummings, P. The relative merits of risk ratios and odds ratios. Arch. Pediatr. Adolesc. Med. 2009, 163, 438–445. [Google Scholar] [CrossRef]
- Greenland, S. Interpretation and choice of effect measures in epidemiologic analyses. Am. J. Epidemiol. 1987, 125, 761–768. [Google Scholar] [CrossRef]
- Park, K.H.; Tickle, L.; Cutler, H. Identifying temporal patterns of adherence to antidepressants, bisphosphonates and statins, and associated patient factors. SSM Popul. Health 2022, 17, 100973. [Google Scholar] [CrossRef]
- Wang, C.-H.; Huang, L.C.; Yang, C.-C.; Chen, C.-L.; Chou, Y.-J.; Chen, Y.-Y.; Yang, W.-C.; Chen, L. Short- and long-term use of medication for psychological distress after the diagnosis of cancer. Support. Care Cancer 2017, 25, 757–768. [Google Scholar] [CrossRef] [PubMed][Green Version]
- Hsu, Y.H.; Mao, C.L.; Wey, M. Antihypertensive medication adherence among elderly Chinese Americans. J. Transcult. Nurs. 2010, 21, 297–305. [Google Scholar] [CrossRef] [PubMed]
- Bird, G.C.; Cannon, C.P.; Kennison, R.H. Results of a survey assessing provider beliefs of adherence barriers to antiplatelet medications. Crit. Pathw. Cardiol. 2011, 10, 134–141. [Google Scholar] [CrossRef]
- Grymonpre, R.; Cheang, M.; Fraser, M.; Metge, C.; Sitar, D.S. Validity of a prescription claims database to estimate medication adherence in older persons. Med. Care 2006, 44, 471–477. [Google Scholar] [CrossRef]
- Galozy, A.; Nowaczyk, S.; Sant’Anna, A.; Ohlsson, M.; Lingman, M. Pitfalls of medication adherence approximation through EHR and pharmacy records: Definitions, data and computation. Int. J. Med. Inform. 2020, 136, 104092. [Google Scholar] [CrossRef] [PubMed]
- Farley, J.F.; Urick, B.Y. Is it time to replace the star ratings adherence measures? J. Manag. Care Spec. Pharm. 2021, 27, 399–404. [Google Scholar] [CrossRef]
- Turvey, C.L.; Wallace, R.B.; Herzog, R. A revised CES-D measure of depressive symptoms and a DSM-based measure of major depressive episodes in the elderly. Int. Psychogeriatr. 1999, 11, 139–148. [Google Scholar] [CrossRef]
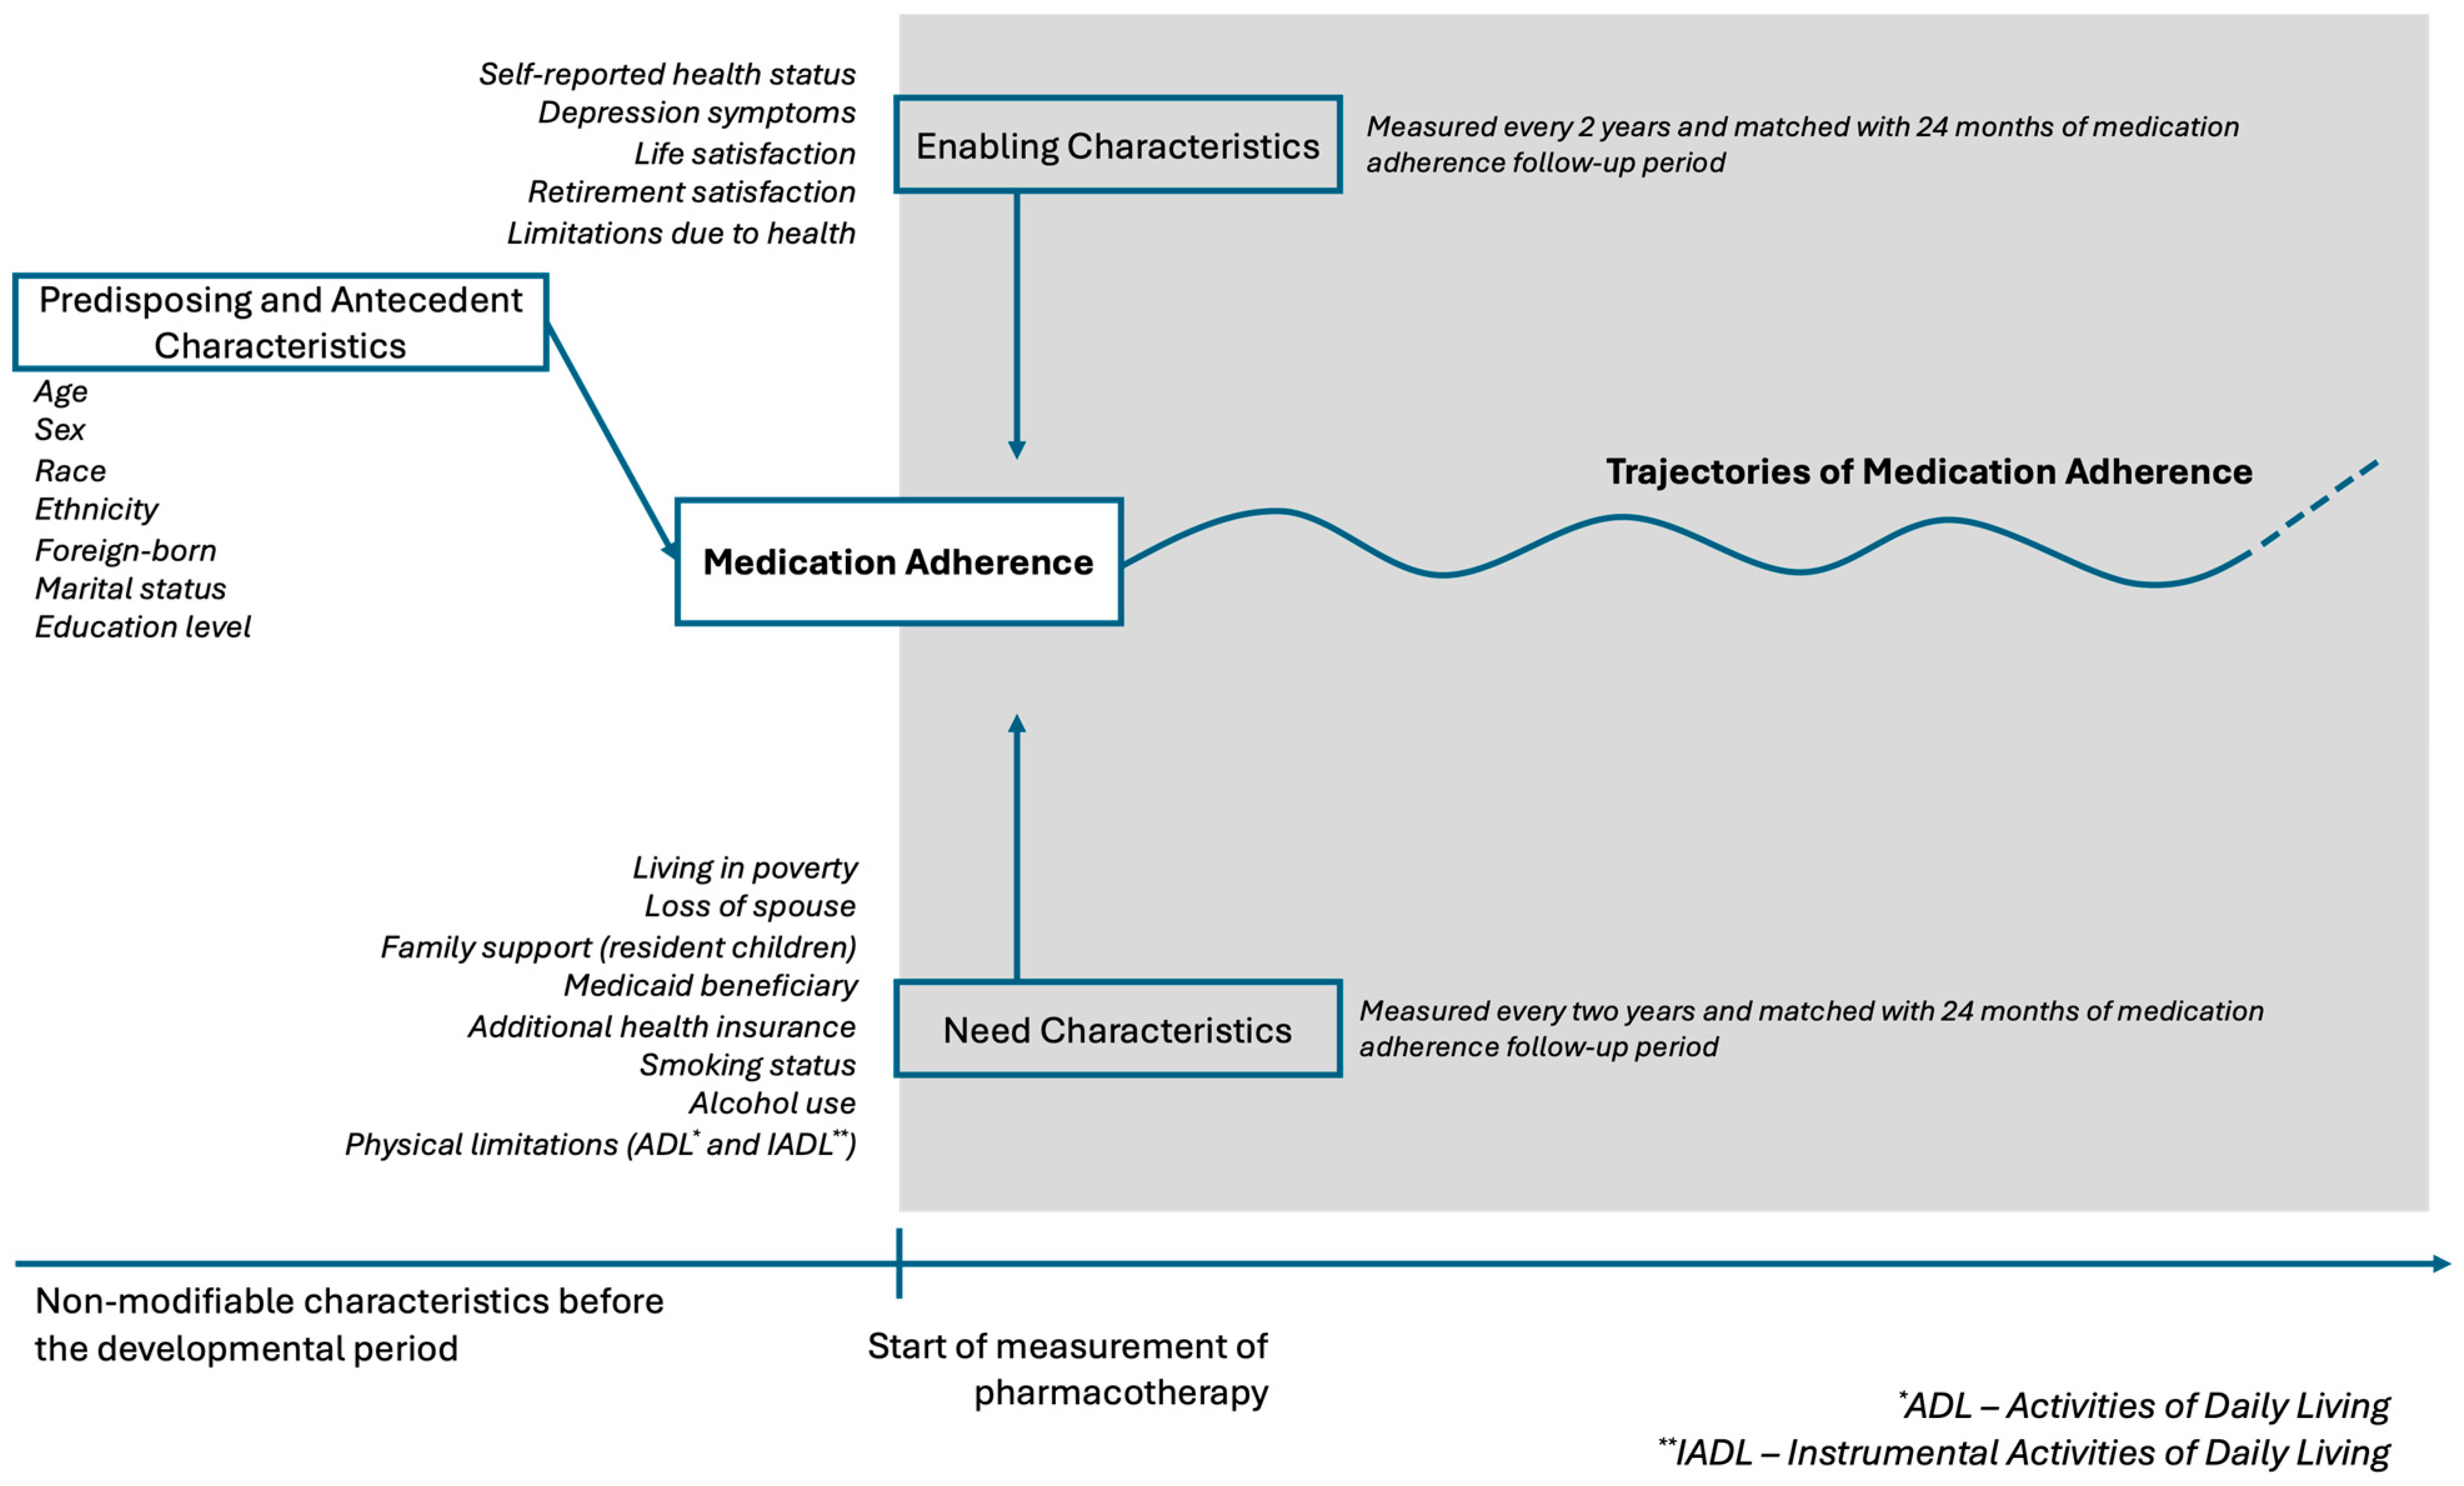
| WHO Report: Causes of Non-Adherence | ||||||
|---|---|---|---|---|---|---|
| Socioeconomic | Health care team/Health care system | Disease-related factors | Therapy-related factors | Patient-related factors | ||
| Andersen’s Behavioral Model of Health Services Use | Predisposing characteristics | Education, race *, ethnicity *, income *, occupation, marital status * | Trust in medical organizations/health care team | Health beliefs | Transportation, distance to health services, substance abuse * | |
| Enabling factors | Urbanicity, Medicaid eligibility * | Access to health care services, wait times, difficulty filling prescriptions, cost, health information, integration of health care team, physician–patient communication, Facetime with health care providers | Health insurance *, social/family support *, health literacy | |||
| Need characteristics | Evaluated health status *, comorbidities * (MI, stroke, cancer), severity, symptoms * | Treatment complexity, route of administration, side effects, duration, degree of behavioral change required | Activities of daily living *, limitations in activities/profession *, risk factors (obesity, smoking, alcohol use) * | |||
| Sample Characteristics | Frequency of Study Participants (n,%) | Missing Data |
|---|---|---|
| N = 11,068 | (n, %) | |
| Predisposing and antecedents | ||
| Sex (n = 11,068) | 0, 0% | |
| Female | 6724, 60.75% | |
| Birthplace (n = 9564) | 1504, 13.58% | |
| US-born | 8475, 88.61% | |
| Race (n = 11,057) | 11, 0.09% | |
| Non-white | 2597, 23.49% | |
| Ethnicity (n = 11,058) | 10, 0.09% | |
| Hispanic | 1302, 11.77% | |
| Education (n = 11,068) | 0, 0% | |
| Has college degree or higher | 2263, 20.45% | |
| Enabling characteristics | ||
| Self-reported health status (n = 6308) | 4760, 43.01% | |
| Excellent | 282, 4.47% | |
| Very good | 1349, 21.39% | |
| Good | 2127, 33.72% | |
| Fair | 1826, 28.95% | |
| Poor | 724, 11.48% | |
| Depression symptoms (n = 9432) | 1636, 14.78% | |
| With clinical depression * | 1919, 20.35% | |
| Life satisfaction (n = 1761) | 9307, 84.09% | |
| Completely satisfied | 395, 22.43% | |
| Very satisfied | 726, 41.23% | |
| Somewhat satisfied | 528, 29.98% | |
| Not very satisfied | 85, 4.83% | |
| Not at all satisfied | 27, 1.53% | |
| Retirement satisfaction (n = 4667) | 6401, 57.83% | |
| Very Satisfied | 2132, 45.68% | |
| Moderately satisfied | 2048, 43.88% | |
| Not at all satisfied | 487, 10.43% | |
| Limitations in work due to health (n = 5977) | 5091, 46.00% | |
| Yes | 3435, 57.47% | |
| Need characteristics | ||
| Poverty index (n = 9609) | 1459, 13.18% | |
| Household income below poverty threshold | 1426, 14,84% | |
| Marital status (n = 9805) | 1263, 11.41% | |
| Loss of spouse or never married ** | 5404, 55.11% | |
| Lives with spouse, partner | 4401, 44.89% | |
| Number of resident children (n = 6320) | 4748, 42,90% | |
| Does not live with resident children | 4852, 76.77% | |
| Lives with resident children | 1468, 23.23% | |
| Medicaid eligibility (n = 9798) | 1270, 11.47% | |
| Medicaid beneficiary | 2007, 20.48% | |
| Additional health insurance coverage (n = 6216) | 4852, 43,84% | |
| Has additional insurance | 1920, 30.89% | |
| Smoking status (n = 9749) | 1319, 11.91% | |
| Smokers | 986, 10.11% | |
| Number of drinking days per week (n = 6294) | 4774, 43.13% | |
| 0 or does notdrink | 4473, 71.07% | |
| 1 | 658, 10.45% | |
| 2 | 304, 4.83% | |
| 3 | 245, 3.89% | |
| 4 | 102, 1.62% | |
| 5 | 124, 1.97% | |
| 6 | 52, 0.83% | |
| 7 | 336, 5.34% | |
| Instrumental activities of daily living (n = 9822) | 1246, 11.25% | |
| 0 (Highly functional) | 7458, 75.93% | |
| 1 | 1035, 10.54% | |
| 2 | 605, 6.16% | |
| 3 (Not functional) | 724, 7.37% | |
| Activities of daily living (n = 9822) | 1246, 11.25% | |
| 0 (Completely independent) | 6316, 64.3% | |
| 1 | 1160, 11.81% | |
| 2 | 735, 7.48% | |
| 3 | 504, 5.13% | |
| 4 | 486, 4.95% | |
| 5 (Totally dependent) | 621, 6.32% | |
| Pharmacotherapeutic class *** | ||
| Select antihypertensives | 7727, 69.81% | |
| Blood cholesterol lowering drugs | 8221, 74.28% | |
| Oral diabetes medications | 3214, 29.04% | |
| TRAJECTORY | Rapid Decline a | |||||||||||
|---|---|---|---|---|---|---|---|---|---|---|---|---|
| GBTM MODEL | Select Antihypertensives | Statins | Oral Diabetes Medications | |||||||||
| Coeff. | S.E. | aOR | p-Value | Coeff. | S.E. | aOR | p-Value | Coeff. | S.E. | aOR | p-Value | |
| Predisposing and antecedents | ||||||||||||
| Sex: Female | 0.11 | 0.12 | 1.11 | 0.392 | 0.16 | 0.15 | 1.18 | 0.273 | −0.01 | 0.29 | 0.99 | 0.980 |
| Birthplace: Foreign-born | 0.00 | 0.21 | 1.00 | 0.988 | 0.91 | 0.24 | 2.48 | 0.000 * | 0.19 | 0.44 | 1.21 | 0.673 |
| Race: Non-white | −0.01 | 0.14 | 0.99 | 0.938 | 0.16 | 0.18 | 1.18 | 0.374 | 0.15 | 0.30 | 1.16 | 0.630 |
| Ethnicity: Hispanic | −0.25 | 0.22 | 0.78 | 0.247 | −0.13 | 0.26 | 0.88 | 0.619 | 0.08 | 0.42 | 1.08 | 0.848 |
| Education: Not college-educated | −0.03 | 0.18 | 0.97 | 0.858 | 0.52 | 0.22 | 1.67 | 0.018 * | 0.21 | 0.40 | 1.23 | 0.606 |
| Enabling characteristics | ||||||||||||
| Self-reported Health Status | 0.03 | 0.07 | 1.03 | 0.646 | 0.00 | 0.08 | 1.00 | 0.98 | 0.10 | 0.17 | 1.11 | 0.540 |
| Depression Symptoms | 0.60 | 0.17 | 1.82 | 0.000 * | 0.39 | 0.22 | 1.48 | 0.07 | 0.16 | 0.41 | 1.18 | 0.691 |
| Life Satisfaction | 0.16 | 0.07 | 1.17 | 0.025 * | 0.02 | 0.09 | 1.02 | 0.86 | 0.14 | 0.16 | 1.15 | 0.392 |
| Retirement Satisfaction | −0.03 | 0.10 | 0.97 | 0.753 | 0.09 | 0.12 | 1.10 | 0.45 | 0.17 | 0.22 | 1.18 | 0.455 |
| Limitations in Work Due to Health | 0.17 | 0.13 | 1.19 | 0.181 | 0.22 | 0.16 | 1.25 | 0.16 | 0.31 | 0.30 | 1.37 | 0.306 |
| Need characteristics | ||||||||||||
| Household income below poverty index | 0.12 | 0.18 | 1.13 | 0.512 | 0.00 | 0.24 | 1.00 | 1.00 | 0.13 | 0.42 | 1.14 | 0.756 |
| Marital status: Loss of spouse | 0.01 | 0.02 | 1.01 | 0.617 | −0.01 | 0.03 | 0.99 | 0.81 | 0.06 | 0.05 | 1.06 | 0.293 |
| Lives with resident children | 0.03 | 0.11 | 1.03 | 0.769 | 0.09 | 0.14 | 1.10 | 0.51 | −0.16 | 0.25 | 0.85 | 0.509 |
| Medicaid beneficiary | −0.11 | 0.17 | 0.90 | 0.539 | 0.13 | 0.22 | 1.14 | 0.55 | −1.39 | 0.54 | 0.25 | 0.010 * |
| Additional health coverage | −0.02 | 0.13 | 0.98 | 0.869 | 0.01 | 0.15 | 1.01 | 0.95 | 0.30 | 0.30 | 1.35 | 0.307 |
| Smoking status: Smoker | 0.40 | 0.18 | 1.49 | 0.028 * | 0.76 | 0.22 | 2.13 | 0.00 * | 0.85 | 0.43 | 2.35 | 0.046 * |
| Number of drinking days/week | 0.04 | 0.03 | 1.04 | 0.159 | −0.02 | 0.04 | 0.98 | 0.58 | −0.11 | 0.10 | 0.89 | 0.263 |
| Instrumental activities of daily living | 0.01 | 0.12 | 1.01 | 0.937 | 0.63 | 0.15 | 1.88 | 0.00 * | −0.09 | 0.31 | 0.91 | 0.768 |
| Activities of daily living | 0.09 | 0.06 | 1.09 | 0.158 | −0.14 | 0.08 | 0.87 | 0.10 | −0.01 | 0.16 | 0.99 | 0.937 |
| TRAJECTORY | Slow Decline a | |||||||||||
|---|---|---|---|---|---|---|---|---|---|---|---|---|
| GBTM MODEL | Select Antihypertensives | Statins | Oral Diabetes Medications | |||||||||
| Coeff. | S.E. | aOR | p-Value | Coeff. | S.E. | aOR | p-Value | Coeff. | S.E. | aOR | p-Value | |
| Predisposing and antecedents | ||||||||||||
| Sex: Female | 0.10 | 0.09 | 1.11 | 0.254 | −0.02 | 0.11 | 0.98 | 0.846 | 0.21 | 0.18 | 1.24 | 0.245 |
| Birthplace: Foreign-born | 0.03 | 0.14 | 1.03 | 0.831 | 0.10 | 0.20 | 1.10 | 0.637 | 0.66 | 0.28 | 1.93 | 0.017 * |
| Race: Non-white | 0.37 | 0.10 | 1.44 | 0.000 * | 0.23 | 0.13 | 1.26 | 0.084 | −0.09 | 0.20 | 0.91 | 0.645 |
| Ethnicity: Hispanic | 0.04 | 0.14 | 1.04 | 0.784 | 0.15 | 0.19 | 1.17 | 0.421 | −0.56 | 0.28 | 0.57 | 0.050 * |
| Education: Not college-educated | 0.06 | 0.13 | 1.06 | 0.633 | 0.24 | 0.16 | 1.27 | 0.143 | 0.34 | 0.27 | 1.40 | 0.212 |
| Enabling characteristics | ||||||||||||
| Self-reported Health Status | 0.22 | 0.05 | 1.24 | 0.000 * | 0.15 | 0.06 | 1.16 | 0.013 * | 0.14 | 0.10 | 1.14 | 0.188 |
| Depression Symptoms | 0.23 | 0.13 | 1.26 | 0.066 | 0.21 | 0.16 | 1.23 | 0.198 | 0.50 | 0.25 | 1.65 | 0.042 * |
| Life Satisfaction | −0.04 | 0.05 | 0.96 | 0.398 | 0.02 | 0.06 | 1.02 | 0.817 | 0.05 | 0.10 | 1.05 | 0.654 |
| Retirement Satisfaction | −0.04 | 0.07 | 0.96 | 0.588 | 0.09 | 0.09 | 1.09 | 0.325 | −0.09 | 0.14 | 0.91 | 0.510 |
| Limitations in Work Due to Health | 0.04 | 0.09 | 1.04 | 0.700 | 0.17 | 0.11 | 1.19 | 0.133 | 0.35 | 0.19 | 1.42 | 0.065 |
| Need characteristics | ||||||||||||
| Household income below poverty index | 0.05 | 0.13 | 1.05 | 0.697 | 0.31 | 0.18 | 1.37 | 0.075 | −0.30 | 0.26 | 0.74 | 0.259 |
| Marital status: Loss of spouse | 0.01 | 0.02 | 1.01 | 0.562 | −0.01 | 0.02 | 0.99 | 0.506 | 0.01 | 0.03 | 1.01 | 0.693 |
| Lives with resident children | 0.09 | 0.08 | 1.09 | 0.254 | 0.15 | 0.10 | 1.16 | 0.145 | 0.13 | 0.13 | 1.14 | 0.322 |
| Medicaid beneficiary | −0.11 | 0.12 | 0.90 | 0.384 | 0.02 | 0.17 | 1.02 | 0.931 | 0.01 | 0.24 | 1.01 | 0.982 |
| Additional health coverage | −0.18 | 0.09 | 0.84 | 0.057 | 0.17 | 0.11 | 1.19 | 0.112 | 0.46 | 0.19 | 1.59 | 0.016 * |
| Smoking status: Smoker | −0.03 | 0.15 | 0.97 | 0.855 | 0.11 | 0.19 | 1.12 | 0.543 | 0.09 | 0.32 | 1.09 | 0.784 |
| Number of drinking days/week | 0.05 | 0.02 | 1.06 | 0.017 * | 0.00 | 0.03 | 1.00 | 0.986 | 0.04 | 0.05 | 1.04 | 0.459 |
| Instrumental activities of daily living | 0.05 | 0.09 | 1.06 | 0.557 | 0.42 | 0.12 | 1.52 | 0.000 | 0.27 | 0.17 | 1.31 | 0.104 |
| Activities of daily living | 0.01 | 0.05 | 1.01 | 0.783 | −0.09 | 0.06 | 0.92 | 0.151 | −0.01 | 0.09 | 0.99 | 0.949 |
| TRAJECTORY | Moderate Decline a | |||||||||||
|---|---|---|---|---|---|---|---|---|---|---|---|---|
| GBTM MODEL | Select Antihypertensives | Statins | Oral Diabetes Medications | |||||||||
| Coeff. | S.E. | aOR | p-Value | Coeff. | S.E. | aOR | p-Value | Coeff. | S.E. | aOR | p-Value | |
| Predisposing and antecedents | ||||||||||||
| Sex: Female | - | - | - | - | 0.40 | 0.12 | 1.50 | 0.001 * | 0.25 | 0.17 | 1.28 | 0.149 |
| Birthplace: Foreign-born | - | - | - | - | 0.56 | 0.20 | 1.75 | 0.006 * | 0.05 | 0.27 | 1.05 | 0.862 |
| Race: Non-white | - | - | - | - | 0.69 | 0.14 | 2.00 | 0.000 * | −0.37 | 0.19 | 0.69 | 0.054 |
| Ethnicity: Hispanic | - | - | - | - | 0.20 | 0.20 | 1.23 | 0.311 | 0.14 | 0.25 | 1.15 | 0.564 |
| Education: Not college-educated | - | - | - | - | 0.07 | 0.18 | 1.07 | 0.704 | 0.25 | 0.26 | 1.28 | 0.333 |
| Enabling characteristics | ||||||||||||
| Self-reported Health Status | - | - | - | - | 0.09 | 0.07 | 1.09 | 0.196 | 0.14 | 0.10 | 1.15 | 0.153 |
| Depression Symptoms | - | - | - | - | 0.23 | 0.17 | 1.26 | 0.175 | 0.79 | 0.23 | 2.20 | 0.001 * |
| Life Satisfaction | - | - | - | - | 0.10 | 0.07 | 1.10 | 0.159 | 0.13 | 0.10 | 1.14 | 0.187 |
| Retirement Satisfaction | - | - | - | - | 0.14 | 0.10 | 1.15 | 0.137 | −0.01 | 0.14 | 0.99 | 0.966 |
| Limitations in Work Due to Health | - | - | - | - | 0.02 | 0.13 | 1.02 | 0.889 | 0.08 | 0.18 | 1.08 | 0.677 |
| Need characteristics | ||||||||||||
| Household income below poverty index | - | - | - | - | 0.25 | 0.18 | 1.29 | 0.163 | −0.30 | 0.25 | 0.74 | 0.231 |
| Marital status: Loss of spouse | - | - | - | - | −0.02 | 0.02 | 0.98 | 0.326 | 0.00 | 0.03 | 1.00 | 0.973 |
| Lives with resident children | - | - | - | - | 0.02 | 0.11 | 1.02 | 0.836 | 0.00 | 0.13 | 1.00 | 0.997 |
| Medicaid beneficiary | - | - | - | - | 0.21 | 0.17 | 1.23 | 0.223 | −0.09 | 0.23 | 0.92 | 0.706 |
| Additional health coverage | - | - | - | - | −0.08 | 0.13 | 0.92 | 0.529 | 0.01 | 0.19 | 1.01 | 0.978 |
| Smoking status: Smoker | - | - | - | - | 0.38 | 0.19 | 1.46 | 0.049 * | 0.18 | 0.31 | 1.19 | 0.566 |
| Number of drinking days/week | - | - | - | - | −0.05 | 0.03 | 0.96 | 0.165 | −0.08 | 0.06 | 0.92 | 0.149 |
| Instrumental activities of daily living | - | - | - | - | 0.24 | 0.13 | 1.27 | 0.061 | −0.07 | 0.17 | 0.93 | 0.684 |
| Activities of daily living | - | - | - | - | −0.09 | 0.07 | 0.92 | 0.179 | 0.01 | 0.09 | 1.01 | 0.871 |
| TRAJECTORY | Low then Increasing Adherence a | |||||||||||
|---|---|---|---|---|---|---|---|---|---|---|---|---|
| GBTM MODEL | Select Antihypertensives | Statins | Oral Diabetes Medications | |||||||||
| Estimate | S.E. | aOR | p-Value | Estimate | S.E. | aOR | p-Value | Estimate | S.E. | aOR | p-Value | |
| Predisposing and antecedents | ||||||||||||
| Sex: Female | - | - | - | - | 0.06 | 0.10 | 1.06 | 0.561 | 0.71 | 0.20 | 2.02 | 0.001 * |
| Birthplace: Foreign-born | - | - | - | - | 0.48 | 0.18 | 1.62 | 0.009 * | 0.05 | 0.29 | 1.05 | 0.868 |
| Race: Non-white | - | - | - | - | 0.30 | 0.13 | 1.35 | 0.019 * | 0.26 | 0.20 | 1.30 | 0.189 |
| Ethnicity: Hispanic | - | - | - | - | 0.02 | 0.18 | 1.02 | 0.930 | 0.14 | 0.27 | 1.15 | 0.599 |
| Education: Not college-educated | - | - | - | - | 0.15 | 0.15 | 1.16 | 0.334 | −0.47 | 0.32 | 0.63 | 0.136 |
| Enabling characteristics | ||||||||||||
| Self-reported Health Status | - | - | - | - | 0.08 | 0.06 | 1.08 | 0.168 | 0.01 | 0.11 | 1.01 | 0.946 |
| Depression Symptoms | - | - | - | - | 0.19 | 0.15 | 1.21 | 0.213 | 0.71 | 0.26 | 2.04 | 0.005 * |
| Life Satisfaction | - | - | - | - | −0.11 | 0.06 | 0.90 | 0.078 | 0.32 | 0.11 | 1.37 | 0.004 * |
| Retirement Satisfaction | - | - | - | - | 0.16 | 0.08 | 1.17 | 0.055 | 0.02 | 0.15 | 1.02 | 0.897 |
| Limitations in Work Due to Health | - | - | - | - | 0.17 | 0.11 | 1.18 | 0.114 | 0.15 | 0.21 | 1.17 | 0.456 |
| Need characteristics | ||||||||||||
| Household income below poverty index | - | - | - | - | −0.12 | 0.17 | 0.88 | 0.473 | 0.00 | 0.26 | 1.00 | 0.990 |
| Marital status: Loss of spouse | - | - | - | - | −0.03 | 0.02 | 0.97 | 0.098 | −0.03 | 0.04 | 0.97 | 0.420 |
| Lives with resident children | - | - | - | - | 0.07 | 0.10 | 1.07 | 0.467 | −0.24 | 0.16 | 0.79 | 0.121 |
| Medicaid beneficiary | - | - | - | - | 0.16 | 0.15 | 1.17 | 0.310 | −0.34 | 0.25 | 0.71 | 0.174 |
| Additional health coverage | - | - | - | - | −0.06 | 0.10 | 0.94 | 0.574 | −0.32 | 0.23 | 0.73 | 0.168 |
| Smoking status: Smoker | - | - | - | - | 0.16 | 0.18 | 1.17 | 0.368 | 0.46 | 0.32 | 1.58 | 0.150 |
| Number of drinking days/week | - | - | - | - | −0.02 | 0.03 | 0.98 | 0.454 | 0.01 | 0.06 | 1.01 | 0.885 |
| Instrumental activities of daily living | - | - | - | - | 0.08 | 0.12 | 1.09 | 0.490 | −0.07 | 0.18 | 0.93 | 0.681 |
| Activities of daily living | - | - | - | - | 0.01 | 0.06 | 1.01 | 0.843 | 0.10 | 0.09 | 1.10 | 0.283 |
| TRAJECTORY | High then Increasing Adherence a | |||||||||||
|---|---|---|---|---|---|---|---|---|---|---|---|---|
| GBTM MODEL | Select Antihypertensives | Statins | Oral Diabetes Medications | |||||||||
| Estimate | S.E. | aOR | p-Value | Estimate | S.E. | aOR | p-Value | Estimate | S.E. | aOR | p-Value | |
| Predisposing and antecedents | ||||||||||||
| Sex: Female | - | - | - | - | - | - | - | - | 0.23 | 0.19 | 1.26 | 0.221 |
| Birthplace: Foreign-born | - | - | - | - | - | - | - | - | 0.20 | 0.30 | 1.22 | 0.511 |
| Race: Non-white | - | - | - | - | - | - | - | - | −0.36 | 0.21 | 0.70 | 0.092 |
| Ethnicity: Hispanic | - | - | - | - | - | - | - | - | −0.43 | 0.30 | 0.65 | 0.146 |
| Education: Not college-educated | - | - | - | - | - | - | - | - | −0.31 | 0.30 | 0.74 | 0.313 |
| Enabling characteristics | ||||||||||||
| Self-reported Health Status | - | - | - | - | - | - | - | - | 0.08 | 0.10 | 1.08 | 0.444 |
| Depression Symptoms | - | - | - | - | - | - | - | - | 0.29 | 0.25 | 1.34 | 0.253 |
| Life Satisfaction | - | - | - | - | - | - | - | - | 0.01 | 0.11 | 1.01 | 0.947 |
| Retirement Satisfaction | - | - | - | - | - | - | - | - | −0.19 | 0.15 | 0.83 | 0.212 |
| Limitations in Work Due to Health | - | - | - | - | - | - | - | - | 0.11 | 0.20 | 1.12 | 0.571 |
| Need characteristics | ||||||||||||
| Household income below poverty index | - | - | - | - | - | - | - | - | −0.40 | 0.27 | 0.67 | 0.147 |
| Marital status: Loss of spouse | - | - | - | - | - | - | - | - | 0.03 | 0.04 | 1.03 | 0.465 |
| Lives with resident children | - | - | - | - | - | - | - | - | −0.09 | 0.15 | 0.91 | 0.527 |
| Medicaid beneficiary | - | - | - | - | - | - | - | - | 0.08 | 0.25 | 1.08 | 0.747 |
| Additional health coverage | - | - | - | - | - | - | - | - | 0.09 | 0.21 | 1.09 | 0.686 |
| Smoking status: Smoker | - | - | - | - | - | - | - | - | 0.22 | 0.33 | 1.25 | 0.504 |
| Number of drinking days/week | - | - | - | - | - | - | - | - | −0.06 | 0.06 | 0.94 | 0.342 |
| Instrumental activities of daily living | - | - | - | - | - | - | - | - | 0.05 | 0.18 | 1.05 | 0.770 |
| Activities of daily living | - | - | - | - | - | - | - | - | 0.12 | 0.09 | 1.12 | 0.201 |
Disclaimer/Publisher’s Note: The statements, opinions and data contained in all publications are solely those of the individual author(s) and contributor(s) and not of MDPI and/or the editor(s). MDPI and/or the editor(s) disclaim responsibility for any injury to people or property resulting from any ideas, methods, instructions or products referred to in the content. |
© 2025 by the authors. Licensee MDPI, Basel, Switzerland. This article is an open access article distributed under the terms and conditions of the Creative Commons Attribution (CC BY) license (https://creativecommons.org/licenses/by/4.0/).
Share and Cite
Pontinha, V.M.; Patterson, J.A.; Dixon, D.L.; Carroll, N.V.; Mays, D.; Farris, K.B.; Holdford, D.A. Investigating the Time-Varying Nature of Medication Adherence Predictors: An Experimental Approach Using Andersen’s Behavioral Model of Health Services Use. Pharmacy 2025, 13, 53. https://doi.org/10.3390/pharmacy13020053
Pontinha VM, Patterson JA, Dixon DL, Carroll NV, Mays D, Farris KB, Holdford DA. Investigating the Time-Varying Nature of Medication Adherence Predictors: An Experimental Approach Using Andersen’s Behavioral Model of Health Services Use. Pharmacy. 2025; 13(2):53. https://doi.org/10.3390/pharmacy13020053
Chicago/Turabian StylePontinha, Vasco M., Julie A. Patterson, Dave L. Dixon, Norman V. Carroll, D’Arcy Mays, Karen B. Farris, and David A. Holdford. 2025. "Investigating the Time-Varying Nature of Medication Adherence Predictors: An Experimental Approach Using Andersen’s Behavioral Model of Health Services Use" Pharmacy 13, no. 2: 53. https://doi.org/10.3390/pharmacy13020053
APA StylePontinha, V. M., Patterson, J. A., Dixon, D. L., Carroll, N. V., Mays, D., Farris, K. B., & Holdford, D. A. (2025). Investigating the Time-Varying Nature of Medication Adherence Predictors: An Experimental Approach Using Andersen’s Behavioral Model of Health Services Use. Pharmacy, 13(2), 53. https://doi.org/10.3390/pharmacy13020053


