
Inward FDI, IFRS Adoption and Institutional Quality: Insights from the MENA Countries


Abstract
:1. Introduction
2. Literature Review and Hypotheses Development
3. Statistical Data and Research Methodology
3.1. International Financial Reporting Standards (IFRS)
3.2. Institutional Quality Measures
3.3. Control Variables
4. Estimation Results
5. Conclusions
Author Contributions
Funding
Institutional Review Board Statement
Informed Consent Statement
Data Availability Statement
Acknowledgments
Conflicts of Interest
Appendix A

| Country | Year of Adoption |
|---|---|
| Bahrain | 2001 |
| Kuwait | 2005 |
| Iraq | 1997 |
| Lebanon | 1996 |
| Jordan | 1997 |
| Oman | 1998 |
| Qatar | 2005 |
| Saudi Arabia | 2015 |
| Iran | 2005 |
| Syria | 2005 |
| United Arab Emirates | 2015 |
| Morocco | 2006 |
| Libya | n/a |
| Israel | 2008 |
| Sudan | n/a |
| Malta | 1995 |
| Djibouti | 1996 |
| Yemen | 2019 |
| Algeria | 2009 |
| Liberia | 2014 |
| Egypt | n/a |
| Tunisia | 1996 |
| Explanatory Variable | Measures | Sources |
|---|---|---|
| Net FDI inflows | Foreign direct investment, net inflows (current USD). | World Development Indicators (WDI) |
| IFRS | The dummy variable takes 1 onward if a country adopted IFRS and 0 otherwise. | IASB sources, (2) Deloitte’s IAS Plus website based on (Song and Trimble 2020). |
| GDPCAP | GDP per capita in current U.S. dollars scaled by 1000, capturing a labour cost factor that attracts FDI. | World Development Indicators (WDI) |
| GDPG | GDP growth is measured by dividing normal GDP by the current year population, capturing a market factor that attracts FDI. | World Development Indicators (WDI) |
| Exchange Rate | The exchange rate is the official exchange rate (LCU per USD, period average). | World Development Indicators (WDI) |
| Infrastructure | The level of infrastructure is measured by the number of mobile cellular subscriptions per 100 people. | World Development Indicators (WDI) |
| WTO | Dummy equal to 1 from the year that an Arab country joined the WTO, otherwise 0. | World Trade Organisation (WTO) |
| VOICE | Voice and accountability are measured in units ranging from −2.5 to 2.5. | Kaufmann et al. (2010). |
| POLSTAB | Political stability is measured in units ranging from −2.5 to 2.5. | Kaufmann et al. (2010). |
| GOVT | Government effectiveness is measured in units ranging from −2.5 to 2.5. | Kaufmann et al. (2010). |
| CORRUPT | Political stability is measured in units ranging from −2.5 to 2.5. | Kaufmann et al. (2010). |
| Variables | (1) | (2) | (3) | (4) | (5) | (6) | (7) | (8) | (9) | (10) | (11) |
|---|---|---|---|---|---|---|---|---|---|---|---|
| (1) FDI inflow | 1.000 | ||||||||||
| (2) IFRS | 0.193 | 1.000 | |||||||||
| (3) GDPCAP | 0.277 | 0.362 | 1.000 | ||||||||
| (4) GDPG | 0.084 | 0.016 | 0.114 | 1.000 | |||||||
| (5) Infrastructure | 0.317 | 0.221 | 0.414 | −0.059 | 1.000 | ||||||
| (6) Exchange Rate | 0.076 | −0.013 | −0.403 | −0.009 | −0.181 | 1.000 | |||||
| (7) WTO | 0.215 | 0.089 | 0.444 | 0.024 | 0.334 | −0.489 | 1.000 | ||||
| (8) VOICE | 0.189 | 0.289 | 0.363 | 0.005 | 0.247 | −0.217 | 0.386 | 1.000 | |||
| (9) POLSTAB | 0.103 | 0.162 | 0.500 | 0.033 | 0.205 | −0.504 | 0.501 | 0.361 | 1.000 | ||
| (10) GOVT | 0.306 | 0.273 | 0.635 | 0.026 | 0.394 | −0.472 | 0.601 | 0.616 | 0.690 | 1.000 | |
| (11) Corrupt | 0.287 | 0.298 | 0.647 | 0.048 | 0.388 | −0.521 | 0.632 | 0.599 | 0.730 | 0.930 | 1.000 |
| Variable | VIF | Tolerance |
|---|---|---|
| Corrupt | 8.81 | 0.113541 |
| GOVT | 7.92 | 0.126246 |
| GDPCAP | 2.17 | 0.460142 |
| POLSTAB | 2.01 | 0.497635 |
| WTO | 2.01 | 0.498466 |
| VOICE | 1.81 | 0.553953 |
| Exchange Rate | 1.5 | 0.668715 |
| Infrastructure | 1.4 | 0.714614 |
| IFRS | 1.35 | 0.743093 |
| GDPG | 1.02 | 0.977246 |
| Mean VIF | 3 |
| Country | Year | VA | PS | GE | CC |
|---|---|---|---|---|---|
| ALGERIA | 1996–2019 | −1.1 | −1.4 | −0.7 | −0.7 |
| BAHRAIN | 1996–2019 | −1.1 | −0.4 | 0.6 | 0.3 |
| DJIBOUTI | 1996–2019 | −1.2 | −0.4 | −0.9 | −0.7 |
| EGYPT | 1996–2019 | −1.1 | −0.8 | −0.5 | −0.6 |
| IRAN | 1996–2019 | −1.4 | −1.0 | −0.5 | −0.6 |
| IRAQ | 1996–2019 | −1.5 | −2.2 | −1.6 | −1.5 |
| ISRAEL | 1996–2019 | 0.6 | −1.3 | 1.2 | 1.0 |
| JORDAN | 1996–2019 | −0.6 | −0.3 | 0.1 | 0.2 |
| KUWAIT | 1996–2019 | −0.5 | 0.3 | 0.0 | 0.3 |
| LEBANON | 1996–2019 | −0.5 | −1.2 | −0.3 | −0.8 |
| LIBERIA | 1996–2019 | −0.7 | −1.3 | −1.5 | −1.1 |
| LIBYA | 1996–2019 | −1.6 | −0.7 | −1.3 | −1.2 |
| MALTA | 1996–2019 | 1.2 | 1.3 | 1.1 | 0.8 |
| MORROCO | 1996–2019 | −0.7 | −0.4 | −0.2 | −0.3 |
| OMAN | 1996–2019 | −0.9 | 0.9 | 0.4 | 0.5 |
| QATAR | 1996–2019 | −0.9 | 1.0 | 0.7 | 0.8 |
| SAUDI ARABIA | 1996–2019 | −1.8 | −0.2 | −0.1 | 0.0 |
| SUDAN | 1996–2019 | −1.8 | −2.2 | −1.3 | −1.3 |
| SYRIA | 1996–2019 | −1.8 | −1.0 | −1.2 | −1.2 |
| TUNISIA | 1996–2019 | −0.7 | −0.3 | 0.2 | −0.2 |
| UNITED ARAB EMIRATES | 1996–2019 | −0.9 | 0.9 | 1.1 | 0.8 |
| YEMEN | 1996–2019 | −1.2 | −1.9 | −1.1 | −1.1 |
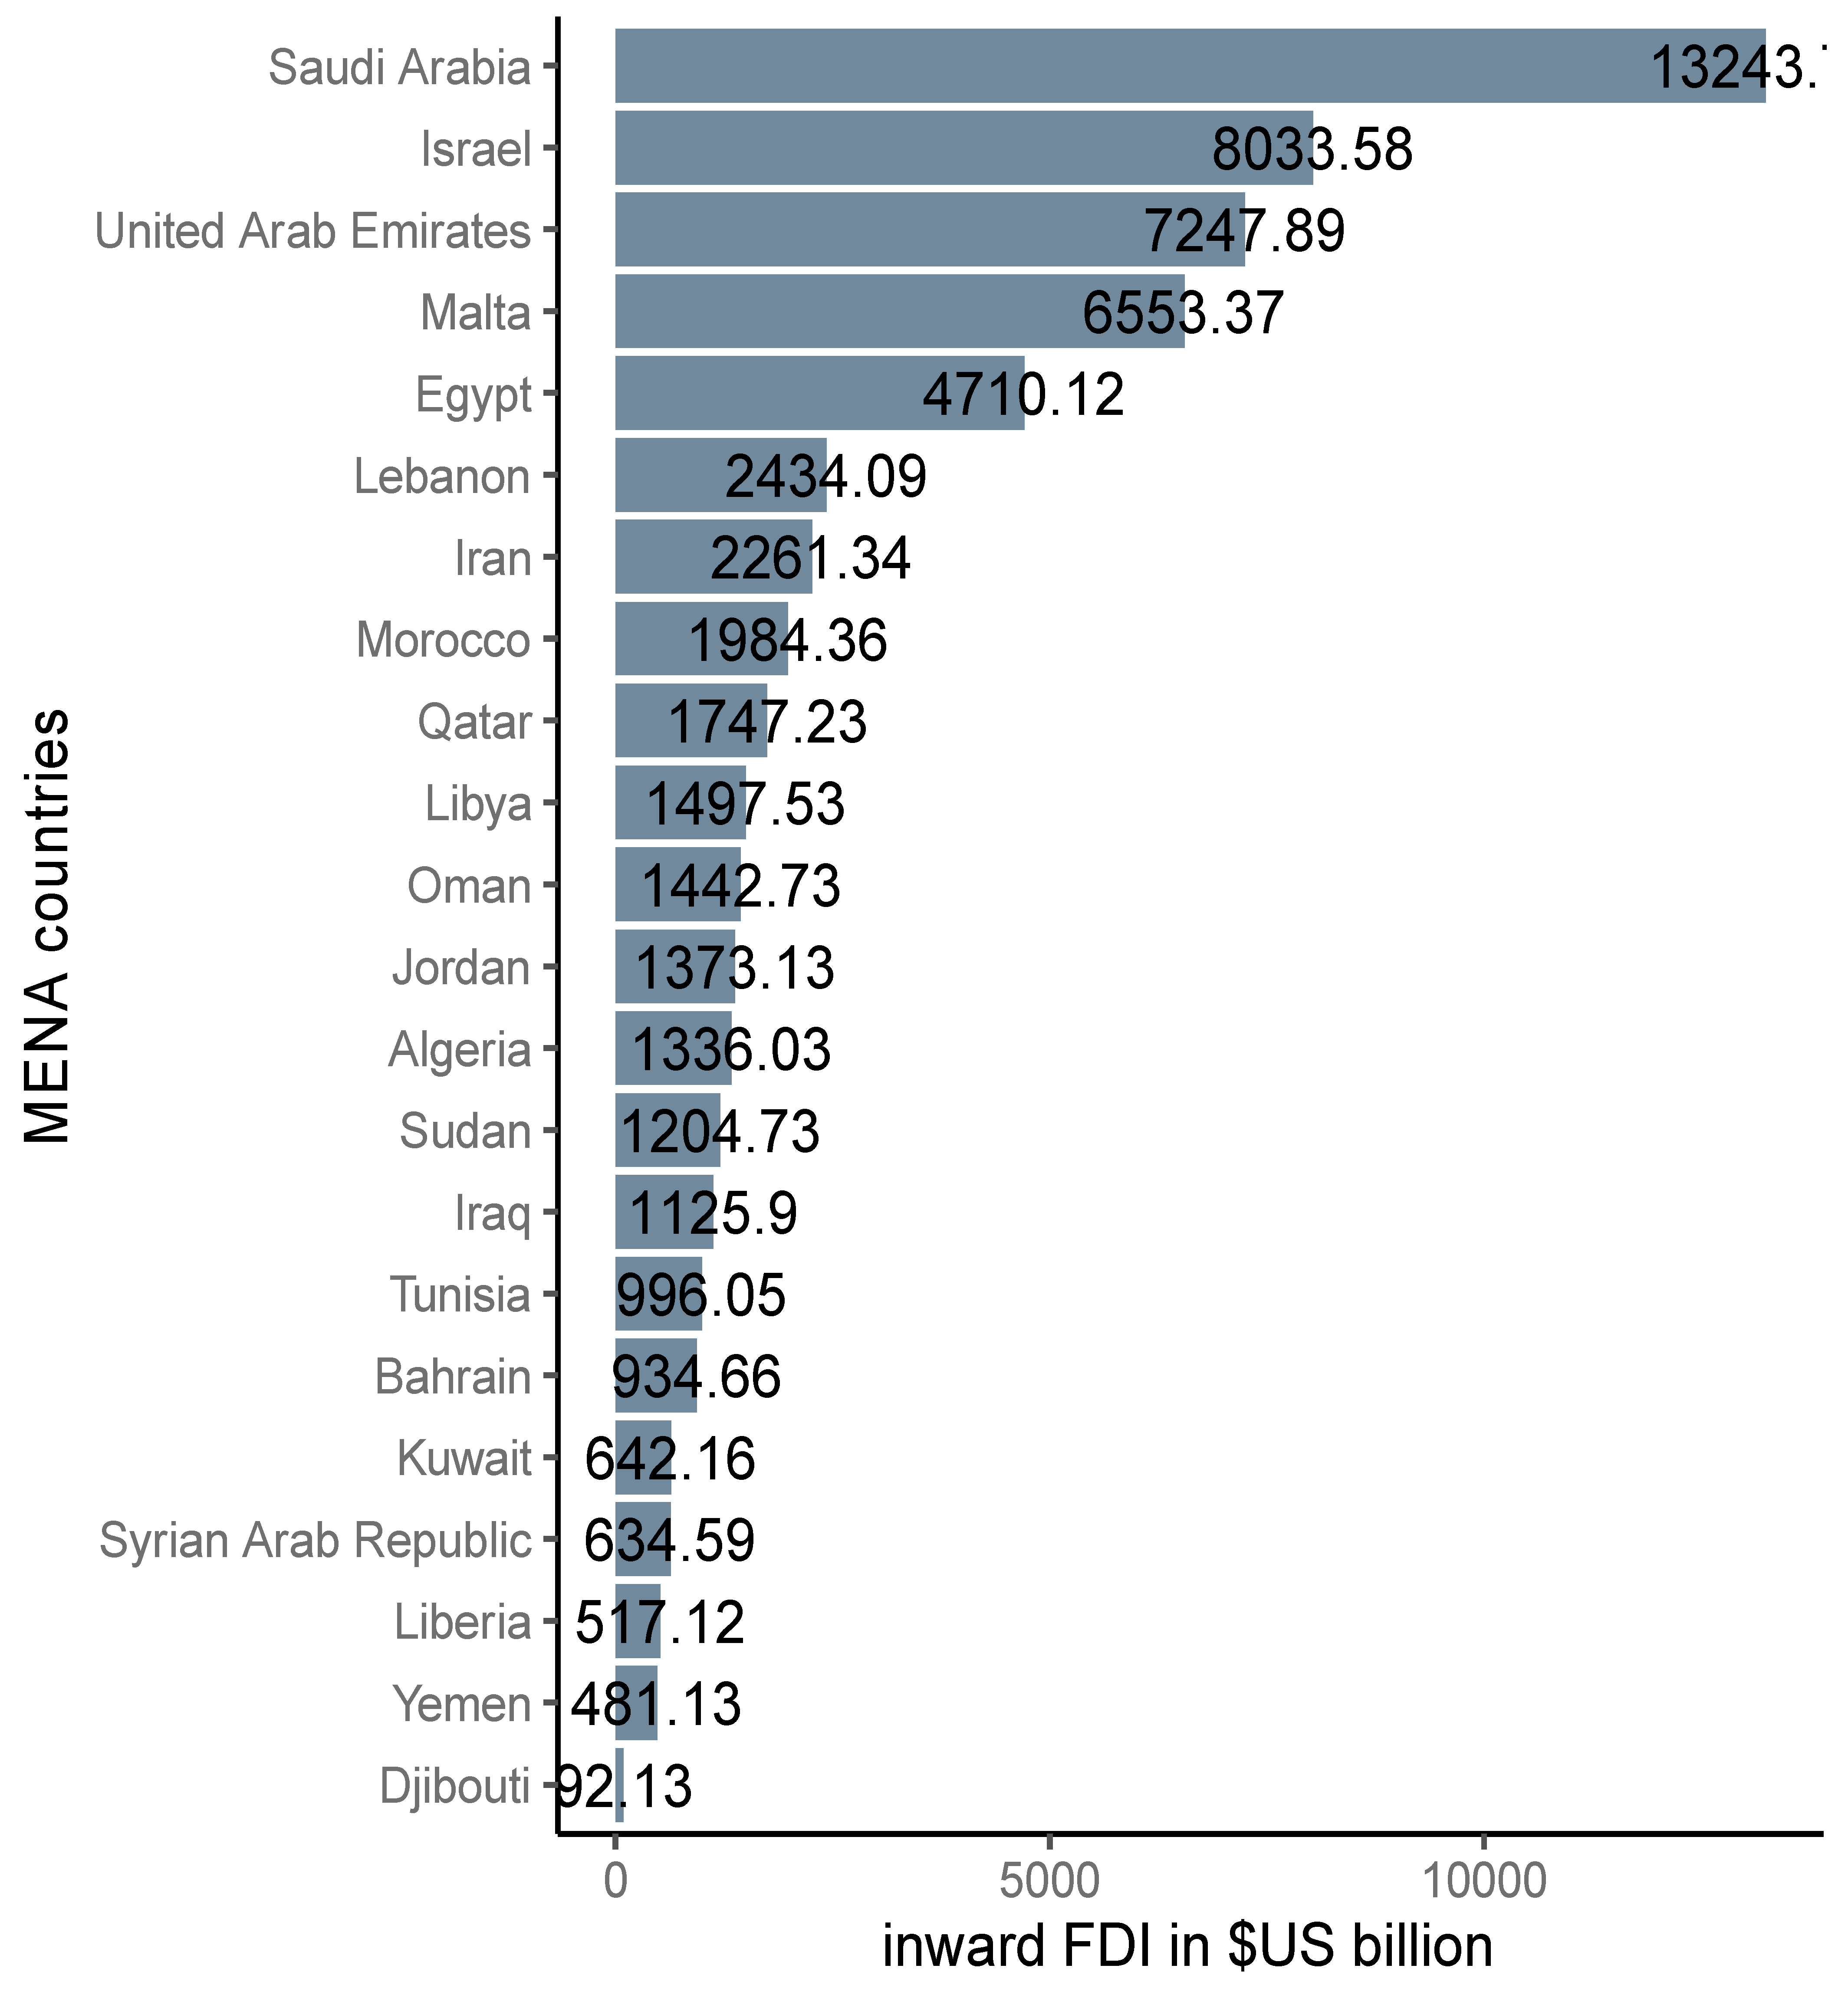
| 1 | The distribution of inward FDI to MENA countries from 1996 to 2019 is shown in Figure A1 in the Appendix A. |
| 2 | See examples: Alsuhaibani (2012) conducted a study on Saudi Arabia; Al-Akra et al. (2009) on Jordan; Farag (2009) on Egypt; Irvine (2008) on the United Arab Emirates; Khlif et al. (2020) on Algeria, Morocco and Tunisia and Khdir and Białek-Jaworska (2020) on Iraq. |
| 3 | MENA countries include Algeria, Bahrain, Djibouti, Egypt, Israel, Iraq, Iran, Jordan, Kuwait, Lebanon, Libya, Liberia, Morocco, Malta, Oman, Palestine, Qatar, Saudi Arabia, Sudan, Syria, Tunisia, UAE and Yemen. |
| 4 | A reported data of Governance Indicators starting in 1996 and 2002 overlapped in our sample data. To minimize the impact of data volatility, we received average values for the years before 2002, from which we take the average to obtain annual data (Law and Habibullah 2009). |
| 5 | These studies include, inter alia, Gordon et al. (2012); Nnadi and Soobaroyen (2015); Kwarbai et al. (2016). |
| 6 | These include Bahrain, Egypt, Jordan, Kuwait, Morocco, Oman, Qatar, Saudi Arabia, Yemen, Tunisia and UAE, while Syria, Iraq, Iran and Libya are not WTO members. |
| 7 | In the Appendix A, Table A1 shows the country’s IFRS adoption, and Table A2 and Table A3 show the definitions of our explanatory variables and pairwise correlations, respectively. |
| 8 | Table A5 shows the institutional quality indices for MENA countries. |
| 9 | The number of observations for the MENA countries is the same; therefore, the measure of the statistics differs. For example, Libya, Iraq, Sudan and Syria are poorly indexed. Indeed, the data of these countries has disinvestment values (negative values). Having a large missing value in the data sample may bias empirical results. |
| 10 | The results are reported in Table A4 (Appendix A). |
| 11 | The PPML estimator has several desirable properties. First, it assists in mitigating Jensen’s inequality, which is the following: An important implication of Jensen’s inequality is that when we take the logarithm of the explanatory variables, lower values and disinvestment values in the data values automatically become zero. Hence, dropping these observations causes a significant loss of information. Second, the use of the log-transformed response variable produces a potential bias for calculation estimates of E[y|x] on the original scale provided the residual term does not have a normal distribution (Silva and Tenreyro 2011). Moreover, the PPML can count for negative and missing values in the data, hence disinvestment and zero values in the panel data are not a problem. Finally, when we compare other methods (i.e., OLS and Nonlinear Least Squares, Feasible Generalized Least Squares and Tobit), the PPML produces more consistent results (Gurshev and Hamza 2021; Nguyen et al. 2020). |
| 12 |
References
- Abdelhadi, Samer, Ala Bashayreh, and Mohammad W. Alomari. 2021. The effect of fragility on foreign direct investment deterioration: The case of MENA countries. Journal of Sustainable Finance & Investment, 1–9. [Google Scholar] [CrossRef]
- Ahearne, Alan G., William L. Griever, and Francis E. Warnock. 2004. Information costs and home bias: An analysis of US holdings of foreign equities. Journal of International Economics 62: 313–36. [Google Scholar] [CrossRef] [Green Version]
- Akisik, Orhan. 2014. Financial reporting and foreign direct investments in Latin America. In Accounting in Latin America. Bingley: Emerald Group Publishing Limited. [Google Scholar] [CrossRef]
- Akpomi, Margaret Emalereta, and Matthias Akandu Nnadi. 2017. The Impact of International Financial Reporting Standards (IFRS) Adoption on Foreign Direct Investments (FDI): Evidence from Africa and Implications for Managers of Education. Journal of Accounting and Financial Management 3: 51–65. [Google Scholar]
- Al-Akra, Mahmoud, Muhammad Jahangir Ali, and Omar Marashdeh. 2009. Development of accounting regulation in Jordan. The International Journal of Accounting 44: 163–86. [Google Scholar] [CrossRef]
- Alsuhaibani, Azzam. 2012. The expected impact of IFRS adoption on Saudi Arabia based on lessons from other countries: A focus on the telecommunication business. Procedia-Social and Behavioral Sciences 62: 1190–98. [Google Scholar] [CrossRef] [Green Version]
- Amiram, Dan. 2012. Financial information globalisation and foreign investment decisions. Journal of International Accounting Research 11: 57–81. [Google Scholar] [CrossRef]
- Asiedu, Elizabeth. 2006. Foreign direct investment in Africa: The role of natural resources, market size, government policy, institutions and political instability. World Economy 29: 63–77. [Google Scholar] [CrossRef] [Green Version]
- Ball, Ray. 2016. IFRS–10 years later. Accounting and Business Research 46: 545–71. [Google Scholar] [CrossRef] [Green Version]
- Bannaga, Alamedin, Yagoub Gangi, Rafid Abdrazak, and Bashar Al-Fakhry. 2013. The effects of good governance on foreign direct investment inflows in Arab countries. Applied Financial Economics 23: 1239–47. [Google Scholar] [CrossRef]
- Bassemir, Moritz, and Zoltán Novotny-Farkas. 2018. IFRS adoption, reporting incentives and financial reporting quality in private firms. Journal of Business Finance & Accounting 45: 759–96. [Google Scholar] [CrossRef]
- Bayoumi, Tammi, Lto Bartolini, and Symansky Klein. 1996. IV foreign direct investment and the exchange rate. In Exchange Rate Movements and Their Impact on Trade and Investment in the APEC Region. Washington DC: IMF, p. 145. [Google Scholar]
- Beamish, Paul W., and Nathanie C. Lupton. 2016. Cooperative strategies in international business and management: Reflections on the past 50 years and future directions. Journal of World Business 51: 163–75. [Google Scholar] [CrossRef]
- Beneish, Messod D., Brian P. Miller, and Teri Lombardi Yohn. 2015. Macroeconomic evidence on the impact of mandatory IFRS adoption on equity and debt markets. Journal of Accounting and Public Policy 34: 1–27. [Google Scholar] [CrossRef]
- Bevan, Alan A., and Saul Estrin. 2004. The determinants of foreign direct investment into European transition economies. Journal of Comparative Economics 32: 775–87. [Google Scholar] [CrossRef]
- Blonigen, Bruce A., and Jeremy Piger. 2014. Determinants of foreign direct investment. Canadian Journal of Economics/Revue Canadienne D’économique 47: 775–812. [Google Scholar] [CrossRef] [Green Version]
- Bruton, Garry D., and Chung Ming Lau. 2008. Asian management research: Status today and future outlook. Journal of Management Studies 45: 636–59. [Google Scholar] [CrossRef]
- Busse, Matthias, and Carsten Hefeker. 2007. Political risk, institutions and foreign direct investment. European Journal of Political Economy 23: 397–415. [Google Scholar] [CrossRef] [Green Version]
- Chen, Charles J., Yuan Ding, and Bin Xu. 2014. Convergence of accounting standards and foreign direct investment. The International Journal of Accounting 49: 53–86. [Google Scholar] [CrossRef]
- Cieślik, Andrzej. 2005a. European integration, national border effects and the location of multinational enterprises in Poland: The case of new voivodships. Brussels Economic Review 48: 247–60. [Google Scholar]
- Cieślik, Andrzej. 2005b. Location of foreign firms and national border effects: The case of Poland. Tijdschrift voor Economische en Sociale Geografie 96: 287–97. [Google Scholar] [CrossRef]
- Cieślik, Andrzej. 2005c. Regional characteristics and the location of foreign firms within Poland. Applied Economics 37: 863–74. [Google Scholar] [CrossRef]
- Cieślik, Andrzej, and Łukasz Goczek. 2018. Control of corruption, international investment, and economic growth. Evidence from panel data’. World Development 103: 323–55. [Google Scholar] [CrossRef]
- Daske, Holger, Luzi Hail, Christian Leuz, and Rodrigo Verdi. 2008. Mandatory IFRS reporting around the world: Early evidence on the economic consequences. Journal of Accounting Research 46: 1085–142. [Google Scholar]
- De Mello, Luiz R., Jr. 1997. Foreign direct investment in developing countries and growth: A selective survey. The Journal of Development Studies 34: 1–34. [Google Scholar] [CrossRef]
- Dunning, John H. 1977. Trade, location of economic activity and the MNE: A search for an eclectic approach. In The International Allocation of Economic Activity. London: Palgrave Macmillan, pp. 395–418. [Google Scholar] [CrossRef]
- Dunning, John H. 1980. Toward an eclectic theory of international production: Some empirical tests. Journal of International Business Studies 11: 9–31. [Google Scholar] [CrossRef]
- Dunning, John H. 1998. Location and the multinational enterprise: A neglected factor? Journal of International Business Studies 29: 45–66. [Google Scholar] [CrossRef]
- Efobi, Uchennal, Matthias Nnadi, John Odebiyi, and Ibukum Beecroft. 2014. Do the rules attract the money? Implication of IFRS adoption on foreign direct investment. SSRN. [Google Scholar] [CrossRef]
- Farag, Shawki. 2009. The accounting profession in Egypt: Its origin and development. The International Journal of Accounting 44: 403–15. [Google Scholar] [CrossRef]
- Globerman, Steven, and Daniel Shapiro. 2003. Governance infrastructure and US foreign direct investment. Journal of International Business Studies 34: 19–39. [Google Scholar] [CrossRef]
- Gordon, Lawrence A., Martin P. Loeb, and Wenjie Zhub. 2012. The impact of IFRS adoption on foreign direct investment. Journal of Accounting and Public Policy 31: 374–98. [Google Scholar] [CrossRef]
- Gurshev, Oleg, and Sarhad Hamza. 2021. BITs, Colony Ties, and Offshore Centers. Journal of Economic Integration 36: 203–26. [Google Scholar] [CrossRef]
- Helmy, Heba E. 2013. The impact of corruption on FDI: Is MENA an exception? International Review of Applied Economics 27: 491–514. [Google Scholar] [CrossRef]
- Hoque, Muhammad Nurul, Reza Monem Monem, and Tony van Zijl. 2016. The economic consequences of IFRS adoption: Evidence from New Zealand. Journal of International Accounting, Auditing and Taxation 27: 40–48. [Google Scholar] [CrossRef] [Green Version]
- Horvat, Tatjana, Horvat Bendix, Vito Bobek, and Hazbo Skoko. 2021. Impacts of investments in infrastructure projects on emerging markets’ growth: The case of East African countries. Economic Research-Ekonomska Istraživanja 34: 2135–61. [Google Scholar] [CrossRef]
- Humphrey, Christopher, Anne Loft, and Margaret Woods. 2009. The global audit profession and the international financial architecture: Understanding regulatory relationships at a time of financial crisis. Accounting, Organisations and Society 34: 810–25. [Google Scholar] [CrossRef]
- International Financial Reporting Standard (IFRS). 2021. Who Uses IFRS Standards? Available online: www.ifrs.org (accessed on 10 February 2021).
- International Monetary Fund (IMF). 2018. The Middle East, North Africa, Afghanistan, and Pakistan Regional Economic Outlook (REO), Middle East and Central Asia Department. Washington, DC: World Economic and Financial Surveys, Available online: https://www.imf.org/en/Publications/REO?Middleyear=2018 (accessed on 15 February 2021).
- Irvine, Helen. 2008. The global institutionalization of financial reporting: The case of the United Arab Emirates. Accounting Forum 32: 125–42. [Google Scholar] [CrossRef] [Green Version]
- Jermakowicz, K., and Sylwia Gornik-Tomaszewski. 2006. Implementing IFRS from the perspective of EU publicly traded companies. Journal of International Accounting, Auditing and Taxation 15: 170–96. [Google Scholar] [CrossRef]
- Kandil, Magda. 2009. Determinants of institutional quality and their impact on economic growth in the MENA region. International Journal of Development Issues 8: 134–67. [Google Scholar] [CrossRef]
- Kaufmann, Daniel, Aart Kraay, and Massimo Mastruzzi. 2010. The Worldwide Governance Indicators: Methodological and Analytical Issues. World Bank Policy Research Paper No. 5430. Available online: http://info.worldbank.org/governance/WGI/ (accessed on 1 January 2021).
- Khdir, Sarhad Hamza, and Anna Białek-Jaworska. 2020. IFRS adoption in emerging markets: The case of Iraq. Zeszyty Teoretyczne Rachunkowości 106: 177–90. [Google Scholar] [CrossRef]
- Khlif, Hichem, Khlif Ahmed, and Manzurul Alam. 2020. Accounting Regulations and IFRS Adoption in Francophone North African Countries: The Experience of Algeria, Morocco, and Tunisia. The International Journal of Accounting 55: 2050004. [Google Scholar] [CrossRef]
- Khoury, Theodore A., and Mike W. Peng. 2011. Does institutional reform of intellectual property rights lead to more inbound FDI? Evidence from Latin America and the Caribbean. Journal of World Business 46: 337–45. [Google Scholar] [CrossRef] [Green Version]
- Kwarbai, Jayeoba, Ajibade T. Olajumoke, I. M. Olayinka, and G. O. Kwarbai. 2016. Accounting standards and foreign direct investment inflows in selected African Countries (1980–2015). International Journal of Advanced Academic Research, Social & Management Sciences 20: 17–28. [Google Scholar]
- Law, Siong Hook, and Muzafar Shah Habibullah. 2009. The determinants of financial development: Institutions, openness and financial liberalisation. South African Journal of Economics 77: 45–58. [Google Scholar] [CrossRef]
- Loree, David W., and Stephen E. Guisinger. 1995. Policy and non-policy determinants of US equity foreign direct investment. Journal of International Business Studies 26: 281–99. [Google Scholar] [CrossRef]
- Lungu, Camelia Iuliana, Chirața Caraiani, and Cornelia Dascălu. 2017. The impact of IFRS adoption on foreign direct investments: Insights for emerging countries. Accounting in Europe 14: 331–57. [Google Scholar] [CrossRef]
- Lupton, Nathaniel C., Donya Behnam, and Alfredo Jiménez. 2021. Taking advantage of institutional weakness? Political Stability and foreign subsidiary survival in primary industries. Multinational Business Review 29: 501–21. [Google Scholar] [CrossRef]
- Mameche, Youcef, and Arar Masood. 2021. Macroeconomic evidence on the impact of mandatory IFRS adoption on FDI in the Gulf Cooperation Council (GCC) countries. Journal of Accounting in Emerging Economies 4: 610–31. [Google Scholar] [CrossRef]
- Márquez-Ramos, Laura. 2008. The effect of IFRS adoption on Trade and foreign direct investments. In International Trade and Finance Association Conference Papers. Berkeley: Bepress, p. 19. [Google Scholar]
- Mina, Wasseem Michel. 2012. The institutional reforms debate and FDI flows to the MENA region: The “best” ensemble. World Development 40: 1798–809. [Google Scholar] [CrossRef]
- Nguyen, Anh T., Alfred A. Haug, P. Dorian Owen, and Murat Genç. 2020. What drives bilateral foreign direct investment among Asian economies? Economic Modelling 93: 125–41. [Google Scholar] [CrossRef]
- Nnadi, Matthias, and Teerooven Soobaroyen. 2015. International financial reporting standards and foreign direct investment: The case of Africa. Advances in Accounting 31: 228–38. [Google Scholar] [CrossRef]
- O’brien, Robert M. 2007. A caution regarding rules of thumb for variance inflation factors. Quality & Quantity 41: 673–90. [Google Scholar] [CrossRef]
- Owusu, Godfred Matthew, Nur Ashijin Mohd Saat, Susela Devi K. Suppiah, and Hook Law Siong. 2017. IFRS adoption, institutional quality and foreign direct investment inflows: A dynamic panel analysis. Asian Journal of Business and Accounting 10: 43–75. [Google Scholar]
- Ozkan, Serdar, Chadi Yaacoub, Nasser El-Kanj, and Vladimir Dzenopoljac. 2019. The Effect of IFRS Adoption on Corporate Cash Holdings: Evidence from MENA Countries. Emerging Markets Finance and Trade 57: 3275–300. [Google Scholar] [CrossRef]
- Rammal, Hussain Gulzar, and Ralf Zurbruegg. 2006. The impact of regulatory quality on intra-foreign direct investment flows in the ASEAN markets. International Business Review 15: 401–14. [Google Scholar] [CrossRef]
- Razin, Assaf, and Efrim Sadka. 2003. Gains from FDI inflows with incomplete information. Economics Letters 78: 71–77. [Google Scholar] [CrossRef] [Green Version]
- Sauvant, Karl P. 2021. Improving the distribution of FDI benefits: The need for policy-oriented research, advice, and advocacy. Journal of International Business Policy 4: 244–61. [Google Scholar] [CrossRef]
- Schneider, Friedrich, and Bruno Schneider Frey. 1985. Economic and political determinants of foreign direct investment. World Development 13: 161–75. [Google Scholar] [CrossRef]
- Sherman, T., and M. De Klerk. 2015. International financial reporting standards and foreign ownership in South African companies. Southern African Business Review 19: 72–88. [Google Scholar] [CrossRef] [Green Version]
- Silva, J. M. C. Santos, and Silvana Tenreyro. 2006. The log of gravity. The Review of Economist and Statistics 88: 641–58. [Google Scholar] [CrossRef] [Green Version]
- Silva, J. Santos, and Silvana Tenreyro. 2011. Further simulation evidence on the performance of the Poisson pseudo-maximum likelihood estimator. Economics Letters 112: 220–22. [Google Scholar] [CrossRef] [Green Version]
- Siriopoulos, Costas, Athanasios Tsagkanos, Argyro Svingou, and Evangelos Daskalopoulos. 2021. Foreign Direct Investment in GCC Countries: The Essential Influence of Governance and the Adoption of IFRS. Journal of Risk and Financial Management 14: 264. [Google Scholar] [CrossRef]
- Song, Xiaoxiao, and Madeline Trimble. 2020. The Historical and Current Status of Global IFRS Adoption: Obstacles and Opportunities for Researchers. The International Journal of Accounting, 2250001. [Google Scholar] [CrossRef]
- Tawiah, Vincent. 2019. The state of IFRS in Africa. Journal of Financial Reporting and Accounting 17: 635–49. [Google Scholar] [CrossRef]
- World Bank. 2018. MENA Economic Monitor. Economic Transformation. Washington, DC: World Bank Group, April, Available online: https://www.worldbank.org/en/region/mena/publication/mena-economic-monitor-april-2018-economic-transformation (accessed on 15 March 2021).
- World Bank. 2020. World Development Indicators. Available online: https://databank.worldbank.org/source/world-development-indicators (accessed on 10 February 2021).
- Yang, Haizhen, Yang Xiong, and Yuan Ze. 2013. A comparative study of determinants of international capital flows to Asian and Latin American emerging countries. Procedia Computer Science 17: 1258–65. [Google Scholar] [CrossRef] [Green Version]
- Yousefinejad, Maryam, Azlina Ahmad, Fairuz Md. Salleh, and Ruzita Abdula Rahim. 2018. The causal relationship between International Financial Reporting Standard (IFRS) and foreign direct investment (FDI): A panel data analysis of ASEAN countries. Asian Journal of Accounting and Governance 10: 61–72. [Google Scholar] [CrossRef]
- Zahra, Shaker A. 2011. Doing research in the (new) Middle East: Sailing with the wind. Academy of Management Perspectives 25: 6–21. [Google Scholar] [CrossRef]
| Variable | Obs | Mean | Std. Dev. | Min | Max |
|---|---|---|---|---|---|
| FDI inflow | 528 | 20.592 | 1.879 | 12.899 | 24.387 |
| IFRS | 528 | 0.818 | 0.386 | 0 | 1 |
| GDPCAP | 528 | 8.148 | 2.327 | 0 | 11.351 |
| GDPG | 528 | 1.121 | 0.901 | −2.13 | 4.813 |
| Infrastructure | 528 | 3.097 | 2.237 | −4.916 | 5.36 |
| Exchange Rate | 528 | 2.335 | 2.926 | −1.314 | 10.645 |
| WTO | 528 | 0.593 | 0.492 | 0 | 1 |
| VOICE | 528 | −0.908 | 0.797 | −2.5 | 1.78 |
| POLSTAB | 528 | −0.571 | 1.118 | −2.5 | 2.39 |
| GOVT | 528 | −0.267 | 0.906 | −2.5 | 1.66 |
| CORRUPT | 528 | −0.298 | 0.838 | −2.45 | 1.95 |
| Explanatory Variable | (1) | (2) | (3) | (4) |
|---|---|---|---|---|
| IFRS | 0.487 * | 0.600 ** | 0.452 * | 0.541 ** |
| (0.206) | (0.199) | (0.202) | (0.207) | |
| GDPCAP | 0.0387 | 0.0630 | −0.0650 | 0.0122 |
| (0.054) | (0.054) | (0.057) | (0.058) | |
| GDPG | 0.182 * | 0.153 | 0.212 ** | 0.178 * |
| (0.081) | (0.080) | (0.081) | (0.082) | |
| Infrastructure | 0.478 *** | 0.474 *** | 0.471 *** | 0.481 *** |
| (0.037) | (0.037) | (0.037) | (0.037) | |
| Exchange Rate | 0.0528 | 0.0258 | 0.0651 * | 0.0568 |
| (0.029) | (0.029) | (0.029) | (0.030) | |
| WTO | −0.121 | 0.201 | −0.358 | −0.0853 |
| (0.186) | (0.185) | (0.198) | (0.205) | |
| VOICE | 0.190 | |||
| (0.100) | ||||
| POLSTAB | −0.341 *** | |||
| (0.081) | ||||
| GOVT | 0.461 *** | |||
| (0.123) | ||||
| CORRUPT | 0.0839 | |||
| (0.142) | ||||
| Constant | 18.57 *** | 17.55 *** | 19.21 *** | 18.37 *** |
| (0.458) | (0.431) | (0.489) | (0.513) | |
| N | 450 | 450 | 450 | 450 |
| R2 | 0.383 | 0.402 | 0.397 | 0.378 |
| F-test | 39.18 | 42.41 | 41.56 | 34.44 |
| p-value | 0.00 | 0.00 | 0.00 | 0.00 |
| Explanatory Variable | (1) | (2) | (3) | (4) |
|---|---|---|---|---|
| IFRS | 0.707 *** | 0.713 *** | 0.789 *** | 0.755 *** |
| (0.148) | (0.147) | (0.145) | (0.147) | |
| GDPCAP | 0.154 *** | 0.200 *** | 0.0584 | 0.0848 |
| (0.044) | (0.058) | (0.042) | (0.046) | |
| GDPG | 0.066 | 0.073 | 0.0662 | 0.0506 |
| (0.073) | (0.076) | (0.077) | (0.076) | |
| Infrastructure | 0.409 *** | 0.402 *** | 0.307 * | 0.363 ** |
| (0.113) | (0.105) | (0.125) | (0.120) | |
| Exchange Rate | 0.102 *** | 0.0848 *** | 0.0936 *** | 0.102 *** |
| (0.024) | (0.023) | (0.026) | (0.024) | |
| WTO | 0.554 ** | 0.628 *** | 0.297 | 0.377 |
| (0.173) | (0.156) | (0.228) | (0.227) | |
| VOICE | 0.149 | |||
| (0.118) | ||||
| POLSTAB | −0.112 | |||
| (0.077) | ||||
| GOVT | 0.424 ** | |||
| (0.155) | ||||
| CORRUPT | 0.311 | |||
| (0.168) | ||||
| Constant | 17.22 *** | 16.43 *** | 18.68 *** | 18.07 *** |
| (0.693) | (0.602) | (0.953) | (0.940) | |
| N | 528 | 528 | 528 | 528 |
| R2 | 0.33 | 0.32 | 0.33 | 0.32 |
| Explanatory Variable | (1) | (2) | (3) | (4) |
|---|---|---|---|---|
| IFRS | 0.729 *** | 0.723 *** | 0.823 *** | 0.780 *** |
| (0.151) | (0.145) | (0.145) | (0.148) | |
| GDPCAP | 0.190 *** | 0.243 *** | 0.0682 | 0.102 |
| (0.048) | (0.064) | (0.052) | (0.055) | |
| GDPG | −0.0429 | −0.0398 | −0.0508 | −0.0672 |
| (0.085) | (0.094) | (0.091) | (0.090) | |
| Infrastructure | 0.302 ** | 0.290 ** | 0.234 * | 0.278 ** |
| (0.096) | (0.089) | (0.100) | (0.096) | |
| Exchange Rate | 0.0957 *** | 0.0784 *** | 0.0880 *** | 0.0962 *** |
| (0.023) | (0.022) | (0.024) | (0.023) | |
| WTO | 0.550 ** | 0.625 *** | 0.294 | 0.359 |
| (0.177) | (0.160) | (0.228) | (0.231) | |
| VOICE | 0.136 | |||
| (0.119) | ||||
| POLSTAB | −0.121 | |||
| (0.082) | ||||
| GOVT | 0.437 ** | |||
| (0.160) | ||||
| CORRUPT | 0.33 | |||
| (0.174) | ||||
| Constant | 17.28 *** | 16.73 *** | 18.37 *** | 17.83 *** |
| (0.551) | (0.653) | (0.638) | (0.670) | |
| N | 528 | 528 | 528 | 528 |
| R2 | 33 | 32 | 33 | 32 |
| Explanatory Variable | (1) | (2) | (3) | (4) |
|---|---|---|---|---|
| IFRS | 0.969 *** | 1.142 *** | 1.107 *** | 1.029 *** |
| (0.168) | (0.154) | (0.161) | (0.157) | |
| GDPCAP | 0.205 * | 0.215 ** | 0.0102 | 0.02 |
| (0.094) | (0.073) | (0.080) | (0.082) | |
| GDPG | 0.0822 | 0.0688 | 0.0649 | 0.0948 |
| (0.080) | (0.081) | (0.085) | (0.080) | |
| Infrastructure | 0.0767 | 0.0644 | 0.0525 | 0.0378 |
| (0.068) | (0.071) | (0.068) | (0.066) | |
| Exchange Rate | −0.137 ** | −0.303 *** | −0.143 ** | −0.153 *** |
| (0.047) | (0.062) | (0.051) | (0.045) | |
| WTO | 0.775 *** | 1.160 *** | 0.409 * | 0.458 * |
| (0.186) | (0.193) | (0.207) | (0.186) | |
| VOICE | 0.142 | |||
| (0.105) | ||||
| POLSTAB | −0.263 *** | |||
| (0.068) | ||||
| GOVT | 0.494 *** | |||
| (0.141) | ||||
| CORRUPT | 0.561 *** | |||
| (0.146) | ||||
| Constant | 16.88 *** | 15.90 *** | 20.56 *** | 20.41 *** |
| (0.931) | (0.651) | (0.868) | (0.873) | |
| N | 263 | 263 | 263 | 263 |
| R2 | 67 | 68 | 67 | 68 |
Publisher’s Note: MDPI stays neutral with regard to jurisdictional claims in published maps and institutional affiliations. |
© 2022 by the authors. Licensee MDPI, Basel, Switzerland. This article is an open access article distributed under the terms and conditions of the Creative Commons Attribution (CC BY) license (https://creativecommons.org/licenses/by/4.0/).
Share and Cite
Cieślik, A.; Hamza, S. Inward FDI, IFRS Adoption and Institutional Quality: Insights from the MENA Countries. Int. J. Financial Stud. 2022, 10, 47. https://doi.org/10.3390/ijfs10030047
Cieślik A, Hamza S. Inward FDI, IFRS Adoption and Institutional Quality: Insights from the MENA Countries. International Journal of Financial Studies. 2022; 10(3):47. https://doi.org/10.3390/ijfs10030047
Chicago/Turabian StyleCieślik, Andrzej, and Sarhad Hamza. 2022. "Inward FDI, IFRS Adoption and Institutional Quality: Insights from the MENA Countries" International Journal of Financial Studies 10, no. 3: 47. https://doi.org/10.3390/ijfs10030047