Relationship between Stock Returns and Trading Volume at the Bourse Régionale des Valeurs Mobilières, West Africa


Abstract
:1. Introduction
2. Literature Review
3. Data and Methodology
3.1. Data and Preliminary Tests
3.2. Methodology
- Contemporaneous GMM specification
- Contemporaneous GARCH (1,1) specification
- Dynamic specification
4. Results and Discussion
4.1. Descriptive Statistics
4.2. Contemporaneous Results Using the GMM Specification
4.3. Contemporaneous Results Using the GARCH (1,1) Specifications
4.4. Dynamic Results Using the Vector Auto Regression (VAR) Specification
4.5. Results Discussion
5. Conclusions
Author Contributions
Funding
Informed Consent Statement
Data Availability Statement
Conflicts of Interest
Appendix A


| 1 | BRVM is a regional stock exchange serving the following West African Economic and Monetary Unit (WAEMU) countries: Benin, Bissau Guinea, Burkina Faso, Ivory Coast, Mali, Niger, Senegal and Togo. It was created on 18 December 1996 in accordance with a decision of the WAEMU Council of Ministers taken in December 1993. It is based in Abidjan (Ivory Coast) and has national stock exchange branches in each of the member countries. The effective start of its activities took place in September 1998. BRVM was created as the result of a long process of institutional, technical, political and economic integration of WAEMU countries. It was set up in several stages (https://www.brvm.org/fr/historique): accessed on 7 November 2022.
BRVM ranks sixth among African stock exchanges behind South Africa, Nigeria, Morocco, Egypt and Kenya. It represents 10% of the gross domestic product of the WAEMU. The market capitalisation of the equity market has risen from XOF 1108 billion in 1998 to XOF 4740.6 billion on 31 December 2019, an increase of 327% since the start of the Exchange’s activities. In twenty three (23) years of operation, the BRVM has traded 889 million securities with a total value of more than XOF 2285 billion. |
| 2 | As noted by Ngene and Mungai (2022), “The continuous and time-honored rationale for the empirical research on the stock return-volume and volume-volatility causal dynamics has been driven by the yearning to test the validity of two Wall Street adages: (i) It takes volume to make prices move. This adage implies that volume causes return and that there is a positive relationship between volume and absolute (magnitude) measure of returns or volatility. (ii) Volume is relatively in bear markets. This adage implies that returns cause volume and that there is a positive co-movement between volume and return.”. Furthermore, “The rate of profit is one of the most important indicators for the stakeholders and shareholders of the companies in the modern economy” (Dospinescu and Dospinescu 2019). Additionally, understanding the dynamics behind stock returns and trading volume is also very important for them. |
| 3 | The correlation between lagged stock returns and current trading volume can be derived from behavioral finance models. Investors’ transactions on financial markets (and consequently trading volume) are not always driven by rational expectations. Behavioural attitude such as overconfidence may intervene (Odean 1998, 1999; Gervais and Odean 2001; Hirshleifer and Luo 2001; Baker and Nofsinger 2002; Statman et al. 2006; Glaser and Weber 2009). The work of Kahneman and Tversky (1979) considers that the psychology of the investor is one of the factors to be taken into consideration in order to understand how investment decisions are influenced in a risky environment such as the stock market. |
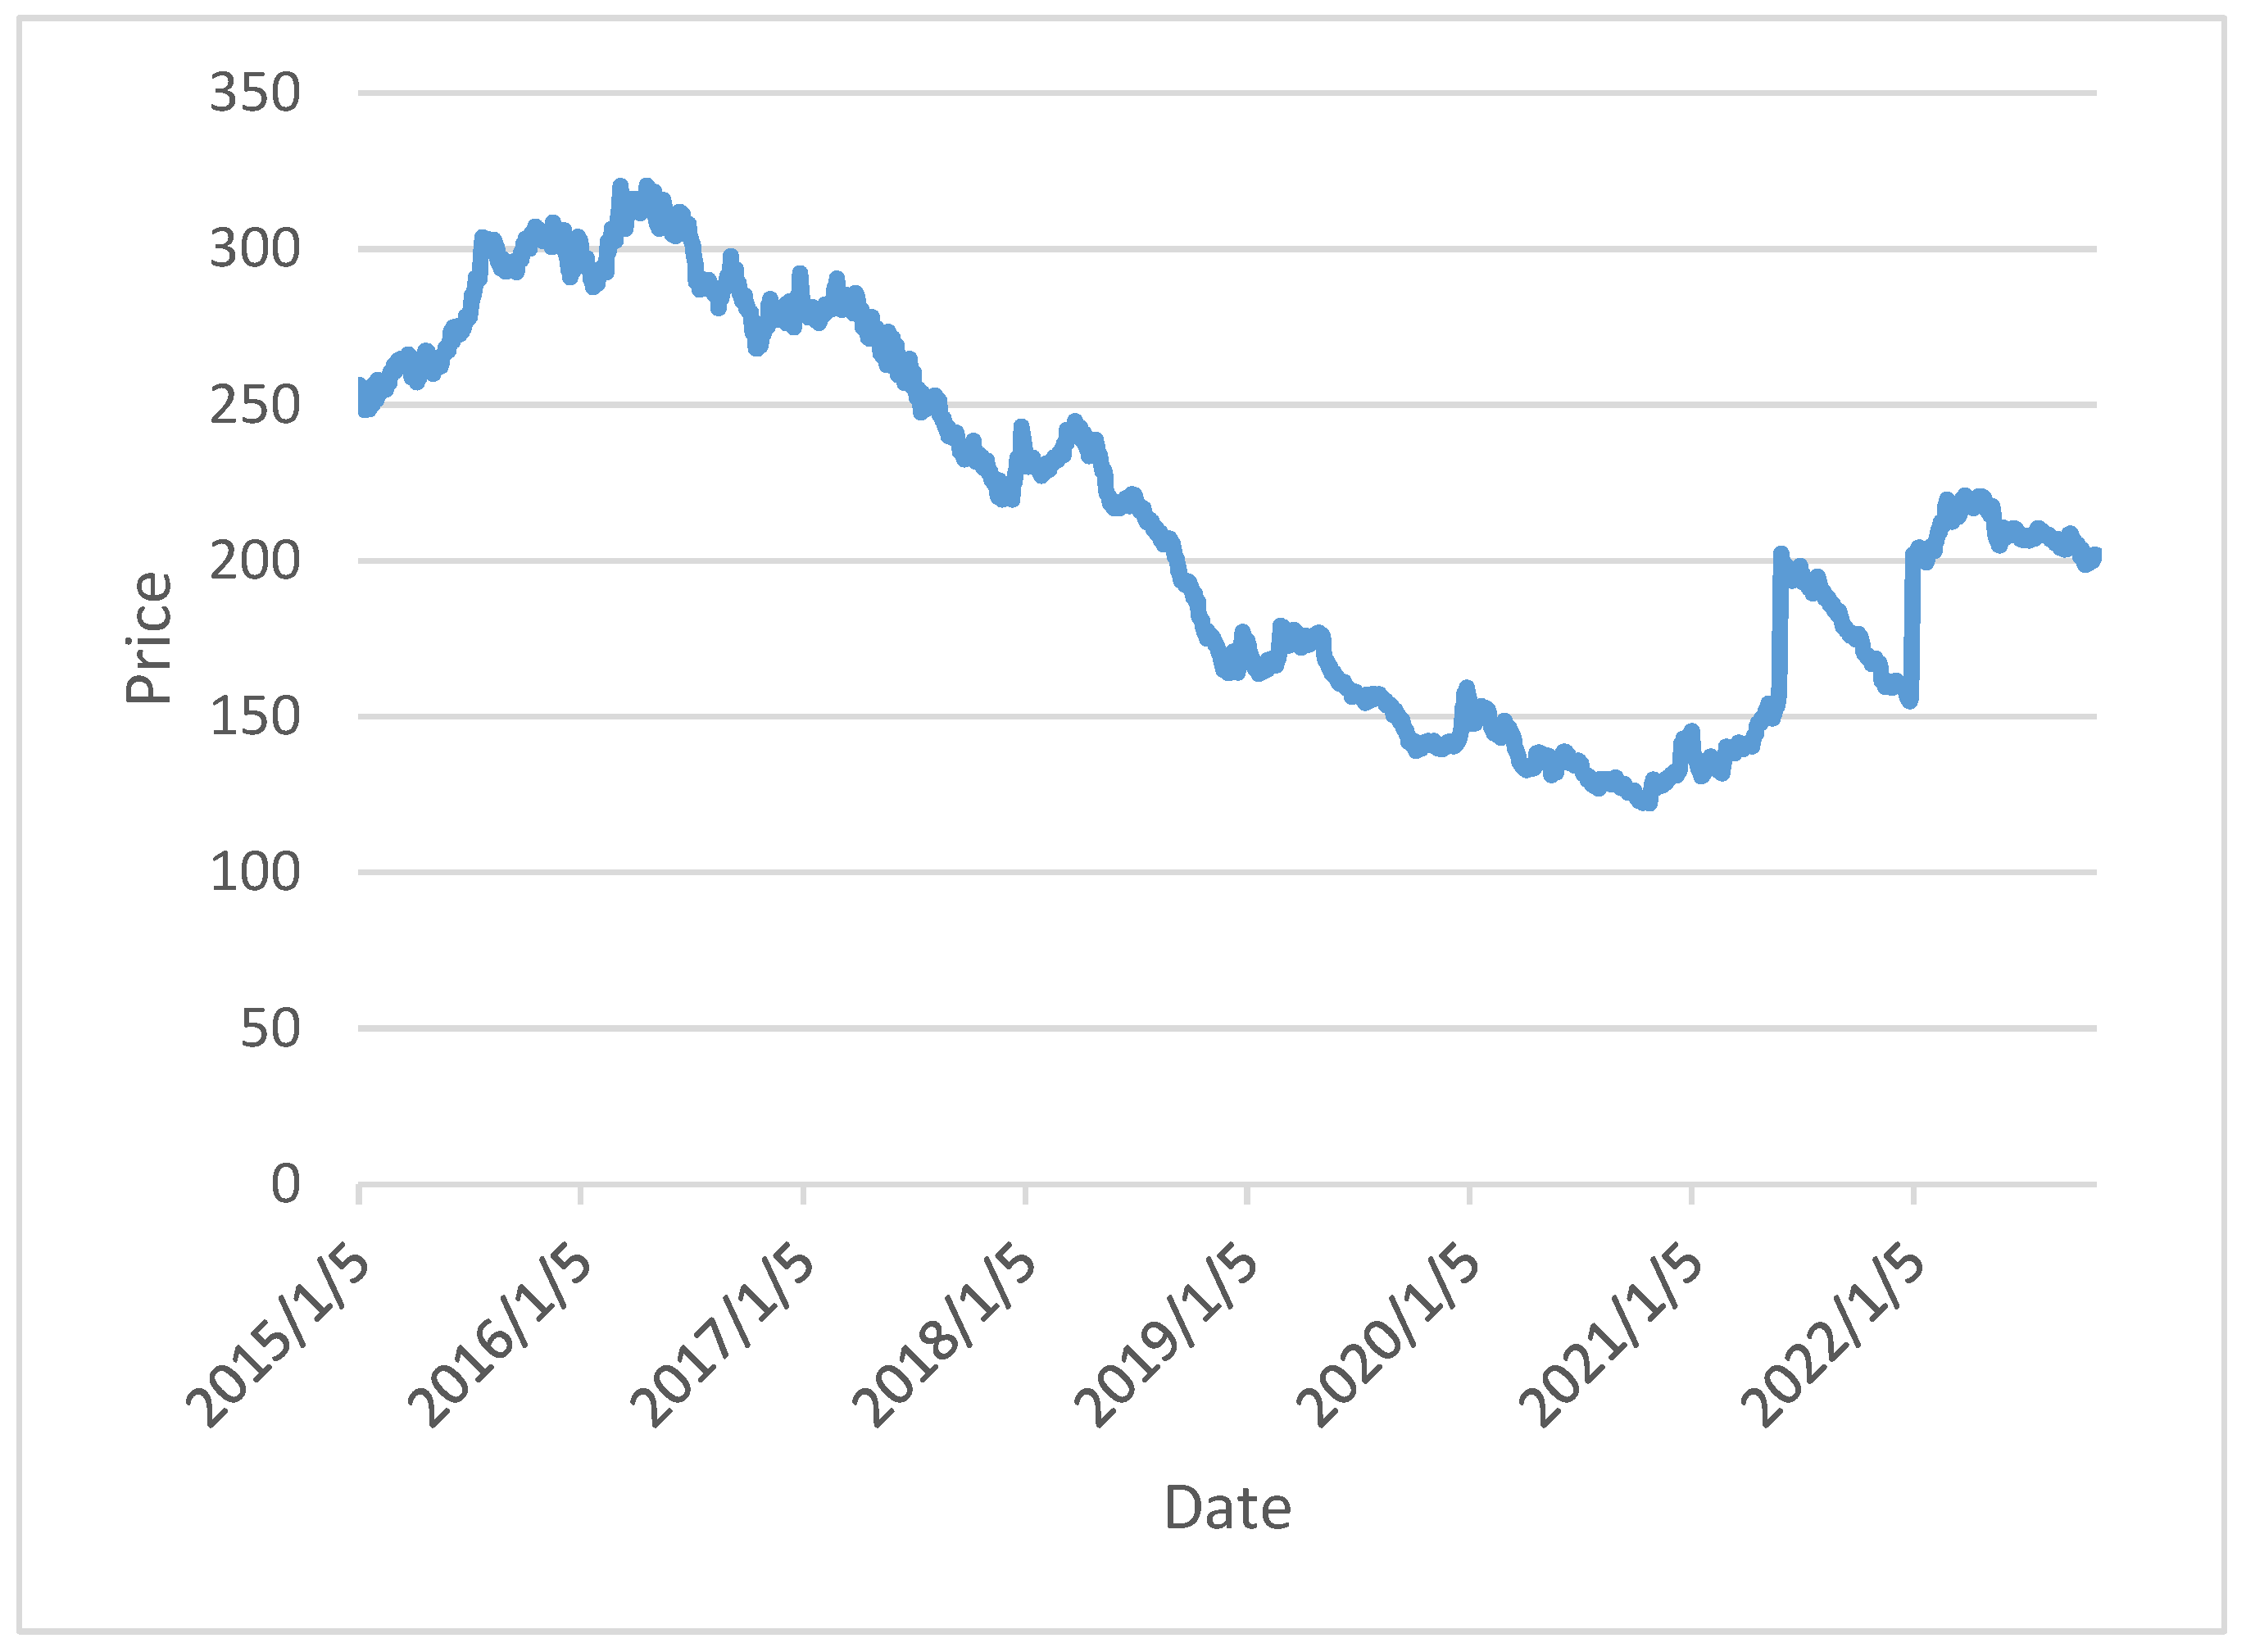
| 4 | At the BRVM, two main indices represent the activity of the equity securities market: the BRVM Composite and the BRVM 10. The BRVM Composite is a market capitalization-weighted index that tracks the daily total return performance of all companies listed on the BRVM. It is adjusted each time a new company is listed (but also in the event of a capital increase or reduction), so as to be adapted to changes in the Regional Financial Market. It is therefore very sensitive to the capitalization of large stocks. The BRVM 10 is made up of the ten most active companies (or more simply, the ten most liquid companies) on the market. These are listed companies whose shares have been bought or sold the most. The list is updated four times per year. BRVM indices quotes are automatically generated by the BRVM trading system and are disseminated after each trading session. |
| 5 | For the contemporaneous regression estimation, GMM and GARCH models are preferred over the simple OLS model, because they are more suitable to deal with heteroscedasticity, endogeneity and simultaneity biases. They produce heteroscedasticity-consistent estimates (Lee and Rui 2002). |
| 6 | We thank an anonymous referee for suggesting this addition. |
References
- Abdullahi, Saada Abba, Reza Kouhy, and Zahid Muhammad. 2014. Trading volume and return relationship in the crude oil futures markets. Studies in Economics and Finance 31: 426–38. [Google Scholar] [CrossRef]
- Abukari, Kobana, and Tov Assogbavi. 2019. Dynamics of the price-volume relationship in an African context: The case of South Africa. African Journal of Accounting, Auditing and Finance 6: 345–64. [Google Scholar] [CrossRef]
- Akpansung, Aniekan Okon, and Matthew O. Gidigbi. 2015. The relationship between trading volumes and returns in the Nigerian stock market. International Research Journal of Finance and Economics 132: 150–63. [Google Scholar]
- Ali, Hadizatou, Jean-Pierre Gueyie, and Cedric Okou. 2020. Assessing the impact of information and communication technologies on the performance of microfinance institutions in Niger. Journal of Small Business & Entrepreneurship 33: 71–91. [Google Scholar]
- Baker, Kent H., and John R. Nofsinger. 2002. Psychological biases of investors. Financial Services Review 11: 97–116. [Google Scholar]
- Blume, Lawrence, David Easley, and Maureen O’Hara. 1994. Market statistics and technical analysis: The role of volume. The Journal of Finance 49: 153–81. [Google Scholar] [CrossRef]
- Campbell, John Y., Sanford J. Grossman, and Jian Wang. 1993. Trading volume and serial correlation in stock returns. The Quarterly Journal of Economics 108: 905–39. [Google Scholar] [CrossRef] [Green Version]
- Chen, Shyh-Wei. 2008. Untangling the nexus of stock price and trading volume: Evidence from the Chinese stock market. Economic Bulletin 7: 1–16. [Google Scholar]
- Chordia, Tarun, and Bhaskaran Swaminathan. 2000. Trading volume and cross-autocorrelations in stock returns. The Journal of Finance 55: 913–35. [Google Scholar] [CrossRef] [Green Version]
- Clark, Peter K. 1973. A subordinated stochastic process model with finite variance for speculative prices. Econometrica 41: 135–55. [Google Scholar] [CrossRef] [Green Version]
- Cook, Steve, and Duncan Waston. 2017. Revisiting the returns-volume relationship: Time variation, alternative measures and the financial crisis. Physica A 470: 228–35. [Google Scholar] [CrossRef] [Green Version]
- Copeland, Thomas E. 1976. A model of asset trading under the assumption of sequential information arrival. Journal of Finance 31: 1149–68. [Google Scholar] [CrossRef]
- De Long, J. Bradford, Andrei Shleifer, Lawrence H. Summers, and Robert J. Waldmann. 1990. Noise trader in financial markets. Journal of Political Economy 98: 703–38. [Google Scholar] [CrossRef]
- De Medeiros, Otavio Ribeiro, and Bernadus Ferdinancus Nazar Van Doornik. 2006. The Empirical Relationship between Stock Returns, Returns Volatility and Trading Volume in the Brazilian Stock Market. Available online: https//ssrn.com/abstract=897340 (accessed on 7 November 2022).
- Dickey, David A., and Wayne A. Fuller. 1979. Distribution of the estimators for autoregressive time series with a unit root. Journal of the American Statistical Association 74: 427–31. [Google Scholar]
- Dospinescu, Nicoleta, and Octavian Dospinescu. 2019. A profitability regression model in financial communication of Romanian stock exchange’s companies. EcoForum 8: 1–4. Available online: http://www.ecoforumjournal.ro/index.php/eco/article/view/884 (accessed on 27 October 2022).
- Epps, Thomas W., and Mary L. Epps. 1976. The stochastic dependence of security price changes and transaction volumes: Implication for the mixture of distribution hypothesis. Econometrica 44: 305–21. [Google Scholar] [CrossRef]
- Essingone, Hervé Ndoumé, and Mouhamadou Saliou Diallo. 2022. Risk-returns of securities in a developing market: The case of the Bourse Régionale des Valeurs Mobilières. Journal of Financial Risk Management 11: 220–43. [Google Scholar] [CrossRef]
- Gagnon, Louis, and G. Andrew Karolyi. 2009. Information, trading volume, and international stock return co-movements: Evidence from cross listed stock. Journal of Financial and Quantitative Analysis 44: 953–86. [Google Scholar] [CrossRef] [Green Version]
- Gallant, A. Ronald, Peter E. Rossi, and G. Tauchen. 1992. Stock prices and volume. Review of Financial Studies 5: 199–242. [Google Scholar] [CrossRef] [Green Version]
- Gervais, Simon, and Terrance Odean. 2001. Learning to be overconfident. Review of Financial Studies 14: 1–27. [Google Scholar] [CrossRef]
- Glaser, Markus, and Martin Weber. 2009. Which past returns affect trading volume? Journal of Financial Markets 12: 1–31. [Google Scholar] [CrossRef] [Green Version]
- Gueyie, Jean-Pierre, Alaa Guidara, and Van Son Lai. 2019. Bank’s non-traditional activities under regulatory changes: Impact on risk, performance and capital adequacy. Applied Economics 51: 3184–97. [Google Scholar] [CrossRef]
- Habib, N. M. 2011. Trade volume and returns in emerging stock markets. An empirical study: The Egyptian market. International Journal of Humanities and Social Science 1: 302–12. [Google Scholar]
- Harris, Milton, and Arthur Raviv. 1993. Differences of opinion make a horse race. Review of Financial Studies 6: 473–506. [Google Scholar] [CrossRef]
- He, Hua, and Jiang Wang. 1995. Differential information and dynamic behavior of stock price-volume. Review of Financial Studies 8: 919–72. [Google Scholar] [CrossRef] [Green Version]
- Hirshleifer, David A., and Guo Ying Luo. 2001. On the survival of overconfident traders in a competitive securities market. Journal of Financial Markets 4: 73–84. [Google Scholar] [CrossRef] [Green Version]
- Jennings, Robert H., and Christopher B. Barry. 1983. Information dissemination and portfolio choice. Journal of Financial and Quantitative Analysis 18: 1–19. [Google Scholar] [CrossRef]
- Jennings, Robert H., Laura T. Starks, and John C. Fellingham. 1981. An equilibrium model of asset trading with sequential information arrival. Journal of Finance 36: 143–61. [Google Scholar] [CrossRef]
- Kahneman, Daniel, and Amos Tversky. 1979. Prospect theory: An Analysis of decision under risk. Econometrica 47: 263–91. [Google Scholar] [CrossRef] [Green Version]
- Karpoff, Jonathan M. 1987. The relation between price changes and trading volume: A survey. Journal of Financial and Quantitative Analysis 22: 109–26. [Google Scholar] [CrossRef]
- Komain, Jiranyakul. 2016. Dynamic Relationship between Stock Return, Trading Volume, and Volatility in the Stock Exchange of Thailand: Does the US Subprime Crisis Matter? MPRA Paper No 73791. Munich: University Library of Munich. [Google Scholar]
- Lee, Bong-Soo, and Olivier M. Rui. 2002. The dynamic relationship between stock returns and trading volume: Domestic and cross-country evidence. Journal of Banking and Finance 26: 51–78. [Google Scholar] [CrossRef]
- Lin, Hsin-Yi. 2013. Dynamic stock return-volume relation: Evidence from emerging Asian markets. Bulletin of Economic Research 65: 178–93. [Google Scholar] [CrossRef]
- Mahajan, Sharika, and Balwinder Singh. 2008. An empirical analysis of stock price-volume relationship in Indian stock market. Vision-The Journal of Business Perspective 12: 1–13. [Google Scholar] [CrossRef]
- Mahajan, Sharika, and Balwinder Singh. 2009. An empirical investigation of relationship between return, volume and volatility dynamics in Indian stock market. Eurasian Journal of Business and Economics 2: 113–37. [Google Scholar]
- Mougoué, Mbodja, and Raj Aggarwal. 2011. Trading volume and exchange rate volatility: Evidence for the sequential arrival information hypothesis. Journal of Banking and Finance 35: 2690–703. [Google Scholar] [CrossRef]
- Mpofu, Raphael T. 2012. The relationship between trading volume and stock returns in the JSE securities exchange in South Africa. Corporate Ownership & Control 9: 199–207. [Google Scholar]
- Naik, Pramod Kumar, Rangan Gupta, and Puja Padhi. 2018. The relationship between stock market volatility and trading volume: Evidence from South Africa. The Journal of Developing Areas 52: 99–114. [Google Scholar] [CrossRef]
- Ngene, Geoffrey M., and Ann Nduati Mungai. 2022. Stock returns, trading volume, and volatility: The case of African stock markets. International Review of Financial Analysis 82: 102176. [Google Scholar] [CrossRef]
- Nyakurukwa, Kingstone. 2021. Revisiting the dynamic stock return-volume relationship in South Africa: A non-parametric causality in quantiles approach. Macroeconomics and Finance in Emerging Markets Economies 9: 1–16. [Google Scholar] [CrossRef]
- O’Hara, Maureen. 1995. Market Microstructure Theory. Cambridge: Blackwell. [Google Scholar]
- Odean, Terrance. 1998. Volume, volatility, price, and profit when all traders are above average. The Journal of Finance 53: 1887–934. [Google Scholar] [CrossRef]
- Odean, Terrance. 1999. Do investors trade too much? The American Economic Review 89: 1279–97. [Google Scholar] [CrossRef]
- Pathirawasam, Chandrapala. 2015. The relationship between trading volumes and stock returns. Journal of Competitiveness 3: 41–49. [Google Scholar]
- Pečarić, Mario, Tino Kusanović, and Pavle Jakovac. 2021. The determinants of FDI sectoral structure in the Central and East European EU countries. Economies 9: 66. [Google Scholar] [CrossRef]
- Phillips, Peter C. B., and Pierre Perron. 1988. Testing for unit root in time series regression. Biometrica 75: 335–46. [Google Scholar] [CrossRef]
- Pisedtasalasai, Anirut, and Abeyratna Gunasekarage. 2007. Causal and dynamic relationships among stock returns, return volatility and trading volume: Evidence from emerging markets in South-East Asia. Asia-Pacific Finance Markets 14: 277–97. [Google Scholar] [CrossRef]
- Shalen, Catherine T. 1993. Volume, volatility, and the dispersion of beliefs. Review of Financial Studies 6: 405–34. [Google Scholar] [CrossRef]
- Smirlock, Michael, and Laura Starks. 1988. An empirical analysis of the stock price-volume relationship. Journal of Banking and Finance 12: 31–41. [Google Scholar] [CrossRef]
- Statman, Meir, Steven Thorley, and Keith Vorkink. 2006. Investor overconfidence and trading volume. The Review of Financial Studies 19: 1531–65. [Google Scholar] [CrossRef] [Green Version]
- Tapa, Afiruddin, and Maziah Hussin. 2016. The relationship between stock return and trading volume in Malaysian ACE market. International Journal of Economics and Financial Issues 6: 271–78. [Google Scholar]
- Tauchen, George E., and Mark Pitts. 1983. The price variability-volume relationship on speculative markets. Econometrica 51: 485–505. [Google Scholar] [CrossRef] [Green Version]
- Toe, Daouda Lawa Tan, and Salifou Ouedraogo. 2022. Dynamic relationship between trading volume, returns and returns volatility: An empirical investigation on the main African’s stock markets. Journal of Asset Management 23: 429–44. [Google Scholar] [CrossRef]
- Ukpong, Idebekeabasi, Han Kun Tan, and Larissa Yarovaya. 2021. Determinants of industry herding in the US stock market. Finance Research Letters 43: 101953. [Google Scholar] [CrossRef]
- Wang, Jiang. 1994. A model of competitive stock trading volume. Journal of Political Economy 102: 127–68. [Google Scholar] [CrossRef] [Green Version]
- Wang, Zijun, Yan Qian, and Shiwen Wang. 2018. Dynamic trading volume and stock return relation: Does it hold out of sample? International Review of Financial Analysis 58: 195–210. [Google Scholar] [CrossRef]
- Wood, Robert A., Thomas H. McInish, and J. Keith Ord. 1985. An investigation of transactions data for NYSE stocks. The Journal of Finance 40: 723–39. [Google Scholar] [CrossRef]
- Yonis, Manex. 2013. Trading Volume and Stock Return: Empirical Evidence for Asian Tiger Economies. Master’s thesis, UMEA Iniversitet, Umea, Sweden. [Google Scholar]
- Zaidi, Syeda Hina, and Ramona Rupeika-Apoga. 2021. Liquidity synchronization, its determinants and outcomes under economic growth volatility: Evidence from emerging Asian economies. Risks 9: 43. [Google Scholar] [CrossRef]


| Augmented Dickey-Fuller Test | Phillips-Perron Test | |||
|---|---|---|---|---|
| Variables | Level | First Difference 1 | Level | First Difference 2 |
| Price | −1.014 | −16.40 *** (a) | −0.853 | −45.43 *** (a) |
| Volume | −15.18 *** | −10.09 *** (b) | −40.10 *** | −34.20 *** (b) |
| Returns | Trading Volume | LN (Trading Volume) | |
|---|---|---|---|
| Mean | −0.03566% | 661,681 | 12.35282 |
| Standard deviation | 0.73500% | 2,356,822 | 1.22595 |
| Minimum | −4.30915% | 12,166 | 9.40640 |
| Maximum | 3.54633% | 55,000,000 | 17.82284 |
| Skewness | 0.29756 | 12.63 | 0.75030 |
| Kurtosis | 6.346688 | 217.21 | 3.844766 |
| Chi2 (LM test for the ARCH effect) | 76.398 *** | - | 52.588 *** |
| Nb. Observations | 1948 | 1949 | 1949 |
| Returns | Volume | |
|---|---|---|
| Constant | −0.00179 (−0.88) | 24.71416 (0.63) |
| Return | - | 13,743.75 (0.49) |
| Volume | 0.000073 (0.49) | − |
| Return (−1) | −0.0307897 (−0.95) | 423.1663 (0.46) |
| Volume (−1) | 0.000043 (0.33) | −0.59960 (−0.24) |
| Number of observations | 1943 | 1943 |
| Returns | Volume | |
|---|---|---|
| Constant | −0.001744 (−1.12) | 12.27701 *** (41.82) |
| Return | - | 1.457052 (0.42) |
| Volume | 0.0002313 (0.80) | - |
| Variance equation | ||
| Constant | 0.00001 *** (8.08) | 0.110506 *** (2.98) |
| ARCH | 0.155526 *** (8.87) | 0.068647 *** (4.53) |
| GARCH | 0.673301 *** (20.61) | 0.856082 *** (23.51) |
| Criteria | |||||
|---|---|---|---|---|---|
| FPE | AIC | HQIC | SBIC | ||
| Returns | Lag | ||||
| 0 | 0.000054 | −6.98447 | −6.98340 | −6.98158 * | |
| 1 | 0.000054 | −6.98433 | −6.98221 | −6.97857 | |
| 2 | 0.000054 | −6.98638 | −6.98320 | −6.97773 | |
| 3 | 0.000054 | −6.98583 | −6.98159 | −6.97430 | |
| 4 | 0.000054 | −6.98655 | −6.98125 | −6.97214 | |
| 5 | 0.000054 * | −6.99078 * | −6.98442 * | −6.97349 | |
| Volume | |||||
| 0 | 1.50100 | 3.24401 | 3.24507 | 3.24688 | |
| 1 | 1.35873 | 3.14443 | 3.14654 | 3.15016 | |
| 2 | 1.30851 | 3.10677 | 3.10677 | 3.11537 | |
| 3 | 1.26888 | 3.07601 | 3.07601 | 3.08748 | |
| 4 | 1.24432 | 3.05646 | 3.05646 | 3.0708 | |
| 5 | 1.23725 * | 3.05076 * | 3.05709 * | 3.06797 * | |
| Returns | Volume | |
|---|---|---|
| Constant | −0.00218 (−0.84) | 4.620716 *** (11.86) |
| Return (−1) | −0.03354 (−1.48) | 6.97551 ** (2.04) |
| Return (−2) | 0.05271 ** (2.32) | 2.56761 (0.75) |
| Return (−3) | 0.01972 (0.87) | −0.18029 (−0.05) |
| Return (−4) | 0.04248 * (1.87) | 2.90875 (0.85) |
| Return (−5) | 0.07139 *** (3.14) | 7.88102 ** (2.30) |
| Volume (−1) | −0.000043 (−0.29) | 0.17873 *** (7.88) |
| Volume (−2) | −0.000051 (−0.33) | 0.11476 *** (5.03) |
| Volume (−3) | 0.000254 * (1.68) | 0.13056 *** (5.73) |
| Volume (−4) | 0.000017 (0.11) | 0.12286 *** (5.41) |
| Volume (−5) | −0.000024 (−0.16) | 0.07938 *** (3.53) |
| Number of observations | 1964 | 1964 |
| Excluded | Chi2 | DF | Prob > Chi2 |
|---|---|---|---|
| Panel A: Dependent variable: Stock returns | |||
| Logarithm trading volume | 3.0485 | 5 | 0.693 |
| All | 3.0485 | 5 | 0.693 |
| Panel B: Dependent variable: Logarithm trading volume | |||
| Stock returns | 11.144 | 5 | 0.049 |
| All | 11.144 | 5 | 0.049 |
Publisher’s Note: MDPI stays neutral with regard to jurisdictional claims in published maps and institutional affiliations. |
© 2022 by the authors. Licensee MDPI, Basel, Switzerland. This article is an open access article distributed under the terms and conditions of the Creative Commons Attribution (CC BY) license (https://creativecommons.org/licenses/by/4.0/).
Share and Cite
Gueyie, J.-P.; Diallo, M.S.; Diallo, M.F. Relationship between Stock Returns and Trading Volume at the Bourse Régionale des Valeurs Mobilières, West Africa. Int. J. Financial Stud. 2022, 10, 113. https://doi.org/10.3390/ijfs10040113
Gueyie J-P, Diallo MS, Diallo MF. Relationship between Stock Returns and Trading Volume at the Bourse Régionale des Valeurs Mobilières, West Africa. International Journal of Financial Studies. 2022; 10(4):113. https://doi.org/10.3390/ijfs10040113
Chicago/Turabian StyleGueyie, Jean-Pierre, Mouhamadou Saliou Diallo, and Mamadou Fadel Diallo. 2022. "Relationship between Stock Returns and Trading Volume at the Bourse Régionale des Valeurs Mobilières, West Africa" International Journal of Financial Studies 10, no. 4: 113. https://doi.org/10.3390/ijfs10040113
APA StyleGueyie, J.-P., Diallo, M. S., & Diallo, M. F. (2022). Relationship between Stock Returns and Trading Volume at the Bourse Régionale des Valeurs Mobilières, West Africa. International Journal of Financial Studies, 10(4), 113. https://doi.org/10.3390/ijfs10040113