Abstract
Challenging the perceived immunity of Islamic stocks to the global financial crisis, this research investigates whether there was any coherence and long-run cointegration between Islamic stocks of BRIC countries and S&P 500 options implied volatility smirk (IVS) in BRIC countries during the global financial crisis (GFC). Employing Engle–Granger and Johansen’s cointegration tests along with wavelet coherence analysis, this study reveals significant long-run cointegration and both short-term and long-term wavelet coherence between IVS and Islamic stock returns (ISRs). Since the S&P 500 options IVS is a reliable indicator of GFC in the context of the conventional stock market, the cointegration and coherence between ISRs and IVS indicate the susceptibility of ISRs to market contagion during the GFC. These findings challenge the notion of Islamic stocks as a safe haven during financial crises, showing their susceptibility to market downturns similar to conventional stocks.
1. Introduction
This study focuses on the examination of Islamic stocks in BRIC countries (Brazil, Russia, India, and China) during the GFC of 2007–2009. It investigates whether Islamic stocks, often perceived as a safe haven due to their adherence to Sharia principles, were indeed immune to the GFC. By leveraging ultra-high-frequency IVS data, this research measures the coherence and long-run cointegration between ISRs and the S&P 500 options IVS. Since the S&P 500 options IVS has been utilized successfully to forecast the stock market crash of conventional stocks in the United States during the GFC (Bhuiyan et al. 2023), this research considers the coherence and cointegration between ISRs and S&P 500 options IVS as an indicator representing Islamic stocks being affected by the market contagion during the GFC.
Numerous studies posit a favorable association with Islamic stocks, suggesting that their adherence to Islamic finance under Sharia law makes them a safe haven during financial crises based on their superior performance and the lack of evidence that they were impacted by market contagion after the start of the GFC (Hassan et al. 2020). However, given the intricate interdependencies of the global financial market, it is rational to suspect that Islamic stocks may be susceptible to market contagion during financial crises, so it is imperative to authenticate the claim of Islamic stocks’ immunity to ensure that investors are not misled. Several researchers, including Hassan et al. (2020) and Kenourgios et al. (2016), have explored the significance of BRIC (Brazil, Russia, India, China) countries in relation to Islamic stocks. Hassan et al. (2020) noted that while the relevance of Islamic stocks with developed countries has been extensively studied, there is a limited body of research in the context of emerging countries like BRIC. Given the increasing interest of international investors in emerging markets and the recognized growth potential of BRIC countries, this study seeks to investigate the Islamic stock market within the BRIC nations. The IVS, which encapsulates market expectations concerning future price movements and associated risks (Christoffersen et al. 2009; Bhuiyan et al. 2023), emerges as a valuable instrument in this context. While computing IVS, most prior studies have traditionally employed a conventional approach centered on daily implied volatility (IV) derived from the closing prices of options. However, given the continuous and ultra-high-frequency nature of financial markets, relying on discrete samples of datasets with data extracted at significantly lower frequencies, typically daily or weekly, to forecast volatility has become obsolete (Goodhart and O’Hara 1997). Technological advancements have opened avenues for acquiring superior, faster, and more efficient datasets, enabling the exploration of financial market phenomena at the finest levels of granularity (Cai et al. 2004). These innovations provide reliable intraday data, supporting informed financial investment choices over various asset types (Bank for International Settlements 2020). This study aims to utilize the effectiveness of ultra-high-frequency intraday IVS data in analyzing the resilience of Islamic stocks in BRIC countries.
This study was inspired by the conjecture that the IVS constitutes a repository of valuable insights pertinent to impending stock market downturns, as evidenced by its manifestation in stock returns. In typical market conditions, the magnitude of IVS is not markedly elevated. Conversely, during abnormal market conditions, particularly in financial crises, IVS demonstrates a notable increase. This empirical observation suggests that IVS data encapsulate pertinent information concerning episodes of financial downturn. In this context, Rubinstein’s (1994) research notably documented the substantial presence of the IVS during the 1987 stock market crash, and recent empirical validation by Bhuiyan et al. (2023) substantiates the striking existence of the IVS that began in 2007 and persisted through the GFC up to 2009. Furthermore, Bhuiyan et al. (2023) empirically attested to the predictive efficacy of the IVS in anticipating a US stock market crash as measured by S&P 500 returns. While a wealth of scholarly work delves into the interplay between conventional stock returns and the IVS in the context of financial crises, there is a significant shortage of research on the dynamics between Islamic stock returns (ISRs) and options implied data during these crisis periods. Addressing this gap is imperative for researchers, as it holds the potential to offer insights into the ongoing debate concerning whether Islamic stocks genuinely remain immune to financial crises or are impacted similarly to conventional stocks.
The objective of this research is to identify the existence of coherence and long-run cointegration between Islamic stocks of BRIC countries and the S&P 500 options implied volatility smirk data from the US market covering the GFC period. In this endeavor, this study systematically documented the temporal fluctuations of the IVS throughout the GFC years (2007–2009). As part of this, IVS had to be estimated for options with expiries ranging from one to six months during three distinct daily periods: 9:30 to 10:00 for the opening period, 12:30 to 13:00 for the midday period, and 15:30 to 16:00 for the closing period. ISRs were estimated by collecting Islamic stock index data of four emerging BRIC markets during the GFC. The research methodology was devised to address data mining challenges associated with the computation of IVS using ultra-high-frequency options implied data and the corresponding stock returns. The data mining challenges encountered in this study involved addressing various complexities, including the reduction in noise originating from the bid–ask spread observed in options prices, resolving data synchronization issues associated with aligning timestamps between options data and stock price data, data categorization, managing anomalies, selecting an optimal model, and performing computationally intensive calculations. Subsequently, the study employed Engle and Granger’s (Engle and Granger 1987) cointegration test and Johansen’s cointegration test (Johansen 1988) to investigate the potential long-term cointegration in equilibrium between the IVS and ISR in the BRIC countries during the GFC. Furthermore, the research utilized wavelet coherence to examine the coherence visually between IVS and ISRs of BRIC countries during the GFC. This research considers wavelet coherence complementary to long-run cointegration because while long-run cointegration typically focuses on detecting a stable, equilibrium relationship between two variables over the entire period under consideration, wavelet offers insights into the time-varying relationship between two variables at different time scales and frequency bands. Since financial and economic data often exhibit non-stationary behavior and time-varying dynamics, capturing time-varying dynamics along with the long-run relationship between IVS and ISRs is crucial. Implementing this rigorous, holistic methodology, this research aspires to offer a detailed analysis of the behavior of ISR in relation to S&P 500 options’ IVS during the GFC, thereby substantiating the assertion that Islamic stocks were impacted by market contagion during this GFC period.
This study yielded several significant outcomes. The cointegration test indicated statistically significant long-run cointegration in equilibrium between IVS and ISRs across three intraday trading sessions, i.e., the opening session, the midday session, and the closing session. By employing wavelet coherence, it established the existence of significant short-run and long-run coherence between the IVS and during the GFC period.
The organization of this study is as follows: Section 2 presents the theoretical framework and hypotheses. The data and methodology used in this investigation are described in detail in Section 3. Section 4 provides the empirical analysis, and Section 5 concludes the paper with a discussion of the empirical findings.
2. Theoretical Framework and Hypotheses
In the context of the 1987 market crisis, Rubinstein (1994) focused on S&P 500 out-of-the-money (OTM) puts and at-the-money (ATM) calls. This study estimated the IV of OTM puts (OTMPIV) and ATM calls (ATMCIV). According to the analysis, OTMPIV significantly outpaced ATMCIV, leading to the belief that the IVS indicates negative market sentiment. The disparity was fueled by investors’ preference for put options as a safeguard against potential market crashes, raising the OTM put prices. For equity index options, the aftermath of the 1987 crisis witnessed a paradigm shift that influenced market dynamics on a global scale through a notable asymmetry (skew) in the IV curve. In a related context, Foresi and Wu (2005) observed the existence of the IVS of stock index options across various markets, and subsequent empirical studies further validated the existence of the IVS in diverse markets (Doran et al. 2006; Hoque and Kalev 2015; Pathak et al. 2017; Pathak and Mitra 2017; Hoque et al. 2020). The widespread presence of the IVS suggests the deep interconnectedness of the global financial system, indicating that the IVS contains valuable information not only for its underlying equities but also for other equities across markets. For example, Wang et al. (2020) and Li et al. (2023) employed the VIX index, derived from S&P500 options’ IVS, as a tool to predict stock returns in various countries.
Given the empirical evidence of the ability of S&P500 options’ IVS data to relate stock returns across the markets, it can be inferred that the S&P 500 IVS has information content in relation to the ISR of the BRIC countries during the GFC. This inspired us to investigate the dynamic coherence and long-run cointegration between IVS and ISRs in BRIC countries during the GFC. The fundamental basis for the initial hypotheses in this study is formed by this investigation.
Hypothesis 1 (H1).
S&P 500 options’ IVS and ISR of BRIC countries exhibited significant coherence during the GFC, and there was long-run cointegration in equilibrium between the IVS and ISR.
As previously noted, there was a notable surge in the magnitude of the IVS during the GFC from 2007 to 2009, a phenomenon substantiated by Bhuiyan et al. (2023). Their research confirmed the substantial predictive capacity of the S&P 500 options’ IVS in forecasting stock returns during the GFC, signifying the profound impact of this crisis on the US stock market. Considering these findings, it is reasonable to deduce that the existence of a linkage between S&P500 options’ IVS and Islamic stocks in BRIC countries during the GFC may suggest that the unfolding financial crisis indeed influenced Islamic stocks. Consequently, the verification of the first hypothesis can be regarded as a validation of the second hypothesis provided below.
Hypothesis 2 (H2).
Islamic stocks were not immune to financial crises during the GFC.
3. Methodology and Data
This investigation’s methodology has advanced across distinct phases. Initially, the procedure encompassed a meticulous data mining approach for calculating intraday ultra-high-frequency IVS derived from S&P 500 options data. The specific technique employed for computing this IVS is extensively elaborated upon within this research. Subsequently, the IVS was estimated utilizing the previously computed options IV. Finally, the study employed a wavelet-based coherence analysis to assess coherence visually at different frequencies between the IVS and ISR, accompanied by the application of the Engle–Granger and Johansen cointegration test to scrutinize the cointegration association between IVS and ISR across the BRIC countries. By combining these three analytical tools, this study aims to offer a comprehensive and multi-faceted perspective on the interplay of IVS and ISRs under investigation, capturing both short-term dynamics and long-term equilibrium relationships. A workflow diagram outlining the methodology is presented in Figure 1 below; nevertheless, the sections that follow offer a thorough explanation of each phase in the workflow diagram.
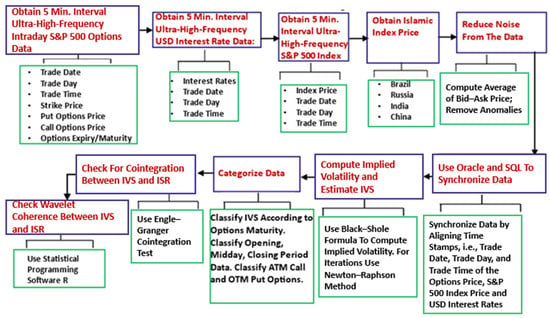
Figure 1.
Workflow Diagram of the Methodological Framework.
3.1. Data Mining
This study employs intraday ultra-high-frequency data for S&P 500 options, S&P 500 index, and USD interest rate. The data for this study were acquired from the Thomson Reuters database. The pertinent time series of S&P 500 options, S&P 500 index price, and USD interest rates were programmatically retrieved using Thomson Reuters Application Programming Interfaces (APIs) and the Reuters Instruments Code (RIC). The time frame for the sample that is being examined is 1 January 2007 through 31 December 2009. MSCI Islamic indices of BRIC countries have been collected from DataStream from 1 January 2007 to 31 December 2009.
3.1.1. Noise Reduction
While ultra-high-frequency data afford a more precise assessment and forecasting capability regarding future volatility, they concurrently introduce microstructure noises originating from phenomena such as the bid–ask spread, asynchronous transactions, infrequent transactions, and price discreteness (McAleer and Medeiros 2008). The principal obstacle involved in the study was the selection of an optimal sampling frequency, as an improper choice could result in microstructure bias. Tailoring the data sampling frequency to the specific underlying asset is essential, given that price discovery information and trade intensity vary throughout asset classes. Andersen et al. (2003) proposed a potential remedy for mitigating microstructure bias by adopting lower frequencies, such as five or fifteen minutes. In this study, a five-minute interval was employed for S&P 500 options and S&P 500 returns, aligning with the approach adopted by several prior research investigations focused on options implied volatility, such as studies of Bollerslev et al. (2011); Nordén and Xu (2011); and Bhuiyan et al. (2023).
This study also addressed a crucial concern about the bid–ask spread in the price data of the index options. All the options data encompassed bid and ask prices, necessitating a decision on whether to utilize the bid price or ask price for IV computation. Given the extensive volume of ultra-high-frequency data employed in this research, even a minor discrepancy in determining the fair value of options prices due to bid–ask spread could propagate throughout the dataset, resulting in significant errors in the estimation of IV. This study adopted the methodology of averaging the bid–ask spread in its empirical analyses, building on the claim made by Ho and Stoll (1981) that the true price usually aligns more precisely relative to the bid or ask price at any given instance and is generally comparable to the midpoint of the bid–ask spread over time. This decision is consistent with the methods used in recent studies including ultra-high-frequency options implied data, such as those conducted by Hoque et al. (2020) and Le et al. (2021).
3.1.2. Data Synchronization
After the completion of noise reduction, the next challenge was to synchronize the huge dataset. As the ultra-high-frequency data employed in this research involved timestamps with 5 min intervals, it was essential to ensure that timestamps across S&P 500 options data, underlying S&P 500 stock prices, and USD interest rates were synchronized. Misalignments or mismatches in timestamps could lead to errors in the analysis, affecting the estimation of IV. The Oracle database management system and SQL were utilized to synchronize the huge dataset.
3.1.3. Data Categorization
Options trading takes place on weekdays from 9:30 a.m. to 4:00 p.m., Eastern Standard Time (US), except for public holidays. The expiration date for options is scheduled for the third Friday of every month. The expiry or maturity of options is typically estimated based on the number of calendar days remaining until the options become exercisable. This study grouped options with expiries from one to six months into six separate categories. Options were categorized as follows: one-month expiry (2–30 days), two-month expiry (31–60 days), three-month expiry (61–90 days), four-month expiry (91–120 days), five-month expiry (121–150 days), and six-month expiry (151–180 days).
The S&P 500 options data and the corresponding S&P 500 index price data were categorized into three distinct trading periods: the opening period spanning from 9:30 a.m. to 10:00 a.m., the midday period spanning from 12:30 p.m. to 1:00 p.m., and the closing period spanning from 3:30 p.m. to 4:00 p.m. To ensure even distribution, each period was given a 30 min slot. Notably, the intervals between the opening and midday periods, as well as between the midday and closing periods, were each two and a half hours long.
This research needed to categorize the options data into two categories for IV estimation. The categories are at-the-money (ATM) calls and out-of-the-money (OTM) puts. This research utilized the criteria outlined by Xing et al. (2010) to distinguish ATM calls and OTM puts. Calls and puts are classified as at-the-money if the strike price to stock price ratio is between 0.995 and 1.005. On the other hand, a put option is deemed out-of-the-money if the strike price to stock price ratio is more than 0.95 but falls below 1.
In order to minimize the effects of bid–ask variations, the price of each option is established by taking the average from the closing bid–ask quotations within every five-minute window (Blair et al. 2001). The risk-free interest rate for options with equivalent maturities in the Black–Scholes (BS) model is the interest rate that applies to a USD deposit with one, two, or three months.
3.2. Computation of Implied Volatility
IV is generally considered as a measure of the likelihood of a change in value for the underlying asset of an option. This concept is frequently utilized within the Black–Scholes model (BSM). The BSM nomenclature and explanations are as follows:
For European call options,
For European put options,
where
the standard normal cumulative distribution function
BSM has the following variables:
The computation of IV entails matching the market value of the options with the theoretically estimated value when observed values include the price of the underlying asset, the strike price, the risk-free interest rate, and the time to maturity. As a result, IV functions as a predictive, forward-looking indicator of volatility in the future.
The utilization of the BSM for pricing European options has attracted significant scholarly interest as indicated by Corredor and Santamaría (2004). The model’s widespread acceptance can be ascribed to various factors, including its computational efficiency and the theoretical approximations that facilitate the connection of stochastic volatility and conditional volatility models to the BSM (Fleming 1998; Nelson 1991). Additionally, findings from Biktimirov and Wang’s (2017) research demonstrate that for predicting volatility in both mature and emerging markets, IV derived from the BSM surpasses model-free IV.
Iterative search techniques can be used to compute IV; two popular approaches in scholarly works are the Newton–Raphson and Dekker–Brent approaches (Press et al. 1992). Using inverse quadratic interpolation, secant, and bisection, the Dekker–Brent method is an ensured convergence technique. While the Newton–Raphson technique is computationally more efficient, the Dekker–Brent technique is considered more robust. Both methods demonstrate impressive performance for a single option, offering highly precise IV approximations in a short computational timeframe (Li 2008). The Newton–Raphson algorithm may encounter issues, such as crashing due to incorrect division by a small integer or iterations falling outside the brackets. However, the volatility function used in this study for option prices is straightforward, allowing for the application of the Newton–Raphson method.
3.3. Estimating Implied Volatility Smirk
The first step of the process was to determine the ATMCIV and OTMPIV by using the prices of ATM calls and OTM puts, the BSM, and the Newton–Raphson method. Following this, Equation (3) was employed to calculate IVS by determining the difference between OTMPIV and ATMCIV:
where the options of 1-month, 2-month, 3-month, 4-month, 5-month, and 6-month expiries and the trading sessions, i.e., opening, midday, and closing periods.
The generated IVS is then categorized according to the options’ expiry and trading window. Six sets of IVS data were monitored at the opening, midday, and closing periods. These sets of data corresponded to options with maturities ranging from one to six months. Therefore, a total of 18 IVS data series were analyzed, with six series for each trading period as shown below.
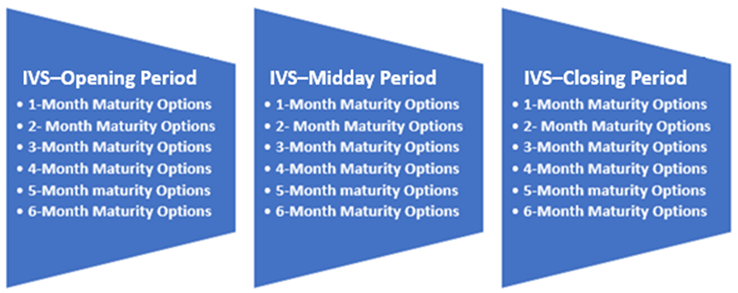
3.4. Cointegration Test
In order to examine the long-term cointegration between the IVS and ISR over the GFC period, this study used the Engle–Granger cointegration test. The Engle–Granger cointegration test was chosen because of its simplicity and suitability for the cointegration check between two variables. Because it is quite intuitive and easy to implement, the Engle–Granger test has been widely used in the financial literature (Lee and Lee 2014). The test is based on the straightforward rationale that if variables exhibit cointegration, then the residual of the cointegrating regression should demonstrate stationarity. First, it was checked whether all the series of IVS and ISRs were stationary at the first difference. Next, the Ordinary Least Square regression equation was estimated from the following regression equation to form the residuals:
The residuals from the cointegrating regression were estimated as follows:
Lastly, the residuals’ stationarity was verified using the ADF unit root test.
To assess the robustness of the cointegrating relationship identified through the Engle–Granger cointegration test, this study additionally employed Johansen’s cointegration test (Johansen 1988). The objective was to determine whether the results obtained from the Engle–Granger test would remain consistent when subjected to Johansen’s cointegration test. If is an n × 1 vector of time series which is integrated of order 1, then the VAR model of in the form of a vector error correction model can be written as
where is the first difference of , is the impact matrix, and is the short-run adjustment matrix. The rank of (denoted as r) determines the number of cointegrating vectors.
The trace test evaluates the null hypothesis that the number of cointegrating vectors is less than or equal to r against the alternative hypothesis that there are more than r cointegrating vectors.
Here, is the eigenvalue of the matrix, and T is the sample size.
The maximum eigenvalue test evaluates the null hypothesis that the number of cointegrating vectors is r against the alternative of r + 1.
3.5. Wavelet Coherence
A statistical tool for evaluating the degree of coherence or relationship between two separate time series in the frequency and time domains is wavelet coherence. The cross-wavelet transform is the foundation of the idea of wavelet coherence. Torrence and Compo (1998) described it as follows for two time series, x(t) and y(t):
In this case, the continuous wavelet transforms of x(t) and y(t) are denoted by Wx (a, b) and Wy (a, b), respectively. The complex conjugate is indicated by the symbol *, and the position index and scale are represented by the variables a and b, respectively. The power of the cross-wavelet transform is indicated by the absolute value, |Wxy (a, b)|. At a given scale, the local covariance between the time series is measured by the cross-wavelet power. By identifying the common range of cross-wavelet power for both time series in the time-frequency plane, the degree and extent of coherence may be deduced. The wavelet-squared coherence is defined as follows by Torrence and Webster (1999):
where S is an operator for smoothing time scales. The range of the squared wavelet coherence coefficient is 0 ≤ R2(a, b) ≤ 1. The zero value of R2(a, b) indicates no correlation. When R2(a, b) is one, the two series have a strong correlation. In this study, the resulting coherence values were represented graphically as a color-coded map, allowing researchers to identify regions of significant association or synchronization between the signals.
The phase difference between the IVS and ISR series represented the lead–lag and in-phase/anti-phase relationship, as shown by the wavelet coherence plots. Between two time series, the phase difference is the oscillation delay. Torrence and Webster (1999) defined the wavelet coherence phase difference as
In the event that there is no phase difference, both time series are heading in parallel. The arrows in the wavelet plot indicate the phase difference. A positive or negative correlation or in-phase/anti-phase relationships are indicated by arrows pointing to the right or left, respectively, for both series. Additionally, an upward (downward) arrow indicates that the first (second) series leads the second (first) series by 90 degrees.
3.6. Data Description
Table 1 provides descriptive statistics regarding IVS values for options that have expiration varying from one to six months.

Table 1.
Descriptive statistics for implied volatility smirk.
A thorough investigation of the statistical characteristics of the data used in this study was conducted before any empirical analysis was carried out. Table 1 displays descriptive statistics related to IVS values for options that have an expiration varying from one to six months. The Jarque–Bera (JB) test, mean, median, skewness, kurtosis, and other statistical measures are displayed in the table (from the second to the seventh column). Three panels make up Table 1: Panel 1 represents the opening period, Panel 2 represents the midday period, and Panel 3 represents the closing period. It is clear from Panels 1, 2, and 3 that there are no appreciable differences between the mean and median IVS values. For all IVS data in Panels 1, 2, and 3, skewness (a measure of the degree of symmetry in the data distribution) is invariably positive. This indicates a rightward skew or positive skewness as opposed to a fully symmetric normal distribution. Furthermore, all options with expiries ranging from one to six months do not exhibit data that follow a normal distribution pattern, as indicated by the kurtosis values for IVS data in Panels A, B, and C exceeding 3. The JB statistics provide additional confirmation that the IVS data for all options with varying maturities deviate from normal distribution features. The unit root test indicates that all the IVS series are stationary at the first difference.
Table 2 displays similar statistics for the returns of Islamic indices (ISR) from Brazil, Russia, India, and China.

Table 2.
Descriptive statistics for ISRs of BRIC.
Table 2 presents analogous statistics for the returns of Islamic indices (ISR) from Brazil, Russia, India, and China. Notably, the mean and median values reported in Table 2 display minimal disparities. However, the skewness of returns varies, with Brazil and Russia exhibiting negative skewness, while India and China show positive skewness. The kurtosis statistics for all four return series surpass 3, signifying a departure from a normal distribution pattern. Additionally, the JB statistics confirm the non-normal distribution of returns across all the BRIC countries. The unit root test indicates that all the ISR series are stationary at the first difference.
4. Empirical Analysis
The empirical study used in this section aims to investigate the relationship between the options IVS and ISRs during the GFC. In this empirical investigation, the analytical framework incorporates the long-run cointegration test and wavelet coherence analysis to investigate H1 and unravel the intricate relationships within IVS and ISRs. While cointegration provides information about the overall equilibrium relationship between IVS and ISRs, providing insights into whether they move together in the same direction over extended periods, wavelet coherence provides a more nuanced understanding of how this relationship evolves across different time scales, making it a valuable complementary tool in this analysis.
4.1. Long Run Cointegration between IVS and ISR
The Engle–Granger cointegration test was performed after confirming the stationarity of all the series in the first difference. First, an OLS regression equation was estimated according to Equation (4), and then residuals were calculated following Equation (5). Finally, the ADF unit root test was performed for the residuals. If the residuals do not have a unit root, IVS and ISRs exhibit cointegration over the long term. The test outcomes are presented in Table 3, Table 4, Table 5 and Table 6, corresponding to Brazil, Russia, India, and China. Column (1) represents the option maturities for which IVS was computed. Column (2) presents the t-statistics of the ADF unit root test for the null hypothesis that the residuals have a unit root. In total, 72 cases were evaluated, encompassing six options maturities across three trading periods.

Table 3.
Engle–Granger cointegration test between IVS and ISR (GFC period) for Brazil.

Table 4.
Engle–Granger test between IVS and ISR (GFC period) for Russia.

Table 5.
Engle–Granger test between IVS and ISR (GFC period) for India.

Table 6.
Engle–Granger test between IVS and ISR (GFC period) for China.
Across all four countries, the Engle–Granger test consistently shows a significant cointegrating relationship for options with maturities from 1 to 6 months and during the opening, midday, and closing trading periods. The unit root t-statistics for residual series are significantly below the critical value of −3.43 at the 1% level, indicating a stable long-term equilibrium between IVS and ISRs despite the market disruptions during the GFC. This robust relationship suggests that implied volatility and stock returns were interconnected and predictable across these emerging markets during the crisis.
Next, Johansen’s cointegration test was employed to test whether the long-run cointegrating relationship between IVS and ISRs observed from the Engle–Granger test still holds true. The tables below (Table 7, Table 8, Table 9 and Table 10) display the results of the test for Brazil, Russia, India, and China, respectively. In each table, column (1) represents the options expiry, column (2) presents the corresponding hypothesis in relation to the number of cointegrating vectors between IVS and ISRs, and column (3) and column (4) present the trace statistic and maximum eigen statistic, respectively.

Table 7.
Johansen’s cointegration test between IVS and ISR (GFC period) for Brazil.

Table 8.
Johansen’s cointegration test between IVS and ISR (GFC period) for Russia.

Table 9.
Johansen’s cointegration test between IVS and ISR (GFC period) for India.

Table 10.
Johansen’s cointegration test between IVS and ISR (GFC period) for China.
Table 7, Table 8, Table 9 and Table 10 indicate that cointegration is confirmed suggesting two cointegrating equations between IVS and ISRs (rejecting both H0: r = 0 and H1: r = 1) for all expiries across the trading periods except for the 6-month expiry options traded at the closing period, where the trace and maximum eigenvalue statistics do not consistently exceed the critical values, suggesting no cointegrating relationship. The discrepancy observed with the 6-month expiry options during the closing period could be attributed to several factors. The closing period might involve unique market dynamics, such as end-of-day trading strategies and liquidity constraints, which can affect the cointegration relationship for longer-dated options differently than for shorter-dated ones. Johansen’s test might be more sensitive to certain data characteristics or structural breaks that are not captured by the Engle–Granger test, particularly in longer-dated options.
Overall, our findings highlight a strong and stable long-term relationship between IVS and ISR across various maturities and trading periods during the GFC, as confirmed by both the Engle–Granger and Johansen cointegration tests. The minor discrepancy observed for the 6-month expiry options during the closing period warrants further investigation but does not undermine the general conclusion of interconnected and predictable relationships between implied volatility and stock returns in the studied emerging markets.
4.2. Coherence between IVS and ISR
Wavelet coherence was used to visually represent the coherence between IVS and ISRs during the GFC. Three separate sets of figures (please refer to Appendix A)—Figure A1, Figure A2, Figure A3, Figure A4, Figure A5, Figure A6, Figure A7, Figure A8, Figure A9, Figure A10, Figure A11, Figure A12, Figure A13, Figure A14, Figure A15, Figure A16, Figure A17 and Figure A18—define the analysis. The plots showing IVS calculations for options traded during the opening, midday, and closing periods correspond to each set. Six figures show the IVS calculated for options with expiry varying between one to six months within each set. The subplots with the labels a, b, c, and d in each picture show the wavelet coherence of IVS over ISRs for China, Brazil, Russia, and India, in that order. In total, 72 cases were investigated.
The degree to which two time series display the same characteristics at a given frequency and moment in time is indicated by wavelet coherence. The corresponding time series behave extremely similarly when the coherence measurement is near to one. Conversely, the corresponding time series are not regarded as coherent when the coherence is near zero. In the wavelet coherence plotted in Figure A1, Figure A2, Figure A3, Figure A4, Figure A5, Figure A6, Figure A7, Figure A8, Figure A9, Figure A10, Figure A11, Figure A12, Figure A13, Figure A14, Figure A15, Figure A16, Figure A17 and Figure A18, the color scale indicates the value of coherence measurement where blue refers to the minimum level of coherence and red refers to the maximum level of coherence. Areas enclosed by the white boundaries, depicted in warmer color tones, indicate regions characterized by substantial interdependence. The horizontal axis (X-axis) in all figures represents the chronological timeline of the GFC period from 2007 to 2009. Conversely, the vertical axis (Y-axis) represents scales, starting at the bottom from 2 days and progressively increasing exponentially with a base of 2 (2, 4, 8, 16, 32, 64…). These scales signify the frequency, which has been transformed into a period (number of days). Moving upward along the Y-axis, from lower to higher scales, indicates a transition from high frequency (short-term fluctuations) to low frequency (long-term fluctuations), signifying that a higher frequency corresponds to lower scale values. For clarity, this study has designated fluctuations lasting 32 days or less as short-term fluctuations while categorizing longer-lasting fluctuations as long-term fluctuations.
Regarding Figure A1a, it is apparent that the IVS for one-month maturity options and ISRs of Brazil demonstrate a notably robust coherence, indicated by the red color zone, in the year 2007, particularly when the fluctuation duration exceeds approximately 32 days. Between 2008 and 2009, three distinct strong coherence zones were observable at 16 days, 32–45 days, and 64 days, respectively. Throughout the entire GFC period, numerous scattered very small red zones indicating substantial coherence are evident at higher frequencies, specifically within the range of fluctuations lasting from 2 to 16 days.
Diverse trends may be observed in the one-month to six-month maturity options observed throughout the opening, midday, and closing periods in all BRIC nations, as illustrated in Figure A1, Figure A2, Figure A3, Figure A4, Figure A5, Figure A6, Figure A7, Figure A8, Figure A9, Figure A10, Figure A11, Figure A12, Figure A13, Figure A14, Figure A15, Figure A16, Figure A17 and Figure A18. The intensity and temporal duration of the coherence between IVS and ISR during the GFC display distinct patterns for these maturity options. This suggests considerable variations in the strength and duration of coherence based on the maturity of options, trading period, and the specific country under consideration. For clarity, this study has designated fluctuations lasting 32 days or less as short-term fluctuations while categorizing longer-lasting fluctuations as long-term fluctuations. This study provides a comprehensive summary, emphasizing discerning the nature of coherence as either short term, long term, or both. The synthesized findings are visually presented through sunburst charts, as illustrated in Figure 2. The four individual charts, denoted as Figure 2a–d, correspond to the observation summaries for Brazil, Russia, India, and China, respectively. Within each figure, a series of four concentric circles symbolize the hierarchical levels of the country, trading period, option maturity, and observations derived from wavelet plots. The outermost circle cells are colored in red and labeled as ‘ST’ to signify instances of short-term coherence. In contrast, cells marked green and labeled ‘ST and LT’ indicate short-term and long-term coherence occurrences.
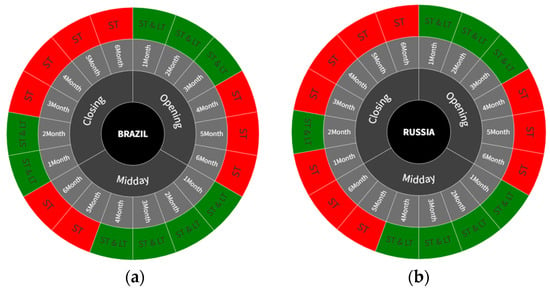
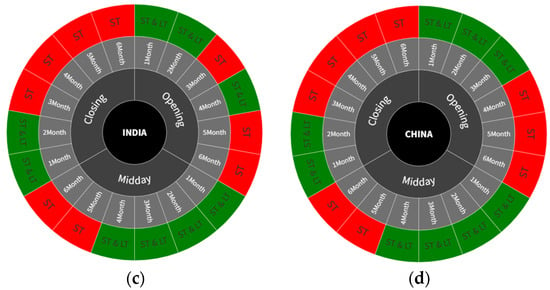
Figure 2.
Summarized observations of wavelet coherence plots (BRIC countries). (a): Summarized observations (Brazil); (b): summarized observations (Russia); (c): summarized observations (India); and (d): summarized observations (China).
5. Conclusions
The cointegration test revealed whether IVS and ISRs exhibited long-run cointegration in equilibrium. The investigation into the cointegration between IVS and ISRs across 72 cases (cases 1 to 72) under the H1 test showed evidence of long-run cointegration at a 1% level of significance for 69 instances across all maturities and all trading periods. The wavelet coherence plots provided an opportunity to visualize the coherence between IVS and ISRs with insights into the dynamic interactions between IVS and ISRs that might not be apparent when using traditional time or frequency domain analysis alone. By combining these two analytical tools, the study offered a comprehensive and multi-faceted perspective on the interplay of IVS and ISRs under investigation, capturing both short-term dynamics and long-term equilibrium relationships.
The analysis of wavelet coherence plots revealed noteworthy patterns in the observations. With the exception of the six-month maturity options, all other wavelet plots displayed notably robust movements. The wavelet plots for six-month maturity options, depicted in Figure A6, Figure A12 and Figure A18, demonstrated comparatively weaker coherence than other options IVS. This alignment is consistent with the findings of Bhuiyan et al. (2023), suggesting that options with longer maturities tend to exhibit lower information content. Upon examining the green and red cells in the sunburst charts of summary observations, as illustrated in Figure 2, an expectation arises for a greater number of green cells, representing both short-term and long-term coherence, indicating strong coherence. However, an intriguing pattern emerges from this analysis. For instance, Figure 2a, representing the summary of wavelet plots for Brazil, reveals that the count of green cells is three, four, and two for opening, midday, and closing period data, respectively. Since green cells indicate observations confirming both short-term and long-term coherence, it can be deduced that midday period data capture both short-term and long-term coherence, while closing period data are the least effective. This pattern is consistent with Figure 2b–d, as each figure indicates the highest number of green cells during the midday period and the lowest during the closing period. Another noteworthy observation from the green cells suggests that the count of green cells tends to increase as the options’ maturity decreases. For instance, in Figure 2a, for opening period data, one-, two-, and three-month maturity options correspond to green cells, while four-, five-, and six-month maturity options correspond to red cells. This implies that options with shorter maturities tend to exhibit more pronounced coherence.
In pursuit of the study’s objective of determining the resilience of Islamic stocks in BRIC countries during the GFC, two hypotheses were formulated. H1 examined the wavelet-based coherence and long-run cointegration between the IVS and ISR during the 2007–2009 GFC. The findings reveal a significant coherence and long-run cointegration between the IVS and ISR, for all the countries. This confirms H1 and thereby strongly supports H2, implying that Islamic stocks were indeed susceptible to the GFC, contrary to the notion of their immunity.
Considering the presumed distinctiveness of Islamic stocks, one might lend credence to their ability to act as a hedge during challenging market scenarios on the assumption that, with an exclusively Islamic investor profile, the influence of various investor profiles would not impact the performance of Islamic stocks. However, this study finds that their behavior may align with that of conventional stocks. Surprisingly, we observe that investor sentiment, not necessarily guided by Islamic principles, can anticipate returns on Islamic stocks during times of crisis. This presents a compelling argument that Islamic stocks may not be an authentic hedge during financial crises.
This study makes a valuable contribution to both theoretical understanding and practical applications across diverse dimensions. From the perspective of portfolio diversification, financial agents should look for other asset classes that are less correlated with both Islamic and conventional assets to achieve better diversification. Portfolio managers and risk officers should use holistic risk assessment models that account for the coherence and potential spillover effects between Islamic and conventional assets. The long-run cointegration indicates that any deviation between Islamic and conventional asset prices is temporary and will correct over time. This could inform dynamic asset allocation strategies where financial agents take advantage of short-term mispricing. Agents should develop structured financial products, such as Islamic-conventional hybrid funds or exchange-traded funds (ETFs), which aim to optimize the risk–return profile considering the cointegration. Continuous monitoring and client education are essential to ensure that investment practices align with both financial goals and Shariah principles.
Notably, this study employs a distinctive intraday ultra-high-frequency options implied data mining approach to improve empirical investigations into the relationship between Islamic stocks in emerging markets and global financial crises. Recognizing the limitations associated with daily data, which capture discrete information at specific trading day points, this study introduces intraday data at the opening, midday, and closing periods. This method addresses challenges related to capturing crucial information evolving throughout the day, thereby improving the accuracy of empirical analyses. The intraday data mining approach utilized in this study holds potential applicability in various financial time series analyses.
Over the past three decades, major financial crises, including the Asian financial crisis (1997–1998), the crisis stemming from the default on Russian debt in August 1998, and the global financial crisis (2007–2009), have significantly shaped economic landscapes. Consequently, developing empirical methodologies for financial crisis risk analysis is highly important. This research contributes by employing a big data model in the analysis of financial crisis risk, providing valuable insights into financial risk analysis.
Furthermore, the research emphasizes the enhanced information content capacity of midday period data compared to opening and closing periods, underscoring its relevance for options users and researchers in crucial financial decision-making processes. The practical implications of this research extend to risk management, market expectations, options pricing, volatility forecasting, and event risk evaluation. Investors can use the insights for informed decision-making and adjust their action plans based on market sentiment.
This study concentrated on the Islamic stocks of emerging economies, specifically within the BRIC countries. However, the methodology employed here can be similarly applied to Islamic stocks in other contexts, including developed economies and Gulf countries. The findings of such studies might differ and would offer significant insights into the behavior of Islamic stocks during periods of financial crisis.
Author Contributions
Conceptualization, A.H. and T.B.; methodology, T.B.; software, T.B.; validation, A.H., T.B. and T.L.; formal analysis, A.H.; investigation, T.B.; resources, T.L.; data curation, A.H.; writing—original draft preparation, T.B.; writing—review and editing, T.B.; visualization, A.H.; supervision, A.H.; project administration, T.L. All authors have read and agreed to the published version of the manuscript.
Funding
This research received no external funding.
Informed Consent Statement
Not applicable.
Data Availability Statement
The raw data supporting the conclusions of this article will be made available by the authors on request.
Conflicts of Interest
The authors declare no conflict of interest.
Appendix A
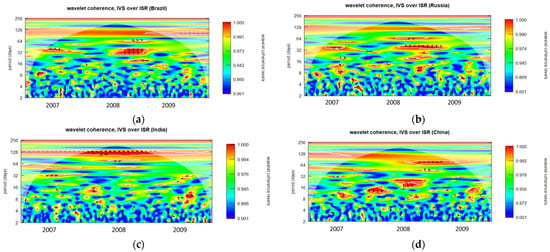
Figure A1.
Wavelet coherence of IVS over ISR during GFC period for 1-month maturity options (opening period). (a): Wavelet coherence (Brazil); (b): Wavelet coherence (Russia); (c): Wavelet coherence (India); and (d): Wavelet coherence (China).
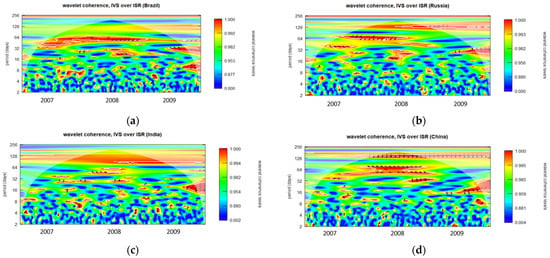
Figure A2.
Wavelet coherence of IVS over ISR during GFC period for 2-month maturity options (opening period). (a): Wavelet coherence (Brazil); (b): Wavelet coherence (Russia); (c): Wavelet coherence (India); and (d): Wavelet coherence (China).
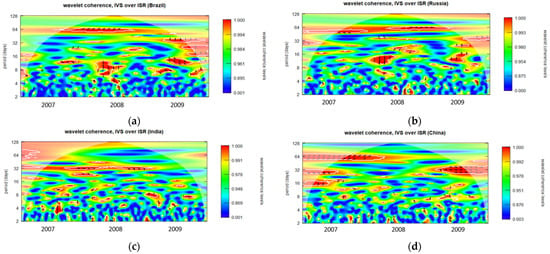
Figure A3.
Wavelet coherence of IVS over ISR during GFC period for 3-month maturity options (opening period). (a): Wavelet coherence (Brazil); (b): Wavelet coherence (Russia); (c): Wavelet coherence (India); and (d): Wavelet coherence (China).
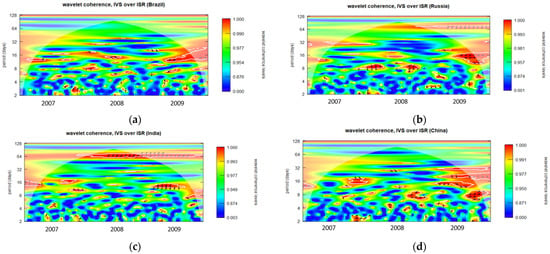
Figure A4.
Wavelet coherence of IVS over ISR during GFC period for 4-month maturity options (opening period). (a): Wavelet coherence (Brazil); (b): Wavelet coherence (Russia); (c): Wavelet coherence (India); and (d): Wavelet coherence (China).
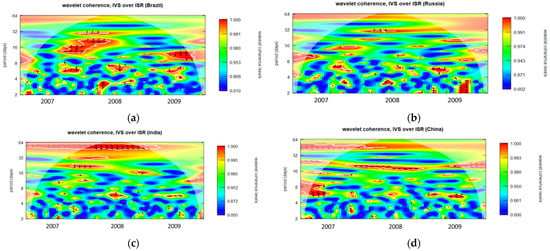
Figure A5.
Wavelet coherence of IVS over ISR during GFC period for 5-month maturity options (opening period). (a): Wavelet coherence (Brazil); (b): Wavelet coherence (Russia); (c): Wavelet coherence (India); and (d): Wavelet coherence (China).
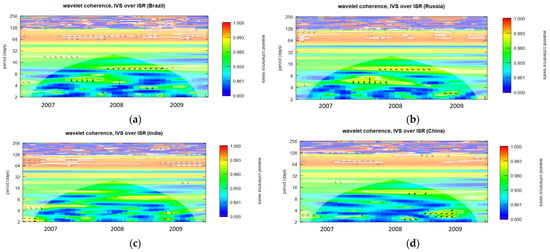
Figure A6.
Wavelet coherence of IVS over ISR during GFC period for 6-month maturity options (opening period). (a): Wavelet coherence (Brazil); (b): Wavelet coherence (Russia); (c): Wavelet coherence (India); and (d): Wavelet coherence (China).
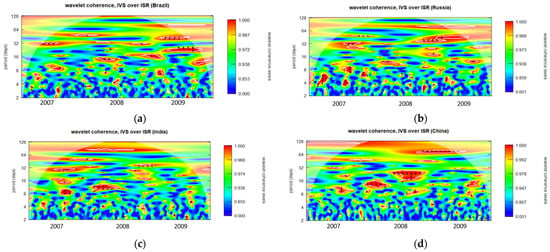
Figure A7.
Wavelet coherence of IVS over ISR during GFC period for 1-month maturity options (midday period). (a): Wavelet coherence (Brazil); (b): Wavelet coherence (Russia); (c): Wavelet coherence (India); and (d): Wavelet coherence (China).
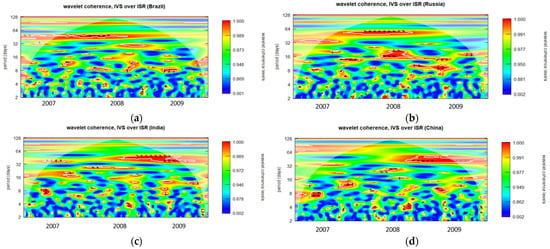
Figure A8.
Wavelet coherence of IVS over ISR during GFC period for 2-month maturity options (midday period). (a): Wavelet coherence (Brazil); (b): Wavelet coherence (Russia); (c): Wavelet coherence (India); and (d): Wavelet coherence (China).
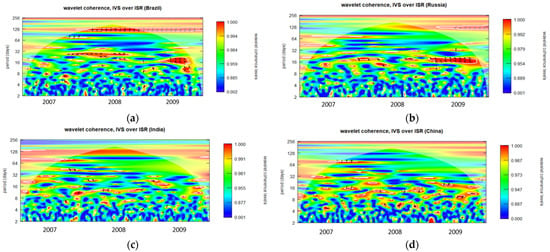
Figure A9.
Wavelet coherence of IVS over ISR during GFC period for 3-month maturity options (midday period). (a): Wavelet coherence (Brazil); (b): Wavelet coherence (Russia); (c): Wavelet coherence (India); and (d): Wavelet coherence (China).
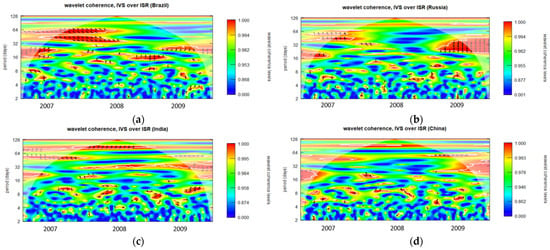
Figure A10.
Wavelet coherence of IVS over ISR during GFC period for 4-month maturity options (midday period). (a): Wavelet coherence (Brazil); (b): Wavelet coherence (Russia); (c): Wavelet coherence (India); and (d): Wavelet coherence (China).
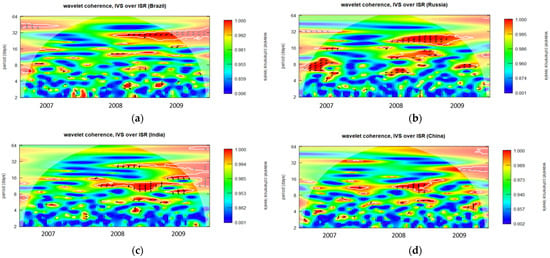
Figure A11.
Wavelet coherence of IVS over ISR during GFC period for 5-month maturity options (midday period). (a): Wavelet coherence (Brazil); (b): Wavelet coherence (Russia); (c): Wavelet coherence (India); and (d): Wavelet coherence (China).
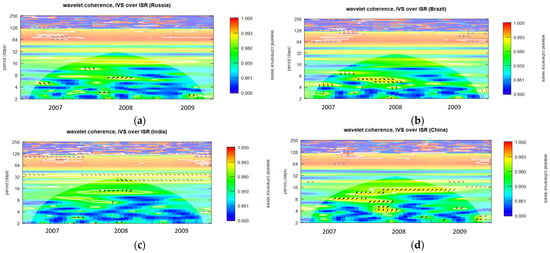
Figure A12.
Wavelet coherence of IVS over ISR during GFC period for 6-month maturity options (midday period). (a): Wavelet coherence (Brazil); (b): Wavelet coherence (Russia); (c): Wavelet coherence (India); and (d): Wavelet coherence (China).
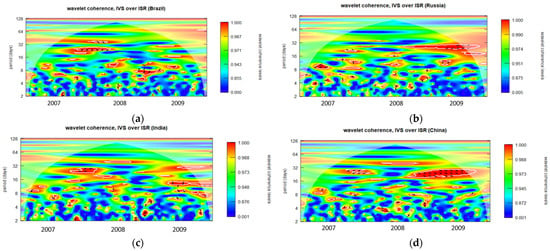
Figure A13.
Wavelet coherence of IVS over ISR during GFC period for 1-month maturity options (closing period). (a): Wavelet coherence (Brazil); (b): Wavelet coherence (Russia); (c): Wavelet coherence (India); and (d): Wavelet coherence (China).
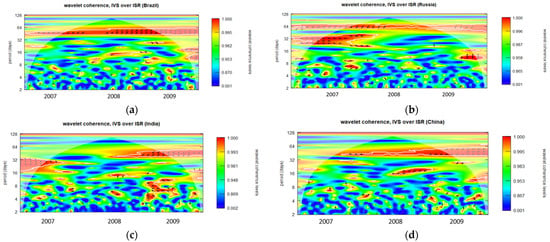
Figure A14.
Wavelet coherence of IVS over ISR during GFC period for 2-month maturity options (closing period). (a): Wavelet coherence (Brazil); (b): Wavelet coherence (Russia); (c): Wavelet coherence (India); and (d): Wavelet coherence (China).
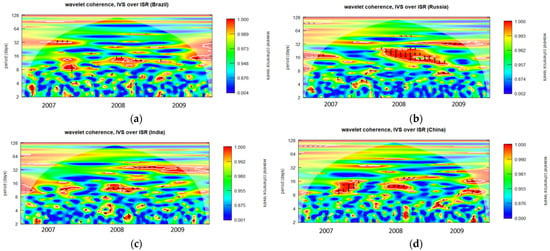
Figure A15.
Wavelet coherence of IVS over ISR during GFC period for 3-month maturity options (closing period). (a): Wavelet coherence (Brazil); (b): Wavelet coherence (Russia); (c): Wavelet coherence (India); and (d): Wavelet coherence (China).
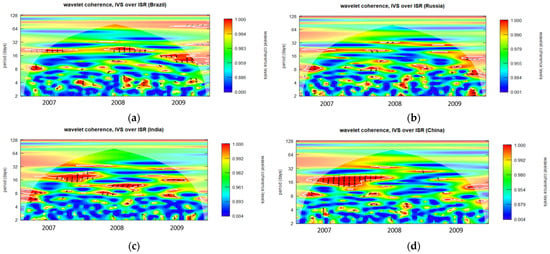
Figure A16.
Wavelet coherence of IVS over ISR during GFC period for 4-month maturity options (closing period). (a): Wavelet coherence (Brazil); (b): Wavelet coherence (Russia); (c): Wavelet coherence (India); and (d): Wavelet coherence (China).
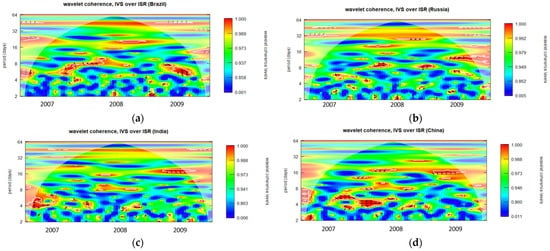
Figure A17.
Wavelet coherence of IVS over ISR during GFC period for 5-month maturity options (closing period). (a): Wavelet coherence (Brazil); (b): Wavelet coherence (Russia); (c): Wavelet coherence (India); and (d): Wavelet coherence (China).
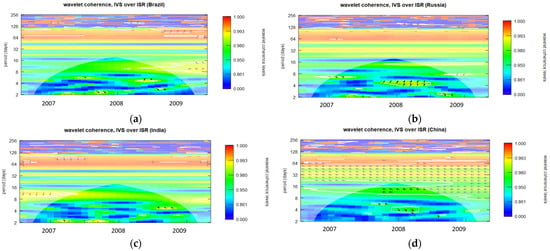
Figure A18.
Wavelet coherence of IVS over ISR during GFC period for 6-month maturity options (closing period). (a): Wavelet coherence (Brazil); (b): Wavelet coherence (Russia); (c): Wavelet coherence (India); and (d): Wavelet coherence (China).
References
- Andersen, Torben G., Tim Bollerslev, Francis X. Diebold, and Paul Labys. 2003. Modeling and Forecasting Realized Volatility. Econometrica 71: 579–625. [Google Scholar] [CrossRef]
- Bank for International Settlements. 2020. BIS. Available online: https://www.bis.org/publ/bppdf/bispap109.pdf (accessed on 1 March 2024).
- Bhuiyan, Tanvir, Ariful Hoque, and Thi Le. 2023. Analysing Implied Volatility Smirk to Predict the US Stock Market Crash during the Global Financial Crisis. Journal of Open Innovation: Technology, Market, and Complexity 9: 100165. [Google Scholar] [CrossRef]
- Biktimirov, Ernest N., and Chunrong Wang. 2017. Model-Based versus Model-Free Implied Volatility: Evidence from North American, European, and Asian Index Option Markets. The Journal of Derivatives 24: 42–68. [Google Scholar] [CrossRef]
- Blair, Bevan J., Ser-Huang Poon, and Stephen J. Taylor. 2001. Forecasting S&P 100 volatility: The incremental information content of implied volatilities and high-frequency index returns. Journal of Econometrics 105: 5–26. [Google Scholar]
- Bollerslev, Tim, Michael Gibson, and Hao Zhou. 2011. Dynamic estimation of volatility risk premia and investor risk aversion from option-implied and realized volatilities. Journal of Econometrics 160: 235–45. [Google Scholar] [CrossRef]
- Cai, Charlie X., Robert Hudson, and Kevin Keasey. 2004. Intra Day Bid-Ask Spreads, Trading Volume and Volatility: Recent Empirical Evidence from the London Stock Exchange. Journal of Business Finance Accounting 31: 647–76. [Google Scholar] [CrossRef]
- Christoffersen, Peter, Steven Heston, and Kris Jacobs. 2009. The Shape and Term Structure of the Index Option Smirk: Why Multifactor Stochastic Volatility Models Work So Well. Management Science 55: 1914–32. [Google Scholar] [CrossRef]
- Corredor, Pilar, and Rafael Santamaría. 2004. Forecasting volatility in the Spanish option market. Applied Financial Economics 14: 1–11. [Google Scholar] [CrossRef]
- Doran, James S., James M. Carson, and David R. Peterson. 2006. Market Crash Risk and Implied Volatility Skewness: Evidence and Implications for Insurer Investments. SSRN Electronic Journal. [Google Scholar] [CrossRef]
- Engle, Robert F., and C. W. J. Granger. 1987. Cointegration and Error Correction: Representation, Estimation, and Testing. Econometrica 55: 251–76. [Google Scholar] [CrossRef]
- Fleming, Jeff. 1998. The quality of market volatility forecasts implied by S&P 100 index option prices. Journal of Empirical Finance 5: 317–45. [Google Scholar] [CrossRef]
- Foresi, Silverio, and Liuren Wu. 2005. Crash-o-phobia: A domestic fear or a worldwide concern? The Journal of Derivatives 13: 8–21. [Google Scholar] [CrossRef]
- Goodhart, Charles A. E., and Maureen O’Hara. 1997. High frequency data in financial markets: Issues and applications. Journal of Empirical Finance 4: 73–114. [Google Scholar] [CrossRef]
- Hassan, Kamrul, Ariful Hoque, Muammer Wali, and Dominic Gasbarro. 2020. Islamic stocks, conventional stocks, and crude oil: Directional volatility spillover analysis in BRICS. Energy Economics 92: 104985. [Google Scholar] [CrossRef]
- Ho, Thomas, and Hans R. Stoll. 1981. Optimal dealer pricing under transactions and return uncertainty. Journal of Financial Economics 9: 47–73. [Google Scholar] [CrossRef]
- Hoque, Ariful, and Petko S. Kalev. 2015. Pricing currency options with intra-daily implied volatility. Australasian Accounting, Business and Finance Journal 9: 43–56. [Google Scholar] [CrossRef]
- Hoque, Ariful, Thi Ngoc Quynh Le, and Kamrul Hassan. 2020. Does currency smirk predict foreign exchange return? Investment Management and Financial Innovations 17: 219–30. [Google Scholar] [CrossRef]
- Johansen, Søren. 1988. Statistical analysis of cointegration vectors. Journal of Economic Dynamics and Control 12: 231–54. [Google Scholar] [CrossRef]
- Kenourgios, Dimitris, Nader Naifar, and Dimitrios Dimitriou. 2016. Islamic financial markets and global crises: Contagion or decoupling? Economic Modelling 57: 36–46. [Google Scholar] [CrossRef]
- Le, Thi, Ariful Hoque, and Kamrul Hassan. 2021. An Open Innovation Intraday Implied Volatility for Pricing Australian Dollar Options. Journal of Open Innovation: Technology, Market, and Complexity 7: 23. [Google Scholar] [CrossRef]
- Lee, Hyejin, and Junsoo Lee. 2014. More powerful Engle–Granger cointegration tests. Journal of Statistical Computation and Simulation 85: 3154–71. [Google Scholar] [CrossRef]
- Li, Minqiang. 2008. Approximate inversion of the Black–Scholes formula using rational functions. European Journal of Operational Research 185: 743–59. [Google Scholar] [CrossRef]
- Li, Zhao-Chen, Chi Xie, Zhijian Zeng, Gang-Jin Wang, and Ting Zhang. 2023. Forecasting global stock market volatilities in an uncertain world. International Review of Financial Analysis 85: 102463. [Google Scholar] [CrossRef]
- McAleer, Michael, and Marcelo C. Medeiros. 2008. Realized Volatility: A Review. Econometric Reviews 27: 10–45. [Google Scholar] [CrossRef]
- Nelson, Daniel B. 1991. Conditional Heteroskedasticity in Asset Returns: A New Approach. Econometrica 59: 347. [Google Scholar] [CrossRef]
- Nordén, Lars, and Caihong Xu. 2011. Option happiness and liquidity: Is the dynamics of the volatility smirk affected by relative option liquidity? Journal of Futures Markets 32: 47–74. [Google Scholar] [CrossRef]
- Pathak, Rajesh, and Amarnath Mitra. 2017. Predictability and predictors of volatility smirk: A study on index options. Business: Theory and Practice 18: 64–70. [Google Scholar] [CrossRef][Green Version]
- Pathak, R., Satish Kumar, and Ranajee Ranajee. 2017. Going European from American: Does style matter? Managerial Finance 43: 471–87. [Google Scholar] [CrossRef]
- Press, William H., Brian P. Flannery, Saul A. Teukolsky, and William T. Vetterling. 1992. Numerical Recipes in C: The Art of Scientific Computing, 2nd ed. Cambridge: Cambridge University Press. [Google Scholar]
- Rubinstein, Mark. 1994. Implied Binomial Trees. The Journal of Finance 49: 771–818. [Google Scholar] [CrossRef]
- Torrence, Christopher, and Gilbert P. Compo. 1998. A Practical Guide to Wavelet Analysis. Bulletin of the American Meteorological Society 79: 61–78. [Google Scholar] [CrossRef]
- Torrence, Christopher, and Peter J. Webster. 1999. Interdecadal Changes in the ENSO–Monsoon System. Journal of Climate 12: 2679–90. [Google Scholar] [CrossRef]
- Wang, Jiqian, Xinjie Lu, Feng He, and Feng Ma. 2020. Which popular predictor is more useful to forecast international stock markets during the coronavirus pandemic: VIX vs. EPU? International Review of Financial Analysis 72: 101596. [Google Scholar] [CrossRef] [PubMed]
- Xing, Yuhang, Xiaoyan Zhang, and Rui Zhao. 2010. What Does the Individual Option Volatility Smirk Tell Us about Future Equity Returns? Journal of Financial and Quantitative Analysis 45: 641–62. [Google Scholar] [CrossRef]
Disclaimer/Publisher’s Note: The statements, opinions and data contained in all publications are solely those of the individual author(s) and contributor(s) and not of MDPI and/or the editor(s). MDPI and/or the editor(s) disclaim responsibility for any injury to people or property resulting from any ideas, methods, instructions or products referred to in the content. |
© 2024 by the authors. Licensee MDPI, Basel, Switzerland. This article is an open access article distributed under the terms and conditions of the Creative Commons Attribution (CC BY) license (https://creativecommons.org/licenses/by/4.0/).