
Efficiency of Healthcare Financing: Case of European Countries


Abstract
:1. Introduction
2. Materials and Methods
2.1. Research Variables
- –
- Capital health expenditure to GDP ratio, % (Cap);
- –
- Domestic general government health expenditure to current health expenditure ratio, % (Dom_gov);
- –
- Domestic private health expenditure to current health expenditure ratio, % (Dom_prv);
- –
- External health expenditure to current health expenditure ratio, % (Ext);
- –
- Out-of-pocket expenditure to current health expenditure ratio, % (OoP).
2.2. Data Sources
2.3. Stages of Investigation
- (1)
- determining the efficiency of healthcare financing using stochastic frontier analysis;
- (2)
- clustering of countries considering options of healthcare financing; qualitative analysis of clusters and identifying specific features for each model of healthcare financing, characteristic of each of the clusters;
- (3)
- substantiating additional determinants of the efficiency of healthcare financing through the formalisation of temporal and causal patterns in the chain “healthcare financing → life expectancy” based on distributional-lag modelling; generalisation and qualitative interpretation of the modelling results, formation of recommendations for each cluster/model of healthcare financing regarding ways to improve its efficiency.
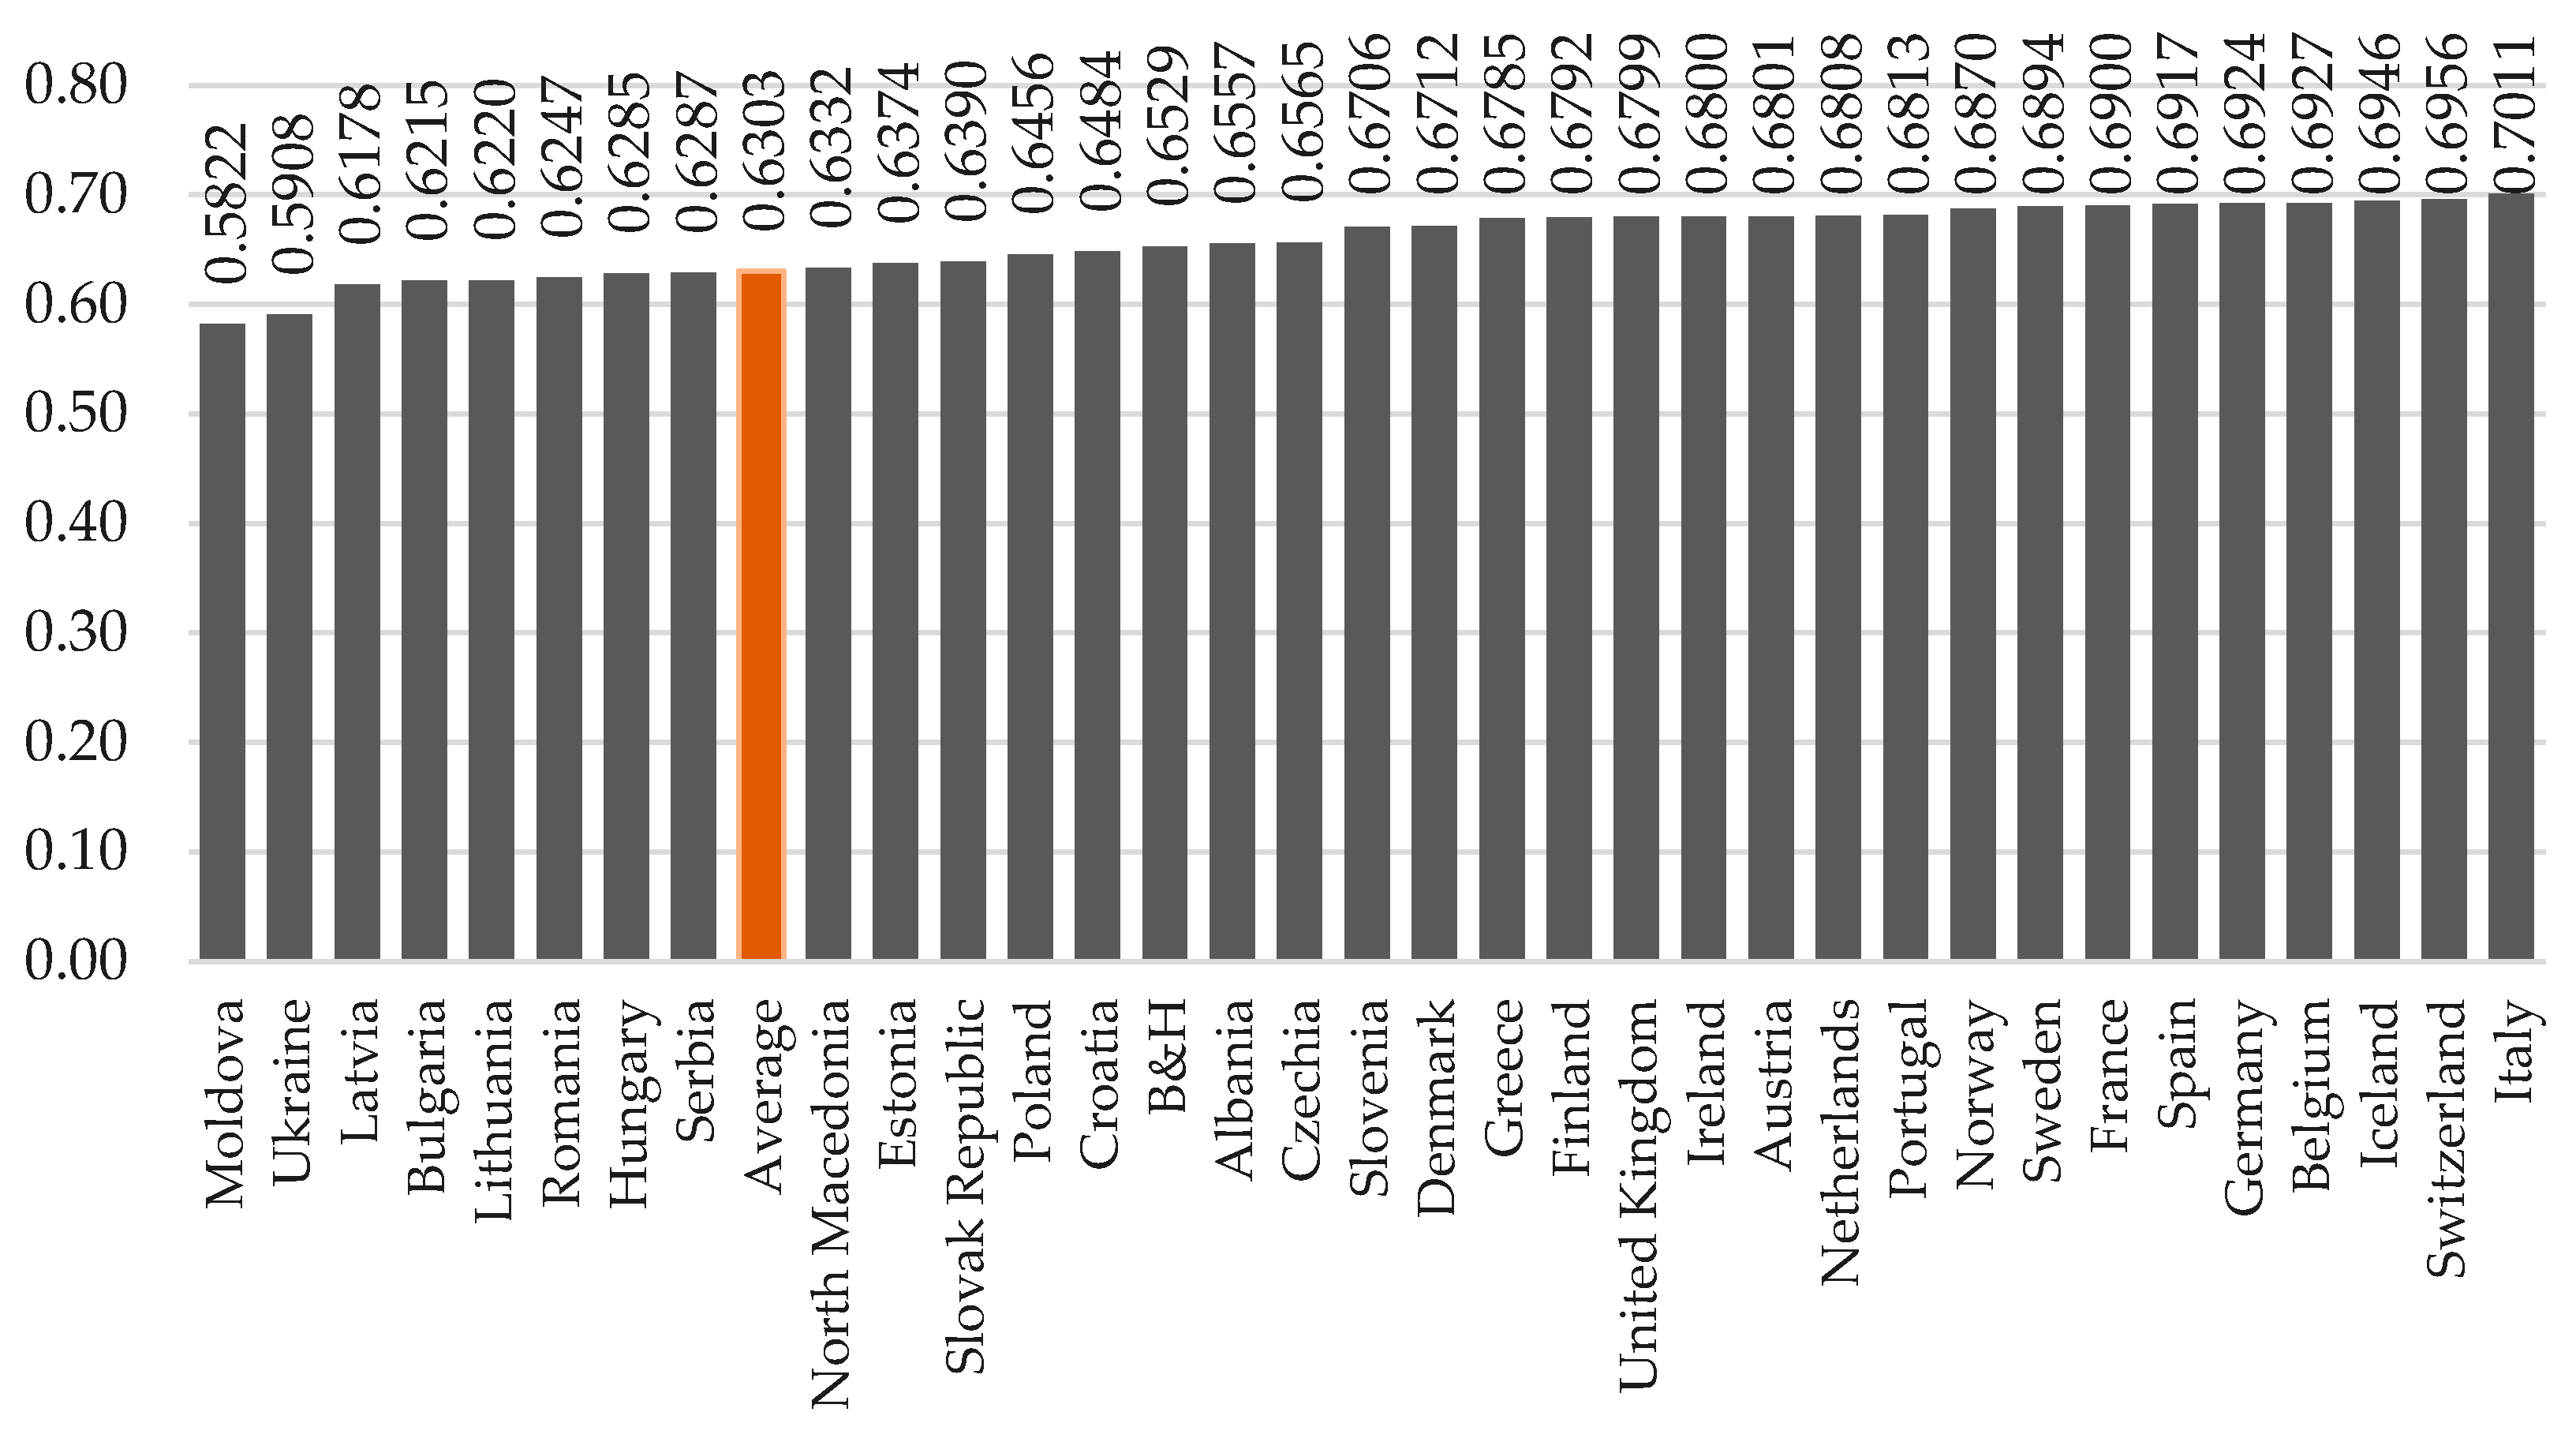
- Determining the efficiency of healthcare financing in scientific research is traditionally carried out using two tools—Data Envelopment Analysis (DEA) (Charnes et al. 1978; Afonso and Aubyn 2011; Karagiannis 2015; Tigga and Mishra 2015; Kaya Samut and Cafrı 2016; Stefko et al. 2018; Ahmed et al. 2019; Chitnis and Mishra 2019; Kohl et al. 2019; Hamzah et al. 2021; Arhin et al. 2023a) and Stochastic Frontier Analysis (Newhouse 1994; Skinner 1994; Kumbhakar and Lovell 2000; Hollingsworth 2003; Greene 2004; Luis Orea and Kumbhakar 2004; Rosko and Mutter 2008; Hamidi and Akinci 2016; Izón and Pardini 2017; Bashir et al. 2022; Arhin et al. 2023b; Bala et al. 2023; Kang et al. 2023; Sülkü et al. 2023). The difference between these approaches is that DEA determines the frontier based on the level of indicators achieved. In contrast, Stochastic Frontier Analysis calculates the frontier considering the most successful combination of input and output factors. In contrast, the inefficiency parameter determines the deviation of the actual level of the indicator from the potentially possible maximum. Thus, in the first case, there will necessarily be a country with 100% efficiency among the calculated values of technical efficiency. In contrast, in the second case, as a rule, none of the countries will have absolute efficiency. In previous studies, the authors calculated the efficiency of healthcare financing using DEA for the same sample of 34 European countries. In particular, according to the results of this analysis, the technical efficiency of healthcare financing is in the range of [0.92; 1.00], while for 15 out of 34 countries, the indicator is the maximum. Thus, the DEA approach did not allow for the identification of absolute flagships since the variation between the levels of efficiency of healthcare financing in the studied European countries is insignificant. That is why, as part of this study, the level of efficiency of healthcare financing will be evaluated using Stochastic Frontier Analysis, that is, based on the assumption that no country currently functions on the frontier but, on the contrary, has the potential for growth due to the elimination of those prerequisites that create inefficiency. The efficiency of healthcare financing will be determined using the command “xtfrontier” in the Stata 14.2/SE software product.
- Clustering of countries according to the criterion of financing the healthcare system will be carried out based on the factor (input) variables specified above, using the command “xtregcluster” in Stata 14.2/SE software product. The methodology of this approach was developed (Sarafidis and Weber 2015), and the specifics of the application are described in detail in the work (Christodoulou and Sarafidis 2017). The above command allows the grouping of objects into clusters, for each of which the slope coefficient is homogeneous. The two-way structure of the error components explains the within-cluster heterogeneity. Furthermore, the slope coefficients vary across groups. The number of clusters is considered unknown and determined from the data based on minimising an information criterion for a rigorously consistent model (Christodoulou and Sarafidis 2017). A qualitative analysis of the efficiency of healthcare financing within each cluster will allow for formalising the specific features. These specific features determine the healthcare system’s financial support models
- Identifying the additional determinants of the efficiency of healthcare financing through the formalisation of temporal and causal patterns in the chain “healthcare financing → life expectancy”. The distributed-lag modelling in Stata 14.2/SE software product is used. It is tested for causal relationships between input and output variables with a 0–3-year lag.
3. Results
3.1. Determining the Efficiency of Financing the Healthcare System
3.2. Clustering of Countries according to the Criterion of Financing the Healthcare System
- –
- The model of financial support of the healthcare system of the countries in the first cluster is characterised by a moderate amount of capital expenditures for healthcare, external healthcare expenditures, and current out-of-pocket expenditures, while the ratio of public funding of the healthcare system to private funding is approximately 73% vs. 27%; all this makes it possible to ensure relatively high efficiency of healthcare financing within 66.4%;
- –
- The model of healthcare financing of the countries in the second cluster is characterised by the minimum level of capital expenditures on healthcare but the maximum level of external healthcare expenditures and current out-of-pocket expenditures, while the ratio of public financing of the healthcare system to private funding is very similar to model 3 at 68% vs. 32%; the efficiency of healthcare financing is the lowest among the three clusters—65.6% on average;
- –
- The model of healthcare financing of the countries in the third cluster is characterised by the maximum level of capital expenditures on healthcare but the minimum level of external healthcare expenditures and current out-of-pocket expenditures, while the ratio of public financing of the healthcare system to private financing is 67% vs. 33%; the efficiency of healthcare financing is the highest and is 68.1% on average.
3.3. Formalisation of Temporal and Causal Patterns in the Chain “Healthcare Financing → Life Expectancy”
- –
- A positive, considerable, and statistically significant impact of the growth of capital healthcare expenditures on both without a lag and with a lag of 1–3 years (the most qualitative relationship from an econometric point of view is in the model with a lag of 3 years: an increase in capital healthcare expenditures in GDP by 1% causes an increase in the life expectancy of the population in the countries of the first cluster by 2.5 years);
- –
- The statistical significance of the positive impact of the increase in the specific weight of domestic government and private healthcare expenditures in current expenditures on life expectancy is manifested only with a lag of 3 years;
- –
- The growth of external healthcare expenditures harms the life expectancy of the population, and this relationship is statistically significant without time lags;
- –
- An increase in the specific weight of out-of-pocket expenditures in the structure of current healthcare expenditures hurts the population’s life expectancy. At the same time, the best statistical quality of the relationship is realised with a lag of 2 years when the influence of the indicator is the highest.
- –
- The positive effect of the growth of capital healthcare expenditures on the increase in life expectancy was confirmed without a lag and with a lag of 1 year. However, the most statistically significant result is precisely without a lag, in which a 1% increase in the specific weight of capital expenditures in GDP leads to an increase in life expectancy in the countries of the second cluster by 2.07 years;
- –
- An interesting fact is that the growth of the specific weight of public, private and external healthcare expenditures in current expenditures without a time lag is characterised by a statistically significant negative impact on life expectancy in the countries of the second cluster; however, their growth with a lag of 3 years is accompanied by a significant growth in life expectancy. An increase in the specific weight of out-of-pocket expenditures in the structure of current healthcare expenditures negatively affected life expectancy of the population at all time intervals (the most statistically significant result is without a time lag, while with an increase in the lag, the quality and strength of the relationships worsen).
- –
- The positive effect of the increase in capital healthcare expenditures on the increase in life expectancy is statistically significant at all time intervals; however, this relationship is most qualitative in the model without a time lag, i.e., a 1% increase in the specific weight of capital expenditures in GDP is accompanied by an increase in life expectancy of 1.6 years almost instantaneously;
- –
- Instead, the growth of the specific weight of public, private and external healthcare expenditures in current expenditures acts as a destructive determinant of changes in life expectancy; this effect is most strongly realised without a lag and with a lag of 1 year;
- –
- An increase in the specific weight of out-of-pocket expenditures in current expenditures by 1% leads to a reduction in life expectancy without a time lag of 0.21 years.
4. Discussion
5. Conclusions
Author Contributions
Funding
Informed Consent Statement
Data Availability Statement
Acknowledgments
Conflicts of Interest
References
- Abad-Segura, Emilio, Alfonso Infante-Moro, Mariana-Daniela González-Zamar, and Eloy López-Meneses. 2024. Influential factors for a secure perception of accounting management with blockchain technology. Journal of Open Innovation: Technology, Market, and Complexity 10: 100264. [Google Scholar] [CrossRef]
- Afonso, António, and Miguel St. Aubyn. 2011. Assessing health efficiency across countries with a two-step and bootstrap analysis. Applied Economics Letters 18: 1427–30. [Google Scholar] [CrossRef]
- Ahmed, Sayem, Md Zahid Hasan, Mary MacLennan, Farzana Dorin, Mohammad Wahid Ahmed, Md Mehedi Hasan, Shaikh Mehdi Hasan, Mohammad Touhidul Islam, and Jahangir A. M. Khan. 2019. Measuring the efficiency of health systems in Asia: A data envelopment analysis. BMJ Open 9: e022155. [Google Scholar] [CrossRef]
- Alipouri Sakha, Minoo, Mohammad Bazyar, and Arash Rashidian. 2024. Classification and focus comparison of health financing frameworks: A scoping review. The International Journal of Health Planning and Management 39: 1146–71. [Google Scholar] [CrossRef]
- Aliyeva, Zamina. 2022. Innovation in healthcare management: Drug decriminalisation for reducing the health damage from crime. Marketing and Management of Innovations 1: 37–57. [Google Scholar] [CrossRef]
- Antohi, Valentin Marian, Romeo Victor Ionescu, Monica Laura Zlat, Cristian Mirica, and Nicoleta Cristache. 2022. Approaches to Health Efficiency across the European Space through the Lens of the Health Budget Effort. International Journal of Environmental Research and Public Health 19: 3063. [Google Scholar] [CrossRef]
- Arhin, Kwadwo, Oteng-Abayie, Eric Fosu, and Jacob Novignon. 2023a. Assessing the efficiency of health systems in achieving the universal health coverage goal: Evidence from Sub-Saharan Africa. Health Economics Review 13: 25. [Google Scholar] [CrossRef] [PubMed]
- Arhin, Kwadwo, Oteng-Abayie, Eric Fosu, and Jacob Novignon. 2023b. Effects of healthcare financing policy tools on health system efficiency: Evidence from sub-Saharan Africa. Heliyon 9: e20573. [Google Scholar] [CrossRef] [PubMed]
- Atilgan, Emre, H. Murat Ertuğrul, Onur Baycan, and Hakan Ulucan. 2024. Health-led growth hypothesis and health financing systems: An econometric synthesis for OECD countries. Frontiers in Public Health 12: 1437304. [Google Scholar] [CrossRef]
- Bala, Muhammad Muazu, Shailender Singh, and Dhruba Kumar Gautam. 2023. Stochastic frontier approach to efficiency analysis of health facilities in providing services for non-communicable diseases in eight LMICs. International Health 15: 512–25. [Google Scholar] [CrossRef]
- Balkhi, Bander, Dhfer Alshayban, and Nawaf M. Alotaibi. 2021. Impact of Healthcare Expenditures on Healthcare Outcomes in the Middle East and North Africa (MENA) Region: A Cross-Country Comparison, 1995–2015. Frontiers in Public Health 8: 624962. [Google Scholar] [CrossRef]
- Baltgailis, Jurijs, and Anastasiia Simakhova. 2022. The Technological Innovations of Fintech Companies to Ensure the Stability of the Financial System in Pandemic Times. Marketing and Management of Innovations 2: 55–65. [Google Scholar] [CrossRef]
- Bashir, Saima, Grasic Muhammad Nasir, Katja Grasic, Marc Moulin, and Shehzad Ali. 2022. Association between efficiency and quality of care of public healthcare facilities: Evidence from Pakistan. The International Journal of Health Planning and Management 37: 2240–55. [Google Scholar] [CrossRef] [PubMed]
- Behera, Deepak Kumar, and Umakant Dash. 2018. Healthcare financing in South-East Asia: Does fiscal capacity matter? International Journal of Healthcare Management 13 Suppl. S1: 375–84. [Google Scholar] [CrossRef]
- Behera, Deepak Kumar, and Umakant Dash. 2019. Impact of macro-fiscal determinants on health financing: Empirical evidence from low-and middle-income countries. Global Health Research and Policy 4: 1–13. [Google Scholar] [CrossRef]
- Bein, Murad A., Dogan Unlucan, Globalahan Olowu, and Wagdi Kalifa. 2017. Healthcare spending and health outcomes: Evidence from selected East African countries. African Health Sciences 17: 247–54. [Google Scholar] [CrossRef] [PubMed]
- Beylik, Umut, Umit Cirakli, Murat Cetin, Eyyup Ecevit, and Osman Senol. 2022. The relationship between health expenditure indicators and economic growth in OECD countries: A Driscoll-Kraay approach. Frontiers in Public Health 10: 1050550. [Google Scholar] [CrossRef]
- Bokhari, Farasat A. S., Yunwei Gai, and Pablo Gottret. 2007. Government health expenditures and health outcomes. Health Economics 16: 257–73. [Google Scholar] [CrossRef] [PubMed]
- Brikci, Nouria, Rotimi Alao, Hong Wang, Darius Erlangga, and Kara Hanson. 2024. Improving the efficiency in spending for health: A systematic review of evidence. SSM—Health Systems 2: 100008. [Google Scholar] [CrossRef]
- Cacace, Mirella. 2021. Case study C: Transforming healthcare financing in Central and Eastern European countries. In Handbook on Social Protection Systems. Cheltenham: Elgar, pp. 78–82. [Google Scholar] [CrossRef]
- Cetin, Volkan Recai, and Serdal Bahce. 2016. Measuring the efficiency of health systems of OECD countries by data envelopment analysis. Applied Economics 48: 3497–507. [Google Scholar] [CrossRef]
- Charnes, Abraham, William W. Cooper, and E. L. Rhodes. 1978. Measuring the efficiency of decision making units. European Journal of Operational Research 2: 429–44. [Google Scholar] [CrossRef]
- Chen, Qiuxing, Qiaozhu Chi, Yang Chen, Oleksii Lyulyov, and Tetyana Pimonenko. 2022. Does population aging impact China’s economic growth? International Journal of Environmental Research and Public Health 19: 12171. [Google Scholar] [CrossRef] [PubMed]
- Chitnis, Asmita, and Dharmesh K. Mishra. 2019. Performance Efficiency of Indian Private Hospitals Using Data Envelopment Analysis and Super-efficiency DEA. Journal of Health Management 21: 279–93. [Google Scholar] [CrossRef]
- Choonara, Shakira, and John Eyles. 2016. Out of control: Profit-seeking behaviour, unnecessary medical procedures and rising costs of private medical care in South Africa. BMJ Glob Health 1: e000013. [Google Scholar] [CrossRef]
- Christodoulou, Demetris, and Vasilis Sarafidis. 2017. Regression clustering for panel-data models with fixed effects. The Stata Journal 17: 314–329. [Google Scholar] [CrossRef]
- Cole, Wade M. 2019. Wealth and health revisited: Economic growth and well-being in developing countries, 1970 to 2015. Social Science Research 77: 45–67. [Google Scholar] [CrossRef]
- Dacko-Pikiewicz, Zdzislawa. 2019. Building a family business brand in the context of the concept of stakeholder-oriented value. Forum Scientiae Oeconomia 7: 37–51. [Google Scholar] [CrossRef]
- Das, Tiken. 2024. Impact of Health and Non-health Inputs on Health Outcomes: A Comparative Study of South Asia, Southeast Asia, BRICS and ASEAN Regions. Arthaniti: Journal of Economic Theory and Practice 23: 09767479241256168. [Google Scholar] [CrossRef]
- Davidson, Alan. 2015. Social Determinants of Health: A Comparative Approach. Oxford: Oxford University Press. 296p. [Google Scholar]
- Dollar, David, and Aart Kraay. 2002. Growth Is Good for the Poor. Journal of Economic Growth 7: 195–225. [Google Scholar] [CrossRef]
- Domapielle, Maximillian Kolbe, Joshua Sumankuuro, and Frederick Der Bebelleh. 2022. Revisiting the debate on health financing in Low and Middle-income countries: An integrative review of selected models. The International Journal of Health Planning and Management 37: 3061–74. [Google Scholar] [CrossRef]
- Dong, Zhiwei, Liping Wu, Yang Chen, Oleksii Lyulyov, and Tetyana Pimonenko. 2022. Intergenerational transmission of obesity: Role of education and income. International Journal of Environmental Research and Public Health 19: 15931. [Google Scholar] [CrossRef]
- Fogel, Robert William. 1997. New findings on secular trends in nutrition and mortality: Some implications for population theory. Handbook of Population and Family Economics 1A: 433–81. [Google Scholar] [CrossRef]
- Frank, Sarah M., Jacqui Webster, Briar McKenzie, Pascal Geldsetzer, Jennifer Manne-Goehler, Glennis Andall-Brereton, Corine Houehanou, Dismand Houinato, Mongal Singh Gurung, Brice Wilfried Bicaba, and et al. 2019. Consumption of fruits and vegetables among individuals 15 years and older in 28 low- and middle-income countries. Journal of Nutrition 149: 1252–59. [Google Scholar] [CrossRef] [PubMed]
- Frimpong, Prince Boakye, and George Adu. 2014. Population health and economic growth in Sub-Saharan Africa: A panel cointegration analysis. Journal of African Business 15: 36–48. [Google Scholar] [CrossRef]
- Fujii, Tomoki. 2018. Sources of health financing and health outcomes: A panel data analysis. Health Economics 27: 1996–2015. [Google Scholar] [CrossRef] [PubMed]
- Gallardo-Albarran, Daniel. 2018. Health and economic development since 1900. Economics & Human Biology 31: 228–37. [Google Scholar] [CrossRef]
- Gallet, Craig A., and Hristos Doucouliagos. 2017. The impact of healthcare spending on health outcomes: A meta-regression analysis. Social Science & Medicine 179: 9–17. [Google Scholar] [CrossRef]
- Gaylong, Ruchi, Vijay Kumar Tiwari, and T. P. Sherin Raj. 2023. Planning and financing of RMNCH+ A under National Health Mission: A case study of the Gurugram District of Haryana State. The International Journal of Health Planning and Management 38: 951–66. [Google Scholar] [CrossRef]
- Greene, William. 2004. Distinguishing between heterogeneity and inefficiency: Stochastic frontier analysis of the World Health Organization’s panel data on national health care systems. Health Economics 13: 959–80. [Google Scholar] [CrossRef]
- Grigoli, Francesco, and Javier Kapsoli. 2018. Waste not, want not: The efficiency of health expenditure in emerging and developing economies. Review of Development Economics 22: 384–403. [Google Scholar] [CrossRef]
- Grigorakis, Nikolaos, Christos Floros, Haritini Tsangari, and Evangelos Tsoukatos. 2018. Macroeconomic and financing determinants of out of pocket payments in health care: Evidence from selected OECD countries. Journal of Policy Modeling 40: 1290–312. [Google Scholar] [CrossRef]
- Hadad, Sharon, Yossi Hadad, and Tzahit Simon-Tuval. 2013. Determinants of healthcare system’s efficiency in OECD countries. The European Journal of Health Economics 14: 253–65. [Google Scholar] [CrossRef] [PubMed]
- Hamidi, Samer, and Fevzi Akinci. 2016. Measuring Efficiency of Health Systems of the Middle East and North Africa (MENA) Region Using Stochastic Frontier Analysis. Applied Health Economics and Health Policy 14: 337–47. [Google Scholar] [CrossRef]
- Hamzah, Nurhafiza Md, Ming-Miin Yu, and Kok Fong See. 2021. Assessing the efficiency of Malaysia health system in COVID-19 prevention and treatment response. Health Care Management Science 24: 273–85. [Google Scholar] [CrossRef]
- Herrera, Santiago, and Gaobo Pang. 2005. Efficiency of Public Spending in Developing Countries: An Efficiency Frontier Approach. In Policy Research Working Paper. Washington, DC: The World Bank, vol. 3645. [Google Scholar] [CrossRef]
- Hollingsworth, Bruce. 2003. Non-parametric and parametric applications measuring efficiency in health care. Health care Management Science 6: 203–18. [Google Scholar] [CrossRef]
- Infante-Moro, Juan C. Infante-Moro Alfonso, and Julia Gallardo-Pérez. 2020. Motivational factors that justify the implementation of the Internet of things as a security system in the hotel sector. Revista de Pensamiento Estrategico y Seguridad CISDE 5: 81–91. [Google Scholar]
- Infante-Moro, Juan C. Infante-Moro Alfonso, and Julia Gallardo-Pérez. 2022. Key factors to raise cybersecurity awareness among employees. Revista de Pensamiento Estrategico y Seguridad CISDE 7: 69–79. [Google Scholar]
- Ivanková, V. Viera, Martin Rigelský, Kotulič Rastislav, and Jaroslav Gonos. 2020. The governance of efficient healthcare financing system in OECD countries. Polish Journal of Management Studies 21: 179–94. [Google Scholar] [CrossRef]
- Izón, Germán M., and Chelsea A. Pardini. 2017. Cost inefficiency under financial strain: A stochastic frontier analysis of hospitals in Washington State through the Great Recession. Health Care Management Science 20: 232–45. [Google Scholar] [CrossRef]
- Jetter, Michael, Sabine Laudage, and David Stadelmann. 2019. The intimate link between income levels and life expectancy: Global evidence from 213 years. Social Science Quarterly 100: 1387–403. [Google Scholar] [CrossRef]
- Kadar, Beata, and Regina Zsuzsanna Reicher. 2020. Innovations in health care management: The effect of the pandemic on the labour market change. Marketing and Management of Innovations 4: 120–30. [Google Scholar] [CrossRef]
- Kakabadse, Nada K., Cécile Rozuel, and Linda Lee-Davies. 2005. Corporate social responsibility and stakeholder approach: A conceptual review. International Journal of Business Governance and Ethics 1: 277–302. [Google Scholar] [CrossRef]
- Kang, Jing, Rong Peng, Jung Feng, Junyuan Wei, Zhen Li, Fen Huang, Fu Yu, Xiaorong Su, Yujun Chen, Xianjing Qin, and et al. 2023. Health systems efficiency in China and ASEAN, 2015–2020: A DEA-Tobit and SFA analysis application. BMJ Open 13: e075030. [Google Scholar] [CrossRef] [PubMed]
- Karagiannis, Roxani. 2015. A system-of-equations two-stage DEA approach for explaining capacity utilization and technical efficiency. Annals of Operations Research 227: 25–43. [Google Scholar] [CrossRef]
- Kaya Samut, Pınar, and Reyhan Cafrı. 2016. Analysis of the Efficiency Determinants of Health Systems in OECD Countries by DEA and Panel Tobit. Social Indicators Research 129: 113–32. [Google Scholar] [CrossRef]
- Khan, Muhammad Arshad, and Muhammad Iftikhar Ul Husnain. 2019. Is health care a luxury or necessity good? Evidence from Asian countries. International Journal of Health Economics and Management 19: 213–33. [Google Scholar] [CrossRef]
- Kohl, Sebastian, Fügener Jan Schoenfelder, and Jens O. Brunner Andreas. 2019. The use of Data Envelopment Analysis (DEA) in healthcare with a focus on hospitals. Health Care Management Science 22: 245–86. [Google Scholar] [CrossRef]
- Kujawska, Justyna. 2021. Efficiency of healthcare systems in European countries—The DEA network approach. Quantitative Methods in Economics XIX: 60–70. [Google Scholar] [CrossRef]
- Kulkarni, Lalitagauri. 2016. Health inputs, health outcomes and public health expenditure: Evidence from the BRICS countries. International Journal of Applied Economics 31: 72–84. [Google Scholar]
- Kumbhakar, Subal C., and C. A. Knox Lovell. 2000. Stochastic Frontier Analysis. Cambridge: Cambridge University Press. [Google Scholar]
- Kwilinski, Aleksy. 2023. The Relationship between Sustainable Development and Digital Transformation: Bibliometric Analysis. Virtual Economics 6: 56–69. [Google Scholar] [CrossRef]
- Kwilinski, Aleksy, Katarzyna Szczepańska-Woszczyna, Oleksii Lyulyov, and Tetyana Pimonenko. 2024a. Government Effectiveness and Immigrant Outflows: Their Role in Advancing Greenfield Investment Globally and Regionally. Polish Journal of Management Studies 29: 365–79. [Google Scholar] [CrossRef]
- Kwilinski, Aleksy, Katarzyna Szczepańska-Woszczyna, Oleksii Lyulyov, and Tetyana Pimonenko. 2024b. Digital Public Services: Catalysts for Healthcare Efficiency. Journal of Open Innovation: Technology, Market, and Complexity 10: 100319. [Google Scholar] [CrossRef]
- Kwilinski, Aleksy, Oleksandr Vyshnevskyi, and Henryk Dzwigol. 2020. Digitalization of the EU Economies and People at Risk of Poverty or Social Exclusion. Journal of Risk and Financial Management 13: 142. [Google Scholar] [CrossRef]
- Kwilinski, Aleksy, Peter Merritt, and Lukasz Wroblewski. 2024c. Advancing Sustainable Development Goals through Digital Culture: A Global Research Overview. Cultural Management: Science and Education 8: 61–80. [Google Scholar] [CrossRef]
- Legido-Quigley, Helena, Asgari Nima, Teo Yik Ying, Leung Gabriel, Oshitani Hitoshi, Fukuda Keiji, Cook Alex, Yang Hsu Li, Shibuya Kenji, and David Heymann. 2020. Are high-performing health systems resilient against the COVID-19 epidemic? Lancet 395: 848–50. [Google Scholar] [CrossRef]
- Letunovska, Nataliia, Oleksii Lyulov, and Tetyana Pimonenko. 2024. COVID-19’s impact on the competitiveness of the national health social systems: A comparative analysis of the pre-vaccination and vaccination periods. AIP Conference Proceedings 3033: 020008. [Google Scholar]
- Letunovska, Nataliia, Rafis Abazov, and Yang Chen. 2022. Framing a Regional Spatial Development Perspective: The Relation between Health and Regional Performance. Virtual Economics 5: 87–99. [Google Scholar] [CrossRef]
- Li, Jiannan, and Bocong Yuan. 2019. Understanding the effectiveness of government health expenditure in improving health equity: Preliminary evidence from global health expenditure and child mortality rate. The International Journal of Health Planning and Management 34: e1968–79. [Google Scholar] [CrossRef] [PubMed]
- Liu, Hui, and Kaiyang Zhong. 2022. Relationship between health spending, life expectancy and renewable energy in China: A new evidence from the VECM approach. Frontiers in Public Health 10: 993546. [Google Scholar] [CrossRef] [PubMed]
- Lupu, Dan, and Ramona Tiganasu. 2022. COVID-19 and the efficiency of health systems in Europe. Health Economics Review 12: 14. [Google Scholar] [CrossRef]
- McKeown, Thomas. 1976. The Modern Rise of Population. Cambridge: Academic Press. 168p. [Google Scholar]
- Medeiros, João, and Christoph Schwierz. 2015. Efficiency Estimates of Health Care Systems in the EU. Europen Economy. Economic Papers 549. Available online: https://ec.europa.eu/economy_finance/publications/economic_paper/2015/pdf/ecp549_en.pdf (accessed on 1 February 2024).
- Melnychenko, Oleksandr. 2021. The Energy of Finance in Refining of Medical Surge Capacity. Energies 14: 210. [Google Scholar] [CrossRef]
- Mitchell, Marc, and Lena Kan. 2019. Digital Technology and the Future of Health Systems. Health Systems & Reform 5: 113–20. [Google Scholar] [CrossRef]
- Nakatani, Ryota, Qianqian Zhang, and Isaura Garcia Valdes. 2022. Fiscal Decentralization Improves Social Outcomes When Countries Have Good Governance. In IMF Working Papers. Washington, DC: IMF. [Google Scholar] [CrossRef]
- Nakatani, Ryota, Qianqian Zhang, and Isaura Garcia Valdes. 2024. Expenditure Decentralization and Health Outcomes: The Importance of Governance. The Journal of Federalism 54: 59–87. [Google Scholar] [CrossRef]
- Newhouse, Joseph P. 1994. Frontier estimation: How useful a tool for health economics? Journal of Health Economics 13: 317–22. [Google Scholar] [CrossRef] [PubMed]
- Novignon, Jacob, and Kwasi Gyabaa Tabiri. 2022. Leveraging COVID-19 pandemic response for improved health system financing: Lessons from Ghana. The International Journal of Health Planning and Management 37: 2211–23. [Google Scholar] [CrossRef]
- Obrizan, Maksym, and George L. Wehby. 2018. Health Expenditures and Global Inequalities in Longevity. World Development 101: 28–36. [Google Scholar] [CrossRef]
- Onofrei, Mihaela, Anca-Florentina Vatamanu, Georgeta Vintilă, and Elena Cigu. 2021. Government Health Expenditure and Public Health Outcomes: A Comparative Study among EU Developing Countries. International Journal of Environmental Research and Public Health 18: 10725. [Google Scholar] [CrossRef]
- Orea, Luis, and Subal C. Kumbhakar. 2004. Efficiency measurement using a latent class stochastic frontier model. Empirical Economics 29: 169–18. [Google Scholar] [CrossRef]
- Raghupathi, Viju, and Wullianallur Raghupathi. 2020. The influence of education on health: An empirical assessment of OECD countries for the period 1995–2015. Archives of Public Health 78: 20. [Google Scholar] [CrossRef]
- Rahman, Mohammad Mafizur, Rasheda Khanam, and Maisha Rahman. 2018. Health care expenditure and health outcome nexus: New evidence from the SAARC-ASEAN region. Globalization and Health 14: 113. [Google Scholar] [CrossRef]
- Rajiani, Ismi, and Sebastian Kot. 2020. Javanese Indonesia: Human Resource Management Issues in a Uniquely Collectivist Culture. Cultural Management: Science and Education 4: 9–21. [Google Scholar] [CrossRef]
- Rechel, Bernd. 2019. Funding for public health in Europe in decline? Health Policy 123: 21–26. [Google Scholar] [CrossRef] [PubMed]
- Rokicki, Tomasz, Aleksandra Perkowska, and Marcin Ratajczak. 2021. Differentiation in Healthcare Financing in EU Countries. Sustainability 13: 251. [Google Scholar] [CrossRef]
- Rosko, Michael D., and Ryan L. Mutter. 2008. Stochastic frontier analysis of hospital inefficiency: A review of empirical issues and an assessment of robustness. Medical Care Research and Review: MCRR 65: 131–66. [Google Scholar] [CrossRef]
- Saltman, Richard B. 2018. The impact of slow economic growth on health sector reform: A cross-national perspective. Health Economics, Policy, and Law 13: 382–405. [Google Scholar] [CrossRef] [PubMed]
- Sango-Coke, Elizabeth Yinka, and Murad A. Bein. 2018. The Impact of Healthcare spending on Life Expectancy: Evidence from Selected West African Countries. African Journal of Reproductive Health 22: 64–71. [Google Scholar]
- Sanjeev, Gupta, and Marijn Verhoeven. 2001. The efficiency of government expenditure: Experiences from Africa. Journal of Policy Modelling 23: 433–467. [Google Scholar] [CrossRef]
- Sarafidis, Vasilis, and Neville Weber. 2015. A partially heterogeneous framework for analysing panel data. Oxford Bulletin of Economics and Statistics 77: 274–96. [Google Scholar] [CrossRef]
- Sarker, Abdur Razzaque, Marufa Sultana, Khorshed Alam, Nausad Ali, Nurnabi Sheikh, Raisul Akram, and Alec Morton. 2021. Households’ out-of-pocket expenditure for healthcare in Bangladesh: A health financing incidence analysis. The International Journal of Health Planning and Management 36: 2106–117. [Google Scholar] [CrossRef]
- Sen, Anindya. 2005. Is Health Care a Luxury? New Evidence from OECD Data. International Journal of Health Care Finance and Economics 5: 147–64. [Google Scholar] [CrossRef]
- Senaratne, Malshini, Andrew Zimbroff, and Jared T. Stevens. 2021. An instrument to assess Blue Economy entrepreneurship eco-systems: A case study from the Seychelles. Journal of the Indian Ocean Region 17: 205–23. [Google Scholar] [CrossRef]
- Shahbaz, Muhammad, Muhammad Shafiullah, and Mantu K. Mahalik. 2019. The dynamics of financial development, globalisation, economic growth and life expectancy in sub-Saharan Africa. Australian Economic Papers 58: 444–79. [Google Scholar] [CrossRef]
- Shimul, Shafiun Nahin, Muhammad Ihsan Kabir, and Fariha Kadir. 2023. Resiliency of healthcare expenditure to income shock: Evidence from dynamic heterogeneous panels. Frontiers in Public Health 11: 1085338. [Google Scholar] [CrossRef] [PubMed]
- Skinner, Jonathan. 1994. What do stochastic frontier cost functions tell us about inefficiency? Journal of Health Economics 13: 323–28. [Google Scholar] [CrossRef]
- Smiianov, Vladyslav, Oleksii Lyulyov, Tetyana Pimonenko, Tetyana Andrushchenko, Serhii Sova, and Natalia Grechkovskaya. 2020. The impact of the pandemic lockdown on air pollution, health and economic growth: System dynamics analysis. Wiadomości Lekarskie LXXIII: 2332–8. [Google Scholar] [CrossRef]
- Stata Software. 2024. Available online: https://www.stata.com/ (accessed on 1 February 2024).
- Stefko, Robert, Beata Gavurova, and Kristina Kocisova. 2018. Healthcare efficiency assessment using DEA analysis in the Slovak Republic. Health Economics Review 8: 6. [Google Scholar] [CrossRef]
- Sülkü, Seher Nur, Alper Mortaş, and Aziz Küçük. 2023. Measuring efficiency of public hospitals under the impact of COVID-19: The case of Türkiye. Cost Effectiveness and Resource Allocation 21: 70. [Google Scholar] [CrossRef]
- Szczepańska-Woszczyna, Katarzyna, and Sylwia Gatnar. 2022. Key Competences of Research and Development Project Managers in High Technology Sector. Forum Scientiae Oeconomia 10: 107–30. [Google Scholar] [CrossRef]
- Szczepańska-Woszczyna, Katarzyna, Vysochyna Alina, and Aleksy Kwilinski. 2024. Public Health Efficiency and Country Competitiveness: Empirical Study in Pre-Pandemic and Pandemic Periods. Forum Scientiae Oeconomia 12: 151–66. [Google Scholar] [CrossRef]
- Teoh, Jeremy Yuen-Chun, Junjie Huang, Wendy Yuet-Kiu Ko, Veeleah Lok, Peter Choi, Chi-Fai Ng, Shomik Sengupta, Hugh Mostafid, Ashish M. Kamat, Peter C. Black, and et al. 2020. Global trends of bladder cancer incidence and mortality, and their associations with tobacco use and gross domestic product per capita. European Urology 78: 893–906. [Google Scholar] [CrossRef]
- Tigga, Nutan Shashi, and Udaya S. Mishra. 2015. On measuring technical efficiency of the health system in India: An application of data envelopment analysis. Journal of Health Management 17: 285–98. [Google Scholar] [CrossRef]
- Ullah, Irfan, Assad Ullah, Sher Ali, Petra Poulova, Ahsan Akbar, Muhammad Haroon Shah, Alam Rehman, Muhammad Zeeshan, and Fakhr E. Alam Afridi. 2021. Public Health Expenditures and Health Outcomes in Pakistan: Evidence from Quantile Autoregressive Distributed Lag Model. Risk Management and Healthcare Policy 14: 3893–909. [Google Scholar] [CrossRef]
- Vargas Bustamante, Arturo, and Sandhya V. Shimoga. 2018. Comparing the Income Elasticity of Health Spending in Middle-Income and High-Income Countries: The Role of Financial Protection. International Journal of Health Policy and Management 7: 255–63. [Google Scholar] [CrossRef] [PubMed]
- Veckalne, Regina, Martins Kapustins, and Tatjana Tambovceva. 2023. Smart Cities, Green Diets: How the Lucy Veg App Supports Valencia’s Vegan Community and Contributes to SDGs. Virtual Economics 6: 7–22. [Google Scholar] [CrossRef] [PubMed]
- Waitzberg, Ruth, Wilm Quentin, Erin Webb, and Sherry Glied. 2021. The Structure and Financing of Health Care Systems Affected How Providers Coped With COVID-19. The Milbank Quarterly 99: 542–64. [Google Scholar] [CrossRef]
- Wang, Fuhmei. 2015. More Health Expenditure, Better Economic Performance? Empirical Evidence From OECD Countries. Inquiry: A Journal of Medical Care Organization, Provision and Financing 52: 0046958015602666. [Google Scholar] [CrossRef]
- Wei, Xiaolong, Tao Wang, Yang Chen, Oleksii Lyulyov, and Tetyana Pimonenko. 2023. The Effects of Population Aging on Sports Industry Development: The Mediating Effect of Technological Innovation. International Journal of Environmental Research and Public Health 20: 2085. [Google Scholar] [CrossRef] [PubMed]
- World Bank. 2024. Data Bank. Health Nutrition and Population Statistics. Available online: http://databank.worldbank.org/data/home.aspx (accessed on 1 February 2024).
- Wróblewski, Łukasz, and Marcin Lis. 2021. Marketing Mix of Cultural Institutions on the Cross-Border Market of a City Divided by a Border—An Analysis and Evaluation. Polish Journal of Management Studies 23: 555–72. [Google Scholar] [CrossRef]
- Xu, Wangzi, and Jia Lin. 2022. Fiscal Decentralization, Public Health Expenditure and Public Health–Evidence From China. Frontiers in Public Health 10: 773728. [Google Scholar] [CrossRef]
- Ye, Liping, and Xinping Zhang. 2018. Nonlinear Granger Causality between Health Care Expenditure and Economic Growth in the OECD and Major Developing Countries. International Journal of Environmental Research and Public Health 15: 1953. [Google Scholar] [CrossRef]
- Zeng, Meng, and Lu Niu. 2023. Spatiotemporal patterns of healthy life expectancy and the effects of health financing in West African countries, 1995–2019: A Spatial Panel Modelling Study. Journal of Global Health 13: 04123. [Google Scholar] [CrossRef] [PubMed]
- Zeng, Wu, Yao Yao, Hélène Barroy, Jonathan Cylus, and Guohong Li. 2020. Improving fiscal space for health from the perspective of efficiency in low- and middle-income countries: What is the evidence? Journal of Global Health 10: 020421. [Google Scholar] [CrossRef] [PubMed]

| Country | Life | Cap | Dom_gov | Dom_prv | Ext | OoP |
|---|---|---|---|---|---|---|
| Switzerland | 82.19 | 0.0000 | 31.5796 | 68.4227 | 0.0000 | 26.9501 |
| Iceland | 81.91 | 0.2236 | 81.3416 | 18.6598 | 0.0000 | 17.3290 |
| Italy | 81.83 | 0.0000 | 75.6094 | 24.3909 | 0.0000 | 22.7787 |
| Spain | 81.65 | 0.2062 | 71.7150 | 28.2852 | 0.0000 | 21.9894 |
| Sweden | 81.42 | 0.5058 | 83.5850 | 16.4150 | 0.0000 | 15.3105 |
| France | 81.35 | 0.5156 | 72.6140 | 27.3874 | 0.0000 | 9.0714 |
| Norway | 81.14 | 0.5236 | 84.3744 | 15.6232 | 0.0071 | 15.3263 |
| Netherlands | 80.44 | 1.9915 | 67.4390 | 32.5546 | 0.0076 | 10.1740 |
| Austria | 80.41 | 0.6741 | 72.8166 | 27.1836 | 0.0000 | 19.0095 |
| Ireland | 80.25 | 0.4372 | 75.5215 | 24.4804 | 0.0000 | 12.6420 |
| Greece | 80.22 | 0.2669 | 58.8503 | 40.9447 | 0.2393 | 34.7300 |
| Finland | 80.14 | 0.3712 | 78.5303 | 21.4700 | 0.0040 | 18.8663 |
| Belgium | 80.04 | 0.0000 | 75.7000 | 24.3010 | 0.0000 | 19.5197 |
| United Kingdom | 80.04 | 0.3451 | 80.0326 | 19.9592 | 0.0099 | 15.6671 |
| Germany | 79.91 | 0.0000 | 76.6903 | 23.3096 | 0.0000 | 13.3511 |
| Portugal | 79.44 | 0.0000 | 64.5329 | 35.4241 | 0.0569 | 27.1651 |
| Denmark | 79.29 | 0.5193 | 83.8005 | 16.1995 | 0.0000 | 14.2786 |
| Slovenia | 79.15 | 0.4116 | 71.7338 | 28.2664 | 0.0000 | 12.4559 |
| Albania | 77.53 | 0.1607 | 47.4298 | 49.9479 | 2.7105 | 49.9228 |
| Czechia | 77.33 | 0.1664 | 83.9111 | 16.1065 | 0.0000 | 13.3975 |
| Croatia | 76.42 | 0.2731 | 82.8753 | 17.1258 | 0.0020 | 12.9097 |
| Bosnia and Herzegovina | 76.26 | 0.1921 | 64.6470 | 34.0852 | 1.3183 | 33.8862 |
| Poland | 76.12 | 0.3977 | 69.9928 | 29.9852 | 0.0492 | 24.7800 |
| Slovak Republic | 75.44 | 0.3245 | 77.6439 | 22.3793 | 0.0000 | 19.6066 |
| Estonia | 75.04 | 0.2331 | 75.2164 | 24.4618 | 0.3769 | 22.3006 |
| North Macedonia | 74.72 | 0.2328 | 59.5186 | 39.2516 | 1.2611 | 38.5556 |
| Hungary | 74.27 | 0.2339 | 68.0203 | 31.9798 | 0.0000 | 27.3889 |
| Serbia | 74.10 | 0.2426 | 61.9599 | 37.3420 | 0.8543 | 34.5619 |
| Bulgaria | 73.50 | 0.1261 | 56.8769 | 43.1231 | 0.0000 | 41.6384 |
| Romania | 73.47 | 0.2809 | 79.1402 | 20.7843 | 0.1119 | 19.8208 |
| Lithuania | 73.32 | 0.2514 | 67.1325 | 32.6969 | 0.1752 | 30.1525 |
| Latvia | 73.09 | 0.4920 | 57.8030 | 42.0944 | 0.2350 | 40.0571 |
| Ukraine | 69.85 | 0.2695 | 51.3291 | 48.0014 | 0.6747 | 44.8947 |
| Moldova | 68.97 | 0.5405 | 50.5090 | 44.0483 | 5.4609 | 43.2061 |
| Average | 77.66 | 0.3356 | 69.4257 | 30.1968 | 0.3987 | 24.2263 |
| Indicator | Cluster 1 | Cluster 2 | Cluster 3 |
|---|---|---|---|
| Capital health expenditure (% of GDP) | 0.3502 | 0.2530 | 1.9915 |
| Domestic general government health expenditure (% of current health expenditure) | 72.8606 | 67.7985 | 67.4390 |
| Domestic private health expenditure (% of current health expenditure) | 26.7790 | 31.7985 | 32.5546 |
| External health expenditure (% of current health expenditure) | 0.3882 | 0.4217 | 0.0076 |
| Out-of-pocket expenditure (% of current health expenditure) | 23.7097 | 25.1233 | 10.1740 |
| Healthcare financing technical efficiency, units | 0.6639 | 0.6562 | 0.6808 |
| Variables | Without Lag | 1-Year Lag | 2-Years Lag | 3-Years Lag |
|---|---|---|---|---|
| Cap | 2.0304 ** (0.831) | 1.9254 ** (0.8492) | 2.2091 *** (0.851) | 2.4983 *** (0.8479) |
| Dom_gov | −1.5362 * (0.7956) | −0.6093 (0.8228) | 1.1957 (0.8302) | 1.6588 ** (0.8367) |
| Dom_prv | −1.1701 (0.7946) | −0.222 (0.8217) | 1.6207 * (0.8304) | 2.0871 ** (0.8388) |
| Ext | −1.8984 ** (0.8253) | −1.0048 (0.8564) | 0.8078 (0.862) | 1.2793 (0.8687) |
| Oop | −0.4345 *** (0.0637) | −0.4484 *** (0.0658) | −0.476 *** (0.0666) | −0.4532 *** (0.0651) |
| R2 | 0.4192 | 0.3853 | 0.3469 | 0.3099 |
| Prob > chi2 | 0.0000 | 0.0000 | 0.0000 | 0.0000 |
| Obs. | 242 | 231 | 220 | 209 |
| Variables | Without Lag | 1-Year Lag | 2-Years Lag | 3-Years Lag |
|---|---|---|---|---|
| Cap | 2.0699 *** (0.6081) | 1.6258 *** (0.625) | 1.3835 ** (0.6534) | 1.2054 * (0.6556) |
| Dom_gov | −1.545 ** (0.7038) | −0.9705 (0.7964) | 0.739 (0.9676) | 4.4009 *** (1.3318) |
| Dom_prv | −1.3771 ** (0.6993) | −0.81 (0.7918) | 0.8859 (0.9627) | 4.5147 *** (1.3251) |
| Ext | −1.5469 ** (0.7098) | −0.9261 (0.8024) | 0.7668 (0.9734) | 4.4342 ** (0.8687) |
| Oop | −0.163 *** (0.0433) | −0.1476 *** (0.0446) | −0.1262 *** (0.0458) | −0.0963 ** (0.0455) |
| R2 | 0.4740 | 0.3402 | 0.3146 | 0.3099 |
| Prob > chi2 | 0.0000 | 0.0001 | 0.0016 | 0.0001 |
| Obs. | 484 | 462 | 440 | 418 |
| Variables | Without Lag | 1-Year Lag | 2-Years Lag | 3-Years Lag |
|---|---|---|---|---|
| Cap | 1.5724 *** (0.1933) | 1.3785 *** (0.2501) | 1.449 *** (0.2374) | 1.4066 *** (0.6556) |
| Dom_gov | −7.0886 *** (1.6836) | −6.4607 *** (1.2071) | −4.9285 ** (1.5454) | −4.5332 ** (1.7634) |
| Dom_prv | −7.9105 *** (1.7244) | −6.2392 *** (1.2564) | −4.745 ** (1.587) | −4.3226 ** (1.7993) |
| Ext | −16.3418 *** (2.2485) | −12.0143 *** (2.446) | −11.4101 *** (2.6268) | −10.6528 *** (2.3652) |
| Oop | −0.2027 ** (0.0899) | −0.1151 (0.1176) | −0.0373 (0.1125) | 0.0166 (0.1106) |
| R2 | 0.9495 | 0.9286 | 0.9455 | 0.9503 |
| Prob > chi2 | 0.0000 | 0.0000 | 0.0000 | 0.0000 |
| Obs. | 22 | 21 | 20 | 19 |
Disclaimer/Publisher’s Note: The statements, opinions and data contained in all publications are solely those of the individual author(s) and contributor(s) and not of MDPI and/or the editor(s). MDPI and/or the editor(s) disclaim responsibility for any injury to people or property resulting from any ideas, methods, instructions or products referred to in the content. |
© 2024 by the authors. Licensee MDPI, Basel, Switzerland. This article is an open access article distributed under the terms and conditions of the Creative Commons Attribution (CC BY) license (https://creativecommons.org/licenses/by/4.0/).
Share and Cite
Kwilinski, A.; Vysochyna, A. Efficiency of Healthcare Financing: Case of European Countries. Int. J. Financial Stud. 2024, 12, 87. https://doi.org/10.3390/ijfs12030087
Kwilinski A, Vysochyna A. Efficiency of Healthcare Financing: Case of European Countries. International Journal of Financial Studies. 2024; 12(3):87. https://doi.org/10.3390/ijfs12030087
Chicago/Turabian StyleKwilinski, Aleksy, and Alina Vysochyna. 2024. "Efficiency of Healthcare Financing: Case of European Countries" International Journal of Financial Studies 12, no. 3: 87. https://doi.org/10.3390/ijfs12030087