Article

Microcredit Pricing Model for Microfinance Institutions under Basel III Banking Regulations †

by
Patricia Durango-Gutiérrez
1,
Juan Lara-Rubio
2,*,
Andrés Navarro-Galera
2 and
Dionisio Buendía-Carrillo
2
1
Department of Finance, School of Finance, Economics and Government, EAFIT University, Medellin 050001, Colombia
2
Department of Financial Economics and Accounting, Faculty of Economics and Business Studies, University of Granada, 18071 Granada, Spain
*
Author to whom correspondence should be addressed.
An early version of this paper was presented at the 2nd International Conference on Sustainable Finance. Microfinance for sustainable development, held in Granada (Spain), 28–29 September 2023.
Int. J. Financial Stud. 2024, 12(3), 88; https://doi.org/10.3390/ijfs12030088
Submission received: 16 July 2024 / Revised: 22 August 2024 / Accepted: 26 August 2024 / Published: 3 September 2024

Abstract

:
Purpose. The purpose of this research is to propose a tool for designing a microcredit risk pricing strategy for borrowers of microfinance institutions (MFIs). Design/methodology/approach. Considering the specific characteristics of microcredit borrowers, we first estimate and measure microcredit risk through the default probability, applying a parametric technique such as logistic regression and a non-parametric technique based on an artificial neural network, looking for the model with the highest predictive power. Secondly, based on the Basel III internal ratings-based (IRB) approach, we use the credit risk measurement for each borrower to design a pricing model that sets microcredit interest rates according to default risk. Findings. The paper demonstrates that the probability of default for each borrower is more accurately adjusted using the artificial neural network. Furthermore, our results suggest that, given a profitability target for the MFI, the microcredit interest rate for clients with a lower level of credit risk should be lower than a standard, fixed rate to achieve the profitability target. Practical implications. This tool allows us, on the one hand, to measure and assess credit risk and minimize default losses in MFIs and, secondly, to promote their competitiveness by reducing interest rates, capital requirements, and credit losses, favoring the financial self-sustainability of these institutions. Social implications. Our findings have the potential to make microfinance institutions fairer and more equitable in their lending practices by providing microcredit with risk-adjusted pricing. Furthermore, our findings can contribute to the design of government policies aimed at promoting the financial and social inclusion of vulnerable people. Originality. The personal characteristics of microcredit clients, mainly reputation and moral solvency, are crucial to the default behavior of microfinance borrowers. These factors should have an impact on the pricing of microcredit.

1. Introduction

The microfinance industry has been part of the most important international development policies in recent decades (Bettoni et al. 2023). Traditionally, microfinance institutions have traditionally provided resources to groups of people excluded from the traditional financial system through small loans as poverty alleviation, as well as boosting women’s empowerment in the labor force (Pietrapiana et al. 2021; Rahayu 2020; Karlan and Zinman 2011).
Previous research has considered the creation of microenterprises in the most disadvantaged regions as a way to combat poverty by increasing the innovation and competitiveness of an economy and reducing the unemployment rate (Aguilar and Portilla 2019; Wennekers et al. 2005). However, microentrepreneurs have traditionally experienced great difficulties in accessing savings and credit services due to a lack of collateral and assets with which to raise finance, thus preventing them from prospering through their business projects.
Given that a significant percentage of the world’s population is at risk of financial exclusion, it is useful and timely to analyze idiosyncratic and systemic risk factors that may increase the probability of credit default or, on the contrary, mitigate this risk.
In order to measure these risks, the standards issued by the BCBS are considered the main benchmark in the international financial system. The Basel III regulation (BCBS 2017) represents a major advance for the international financial system, helping ensure the solvency and stability of credit institutions by facilitating the assessment of financial risks associated with loan recipients.
The implementation of Basel III standards globally has progressed significantly but still faces challenges and differences in their full and uniform adoption across jurisdictions (FSB 2023). Since the beginning of 2023, most member countries of the Basel Committee on Banking Supervision have made progress in implementing the pending Basel III standards, especially those related to minimum capital requirements, credit risk, and market risk. However, two-thirds of financial systems have not yet published draft rules or are in the process of implementing these standards, while about one-third have already implemented most or all of the Basel III standards. In fact, G20 countries have taken the lead, and most of them are now Basel compliant, which will mitigate the impact of future banking crises as consistent implementation would bring benefits to both G20 and non-G20 countries.
Traditionally, credit analysis in MFIs is performed through a specialized credit methodology for the sector (Concha 2009). However, since the 1990s, credit assessment in MFIs has been carried out by credit scoring models associated with the subjective decision of credit analysts to assess the repayment capacity of the debtor (Rayo et al. 2010). Against this background, previous research in recent years has examined the factors that influence the amount of microcredit granted, including macroeconomic risks and borrower-specific idiosyncratic variables, to determine the causes of MFI delinquency (Asencios et al. 2023; Altinbas and Akkaya 2017; Blanco et al. 2013; Rayo et al. 2010).
All of these have been developed in Latin and Central America. However, we have found that the identification of microcredit risk factors in a country like Guatemala has not been sufficiently explored, considering that this is a country with a microfinance tradition.
Guatemala is a very appropriate country for our empirical study because, in this country, the microfinance industry has grown remarkably in recent years. Specifically, the growth rate of microcredit granting was 16.8% in 2020 and 53% in 2021 compared to the previous year (Bank of Guatemala 2021). Also in Guatemala, during the COVID-19 pandemic period, MFIs managed to lower their interest rates and maturities for their clients, as well as advance in the digital payments ecosystem (EIU 2020).
Since 2016, the Law of Microfinance Entities and Non-Profit Microfinance Entities (through Savings and Credit Microfinance Institutions, Investment and Credit Micro-finance Institutions, and Non-Profit Microfinance Institutions) has intervened in the financial system in the country’s microfinance industry, prohibiting MFIs from taking deposits and issuing debt but enabling them to offer microcredits and other non-savings financial products. In Guatemala, MFIs held a portfolio of USD 2419 million in 2021 (DGRV 2022), and in 2017, at least 44% of adults had a financial product, which places Guatemala as one of the best financial inclusion environments globally (Findevgateway 2022).
In parallel, international organizations argue that Guatemala still has a less developed financial system compared to other neighboring countries or the rest of the world (UN 2019; ECLAC 2009; IDB 2020), which motivates Guatemalan MFIs to develop global and gender financial inclusion projects with savings and credit products for vulnerable groups with difficulties in accessing traditional banking intermediation (Cepeda et al. 2021; Brau et al. 2009). This socio-economic context motivates the choice of Guatemala for our empirical study.
On the other hand, it is common practice for MFIs to charge high interest rates on their microloans, as shown by research on traditional and Islamic microfinance (Wulandari and Pramesti 2021), which hinders access to the credit market as a policy of global financial inclusion (Roa et al. 2022), making it necessary to reduce interest rates if microfinance is to continue to be relied upon as an effective means of combating poverty (Al-Azzam and Parmeter 2021). Indeed, several studies have analyzed the determinants of interest rates and credit risk. Mohamed and Elgammal (2023) and Maudos and De Guevara (2004) analyzed bank efficiency; Saunders and Schumacher (2000) studied solvency standards; and Lepetit et al. (2008) incorporated product diversification. However, previous literature has not studied tools that set risk-adjusted interest rates according to the BCBS standards applied to the microfinance industry, which would allow MFIs to fulfill their social mission, manage their interest rates, and promote financial self-sustainability more effectively and efficiently.
Furthermore, the measurement of intermediation margins or profitability targets is of great importance, as these constitute an important variable for the pricing of credit operations in the financial sector and MFIs. In addition, measuring the risks of these operations needs to correctly describe the business characteristics of microentrepreneurs, generally represented by low collateral, low levels of assets, few transaction records of their businesses, and a high informal labor force (Kalita et al. 2022). Finally, examining the consistency of their capital, liquidity, assets, and liabilities according to their risk profile is essential for assigning risk-adjusted interest rates to each borrower (Balushi et al. 2018; Ruthenberg and Landskroner 2008).
Moreover, MFI managers in Guatemala and the rest of Latin America do not currently have a sound methodological procedure that allows them to calculate the appropriate interest rate for the specific circumstances of each borrower, as is the case in traditional banking (Okello Candiya Bongomin and Munene 2020). In this regard, previous literature has not studied tools that set risk-adjusted interest rates according to the BCBS standards applied to the microfinance sector, which would allow MFIs to fulfill their social mission, manage their interest rates, and promote financial self-sustainability more effectively and efficiently.
A prior step to the design of a pricing model for the allocation of risk-adjusted interest rates for each borrower is the measurement of credit risk for each applicant, which requires a credit scoring model. According to West (2000), credit scoring systems provide important advantages to financial institutions by reducing the cost of the customer credit assessment process, improving cash flow, streamlining credit decisions, and allowing close monitoring of bad debts.
From this motivation, in our study we seek to generate new findings on default risk predictions and the subsequent setting of risk-adjusted interest rates in MFIs. The main objective of this study is to propose a tool for MFIs to price microloans and capital requirements based on a Basel III IRB approach (BCBS 2017). To this end, we employ a credit scoring design using a multilayer perceptron (MLP) artificial neural network model to calculate the probability of default. In addition, we compare the performance of the above model with another IRB model that determines the probability of default using the logistic regression (LR) technique. To achieve the proposed objectives, we use a large sample of a Guatemalan MFI containing financial and non-financial variables from almost 4550 borrowers over the period 2019–2021. Finally, we apply the risk-adjusted interest rate setting model to three clients with different risk profiles.
This research objective is novel and advances on previous literature for two reasons. First, the sample comes from an MFI in an emerging country where the subject matter has not received the necessary attention in previous research. Second, the methodology used, based on Basel III regulations, logistic regression, and neural networks, has been rarely used so far to study default and the subsequent application of a pricing tool in MFIs, which will allow us to achieve more accurate and robust results than those obtained so far.
Our findings, in addition to advancing the conclusions of previous literature, could be useful for MFI managers, financial analysts, academics, regulators, policymakers, and those applying for microcredit to finance a business project, especially in periods of emerging crises such as the one caused by the COVID 19 pandemic (Badr El Din 2022).
To achieve our objective, we have structured the paper as follows: in Section 2, we describe the dataset and define the dependent variable and the independent variables needed for the research. Section 3 presents the research methodology and experimental design. In Section 4, we provide the results and a discussion of the results. Finally, we draw some conclusions about the research.

2. Data and Variables

2.1. Sample Selection

We use a microcredit dataset from a microfinance institution in Guatemala with 4550 (2182 failed and 2368 non-failed) microenterprise loans from a Guatemalan MFI called Cooperativa Guayacán for the period 2019–2021, with client information on: (a) personal characteristics; (b) economic and financial ratios of their microenterprise; (c) characteristics of the current financial operation; and (d) variables related to the macroeconomic context.
The choice of this Guatemalan MFI is appropriate for the objectives of our research for the following reasons: (a) it provides sufficient information on the payment behaviour of clients, both qualitative and quantitative, with socio-demographic, financial and macroeconomic data (Durango-Gutiérrez et al. 2023; Blanco et al. 2013; Van Gool et al. 2012; Karlan and Zinman 2011); (b) by focusing on a three-year study period, we can examine the impact of specific variables on MFI loan growth (Shahriar and Garg 2017; Shahriar et al. 2016); (c) the institution has provided us with a randomly selected sample representing 52% of its total business microcredit portfolio in the period analysed, making it representative and reliable in obtaining results.
We have also separated our database into two sub-samples (a test sample with 75% and a validation sample with 25% of the cases). After this segmentation, the configuration of the parameters in the construction of the models has been carried out following a 10-fold cross-validation procedure (Hastie et al. 2009).

2.2. Dependent Variable

In line with previous studies (Durango-Gutiérrez et al. 2023; Blanco et al. 2013; Rayo et al. 2010; Schreiner 2002), in this paper the dependent variable in the proposed statistical model is a dummy variable with a value of 1 for loans that are at least 30 days late in repayment, which is an additional cost for the MFI, and a value of 0 for loans that are not 30 days late in repayment, which is an additional cost for the lender. In line with previous studies, a microloan that is at least 30 days late in repayment is defined as a non-performing loan.

2.3. Independent Variables

Table 1 shows the independent (or explanatory) variables used in this study. As can be seen, following previous research, we have structured these variables into four types (personal characteristics of the borrower; economic and financial ratios of their microenterprise; characteristics of the current financial operation; and variables related to the macroeconomic context), which we have grouped into two classes: idiosyncratic variables and systematic variables.
Idiosyncratic variables are specific to the client profile and are classified into non-financial variables, loan variables, and ratios corresponding to financial information (Blanco-Oliver et al. 2016; Irimia-Diéguez et al. 2015).
Concerning the gender variable, previous literature (Blanco-Oliver et al. 2024; Lara-Rubio et al. 2024; Abdullah and Quayes 2016; Zeballos et al. 2014; Blanco et al. 2013) suggests that, in microfinance, women default less than men. Therefore, we expect to obtain a negative sign in the beta estimator. Regarding marital status, Beisland et al. (2019) and Cozarenco and Szafarz (2018) found that clients of financial institutions generate greater trust and responsibility when they belong to a family unit, which could contribute to reducing the probability of default. Therefore, we expect a negative sign for married status.
Moreover, research by Gutiérrez-Nieto et al. (2016) and Rayo et al. (2010) shows that clients residing in urban areas have a higher repayment capacity, so their likelihood of repaying their loans should increase relative to clients living in more depressed rural areas. Therefore, we expect to obtain a negative sign in the estimator of the zone variable. On the other hand, Durango-Gutiérrez et al. (2023) and Van Gool et al. (2012) identify the employment status of the client as a factor that may influence the PD of microcredit clients, arguing that the self-employed is a lower default risk client due to their greater experience with MFIs (Newman et al. 2014).
According to Blanco et al. (2013), there is no empirical evidence on the relationship between the age variable and the probability of default, so the expected sign of the estimator of this variable cannot be determined. The same is true for the sector variable, where there is also no empirical evidence that, in microfinance, one sector is riskier than another in meeting payment obligations. However, we think that the analysis of these variables is interesting in microfinance because they could affect the repayment capacity of clients.
According to Lin et al. (2017) and Elloumi and Kammoun (2013), default risk is reduced when MFI clients have a higher level of education, so we expect to obtain a negative sign for the Ed_Level estimator. Lara-Rubio et al. (2017) argue that the seniority of the MFI-client relationship implies that the bank knows in detail the payment history of a client, and thus a higher number on the old variable would contribute to reducing the probability of default. Likewise, the Cred_Grant variable is expected to have a negative sign in the estimator for the same reasons as the old variable.
In line with Lara-Rubio et al. (2017) and Durango-Gutiérrez et al. (2023), clients who have been denied loans in the past are associated with a higher risk of financial distress. Thus, we expect the sign of the variable Denied_Cred to be positive. Also, the variable Current_Cred reflects the client’s current level of indebtedness to the MFI. According to research by Durango et al. (2022) and Blanco et al. (2013), there is a direct relationship between a client’s current loans and the probability of delayed repayment, so we expect a positive sign in the estimator. Variables Delay and Delay_Av are closely linked to the likelihood of default, so we predict a positive coefficient for their estimators.
Financial ratios have frequently been used to classify bank clients. The first ratio (R1) indicates the number of times income exceeds the total assets of the microcredit client. Therefore, we expect a negative sign in the estimator. The second financial ratio (R2) measures the liquidity of the microenterprise. In this respect, the higher its value, the lower the probability of default that could be expected. The third financial ratio (R3) measures the ratio between the amount of debt and equity. A high amount of debt increases the probability of default, so we expect a positive sign in the estimator. Complementary to the previous ratio, (R4) represents the percentage of liabilities that microenterprises have in their financial structure. We believe that a high level of liabilities negatively impacts microentrepreneurs’ ability to repay, so we anticipate a positive coefficient in the estimator. The fifth financial ratio (R5) measures the return on assets (ROAs). A higher return on assets should help reduce the probability of default. Therefore, a negative sign the estimator of this variable is expected. Finally, R6 measures the return on equity (ROE), i.e., the return on ownership of the firm.
Regarding loan variables, we suggest that loans for asset acquisition carry a higher risk compared to working capital loans. This is because recovering assets through depreciation takes a longer time (Mustapa et al. 2018). In turn, the literature on credit risk broadly supports the idea that banks that lend money on a long-term basis bear a higher counterparty risk than banks that lend on a short-term basis. Therefore, we opt for a positive coefficient on the duration variable.
Moreover, previous research on credit risk in microfinance suggests that smaller loan amounts are associated with lower PD (Durango-Gutiérrez et al. 2023; Vogelgesang 2003; Viswanathan and Shanthi 2017), so we expect to obtain a positive sign for the amount variable, defined as the amount granted in current currency.
With respect to the interest_rate, a high rate implies greater difficulties in repaying the loan. Therefore, we expect a positive estimator. Also, MFIs generally require collateral when a borrower has previously defaulted (Maes and Reed 2012; Rayo et al. 2010). A positive sign is expected in the estimator for the guarantee variable.
Finally, the forecast variable, which according to Cubiles-De-La-Vega et al. (2013) and Blanco et al. (2013) is an important, albeit subjective, factor in determining microcredit risk, reflects the agent’s personalized knowledge of the borrower. According to the definition of the variable, we expect to obtain a positive sign for this estimator.
The final group of factors consists of systematic variables, which enhance the traditional default risk analysis by accounting for the direct link between customer delinquency and the economic cycle (Lara-Rubio et al. 2024; Castro et al. 2022).
The GDP and CPI variables have a direct relationship with PD (Shahriar and Garg 2017), with a negative sign expected in the GDP estimator and a positive sign in the CPI estimator.
Similarly, an increase in the value of the local currency, in this case the Quetzal against the US dollar (ER), would increase PD, and an increase in the unemployment rate (UE) could reduce the probability of default. The macroeconomic variables considered are calculated using the following expression:
Δ V M i , j = V M i + j V M i Δ V M i
where:
  • ∆VMi,j: rate of change of the macroeconomic variable under consideration.
  • VM: macroeconomic variable under consideration.
  • i: m time of granting the loan.
  • j: duration of the microcredit.

3. Research Methodology and Experimental Design

3.1. Binary Logistic Regression Model

In accordance with the structure and characteristics of our sample with a significant number of categorical explanatory variables, we selected binary logistic regression as a parametric technique to construct a model whose response or dependent variable is a dummy variable with a value of zero (0) when the customer is a payer in the periodic repayment of the debt and one (1) when the customer defaults according to the criteria defined in the section on the dependent variable.
Thus, the logistic regression model can be formulated as follows:
l o g P D Y i = 1 X i 1 P D Y i = 1 X i = α ^ + β ^ 1 · X 1 + β ^ 2 · X 2 + + β ^ N · X N = α ^ + i = 1 N β ^ i · X i  
where PD(Yi = 1|Xi) is the probability of occurrence of the event of interest, in our case, that the microcredit client defaults.
Maximum likelihood estimation (MLE) transforms the dependent variable into a log function, estimates what the coefficients should be, determines the change in the coefficients to maximize likelihood, and has a linear relationship with the natural logarithm of probabilities (ODDS) through an interactive process. Thus, given the value of the independent variables, the probability of default can be calculated directly as follows:
P D Y i = 1 X i = e α ^ + i = 1 N β ^ i · X i 1 + e α ^ + i = 1 N β ^ i · X i
In addition to obtaining consistent estimates of the probability of default, the Logit model makes it possible to identify the risk factors that explain default and their influence or relative weight on the probability of default occurring. In addition, these estimates can be carried out at different levels of disaggregation, including the estimation of probabilities for the analysis of individual microcredits considered individually.
This type of model results in a percentage that makes it possible to rank the clients in the loan portfolio from higher to lower risk. Having a portfolio quality ranking allows, through a stratification method, to match the index with classification criteria that assign a credit rating to each loan.

3.2. Artificial Neural Network Model

Artificial neural networks (ANNs) are mathematical computational models that attempt to mimic how the brain works and how it processes information. They are categorized within the non-parametric techniques of credit scoring as systems with the ability to learn through training. Furthermore, according to Blanco et al. (2013), ANNs constitute a computational paradigm that provides a wide variety of non-linear mathematical models, useful to address a wide range of statistical problems.
In our research, following the recommendations of research supporting a particular architecture, we selected the multilayer perceptron (MLP) as a reference procedure in non-parametric models for calculating probabilities (Bishop 1995) and for solving problems in commercial studies (Montevechi et al. 2024; Vellido et al. 1999).
Based on these studies, we have used a three-layer perceptron where the output layer is formed by a node that provides an estimate of the probability of default in MFI clients. This value is calculated with the logistic activation function g (u) = eu/(eu + 1), also used in the hidden layer {vih, i = 0, 1, 2, …, p, h = 1, 2, …, H}, as the synaptic weights for connections between p-size input and the hidden layer, and {wh, h = 0, 1, 2, …, H} as the synaptic weights for the connections between the hidden nodes and the output node. The neural network output from an input vector (x1, …, xp) is:
Y ^ = W 0   + h = 1 H W h g ( V 0 h + j = 1 p V i h X j
The output of this model provides an estimate of the probability of default for the corresponding input vector. The final decision on the classification can be obtained by comparing this output with a threshold, usually set at 0.5, thus arriving at a default decision if ( y ^ > 0.5 ) .
There is no general rule for determining the optimal number of hidden nodes, a parameter that is necessary for optimal network performance (Kim 2003). However, the most common way to determine the size of the hidden layer is through experiments or trial and error (Tang and Fishwick 1993; Wong et al. 1992). In Figure 1, the typical structure of an MLP model shows where the mathematical deduction has been formulated for a network with an input layer, a hidden layer, and an output layer. The number of hidden nodes determines the complexity of the final model, and networks of a more complex nature no longer guarantee better generalization capabilities. A generally accepted strategy (Hastie et al. 2009) is to select the size of the hidden layer (H) based on some types of validation studies. Thus, the size of the hidden layer (H) was selected through a 10-fold cross-validation search in {1, 2, …, 20}. Finally, for classification problems, an appropriate error function is conditional maximum likelihood (or entropy) adjustment (Hastie et al. 2009).

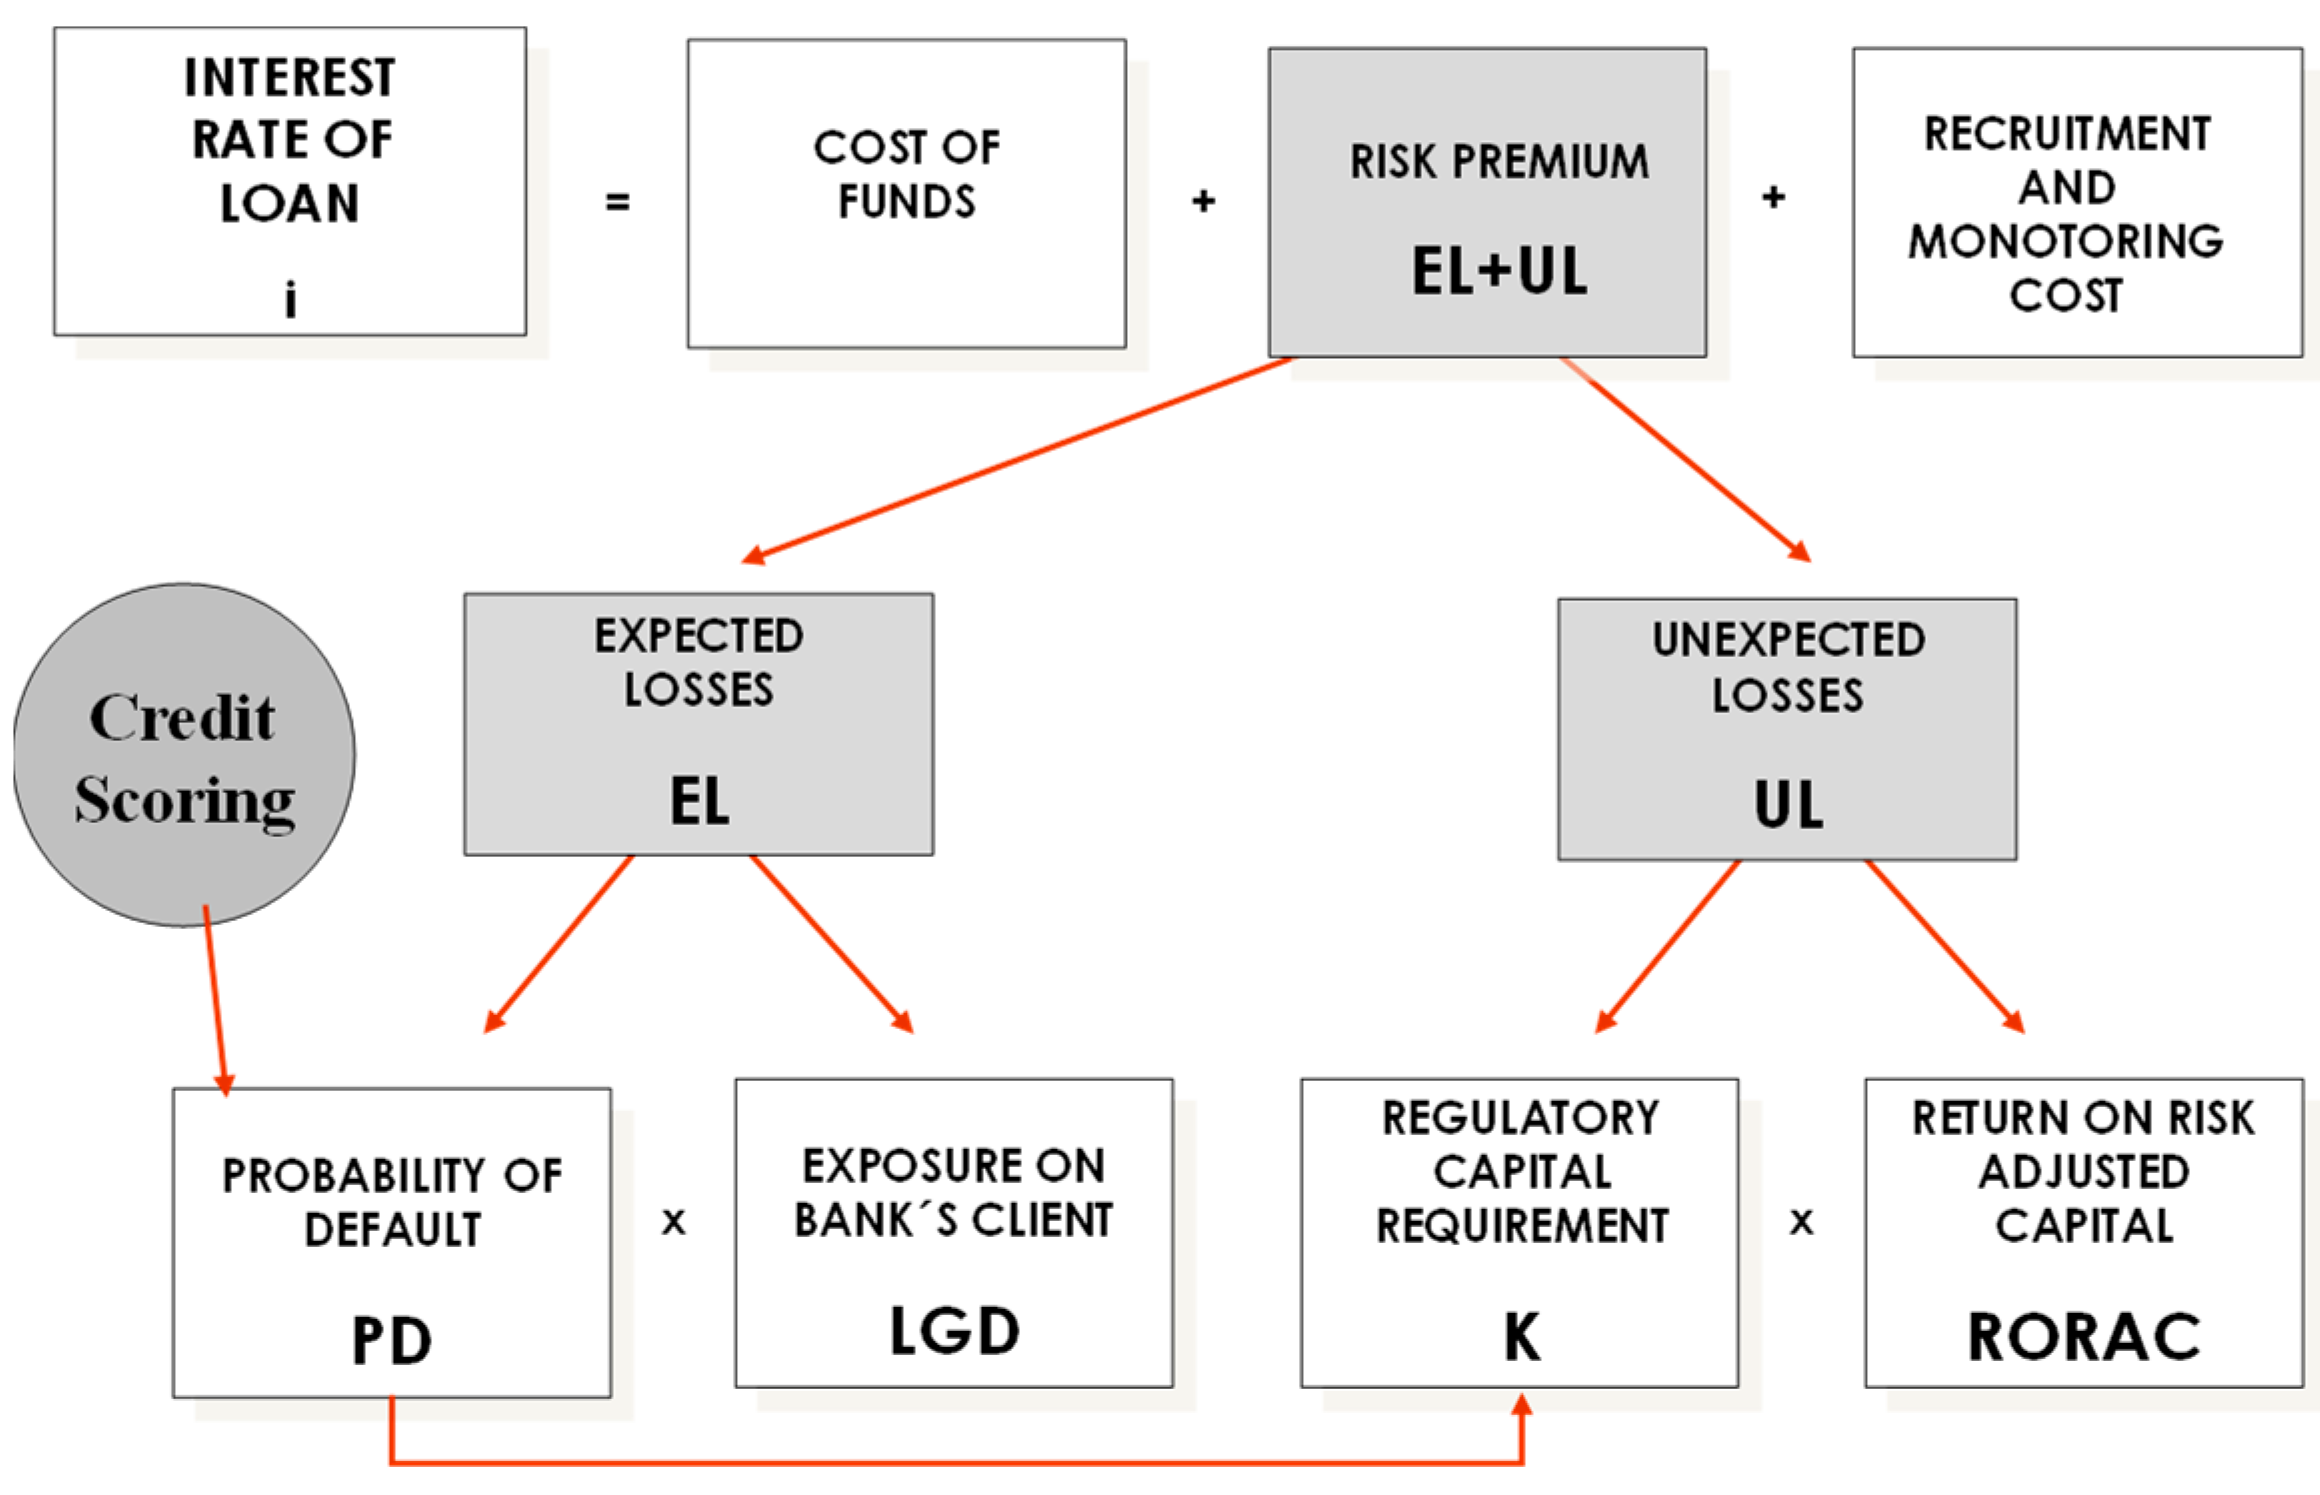
3.3. Internal Rating Based Model Design

The Basel Committee recognizes that differences in markets, rating methodologies, practices, and products will require financial institutions and supervisors to tailor their operational procedures. In the case of Guatemala, the convergence to Basel III with respect to the IRB model is progressive, being a process supervised by the Superintendency of Banks of Guatemala.
In the risk-weighted capital treatment for measuring credit risk, the internal ratings-based (IRB) approach allows banks to use their internal rating systems for credit risk, subject to the explicit approval of the bank’s supervisor. The risk components include calculations of PD, LGD, EAD, and effective maturity (M) under the advanced approach (A-IRB); thus, the IRB approach is based on measures of UL and EL.
For PD, we consider the risk characteristics of the borrower and of the transaction, including the type of product and/or collateral and the delinquency of the exposure. Therefore, the PD is one year associated with the internal borrower rating to which the exposure was assigned, through internal default experience, association to external data, and statistical default models, with a PD of 100% for borrowers with a default rating. With respect to LGD, a minimum parameter is calculated for unsecured exposures of 30% and for secured exposures of 10% for commercial goods.
In our case study, retail risk exposure is used to estimate the capital requirement for lending. Basel III considers a 99.9% quartile, so that when assessing the capital requirement, 99.9% of the situations in the state of the economy that may influence a potential default by the customer, which depends on the probability of default, the severity of the loss, and the correlation coefficient of the borrower with the evolution of the economy, as determined by Equation (7).
The correlation coefficient, in turn, is a function of the predetermined probability, and for this type of segment, it is between 0.03 and 0.16, according to the Basel III formula. Likewise, the value of risk-weighted assets for a defaulted position is the product of K, 12.5, and EAD. The capital requirement (K) for a defaulted exposure is the higher of 0 and the difference between its LGD and the institution’s best estimate of expected loss.
Correlación   ( R ) =   0.03   ( 1 e 35 P D ) ( 1 e 35 ) + 0.16 1 ( 1 e 35 P D ) ( 1 e 35 )
K =     L G D   · N   G P D   1 R + R 1 R · G 0.99 P D · L G D
RWA = K · 12.5 · E A D
where:
  • K: Capital requirement.
  • PD: Probability of default, derived from the credit rating.
  • ρ (PD): Correlation coefficient.
  • LGD: Loss given default
  • EAD: Exposure at default.
  • RWA: Risk-weighted assets.
  • EL: Expected loss.
  • G (0.999): Inverse of the normally cumulative distribution function = −3.090.
  • G (PD): Inverse of the normally cumulative distribution function in PD.
The main contribution of this method is based on the fact that each entity has rating models for estimating the probability of default (PD), based on systematic and specific risk, the value at risk at 99%, and the expected, unexpected, and catastrophic loss and borrower factors. Therefore, it can be stated that the capital requirement increases with the probability of default and severity. Furthermore, the riskier the loan portfolio of an MFI, the higher the capital requirements of the MFI.
Figure 1 summarizes the methodology that calculates the interest rate, which must be negotiated with each borrower when considering the objective of obtaining the risk-adjusted target return on capital (RORAC). The credit rating results affect the risk premium calculation, which in turn influences the RORAC interest rate for each client and the required profitability for MFIs on their loans. The probability of default directly affects the expected loss amount and indirectly affects the unexpected loss charge through its influence on the risk capital calculation.
The risk premium (Pr) is the sum of the two components: the risk premium derived from the expected loss (PrEL) and the corresponding risk premium derived from the unexpected loss (PrUL). In addition, the expected loss is the result of multiplying PD and LGD, and the unexpected loss is the product of multiplying the regulatory capital requirement (K) by the return on risk-adjusted capital in the sector (r), according to the following expression:
R i s k   p r e m i u m P r = Pr E l ) + ( P r U L = P D · L G D + ( K · r )
where:
  • EL: Expected loss (covered by provision)
  • UL: Unexpected loss (covered by the capital requirement)
  • K: Capital requirement
  • r: Risk-adjusted return on equity for the sector
Applying the IRB approach proposed by the Basel III capital requirement rules, we determine the target return on risk-adjusted capital by considering the customer’s after-tax return from the following expression:
R O R A C = ( F R F C O C + E L + U L ) · ( 1 T R ) K
F R = E A D · i
I C = K · R f
where:
  • FR: Financial income
  • FC: Financial costs
  • OC: Operational costs
  • EL: Expected loss
  • IC: Capital income
  • K: Capital requirement
  • i: Interest rate
  • TR: Tax rate
  • EAD: Exposure at default
  • Rf: Risk-free interest rate
It follows that the variation in the credit risk premium (Pr) always increases when there are increases in the PD, and the interest rate also increases when there is an increase in the credit risk premium (Pr).

4. Results and Discussion

This section first compares the results of LRs and MLPs. Second, we show and discuss the results obtained with the IRB approach and analyze its impact on the MFI’s management by comparing the pricing for three clients with different risk profiles.

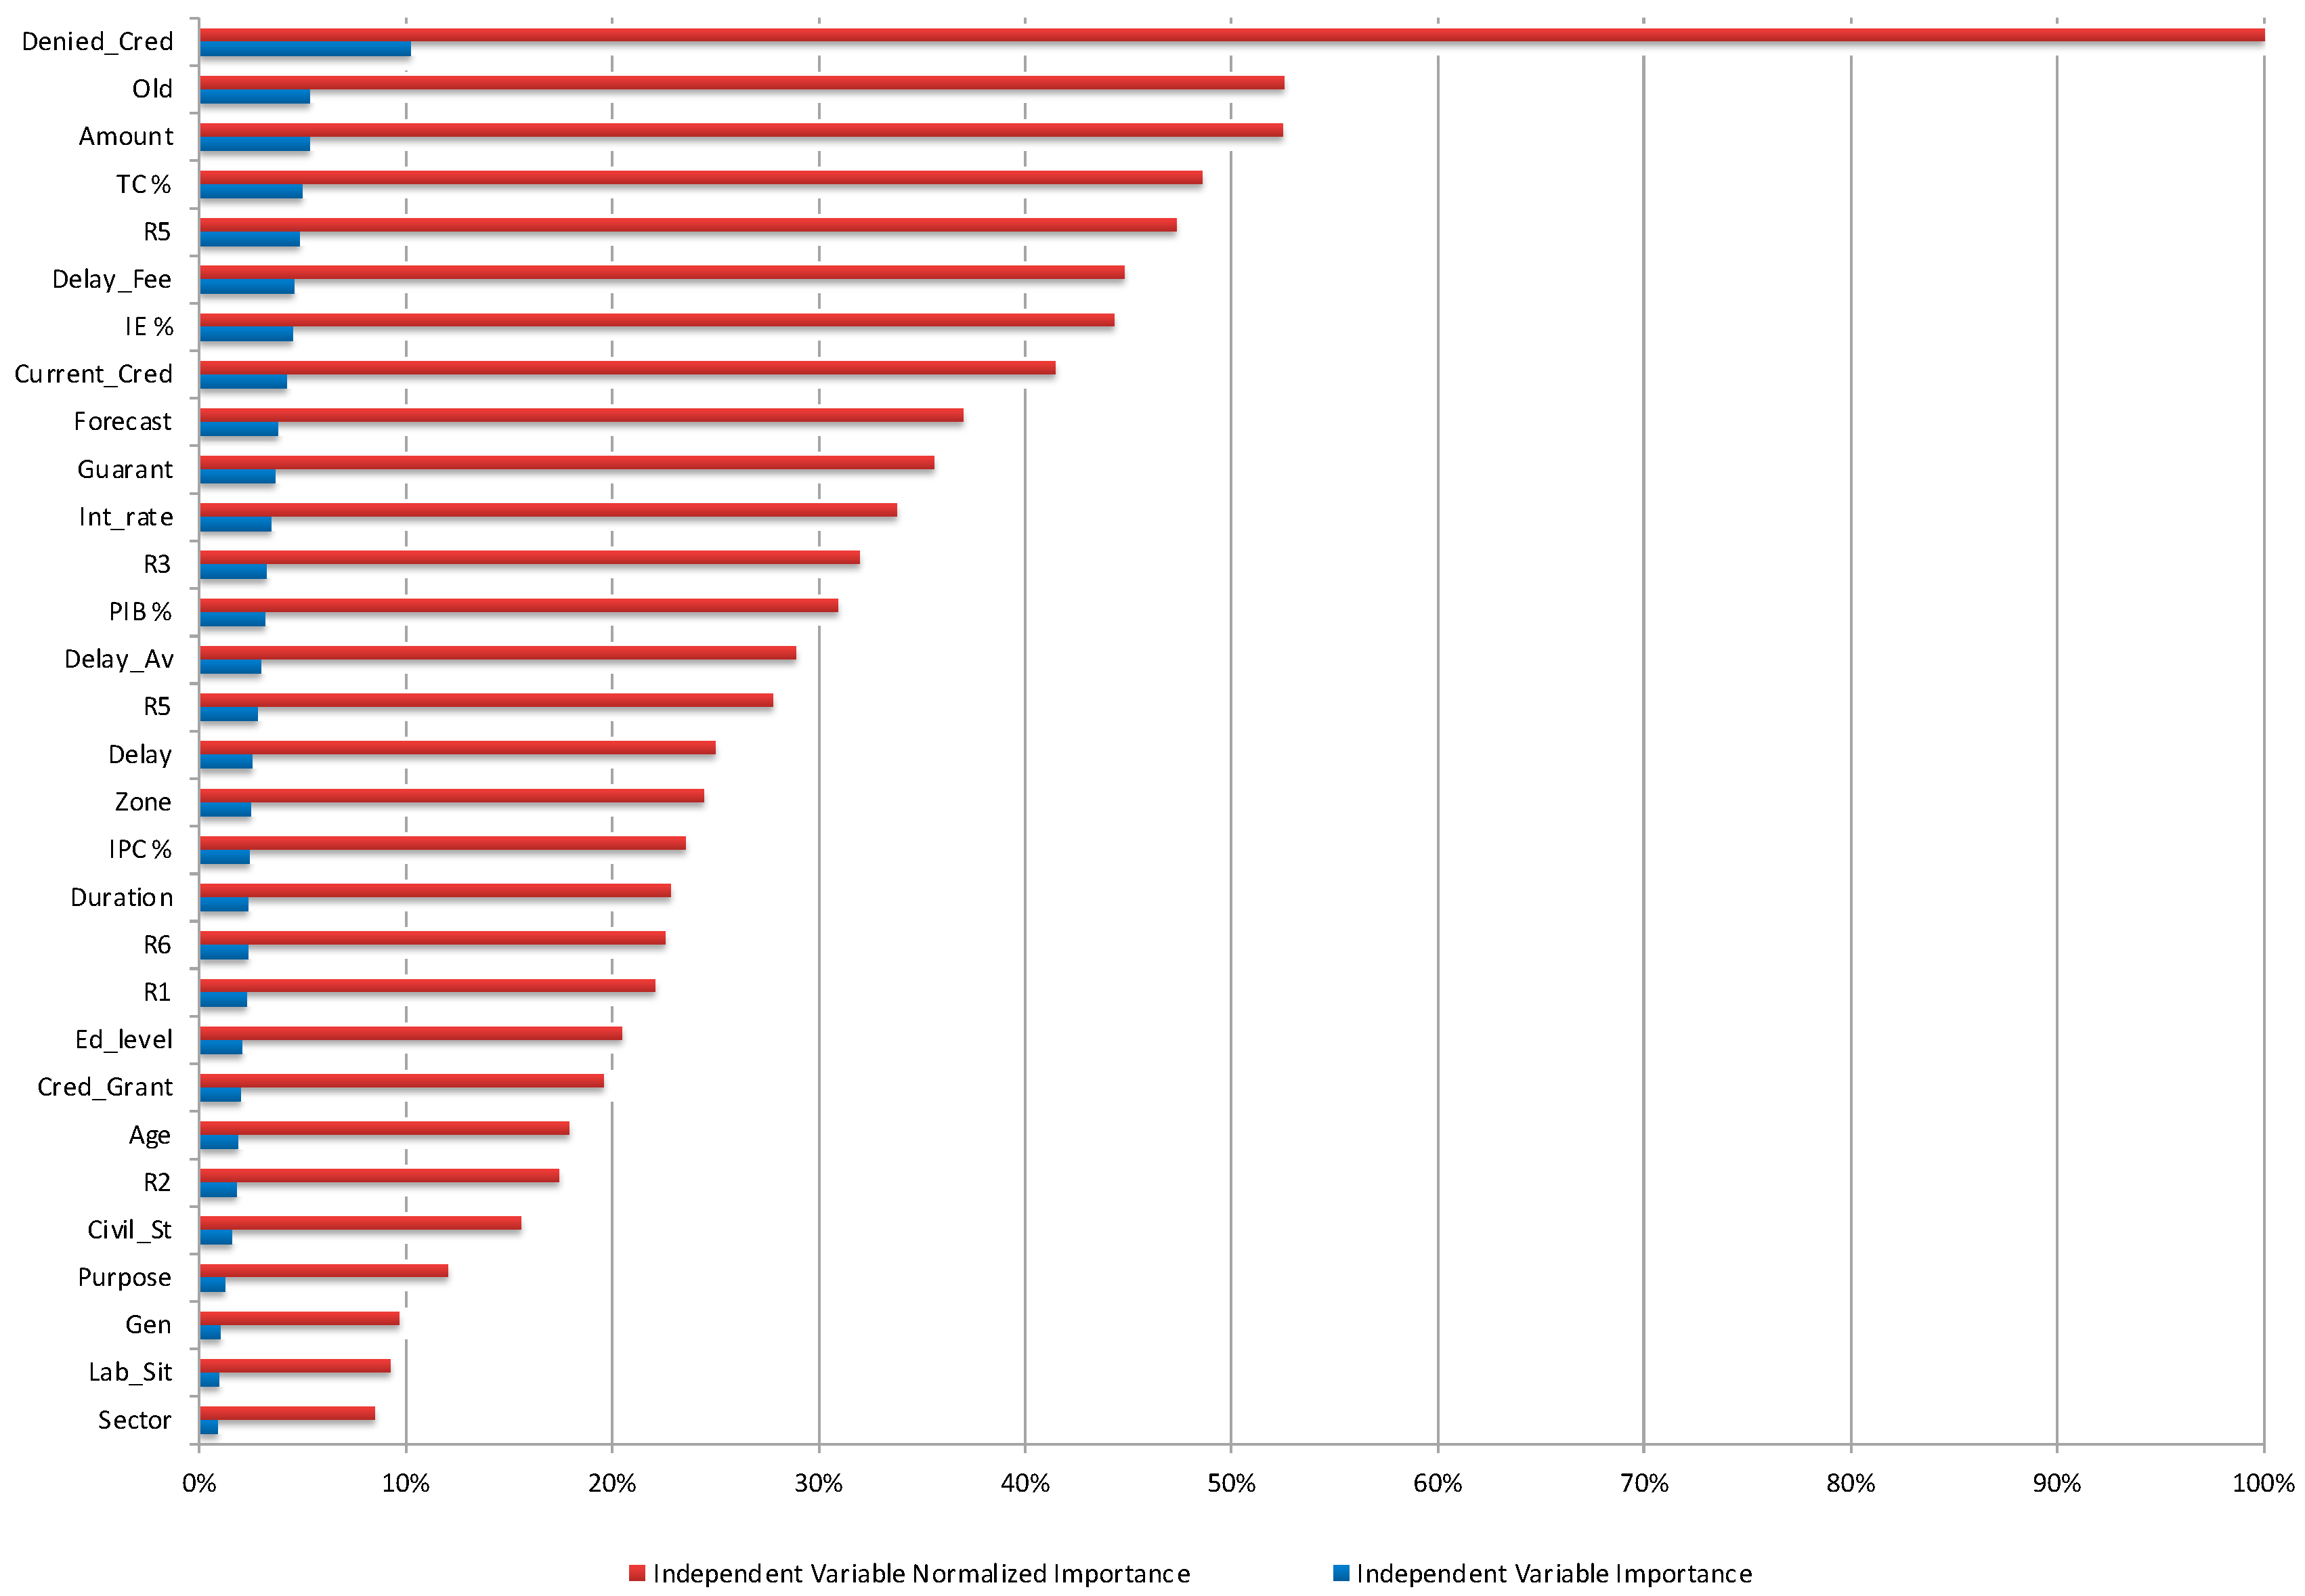
4.1. Comparison of Default Probability Models Accuracy

Table 2 shows the coefficients and significance level of all variables included in the logistic regression model. As shown in this table, all the expected signs comply with the sign expectations that we have justified in the independent variables section. The relevance of the most significant variables in the default of microcredits can be analyzed by means of the absolute values of the coefficients of each of them. In addition, the odds ratios measure the changes in the probability of default when the independent variable increases by 1 unit.
The results obtained show that the signs of all the variables that were statistically significant in the logit model of credit scoring are in line with our expectations as well as with the results of previous research (Blanco-Oliver et al. 2016, 2024; Durango-Gutiérrez et al. 2023; Beisland et al. 2019; Cozarenco and Szafarz 2018; Gutiérrez-Nieto et al. 2016), thus corroborating the rigor and consistency of our analysis. Moreover, our empirical evidence provides novel information on credit risk in Guatemalan MFIs.
For the Guatemalan MFI, out of the 30 variables analyzed, 19 were found to be significant, after likelihood adjustment, at 1%, 5%, and 10% significance. According to the beta regression coefficient of the variables, our results show that ten variables had a positive influence on PD (number of loans not granted, outstanding loans, number of instalments in arrears, average number of days in arrears, the debt ratio, duration of the microcredit, amount of microcredit, interest rate, collateral, and credit analyst’s forecast), while nine variables (female gender, a family marital status, residing in a rural area, dependent worker, length of time as a client of the MFI, turnover ratios, liquidity, and ROA) are negatively associated with PD.
Contrary to other studies in other countries (Durango-Gutiérrez et al. 2023; Blanco et al. 2013), our results also show the influence of only idiosyncratic factors on PD, although no effect of systemic factors is evident, probably because this aspect, in itself, has a strong influence on idiosyncratic variables. These results also show that the variables associated with the loan operation have an important influence on PD, even more so than non-financial variables and financial ratios, in relative terms.
Figure 2 shows the normalized significance for each variable in explaining the probability of default among all borrowers in the portfolio. These results show a higher relative importance of those factors or variables that were statistically significant in the logistic regression model.
To assess the performance of the different credit rating models, the area under the ROC curve (AUC) rating matrix is used (Table 3). The classification matrix, i.e., the table of observed versus estimated cases, shows the percentage of correct classification obtained by each of the three models using the two statistical techniques we consider. Substantial differences are obtained between the LR and MLP methods in terms of the criteria used. Specifically, the AUC of the LR analysis is 84.33%, surpassed by the MLP model, which is 89.17%. Also, the improvement introduced by the MLP model with respect to the classical LR method is 10.55% in terms of percentage correct classification. In other words, the implementation of the neural network approach significantly reduces the classification errors of MFIs and, therefore, provides a way to gain a competitive advantage over other MFIs, which do not implement this methodology. Therefore, we conclude, as supported by Ince and Aktan (2009), that MLP models generally achieve a higher AUC and make fewer classification errors compared to the traditional LR approach. These empirical results confirm the theoretical superiority (mainly non-linear and non-parametric adaptive learning properties) of MLP models over the parametric and widely used LR model for predicting default. Therefore, we suggest that MFIs use MLP models instead of the traditional parametric LR model since a mere improvement in accuracy would reduce losses on a large loan portfolio and could save millions of dollars (West 2000).

4.2. Application of Pricing Strategy

To analyze the effect of a model for calculating the probability of default in an MFI under Basel III regulations, we analyze the effect and outcome of the IRB pricing model proposed in this paper with three clients of different risk profiles randomly selected from our database. Table 4 shows the idiosyncratic and systematic variables, as well as the estimated probability of default for the three customers using the LR model equation and MLP input nodes.
According to international rating scales, together with the standards of the Basel III regulations admitted by the Superintendency of Banks of Guatemala, client 1 has a low default risk and is supervised by the MFI’s risk management. Client 2 has a moderate probability of default that could be sensitive to changes in a more adverse economic and financial scenario. Also, client 3, with a high probability of default, presents factors that do not provide guarantees for the safe repayment of the loan, even in a macroeconomic scenario far from recession.
Next, after estimating the default probabilities for each client, we calculate the RORAC by applying an IRB model under the Basel III framework. Finally, we estimate the interest rate that the MFI should apply to each of the three microcredit clients, conditional on the risk-adjusted return coinciding with the minimum target return that the institution requires of its clients for this type of financial operation.
Table 5 summarizes the data necessary for the design of the pricing models, assuming the granting of a microcredit for an amount of USD 1500, the approximate average value of a microcredit in our portfolio, with a maturity of one year. The annual interest rate currently applied by the MFI to the three selected clients has been calculated at 18.023% (as the average of the daily interest rates of the microcredits granted to microenterprises during the period of the loan portfolio analyzed). For its part, the percentage used as the cost of debt, 2.25%, has been calculated from the information on interbank interest rates of the financial system, which has been obtained from the economic statistics of the Superintendency of Banks of Guatemala during the period of the portfolio 2019–2021. The operating cost rate on total loans and deposits, which is 5.24%, has been calculated from the MFI’s monthly financial information found in its balance sheet and income statement. The marginal corporate tax rate in Guatemala is 25%. The target RORAC of 12.03% was estimated as the MFI’s average ROE, information found in the MFI’s financial indicators published in the statistical section of the Superintendencia de Bancos de Guatemala. Finally, the average risk-free rate for the period 2019–2021 was 1.75%, according to information available in the sovereign bond issuance program of the Guatemalan Ministry of Public Finance.
Table 6 and Table 7 analyze the relevant financial information under the application of the Basel III IRB approach for the three randomly selected customers. These calculations have been carried out, respectively, for the neural network model and the logistic regression model. The application of the IRB approach suggests a higher accuracy of the capital requirement (own funds) figure over the previous standardized approach and thus of the values of the return on capital (ROC), the risk-adjusted return on capital (RORAC), and the interest rate (Price). This better adjustment of capital requirements has important consequences for the creditworthiness and profitability of the MFI, as it improves its level of competitiveness with commercial banks that do have credit rating models and interest rate setting systems.
To calculate the after-tax profit earned by the MFI with each client under the Basel III IRB approach, the following expression is used:
P r o f i t a b i l i t y = ( I n t e r e s t   I n c o m e I n t e r e s t   E x p e n s e s O p e r a t i n g   E x p e n s e s + C a p i t a l   B e n e f i t P r o v i s i o n ) · ( 1 T a x   R a t e ) S t o c k h o l d e r s   E q u i t y
From a theoretical point of view, the return that a client provides to a microfinance institution depends on the risk of the borrower and the interest rate of the transaction. Thus, by applying the IRB approach with a more predictive probability of default (MLP) calculation model (Table 6), the MFI can obtain returns that are more adjusted to the risk profile for each client. The amount of the benefit has been calculated according to the parameters set by the standard, which may vary depending on the client’s classification (Table 8). For the determination of interest rates, a loss given default (LGD) level of 45% is set, as recommended by the Basel standard, for those cases where it is impossible to estimate this level from the financial institution’s information alone. Specifically, the MFI would obtain returns of 206.19%, 43.20%, and −38.63%, respectively, for the three randomly selected clients.
However, our pricing model does not aim to calculate the profitability of an MFI’s clients after applying a fixed interest rate to them, but rather to set an interest rate adjusted to the credit risk of each borrower after the institution sets a target return on its microcredit operations. In this regard, the Guatemalan MFI, in this study that the RORAC of its operations should be 17.14%, regardless of the risk level of each client. Thus, to meet this profitability target, and given the starting data in Table 5, as well as the risk profiles of each client, the MFI should set an interest rate of 7.90%, thus reducing this borrower’s interest rate by 4.42% with respect to the rate currently charged by the MFI (12.32%). Similarly, for client 2, the risk-adjusted interest rate would be set at 10.01%, i.e., 2.31% lower than the MFI’s current interest rate. Finally, the risk-adjusted interest rate for borrower 3 would be 23.70%, 11.38% higher than the MFI’s current rate. Table 7 replicates the same procedure for the pricing model estimated from a model calculating the probability of default using logistic regression. Table 9 summarizes the changes in interest rates after adjusting for risk profiles and for each default probability calculation technique.
Our results and findings suggest that microfinance pricing models under the IRB approach are a strategic factor in MFIs because of the implications for improved solvency and profitability management through the allocation of risk-adjusted interest rates and more accurate capital requirements. This allows MFIs to survive in a financial environment dominated by large international banks already operating in the microfinance sector and even to compete with them by having tools that large banks have been using for some years. For the implementation of pricing models and the calculation of capital requirements according to the IRB approach, it corroborates the need for MFIs to design their own models for calculating the probability of default of their clients, as they allow them to control and reduce the credit risk of their clients, which is an important source of improvement in the management of this type of financial institution, as these models improve their liquidity and profitability by imposing lower losses due to defaults and bankruptcy provisions.
In addition to the advantages listed above, the application of pricing systems under the IRB approach provides MFIs with a tool to continue developing in a fair and efficient way their main mission, which is to help low-income and excluded people with many difficulties in accessing savings and credit services to create a microenterprise.

4.3. Practical and Policy Implications

The results of the pricing strategy shown in Section 4.2 highlight the significant potential of credit risk-adjusted pricing models based on PD to revolutionize the microfinance sector. This model, which is fully compliant with Basel III regulations, offers a highly accurate tool for determining interest rates and could enable MFIs to increase their financial sustainability and offer microcredit more equitably.
By applying different interest rates according to individual risk profiles, MFIs can reduce the financial burden on lower-risk clients, thus fostering financial inclusion and potentially reducing default rates.
Our findings suggest that this strategy not only allows MFIs to meet their profitability targets, but also ensures that credit is more accessible to those who need it most. This is especially important in emerging markets, such as Guatemala, where access to credit remains a major obstacle to economic development. In addition, the implementation of neural network models to predict default risk adds a level of accuracy that traditional logistic regression models may lack. The increased predictive power of these models ensures that interest rates are better matched to actual risk, reducing the probability of defaults and financial losses for MFIs.
Overall, the credit risk-based pricing model proposed in this study represents a substantial advance in microfinance, which could set a new standard for pricing strategies in the sector. By promoting both financial sustainability and social impact, this approach could serve as a model for MFIs worldwide.
At the same time, bank financial managers, associations representing financial inclusion stakeholders, financial regulators, and tax authorities can draw on these findings to inform the development of new regulations to enable greater financial inclusion for poor people. This is because financial managers and financial and tax authorities could identify significant warning signs in the behavior of these variables, as erroneous knowledge of their evolution could lead to restrictions in access to bank credit for low-income people, thus restricting the supply of microcredits and, consequently, increasing interest rates. The research suggests that regulators develop specific guidelines for these models and that MFI managers expand their approaches to include historically overlooked areas, such as the agricultural sector and rural communities. This is important for improving access to financial services and supporting local economic development.
Furthermore, our findings can contribute to the design of government policies aimed at promoting the financial and social inclusion of vulnerable people. Identifying risk factors in MFI clients can help governments target subsidies to the most creditworthy borrowers, thereby improving the performance of these institutions and their social contribution.

4.4. Limitations of the Research

While the results of this research offer valuable insights into the implementation of risk-adjusted pricing models in the microfinance sector, it is important to recognize some limitations. First, the study’s reliance on historical data from a specific geographic region, such as Guatemala, may restrict the applicability of the results to other contexts. Microfinance environments vary considerably across countries due to differences in regulatory frameworks, economic conditions, and cultural factors. Therefore, the effectiveness of the proposed pricing strategy may not be the same in other regions with different financial scenarios.
In addition, while the use of neural network models to predict default risk is innovative, it introduces challenges in terms of model interpretability and transparency. Stakeholders in the microfinance sector, especially those with limited technical knowledge, may find it difficult to understand and trust the decisions generated by these models. This could hinder the widespread adoption of these advanced techniques, especially in contexts where regulators require high levels of model transparency.
In addition, the data used in this study, while comprehensive, may not fully reflect all the nuances of borrower behavior and external economic shocks that may affect default rates. For example, unexpected macroeconomic events or changes in local economic conditions were not included in the model, which could affect its predictive accuracy.
Finally, it is critical to consider the ethical implications of applying risk-based pricing within microfinance. While this approach could lead to fairer interest rates, there is a risk of inadvertently excluding the riskiest borrowers, who are often the most vulnerable. This raises significant questions about the balance between financial sustainability and social mission in microfinance, a tension that future research should explore further.

5. Conclusions

In keeping with their important social mission, MFIs must improve their management models if they want to survive in an unstable macroeconomic environment and in a microfinance sector in which commercial banks have been gaining a foothold in recent years. To achieve this goal, with criteria of effectiveness and efficiency, MFIs can gain competitiveness with respect to commercial banks through tools that allow them to calculate probabilities of default in a reliable and robust way, which would make it possible to calculate capital requirements and set interest rates adjusted to the credit risk of each client under the IRB approach of the Basel III regulations.
Our findings represent an advance on the conclusions of previous research for three reasons. First, building on previous research, our results support that a probability of default model using a multilayer-perceptrometer model offers better accuracy returns associated with lower classification costs than the classical parametric technique of logistic regression. Moreover, our results imply important implications for improving the efficiency, solvency, and profitability of MFIs due to their contribution to the reduction in default losses, bankruptcy provisioning, and recovery processes. In this respect, our results suggest that multilayer perceptrometric neural networks are the most suitable techniques in the microfinance sector.
Second, our research corroborates that capital requirements under the IRB approach are quantified much more accurately than under the old standard method. Moreover, through this approach, MFIs will be able to improve the profitability and efficiency of their management, which would also increase their ability to raise funding in the financial markets under more competitive conditions.
Third, the main finding of our research is that a pricing model in the microfinance industry is an important tool that allows MFIs to defend and increase their market share in order to continue carrying out their original mission, which is to finance the poor without the need to charge high interest rates. By randomly selecting three clients with different risk profiles, our results establish a priori the desired profitability for each of them, allowing the institution to maximize its profits and meet the demands of its shareholders and funders. Consequently, these models are seen as management tools that can help to increase efficiency and reduce microcredit default losses so that MFIs can achieve the necessary financial self-sufficiency and compete on a level playing field with traditional banks. Furthermore, our findings can contribute to the design of government policies aimed at promoting the financial and social inclusion of vulnerable people. Moreover, by increasing solvency and profitability, MFIs ensure their survival in a sector where commercial banks have entered through downscaling.

Author Contributions

Conceptualization, P.D.-G., J.L.-R., A.N.-G. and D.B.-C.; methodology, P.D.-G., J.L.-R. and D.B.-C.; software, J.L.-R. and D.B.-C.; validation, P.D.-G., J.L.-R., A.N.-G. and D.B.-C.; formal analysis, P.D.-G., J.L.-R., A.N.-G. and D.B.-C.; investigation, P.D.-G., J.L.-R., A.N.-G.; data curation, P.D.-G., J.L.-R., A.N.-G. and D.B.-C.; writing—original draft preparation, P.D.-G., J.L.-R., A.N.-G. and D.B.-C. All authors have read and agreed to the published version of the manuscript.

Funding

This research received no external funding.

Informed Consent Statement

Not applicable.

Data Availability Statement

Data are available from the authors upon request.

Conflicts of Interest

The authors declare no conflicts of interest.

References

  1. Abdullah, Shahnaz, and Shakil Quayes. 2016. Do women borrowers augment financial performance of MFIs? Applied Economics 48: 5593–604. [Google Scholar] [CrossRef]
  2. Aguilar, Giovanna, and Jhonatan Portilla. 2019. Technical change in the Peruvian regulated microfinance sector. Latin American Business Review 20: 5–35. [Google Scholar] [CrossRef]
  3. Al-Azzam, Moh’d, and Christopher Parmeter. 2021. Competition and microcredit interest rates: International evidence. Empirical economics 60: 829–68. [Google Scholar] [CrossRef]
  4. Altinbas, Hazar, and Goktug Cenk Akkaya. 2017. Improving the performance of statistical learning methods with a combined meta-heuristic for consumer credit risk assessment. Risk Management 19: 255–80. [Google Scholar] [CrossRef]
  5. Asencios, Rodrigo, Christian Asencios, and Efrain Ramos. 2023. Profit scoring for credit unions using the multilayer perceptron, XGBoost and TabNet algorithms: Evidence from Peru. Expert Systems with Applications 213: 119201. [Google Scholar] [CrossRef]
  6. Badr El Din, A. Ibrahim. 2022. Lessons for African microfinance providers and regulators in the aftermath of COVID-19. Enterprise Development & Microfinance 33: 182–91. [Google Scholar] [CrossRef]
  7. Balushi, Yasmeen Al, Stuart Locke, and Zakaria Boulanouar. 2018. Islamic financial decision-making among SMEs in the Sultanate of Oman: An adaption of the theory of planned behaviour. Journal of Behavioral and Experimental Finance 20: 30–38. [Google Scholar] [CrossRef]
  8. Bank of Guatemala. 2021. Desempeño Macroeconómico Reciente y Perspectivas. December 3. Available online: https://www.banguat.gob.gt/sites/default/files/banguat/Publica/conferencias/cbanguat787.pdf (accessed on 20 April 2024).
  9. Basel Committee on Banking Supervision, BCBS. 2017. Basel III: Finalising Post-Crisis Reforms. Bank for International Settlements. Available online: https://www.bis.org/bcbs/publ/d424.pdf (accessed on 15 April 2024).
  10. Beisland, Leif Atle, Bert D’Espallier, and Roy Mersland. 2019. The Commercialization of the MicrofinanceIndustry: Is There a “Personal Mission Drift’ Among Credit Officers? Journal of Business Ethics 158: 119–34. [Google Scholar] [CrossRef]
  11. Bettoni, Luis, Marcelo Santos, and Gilberto Oliveira Filho. 2023. The impact of microcredit on small firms in Brazil: A potential to promote investment, growth and inclusion. Journal of Policy Modeling 45: 592–608. [Google Scholar] [CrossRef]
  12. Bishop, Christopher Michael. 1995. Neural Networks for Pattern Recognition, 1st ed. New York: Oxford University Press. [Google Scholar]
  13. Blanco, Antonio, Rafael Pino-Mejías, Juan Lara, and Salvador Rayo. 2013. Credit scoring models for the microfinance industry using neural networks: Evidence from Peru. Expert Systems with Applications 40: 356–64. [Google Scholar] [CrossRef]
  14. Blanco-Oliver, Antonio, Ana Irimia-Diéguez, and María Dolores Oliver-Alfonso. 2016. Hybrid model using logit and nonparametric methods for predicting micro-entity failure. Investment Management and Financial Innovations 13: 35–46. [Google Scholar] [CrossRef] [PubMed]
  15. Blanco-Oliver, Antonio, Antonio Samaniego, and María José Palacin-Sanchez. 2024. How do loan officer-borrower gender-driven behavioural differences impact on the microfinance lending market? Borsa Istanbul Review 24: 435–48. [Google Scholar] [CrossRef]
  16. Brau, James C., Shon Hiatt, and Warner Woodworth. 2009. Evaluating impacts of microfinance institutions using Guatemalan data. Managerial Finance 35: 953–74. [Google Scholar] [CrossRef]
  17. Castro, José Antonio Morales, Patricia Margarita Espinosa Jiménez, and Marcela Rojas Ortega. 2022. Efecto de las variables macroeconómicas en los índices de morosidad de los bancos en México, durante el periodo COVID-19 versus el periodo previo. RAN-Revista Academia & Negocios 8: 55–70. [Google Scholar] [CrossRef]
  18. Cepeda, Isabel, Maricruz Lacalle-Calderon, and Miguel Torralba. 2021. Microfinance and Violence Against Women in Rural Guatemala. Journal of Interpersonal Vilolence 36: 1391–413. [Google Scholar] [CrossRef]
  19. Concha, Emerson Toledo. 2009. Microfinanzas: Diagnóstico del sector de la micro y pequeña empresa y su tecnología crediticia. Contabilidad y Negocios 4: 23–32. [Google Scholar] [CrossRef]
  20. Cozarenco, Anastasia, and Ariane Szafarz. 2018. Gender biases in bank lending: Lessons from microcredit in France. Journal of Business Ethics 147: 631–50. [Google Scholar] [CrossRef]
  21. Cubiles-De-La-Vega, María Dolores, Antonio Blanco-Oliver, Rafael Pino-Mejías, and Juan Lara-Rubio. 2013. Improving the management of microfinance institutions by using credit scoring models based on Statistical Learning techniques. Expert Systems with Applications 40: 6910–17. [Google Scholar] [CrossRef]
  22. DGRV. 2022. Datos y ranking de Cooperativas de Ahorro y Crédito en América Latina y el Caribe. Available online: https://www.dgrv.coop/es/publication/datos-y-ranking-de-cacs-en-america-latina-y-el-caribe/ (accessed on 3 May 2024).
  23. Durango, María Patricia, Juan Lara-Rubio, Andrés Navarro Galera, and A. Blanco-Oliver. 2022. The effects of pricing strategy on the efficiency and self-sustainability of microfinance institutions: A case study. Applied Economics 54: 2032–47. [Google Scholar] [CrossRef]
  24. Durango-Gutiérrez, María Patricia, Juan Lara-Rubio, and Andrés Navarro-Galera. 2023. Analysis of default risk in microfinance institutions under the Basel III framework. International Journal of Finance & Economics 28: 1261–78. [Google Scholar] [CrossRef]
  25. ECLAC (Economic Commission for Latin America and the Caribbean). 2009. Equality at the Center of Sustainable United Nations. Available online: https://repositorio.cepal.org/server/api/core/bitstreams/b1da0f9d-3746-43f8-9bb3-fa7b31f7ca4d/content (accessed on 6 April 2024).
  26. EIU (Economist Intelligence Unit). 2020. Microscopio Global de 2020: El papel de la inclusión financiera en la respuesta frente a la COVID-19. New York: Inter-American Development Bank Invest. [Google Scholar]
  27. Elloumi, Awatef, and Aïda Kammoun. 2013. Les déterminants de la performance de remboursement des microcrédits en Tunisie. Annals of Public and Cooperative Economics 84: 267–87. [Google Scholar] [CrossRef]
  28. Financial Stability Board (FSB). 2023. Promoting Global Financial Stability. 2023 FSB Annual Report. Available online: https://www.fsb.org/wp-content/uploads/P111023.pdf (accessed on 10 April 2024).
  29. Findevgateway. 2022. Portal FinDev un programa de CGAP. Guatemala, América Latina y el Caribe. Available online: https://www.findevgateway.org/es/pais/guatemala (accessed on 15 May 2024).
  30. Gutiérrez-Nieto, Begoña, Carlos Serrano-Cinca, and Juan Camón-Cala. 2016. A credit score system for socially responsible lending. Journal of Business Ethics 133: 691–701. [Google Scholar] [CrossRef]
  31. Hastie, Trevor, Robert Tibshirani, and Jerome Friedman. 2009. The Elements of Statistical Learning: Data Mining, Inference, and Prediction. New York: Springer. [Google Scholar]
  32. IDB. 2020. El Microscopio Global de 2020 El Papel de la Inclusión Financiera en la Respuesta Frente a la COVID-19. Available online: https://idbinvest.org/es/publications/el-microscopio-global-de-2020-el-papel-de-la-inclusion-financiera-en-la-respuesta (accessed on 22 May 2024).
  33. Ince, Huseyin, and Bora Aktan. 2009. A comparison of data mining techniques for credit scoring in banking: A managerial perspective. Journal of Business Economics and Management 10: 233–40. [Google Scholar] [CrossRef]
  34. Irimia-Dieguez, Ana Isabel, A. Blanco-Oliver, and María José Vazquez-Cueto. 2015. A comparison of classification/regression trees and logistic regression in failure model. Procedia Economics and Finance 23: 9–14. [Google Scholar] [CrossRef]
  35. Kalita, Alakesh, Chiranjeeb Biswas, Anil Kumar Saikia, and Swabera Islam. 2022. Impact of Microfinance on Agriculture Sector: An Analysis. International Journal of Early Childhood Special Education 14: 2301–6. [Google Scholar] [CrossRef]
  36. Karlan, Dean, and Jonathan Zinman. 2011. Microcredit in Theory and Practice: Using Randomized Credit Scoring for Impact Evaluation. Science 332: 1278–84. [Google Scholar] [CrossRef] [PubMed]
  37. Kim, Kyoung-Jae. 2003. Financial time series forecasting using support vector machines. Neurocomputing 55: 307–19. [Google Scholar] [CrossRef]
  38. Lara-Rubio, Juan, Antonio Blanco-Oliver, and Rafael Pino-Mejías. 2017. Promoting entrepreneurship at the base of the social pyramid via pricing systems: A case study. Intelligent Systems in Accounting, Finance and Management 24: 12–28. [Google Scholar] [CrossRef]
  39. Lara-Rubio, Juan, Francisco Jesús Gálvez-Sánchez, Valentín Molina-Moreno, and Andrés Navarro-Galera. 2024. Analysing credit risk in persons with disabilities as an instrument of financial inclusion. Journal of Social and Economic Development, 1–23. [Google Scholar] [CrossRef]
  40. Lepetit, Laetitia, Emmanuelle Nys, Philippe Rous, and Amine Tarazi. 2008. The Expansion of Services in European Banking: Implications for Loan Pricing and Interest Margins. Journal of Banking & Finance 32: 2325–35. [Google Scholar] [CrossRef]
  41. Lin, Xuchen, Xiaolong Li, and Zhong Zheng. 2017. Evaluating borrower’s default risk in peer-to-peer lending: Evidence from a lending platform in China. Applied Economics 49: 3538–45. [Google Scholar] [CrossRef]
  42. Maes, Jan P., and Larry R. Reed. 2012. State of the Microcredit Summit Campaign Report 2012. Washington, DC: Microcredit Summit Campaign. [Google Scholar]
  43. Maudos, Joaquín, and Juan Fernandez De Guevara. 2004. Factors explaining the interest margin in the banking sectors of the European Union. Journal of Banking & Finance 28: 2259–81. [Google Scholar] [CrossRef]
  44. Mohamed, Toka S., and Mohammed M. Elgammal. 2023. Does the extent of branchless banking adoption enhance the social and financial performance of microfinance institutions? Applied Economics 56: 1671–88. [Google Scholar] [CrossRef]
  45. Montevechi, André Aoun, Rafael de Carvalho Miranda, André Luiz Medeiros, and José Arnaldo Barra Montevechi. 2024. Advancing credit risk modelling with Machine Learning: A comprehensive review of the state-of-the-art. Engineering Applications of Artificial Intelligence 137: 109082. [Google Scholar] [CrossRef]
  46. Mustapa, Wan Nurulasiah binti Wan, Abdullah Al Mamun, and Mohamed Dahlan Ibrahim. 2018. Development initiatives, micro-enterprise performance and sustainability. International Journal of Financial Studies 6: 74. [Google Scholar] [CrossRef]
  47. Newman, Alexander, Susan Schwarz, and Daniel Borgia. 2014. How does microfinance enhance entrepreneurial outcomes in emerging economies? The mediating mechanisms of psychological and social capital. International Small Business Journal 32: 158–79. [Google Scholar] [CrossRef]
  48. Okello Candiya Bongomin, George, and John C. Munene. 2020. Financial inclusion of the poor in developing economies in the twenty-first century: Qualitative evidence from rural Uganda. Journal of African Business 21: 355–74. [Google Scholar] [CrossRef]
  49. Pietrapiana, Fabio, José Manuel Feria-Dominguez, and Alicia Troncoso. 2021. Applying wrapper-based variable selection techniques to predict MFIs profitability: Evidence from Peru. Journal of Development Effectiveness 13: 84–99. [Google Scholar] [CrossRef]
  50. Rahayu, Ninik Sri. 2020. The intersection of Islamic microfinance and women’s empowerment: A case study of Baitul Maal wat Tamwil in Indonesia. International Journal of Financial Studies 8: 37. [Google Scholar] [CrossRef]
  51. Rayo, Salvador, Juan Lara Rubio, and David Camino Blasco. 2010. A credit scoring model for institutions of microfinance under the Basel II Normative. Journal of Economics, Finance and Administrative Science 15: 89–124. [Google Scholar]
  52. Roa, María José, Alejandra Villegas, and Ignacio Garrón. 2022. Interest rate caps on microcredit: Evidence from a natural experiment in Bolivia. Journal of Development Effectiveness 14: 125–42. [Google Scholar] [CrossRef]
  53. Ruthenberg, David, and Yoram Landskroner. 2008. Loan pricing under Basel II in an imperfectly competitive banking market. Journal of Banking & Finance 32: 2725–33. [Google Scholar] [CrossRef]
  54. Saunders, Anthony, and Liliana Schumacher. 2000. The determinants of bank interest rate margins: An international study. Journal of international Money and Finance 19: 813–32. [Google Scholar] [CrossRef]
  55. Schreiner, Mark. 2002. Aspects of outreach: A framework for discussion of the social benefits of microfinance. Journal of International Development 14: 591–603. [Google Scholar] [CrossRef]
  56. Shahriar, Abu Zafar M., and Mukesh Garg. 2017. Lender-entrepreneur relationships and credit risk: A global analysis of microfinance institutions. International Small Business Journal 35: 829–54. [Google Scholar] [CrossRef]
  57. Shahriar, Abu Zafar M., Susan Schwarz, and Alexander Newman. 2016. Profit orientation of microfinance institutions and provision of financial capital to business start-ups. International Small Business Journal 34: 532–52. [Google Scholar] [CrossRef]
  58. Tang, Zaiyong, and Paul A. Fishwick. 1993. Feedforward neural nets as models for time series forecasting. ORSA Journal on Computing 5: 374–85. [Google Scholar] [CrossRef]
  59. UN (United Nations). 2019. Ocho Amenazas a la Economía Mundial. Departamento de asuntos económicos y sociales. Available online: https://www.un.org/es/desa/world-economic-situation-and-prospects-wesp-2019 (accessed on 5 May 2024).
  60. Van Gool, Joris, Wouter Verbeke, Piet Sercu, and Bart Baesens. 2012. Credit scoring for microfinance: Is it worth it? International Journal of Finance and Economics 17: 103–23. [Google Scholar] [CrossRef]
  61. Vellido, Alfredo, Paulo J. G. Lisboa, and Karon Meehan. 1999. Segmentation of the on-line shopping market using neural networks. Expert systems with applications 17: 303–14. [Google Scholar] [CrossRef]
  62. Viswanathan, P. Karthiayani, and Srikant K. Shanthi. 2017. Modelling credit default in microfinance-an Indian case study. Journal of Emerging Market Finance 16: 246–58. [Google Scholar] [CrossRef]
  63. Vogelgesang, Ulrike. 2003. Microfinance in times of crisis: The effects of competition, rising indebtness, and economic crisis on repayment behavior. World Development 31: 2085–114. [Google Scholar] [CrossRef]
  64. Wennekers, Sander, André Van Wennekers, Roy Thurik, and Paul Reynolds. 2005. Nascent entrepreneurship and the level of economic development. Small Business Economics 24: 293–309. [Google Scholar] [CrossRef]
  65. West, David. 2000. Neural network credit scoring models. Computer and Operational Research 27: 1131–52. [Google Scholar] [CrossRef]
  66. Wong, Felix S., Pei-Zhuang Wang, Thong H. Goh, and Boon Kiat Quek. 1992. Fuzzy neural systems for stock selection. Financial Analysts Journal 48: 47–52. [Google Scholar] [CrossRef]
  67. Wulandari, Permata, and Muthia Pramesti. 2021. Designing sustainable Islamic Microfinance to enhance the accessibility of poor borrowers in Indonesia: An appreciative intelligence approach. IOP Conference Series: Earth and Environmental Science 716: 012065. [Google Scholar] [CrossRef]
  68. Zeballos, Eliana, Alessandra Cassar, and Bruce Wydick. 2014. Do risky microfinance borrowers really invest in risky projects? Experimental evidence from Bolivia. Journal of Development Studies 50: 276–87. [Google Scholar] [CrossRef]
Figure 1. Calculation of interest rate adjusted to borrower risk.
Ijfs 12 00088 g001
Figure 2. Normalized importance of variables in the MLP model.
Ijfs 12 00088 g002
Table 1. Description of the independent variables.
VariableAcronimConceptExpected Sign (B)
Idiosyncratic Variables
Non-financial variables
GenderGen0 = Male
1 = Female
-
Marital statusCivil_St0 = Single
1 = Family unit
-
ZoneZone0 = Central zone
1 = Outskirts
-
Employment statusLab-Sit0 = Owner
1 = Dependent
-
AgeAgeAge at the time of application+/−
SectorSector0 = Commerce
1 = Production
2 = Services
+/−
Educational Level Ed_ Level0 = Bachelor
1 = Technician
2 = Professional
-
Duration as a borrower of MFIOldNumber of months as a client in the MFI-
Previously granted loansCred_GrantNumber of loans granted in the MFI-
Credit deniedDenied_CredNumber of loans denied in the MFI+
Number of current creditsCurrent_CredNumber of current loans in the MFI+
Credit arrearsDelayNumber of loans in arrears+
Average arrearsDelay_AvAverage arrears+
Fees on a defaulted loan (%)ArrearsPercentage of arrears to total fees+
Financial Ratios
Asset RotationR1Income sales/total assets-
LiquidityR2ability to pay/liquid assets (%)-
Leverage 1 R3Total liabilities/Shareholders’ equity (%)-
Leverage 2 R4Total liabilities/(Total liabilities + shareholders’ total equity) (%)+
ROAR5Net income/Total assets (%)-
ROER6Net income/Shareholders’ equity (%)-
Loan Variables
Purpose/DestinationPurpose0 = Fixed asset
1 = Work capital
+
DurationDurationNumber of monthly fees for applied loan.+
AmountAmountAmount of microcredit (USD)+
Interest rateInt_RateAnnual interest rate applied+
GarantíaGuarant0 = Personal
1 = Pledge
+
Credit analyst forecastForecast0 = no payment problems
1 = with payment problems
+
Sistematic Variables
Gross Domestic ProductGDPRate of annual change of Gross Domestic Product during loan term-
Consumer Price IndexCPIRate of annual change of Consumer Price Index during loan term-
Exchange rateERRate of annual change of variation in exchange rate during loan term+
Unemployment rateURRate of annual change of variation in unemployment rate during loan term+
Table 2. Significant variables using logistic regression.
BS.E.WaldExp(B)
Gen (1)−0.099 ***0.0612.6420.906
Civil_St (1)−0.060 ***0.0601.0110.942
Zone (1)−0.057 ***0.0600.9030.945
Lab_Sit (1)−0.047 ***0.0600.6310.954
Old−0.082 **0.0111.3260.988
Cred_Grant−0.180 ***0.0132.1390.982
Denied_Cred0.147 ***0.0600.6231.048
Current_Cred0.083 ***0.0600.0501.013
Delay_Fee0.557 ***1.1280.7972.737
Delay_Av0.006 ***0.0070.7561.006
R1−0.098 ***0.2510.1510.907
R2−0.307 **0.2481.5310.736
R30.124 ***0.3320.1381.132
R5−3.407 ***2.1162.5920.033
Duration0.011 ***0.0110.8821.011
Amount0.002 ***0.0020.8341.002
Int_rate1.735 ***3.0190.3305.669
Guarant (1)0.437 ***0.1915.2441.548
Forecast (1)0.041 *0.1160.1241.042
Constant−1.248 ***0.7770.102
(*), (**), (***) represent the significance of 10%, 5%, and 1%, respectively.
Table 3. Classification matrix and AUC.
Logistic Regression
Observ.Prediction
01PCC
0180955976.39%
1590159272.96%
PCC 74.75%
AUC: 0.8433
Neural Network
Observ.Prediction
01PCC
0201934985.26%
1320186285.33%
PCC 85.30%
AUC: 0.8917
Table 4. Data for three borrowers and PD.
AcronimBorrower 1Borrower 2Borrower 3
Gen100
Civil_St101
Zone100
Lab-Sit110
Age452760
Sector110
Ed_Level200
Old361018
Cred_Grant512
Denied_Cred002
Current_Cred100
Delay002
Delay_Av006
Arrears000.1111
R10.84050.64930.4367
R20.27930.120.0821
R30.126200.0995
R40.112100.0905
R50.13480.06550.08654
R60.16760.09470.1037
Purpose000
Duration121812
Amount1.4511.2
Int_Rate0.120.150.115
Guarant001
Forecast001
PIB0.21560.05660.0348
IPC0.02190.02070.0080
TC−0.0697−0.0815−0.1374
IE0.10140.07290.0215
PD (LR)0.39%10.36%24.50%
PD (MLP)0.12%2.55%29.02%
Table 5. General information for the design of the pricing model.
ConceptAmount
Microcredit amountUSD 1500
Maturity (years)1
Interest rate (the same for all 3 customers)12.32%
Cost of Debt2.25%
Operating Cost5.24%
Tax Rate25%
RORAC Objetive17.14%
Risk-free rate (Government bond)1.75%
Table 6. Customer profitability and interest rate setting under the Basel III IRB approach. Multi-layer perceptron.
Borrower 1Borrower 2Borrower 3Borrower 1Borrower 2Borrower 3
Before the Rate AdjustmentAfter the Rate Adjustment
Interest rate12.32%12.32%12.32%7.90%10.01%23.70%
Basel III IRB Approach Borrower 1Borrower 2Borrower 3Borrower 1Borrower 2Borrower 3
PD0.12%2.55%29.02%0.12%2.55%29.02%
LGD45.00%45.00%45.00%45.00%45.00%45.00%
Expected Loss (EL)0.8117.21195.890.8117.21195.89
Weight21.89%83.15%191.36%21.89%83.15%191.36%
RWA328.42 USD1247.32 USD 2870.34 USD328.42 USD1247.32 USD 2870.34 USD
Basel III—IRB Coefficient8.00%8.00%8.00%8.00%8.00%8.00%
Stockholders’ Equity26.27 USD99.79 USD229.63 USD26.27 USD99.79 USD229.63 USD
Liabilities1473.73 USD1400.21 USD1270.37 USD1473.73 USD1400.21 USD1270.37 USD
Total1500.00 USD1500.00 USD1500.00 USD1500.00 USD1500.00 USD1500.00 USD
Interest income184.80 USD184.80 USD184.80 USD184.80 USD184.80 USD184.80 USD
Interest expenses33.16 USD31.50 USD28.58 USD33.16 USD31.50 USD28.58 USD
Operating cost78.60 USD78.60 USD78.60 USD78.60 USD78.60 USD78.60 USD
RORAC206.19%43.20%−38.63%17.14%17.14%17.14%
RORAC target17.14%17.14%17.14%17.14%17.14%17.14%
Price (Interest Rate)12.32%12.32%12.32%7.90%10.01%23.70%
Table 7. Customer profitability and interest rate setting under the Basel III IRB approach. Logistic regression.
Borrower 1Borrower 2Borrower 3Borrower 1Borrower 2Borrower 3
Before the Rate AdjustmentAfter the Rate Adjustment
Interest rate12.32%12.32%12.32%8.40%14.30%21.67%
Basel III IRB Approach Borrower 1Borrower 2Borrower 3Borrower 1Borrower 2Borrower 3
PD0.39%10.36%24.50%0.39%10.36%24.50%
LGD45.00%45.00%45.00%45.00%45.00%45.00%
Expected Loss (EL)2.6269.90165.382.6269.90165.38
Weight44.33%130.27%191.36%44.33%130.27%191.36%
RWA664.99 USD1954.08 USD2870.34 USD664.99 USD1954.08 USD2870.34 USD
Basel III—IRB Coefficient8.00%8.00%8.00%8.00%8.00%8.00%
Stockholders’ Equity53.20 USD156.33 USD229.63 USD53.20 USD156.33 USD229.63 USD
Liabilities1446.80 USD1343.67 USD1270.37 USD1446.80 USD1343.67 USD1270.37 USD
Total1500.00 USD1500.00 USD1500.00 USD1500.00 USD1500.00 USD1500.00 USD
Interest income184.80 USD184.80 USD184.80 USD125.93 USD214.46 USD325.04 USD
Interest expenses33.16 USD31.50 USD28.58 USD32.55 USD30.23 USD28.58 USD
Operating cost78.60 USD78.60 USD78.60 USD78.60 USD78.60 USD78.60 USD
RORAC206.19%43.20%−38.63%17.14%17.14%17.14%
RORAC target17.14%17.14%17.14%17.14%17.14%17.14%
Price (Interest Rate)12.32%12.32%12.32%8.40%14.30%21.67%
Table 8. Percentages of specific provision of microcredit for microenterprises.
Risk CategoryProvision (%)
A. Normal risk0.00%
B. Above normal risk5.00%
C. Expected loss20.00%
D. With significant expected losses50.00%
E. High risk of irrecoverability.100.00%
Source: Norm nº JM-93–2005 SIB.
Table 9. Summary of interest rate setting results.
Credit-Scoring Method Borrower 1Borrower 2Borrower 3
Neural NetworkBefore rate adjustment12.32%12.32%12.32%
After rate adjustment7.90%10.01%23.70%
Difference−4.42%−2.31%11.38%
Logistic RegressionBefore the rate adjustment12.32%12.32%12.32%
After the rate adjustment8.40%14.30%21.67%
Gap−3.92%1.98%9.35%
Disclaimer/Publisher’s Note: The statements, opinions and data contained in all publications are solely those of the individual author(s) and contributor(s) and not of MDPI and/or the editor(s). MDPI and/or the editor(s) disclaim responsibility for any injury to people or property resulting from any ideas, methods, instructions or products referred to in the content.

