Article

Improvement of Sound-Absorbing Wool Material by Laminating Permeable Nonwoven Fabric Sheet and Nonpermeable Membrane

1
Department of Engineering, Niigata University, Ikarashi 2-no-cho 8050, Nishi-ku, Niigata 950-2181, Japan
2
Graduate School of Science and Technology, Niigata University, Ikarashi 2-no-cho 8050, Nishi-ku, Niigata 950-2181, Japan
*
Author to whom correspondence should be addressed.
Technologies 2024, 12(10), 195; https://doi.org/10.3390/technologies12100195
Submission received: 31 July 2024 / Revised: 27 September 2024 / Accepted: 9 October 2024 / Published: 12 October 2024
(This article belongs to the Section Innovations in Materials Processing)

Abstract

:
Thin sound-absorbing materials are particularly desired in space-constrained applications, such as in the automotive industry. In this study, we theoretically analyzed the structure of relatively thin glass wool or polyester wool laminated with a nonpermeable polyethylene membrane and a permeable nonwoven fabric sheet. We also measured and compared the sound-absorption coefficients of these samples between experimental and theoretical values. The sound-absorption coefficient was derived using the transfer matrix method. The Rayleigh model was applied to describe the acoustic behavior of glass wool and nonwoven sheet, while the Miki model was used for polyester wool. Mathematical formulas were employed to model an air layer without damping and a vibrating membrane. These acoustic components were integrated into a transfer matrix framework to calculate the sound-absorption coefficient. The sound-absorption coefficients of glass wool and polyester wool were progressively enhanced by sequentially adding suitable nonwoven fabric and PE membranes. A sample approximately 10 mm thick, featuring permeable and nonpermeable membranes as outer layers of porous sound-absorbing material, achieved a sound-absorption coefficient equivalent to that of a sample occupying 20 mm thickness (10 mm of porous sound-absorbing material with a 10 mm back air layer).

1. Introduction

Porous materials are widely used in various fields owing to their high sound-absorption performance in the mid- to high-frequency range [1,2,3,4]. However, thin sound-absorbing materials are particularly desired in space-constrained applications, such as in the automotive industry. Generally, to control the sound-absorption curve of porous materials at low frequencies, an increase in the thickness of the sound-absorption mechanism is required.
Thin porous sheets with a back air space also exhibit peak sound-absorption frequencies that depend on the thickness occupied by the sound-absorption mechanism [5,6]. However, this configuration has the drawback that its peak sound-absorption curve is sharper compared to a porous material of equivalent thickness.
Rayleigh [7] and many other researchers have investigated the prediction of the sound-absorption coefficient of porous materials. Delany and Bazley [8] proposed an equation using characteristic impedance, propagation constant, and flow resistivity derived from extensive empirical data to predict the sound-absorption coefficient. Allard et al. [9] validated the equation’s applicability to textile materials. Subsequently, Miki [10] and Komatsu [11] enhanced Delany and Bazley’s prediction equation.
The models developed by Miki and Komatsu are widely adopted for predicting the sound-absorption properties of porous materials because they determine propagation constants and characteristic impedances from empirical equations based on experimental data.
Glass wool, a typical porous material, is widely used for sound absorption owing to its excellent performance enabled by continuous pores composed of glass fibers [12]. To mitigate its structural fragility, glass wool is sometimes coated with a thin protective material on its surface [13]. Research indicates that this protective coating can enhance its sound-absorption capabilities [14,15,16]. Studies have also examined the effect of membrane adhesion conditions on sound absorption when porous sound-absorbing materials are coated with a thin nonpermeable membrane [17]. Moreover, research has documented enhanced sound absorption in permeable membranes achieved by reducing membrane vibration [18]. Additionally, investigations have explored the impact of adhesion conditions on sound absorption when porous materials are coated with both permeable and nontransparent membranes [19]. While experimental studies have explored the effect of surface protection materials on sound-absorption properties, there are few studies on the underlying mechanisms and theoretical interpretations when multiple protection materials are combined [20].
Building upon the above-mentioned background, in this study, we theoretically analyzed the structure of relatively thin glass wool or polyester wool laminated with a nonpermeable polyethylene membrane and a permeable nonwoven fabric sheet. The sound-absorbing properties of this structure are believed to result from the combination of glass wool or polyester wool with a thin porous material and a membrane vibration sound absorber, each contributing to the overall sound-absorption performance. We also measured and compared the sound-absorption coefficients of these samples between experimental and theoretical values. These materials lack mechanical strength to function as structural components. However, the laminated structure is expected to slightly reinforce the fragile surfaces of glass and polyester wool when using polyethylene film and nonwoven sheets. In this study, to enhance the flame resistance of the materials, glass wool was considered suitable, and both polyester wool and polyethylene were treated with a flame retardant [21].
In the theoretical analysis, the sound-absorption coefficient was derived using the transfer matrix method. The Rayleigh model [7] was applied to describe the acoustic behavior of glass wool and nonwoven sheet, while the Miki model [10] was used for polyester wool. These models simulate sound-wave propagation through complex structures such as porous materials. Material specifications, including density, flow resistivity, and thickness, were taken into account in each model. Mathematical formulas were employed to model an air layer without damping and a vibrating membrane [18]. These acoustic components were integrated into a transfer matrix framework to calculate the sound-absorption coefficient. Experimental measurements were performed using a two-microphone acoustic impedance tube.

2. Measurement Equipment and Samples

2.1. Measuring Equipment

The sound-absorption coefficient was measured using a Brüel & Kjær Type 4206 two-microphone impedance measurement tube. Figure 1 illustrates the schematic diagram of the setup. A sample was mounted onto the impedance measurement tube, where a sinusoidal signal was generated by the signal generator in the fast Fourier-transform (FFT) analyzer. This signal was then emitted into the tube via a loudspeaker. The transfer function between the sound-pressure signals from the two microphones attached to the tube was captured by the FFT analyzer. The measured transfer function was subsequently used to calculate the vertical incident sound-absorption coefficient following the procedures outlined in ISO 10534-2 [22]. The critical frequency at which a plane wave is formed depends on the inner diameter of the acoustic tube. For the sample holder used in this study, which has an inner diameter of 29 mm, the upper limit of the measurement range is 6400 Hz. The input signal to the loudspeaker was set at 0.2 V.
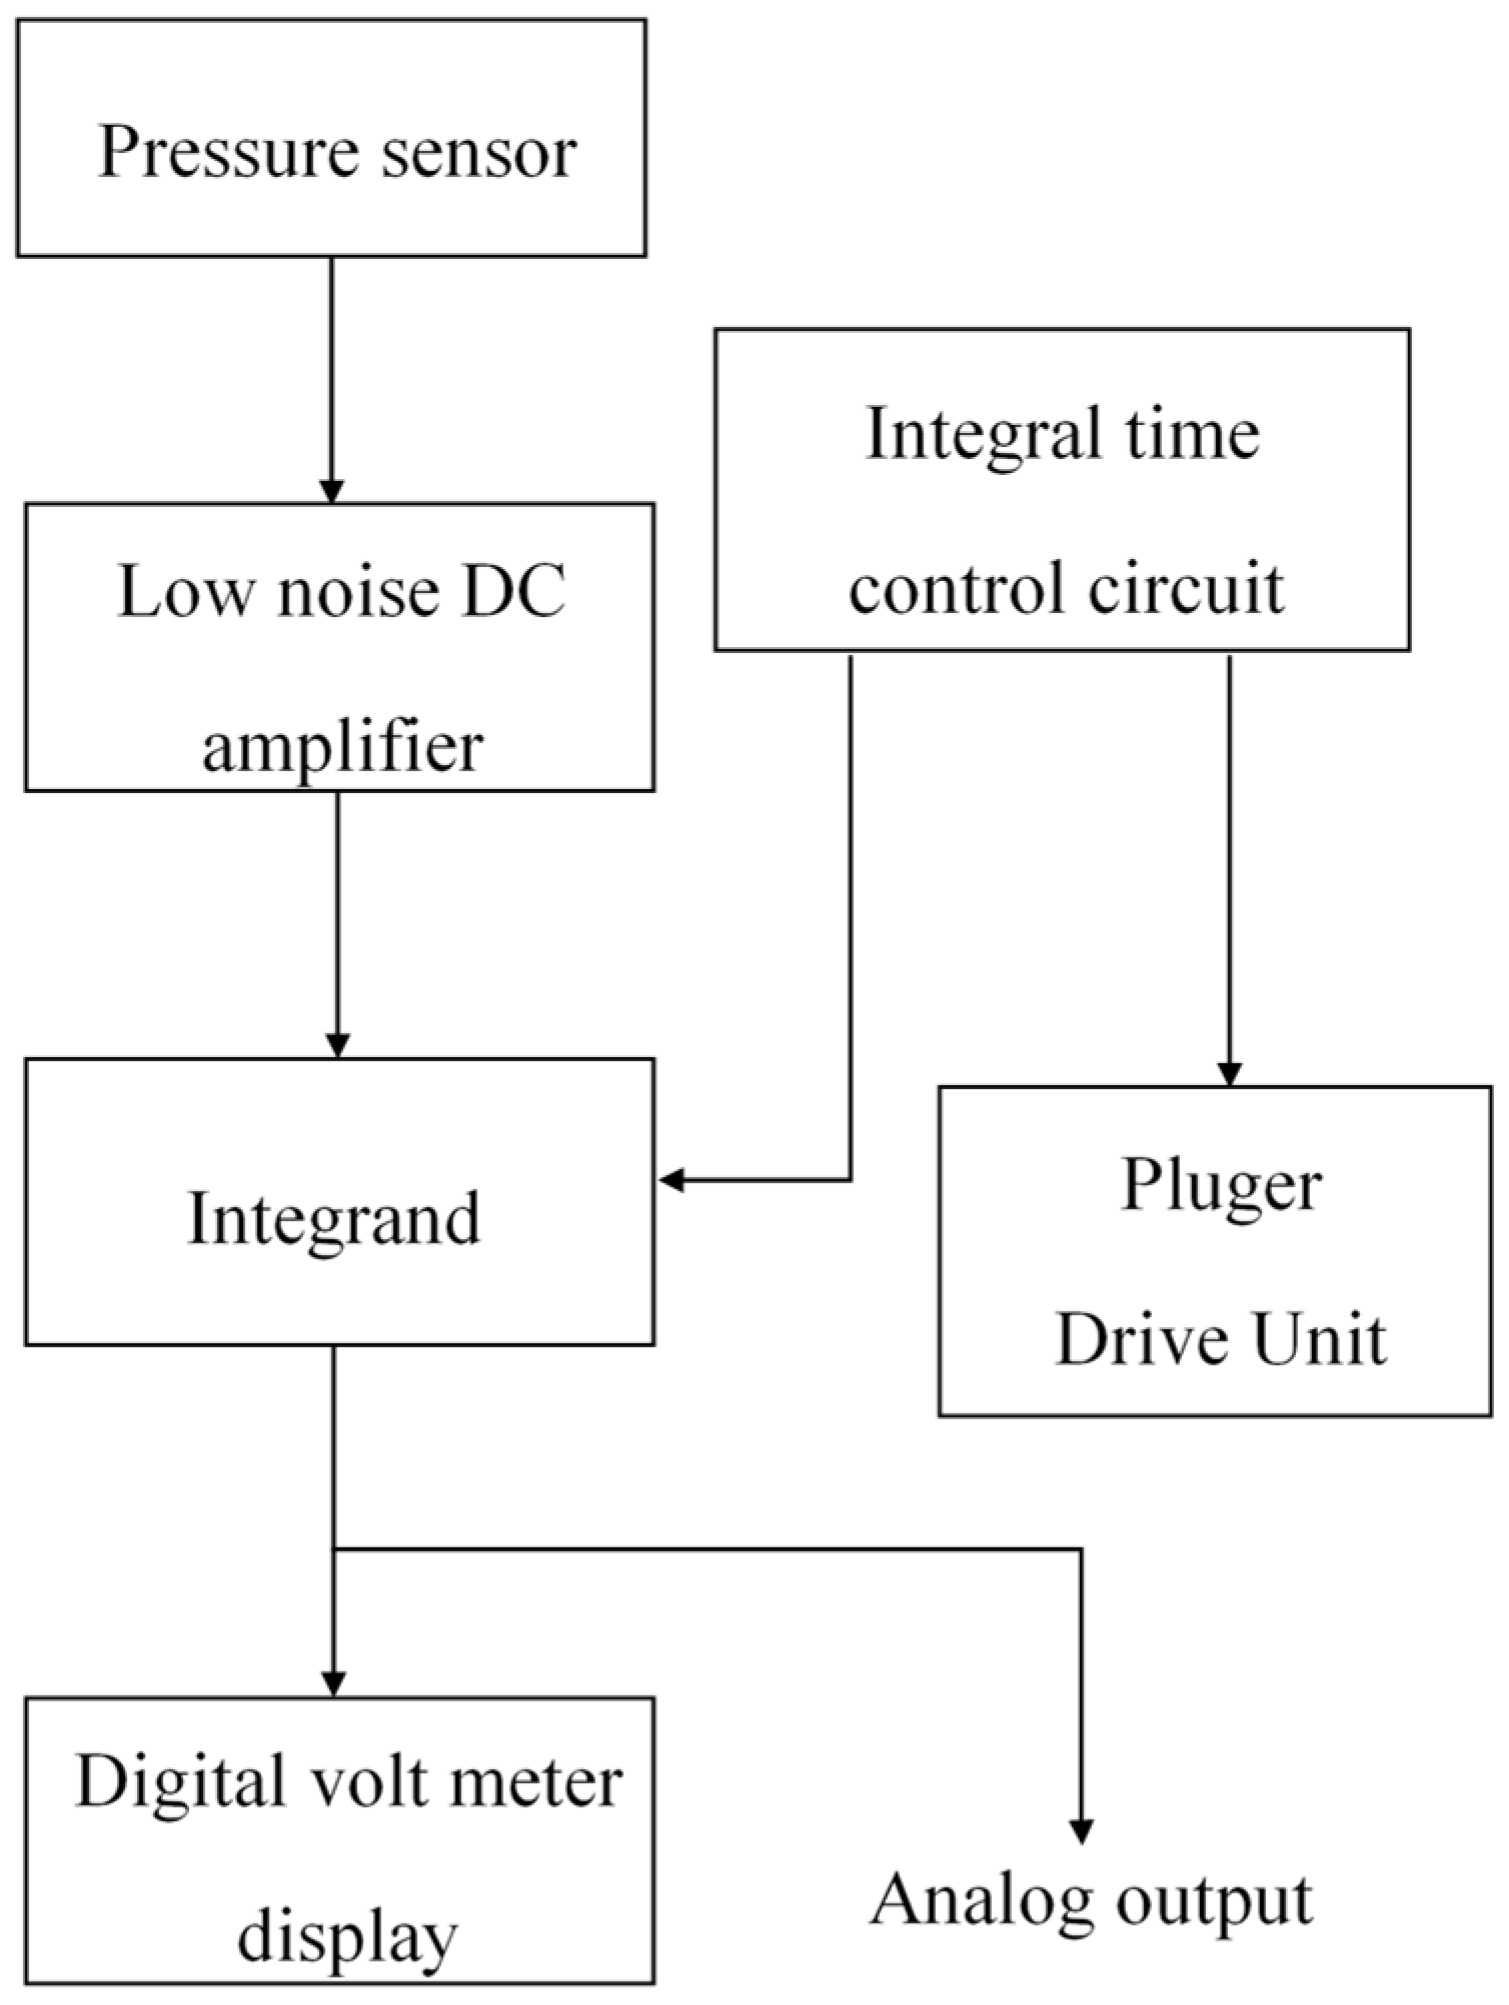
The ventilation resistance of nonwoven fabric, glass wool, and polyester wool was measured using a Kato Tech KES-F8-AP1 ventilation resistance tester. Figure 2 shows a block diagram of the ventilation resistance tester. Air was passed through the sample at a constant volume velocity, with the air being discharged and aspirated in both directions. The flow resistivity, R, was then calculated from the pressure loss in the airflow.

2.2. Measurement Samples

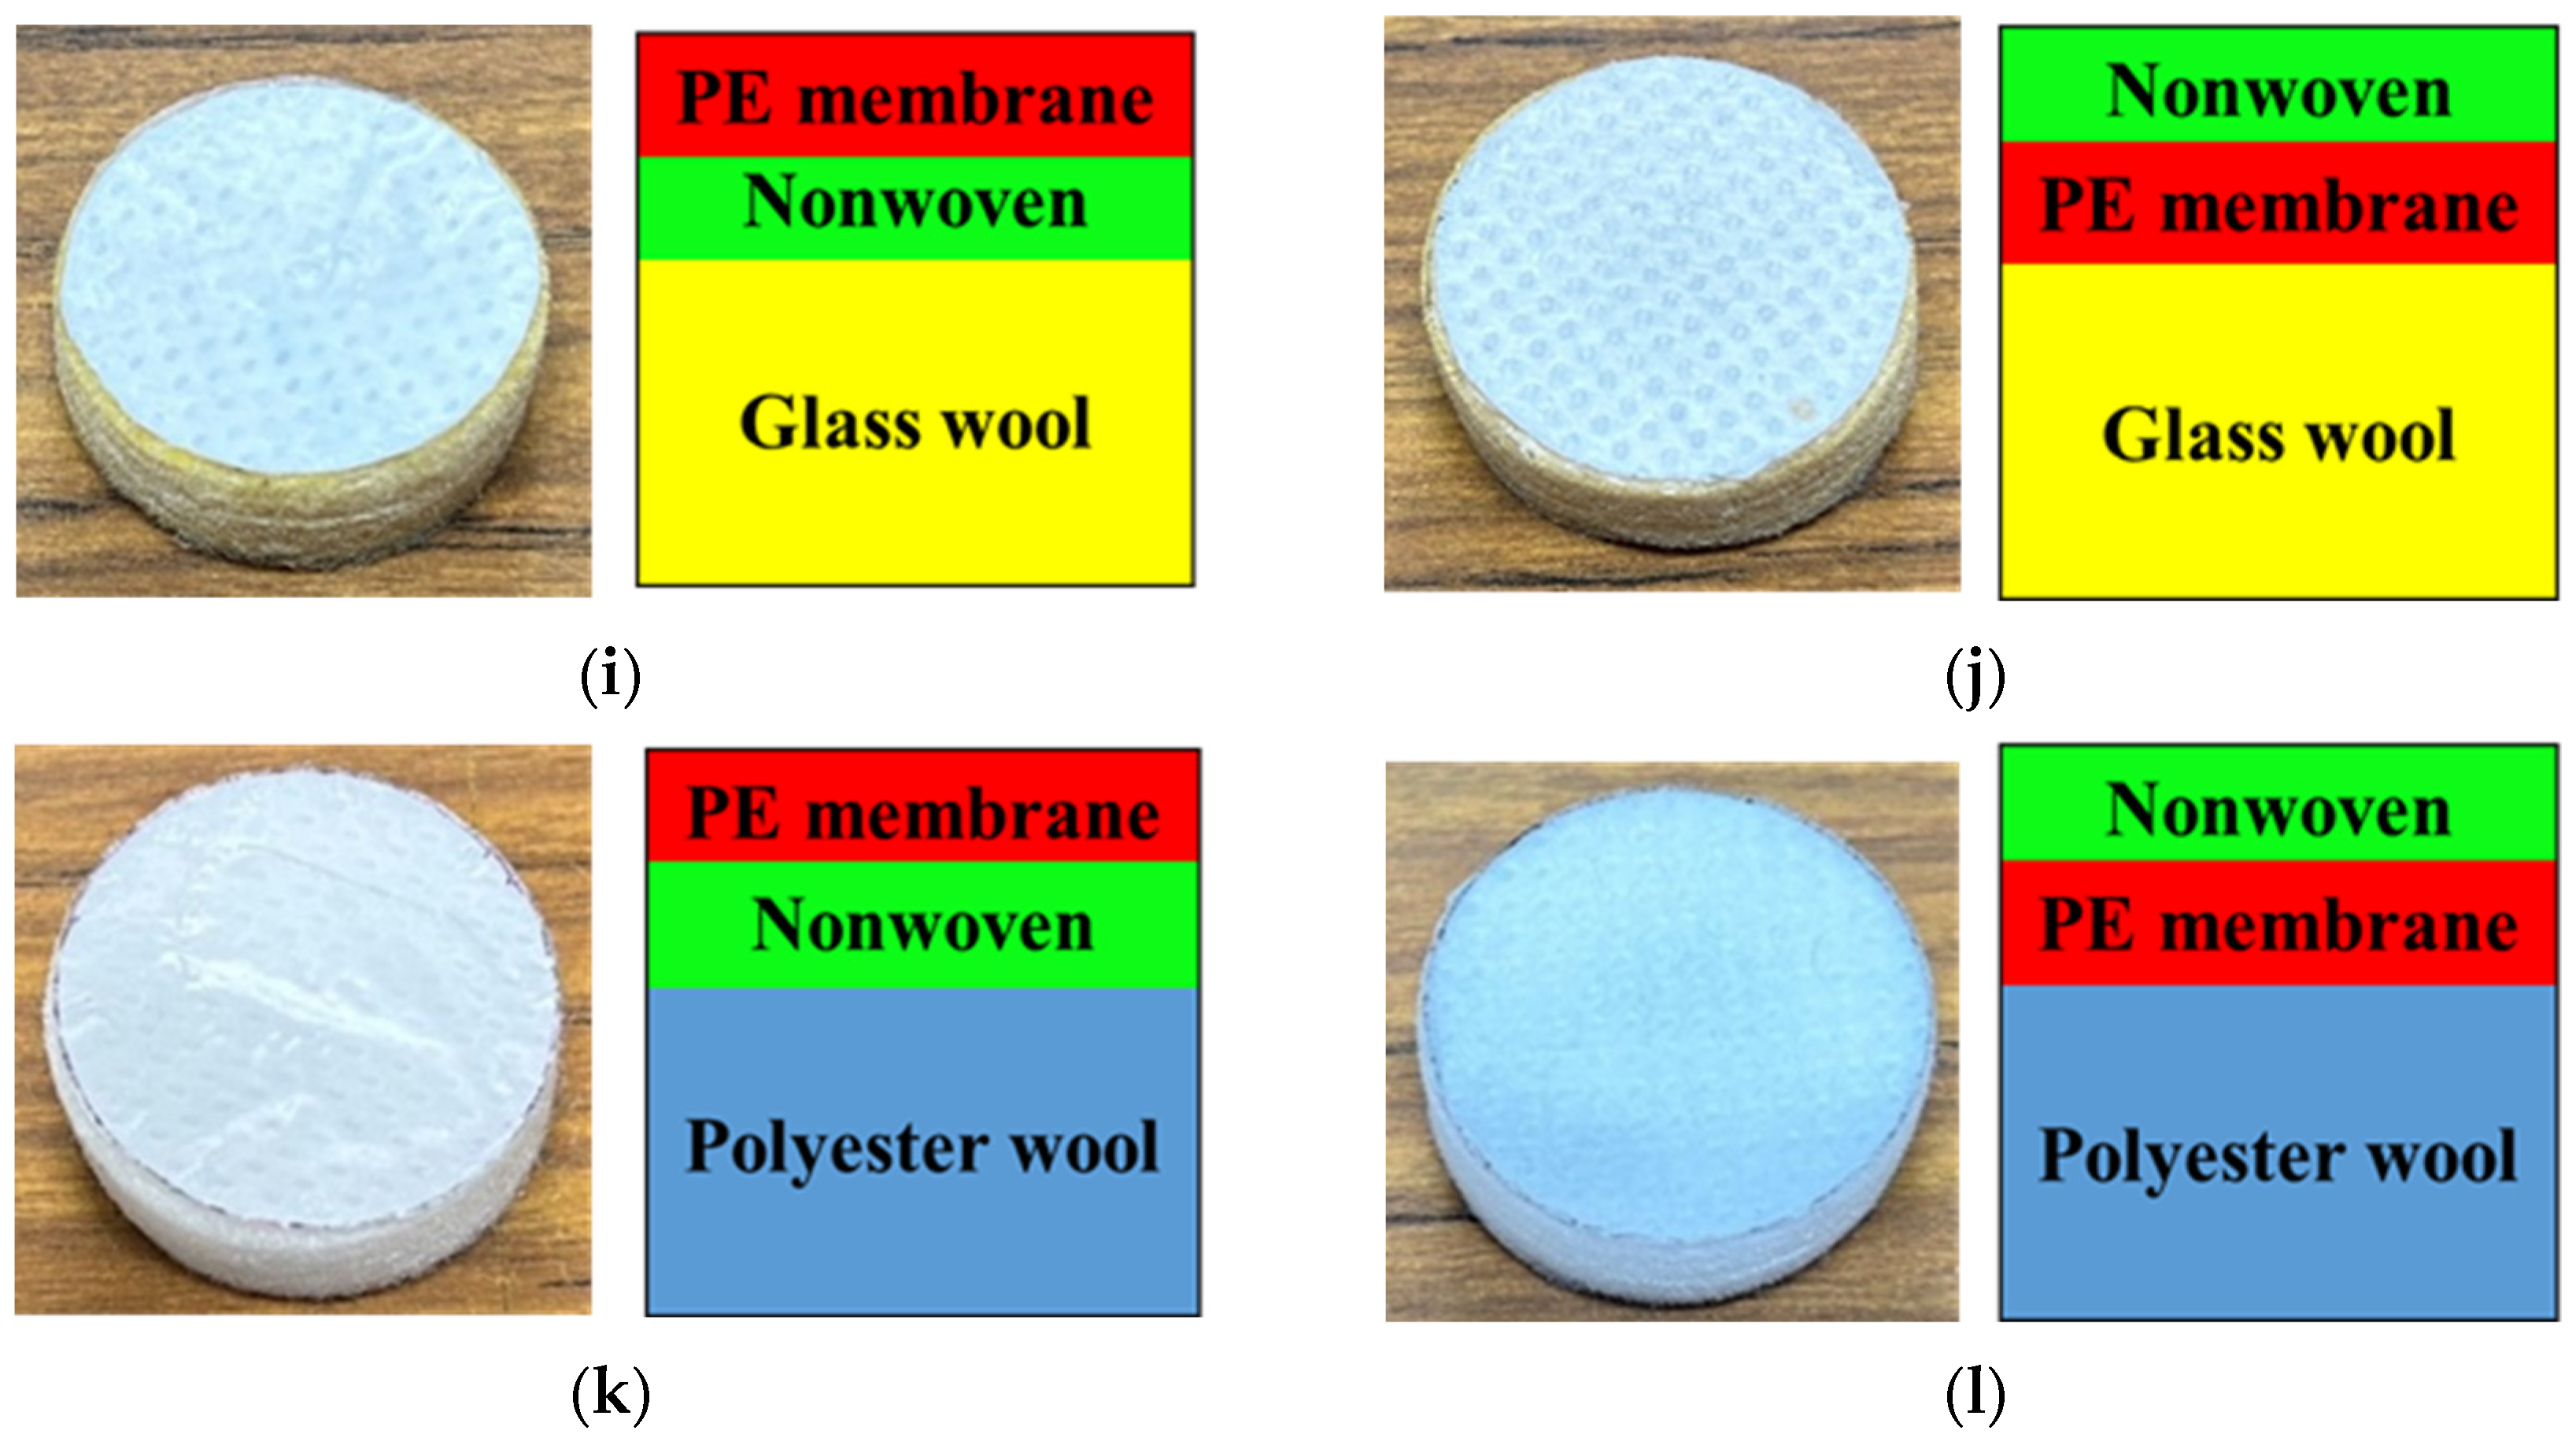
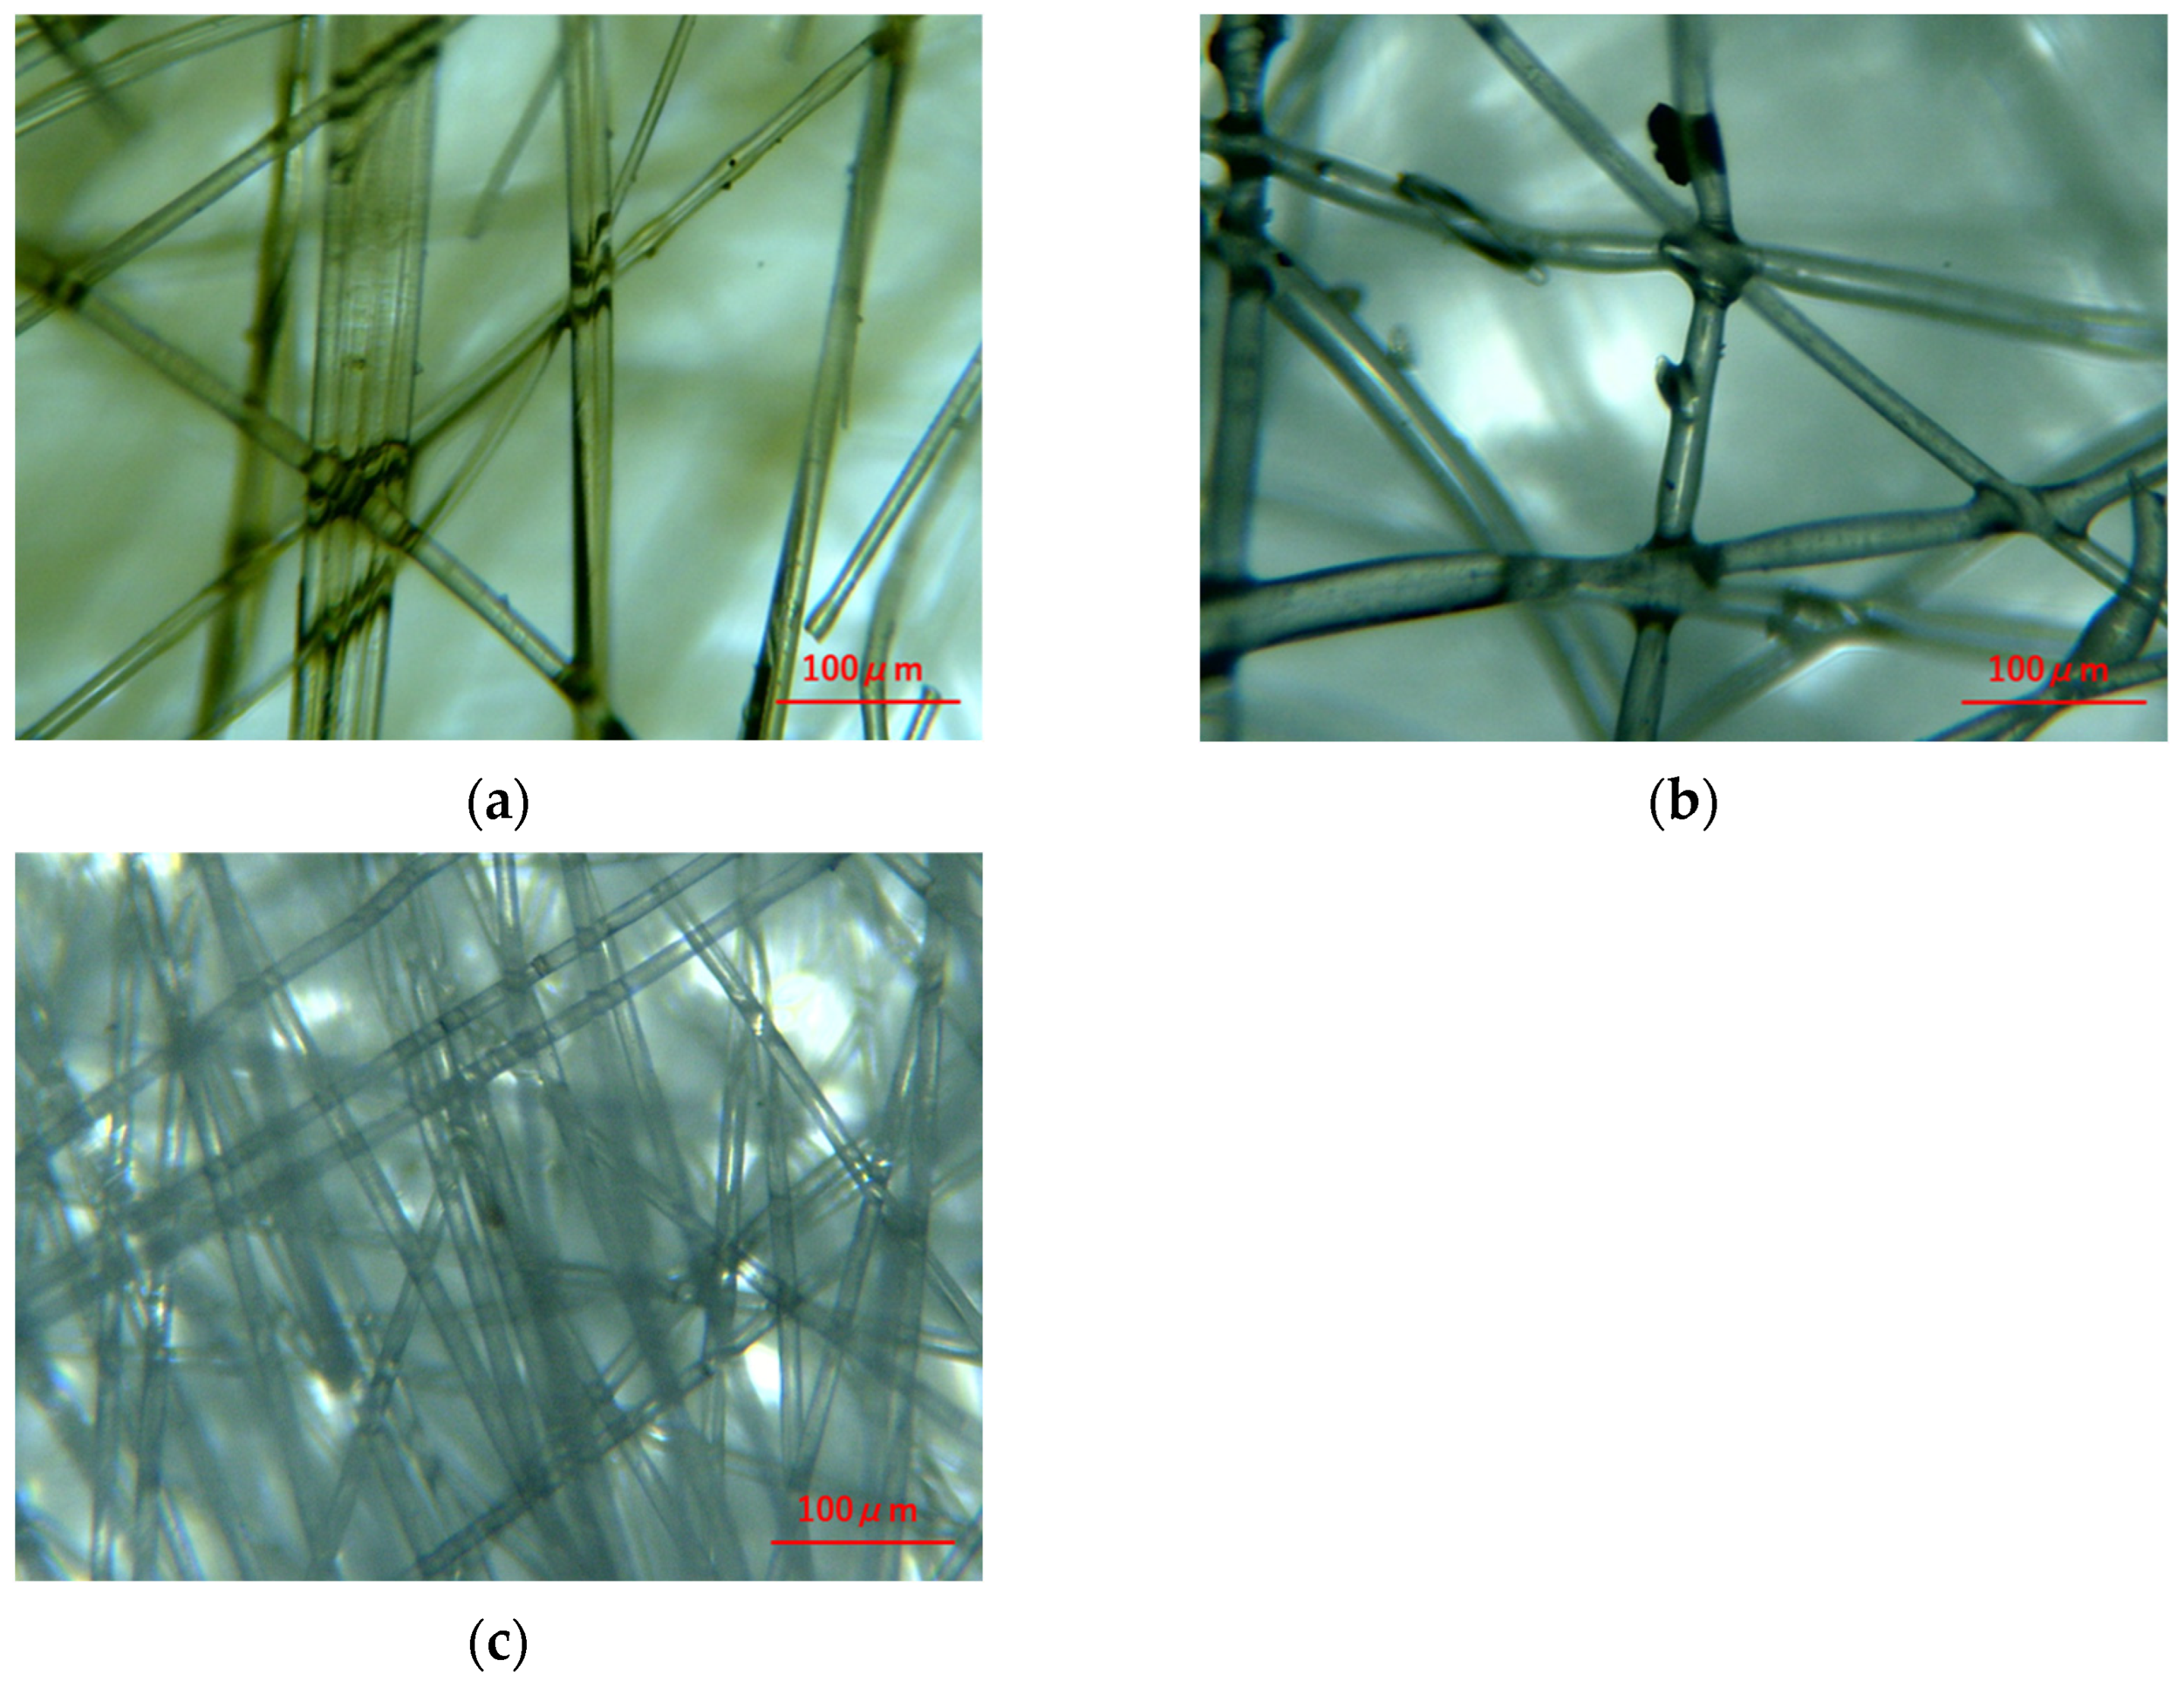
Figure 3a–l show photographs and schematic diagrams of the glass wool 74k, polyester wool, nonwoven fabric, and PE film used to create the measurement samples, along with the fabricated samples. It has been reported [23] that the sound-absorption curve slightly changes for nonwoven fabrics with an uneven 2 mm thickness. However, the nonwoven fabric surface used in this study was considered flat because its thickness decreases only in the point bonding area, whereas the rest of the surface remains flat. Micrographs of the measured samples (a)–(c) in Figure 3 are shown in Figure 4a–c. The materials were cut to a diameter of 29 mm, matching the inner diameter of the sample holder.
Table 1 presents the properties of the materials used. Glass wool is used from Paramount Glass Mfg. Co. Ltd., Sukagawa, Fukushima, Japan. The fiber diameter of each measured sample (and the corresponding porosity) was determined using the micrographs shown in Figure 4. The nonwoven fabric is 3A01A from Toyobo Co. Ltd., Kita-ku, Osaka, Japan, and the polyester wool sound-absorbing material is a prototype with general specifications.
The ventilation resistance, R, was measured using the above-mentioned ventilation resistance tester. The flow resistivity, σ, was calculated by dividing the ventilation resistance, R, by the thickness, t.

2.3. Sample Holder

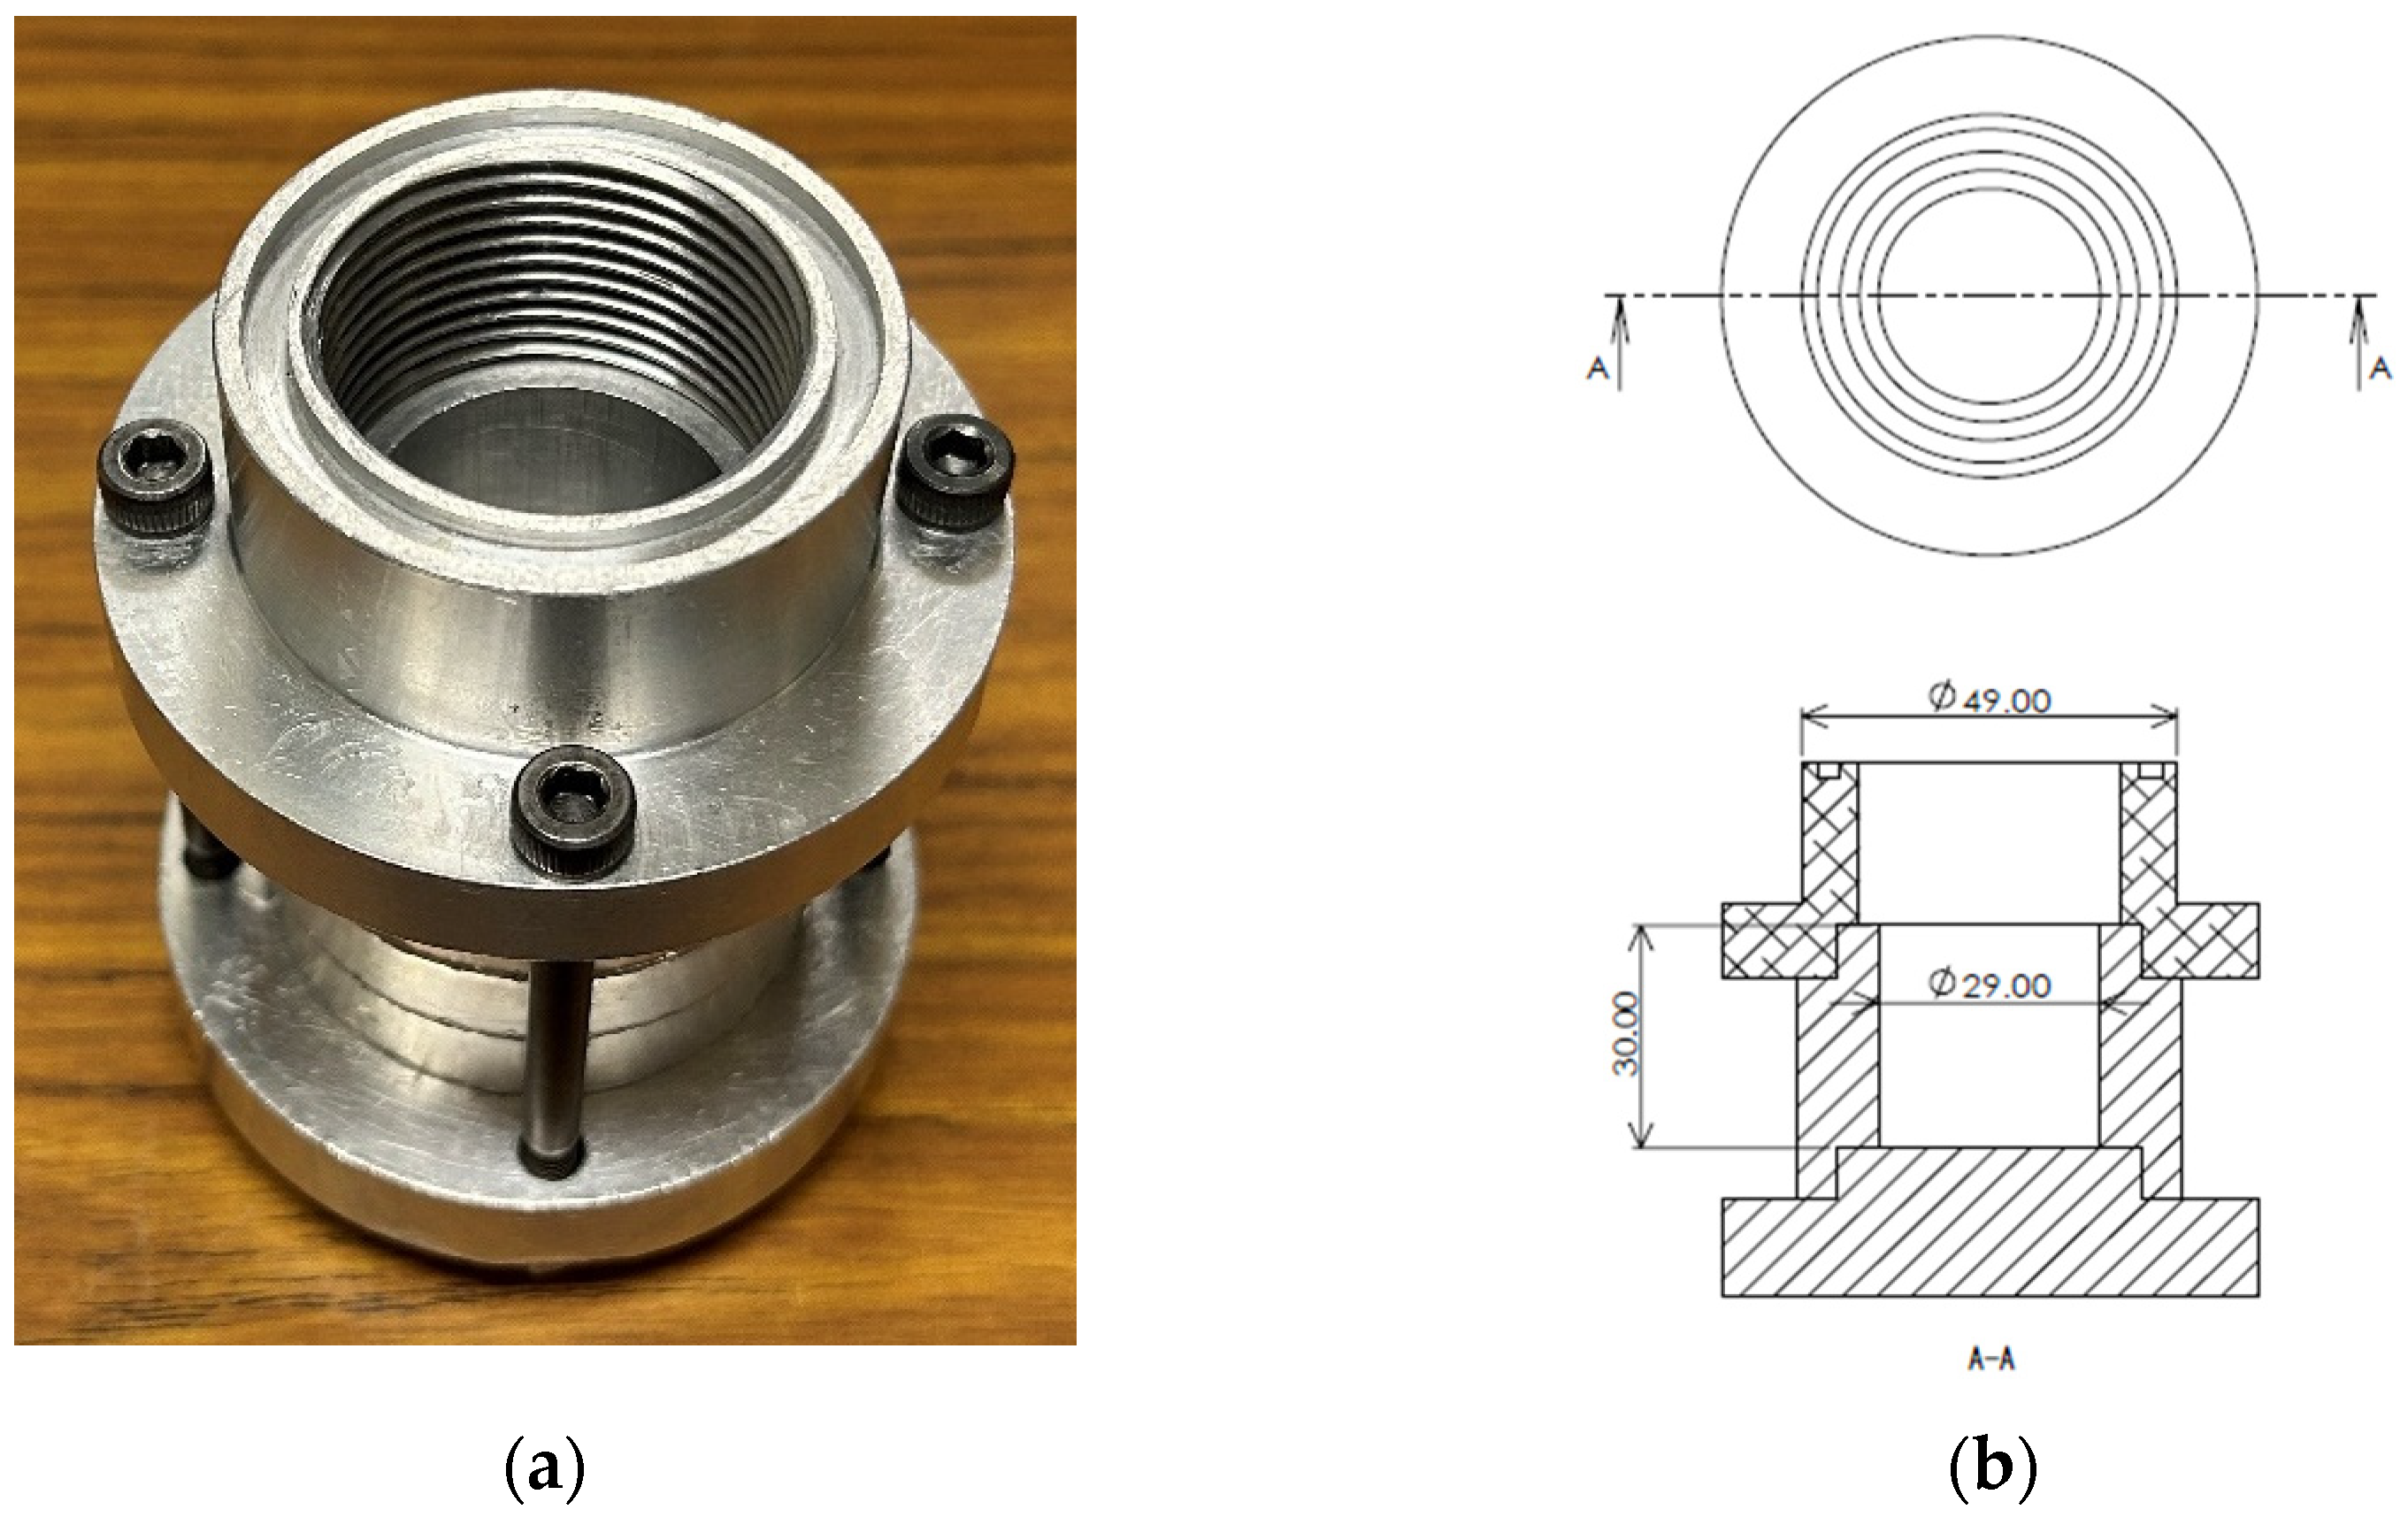
Figure 5a,b present a photograph and a schematic diagram of the sample holder. The holder is made of aluminum alloy and has an inside diameter of 29 mm and an outside diameter of 49 mm. The sample is placed at the bottom of the sample tube, as shown in Figure 5b, for measuring the normal-incidence sound-absorption coefficient.

3. Theoretical Analysis

3.1. Analytical Model for Each Stacked Structure

In this section, the sound-absorption coefficients of the samples described in Section 2 are derived through theoretical analysis using the transfer matrix method for sound pressure and volume velocity.
Figure 6 displays schematic diagrams corresponding to the samples (a)–(l) in Figure 3a–l. Figure 7 shows the equivalent circuits represented by electrical four-terminal networks corresponding to the samples and schematic diagrams in Figure 3a–l and Figure 6. Each four-terminal network is cascaded in the order of the material lamination. Let TGW represent the transfer matrix of glass wool, TPW the transfer matrix of polyester wool, and Tn the transfer matrix of nonwoven fabric. The propagation constant γ and characteristic impedance Zc of the glass wool and nonwoven fabric were calculated using the Rayleigh model [7], while those of the polyester wool were determined using the Miki model [10]. The transfer matrix TPE for the PE membrane was calculated considering the single DOF (degree of freedom) vibration model [18]. Additionally, to maintain a total sample thickness of approximately 10 mm, a theoretical analysis model without glass wool or polyester wool was assigned a layered transfer matrix Tb, corresponding to a 10 mm thick back air space.

3.2. Transfer Matrix Based on One-Dimensional Wave Equation

The transfer matrix of an acoustic element is expressed by the wave equation of a one-dimensional sound field in which a plane wave propagates. Let p1 be the sound pressure and u1 be the particle velocity at the plane of incidence of the sound wave; let p2 be the sound pressure and u2 be the particle velocity at the end plane, and let S be the cross-sectional area of the acoustic element. The transfer matrix T for the sound pressure and volume velocity between the incident and end planes is expressed as follows [24]:
p 1 S u 1 = T p 2 S u 2 = A B C D p 2 S u 2
where the four-terminal constants A, B, C, and D in the transfer matrix T are derived from the one-dimensional wave equation as follows:
T = A B C D = cosh γ l Z c S sinh γ l S Z c sinh γ l cosh γ l
where γ is the propagation constant, Zc is the characteristic impedance, and l is the length of the acoustic element.

3.3. Transfer Matrix of Back Air Space

The transfer matrix of the back air space can be expressed by neglecting attenuation in the transfer matrix, using the one-dimensional wave equation in Equation (2) as follows:
T b = cos k L j ρ c S sin k L j S ρ c sin k L cos k L = A b B b C b D b
where k is the wavenumber, ρ is the density of air, c is the speed of sound in air, and L is the length of the back air space.

3.4. Transfer Matrix of Porous Materials

Nonwoven fabric 3A01A, glass wool, and polyester wool are treated as porous materials in the transfer matrix. The characteristic impedances Zn and ZGW and propagation constants γn and γGW of the nonwoven fabric and glass wool, respectively, are expressed using the Rayleigh model [7]. The characteristic impedance ZPW and propagation constant γPW of polyester wool are expressed using the Miki model [10]:
Z n = ρ c 1 + σ n j ω ρ
Z G W = ρ c 1 + σ G W j ω ρ
Z P W = 0.160 ω c f σ P W 0.618 + j ω c 1 + 0.109 f σ P W 0.618
γ n = j ω c 1 + σ n j ω ρ
γ G W = j ω c 1 + σ G W j ω ρ
γ P W = ρ c 1 + 0.0699 f σ P W 0.632 j ρ c 0.107 f σ P W 0.632
where σn, σGW, and σPW are the flow resistivity of nonwoven fabric, glass wool, and polyester wool, respectively. The transfer matrices Tn for nonwoven fabric, TGW for glass wool, and TPW for polyester wool are obtained by substituting Equations (4)–(9) into Equation (2). Additionally, tn, tGW, and tPW are the thicknesses of nonwoven fabric, glass wool, and polyester wool, respectively.
T n = cosh γ n t n Z n S sinh γ n t n S Z n sinh γ n t n cosh γ n t n = A n B n C n D n
T G W = cosh γ G W t G W Z G W S sinh γ G W t G W S Z G W sinh γ G W t G W cosh γ G W t G W = A G W B G W C G W D G W
T P W = cosh γ P W t P W Z P W S sinh γ P W t P W S Z P W sinh γ P W t P W cosh γ P W t P W = A P W B P W C P W D P W

3.5. Transfer Matrix of PE Membrane

The analytical model of the vibrating membrane represents a one-degree-of-freedom vibration system. The acoustic impedance ZPE, neglecting the impedance of the spring section, is expressed as follows [18]:
Z P E = 2 ξ m K S P E 2 + j ω ρ P E S P E S P E 2
where ρPE is the areal density of the PE film, ζ is the damping ratio, ω is the angular frequency of the sound wave, m is the mass of the PE film, and SPE is the cross-sectional area of the PE film. The attenuation ratio was calculated for each sample using the half-width method.
When the back space of the PE film is filled with air, as depicted in Figure 6d, K in Equation (13) is the spring constant of the air, ka, and is expressed as follows:
K = k a = Γ p 0 S p L
where Γ is the specific heat ratio, p0 is the atmospheric pressure, and L is the length of the back air space.
Here, for instance, when the PE film is backed by glass wool, as illustrated in Figure 6f, K in Equation (13) represents the complex volume modulus of glass wool, denoted as KGW. It is expressed by the following equation using the characteristic impedance ZGW and propagation constant γGW of glass wool. Similarly, in the case of polyester wool, as depicted in Figure 7h, K in Equation (13) denotes the complex volume modulus of elasticity KPW of polyester wool, which is expressed using the characteristic impedance ZPW and propagation constant γPW of polyester wool.
K = K G W = j ω Z G W γ G W ,    K = K P W = j ω Z P W γ P W
Thus, the transfer matrix TPE for an oscillating PE film is expressed as:
T P E = 1 Z P E 0 1 = 1 2 ξ m K S P E 2 + j ω ρ P E S P E S P E 2 0 1 = A P E B P E C P E D P E

3.6. Overall Transfer Matrix and Sound-Absorption Coefficient

The transfer matrix Tall of the entire acoustic system is constructed by multiplying the transfer matrices of each element starting from the sound-wave incident side. For instance, as depicted in Figure 7i, when TPE, Tn, and TGW are connected sequentially from the sound-wave incident side, the transfer matrix Tall of the entire acoustic system is expressed as follows:
T a l l = A P E B P E C P E D P E × A n B n C n D n × A G W B G W C G W D G W = A a l l B a l l C a l l D a l l
The sound-absorption coefficient is calculated using the transfer matrix Tall. The four-terminal constants of Tall correspond to the four-terminal constants A, B, C, and D of the transfer matrix T in Equation (1). Under the condition of a terminal rigid wall where u2 = 0, Equation (1) is expressed as:
p 1 S u 1 = A a l l p 2 C a l l p 2
The specific acoustic impedance Z of this acoustic system, as viewed from the incident plane, is given by:
Z = p u
where, from p = p1 and Su = Su1, the specific acoustic impedance Z is expressed as:
Z = p u = p S u S = p 1 S u 1 S = A a l l C a l l S
Here, the relationship between specific acoustic impedance Z and reflectance R is defined by the following equation:
R = Z ρ c Z + ρ c
The sound-absorption coefficient α is expressed using the reflection coefficient R as follows:
α = 1 R 2

4. Experimental and Theoretical Values of Sound-Absorption Coefficient

4.1. Sound-Absorption Coefficient of Individual Materials

Figure 8 displays the experimental and theoretical sound-absorption coefficients of each material represented by solid and dashed lines, respectively. A 10 mm thick back air space was provided behind both the nonwoven fabric and PE membrane in each sample, resulting in an approximate sample thickness of 10 mm. The theoretical analysis of samples (a)–(d) corresponds to the transfer matrices depicted in Figure 7a–d, respectively.
Figure 8 demonstrates consistent experimental and theoretical trends for each material. Owing to the inner diameter limitation of the acoustic tube used, the upper-frequency limit for measuring the sound-absorption coefficient is approximately 6400 Hz. Consequently, experimental values for samples (a)–(c) do not confirm the sound-absorption peak. The theoretical values indicate peaks at approximately 11,000 Hz for glass wool, 10,000 Hz for polyester wool, and 8300 Hz for nonwoven fabric.

4.2. Sound-Absorption Coefficient of Samples with Two Materials Stacked Together

Figure 9a displays the experimental and theoretical values for samples (e) and (f), where nonwoven fabric and PE film are used as the glass-wool skin, respectively. Figure 9b shows the experimental and theoretical values for samples (g) and (h), respectively. The theoretical analysis in Figure 10a,b corresponds to the transfer matrices illustrated in Figure 7e–h.
The theoretical values for samples (a) and (b) in Figure 9a,b indicate that the peak sound-absorption frequency of the porous sound-absorbing material alone lies in the high-frequency range. However, when membranes are stacked, as in samples (e) and (f), the peak sound-absorption frequency approaches that of a single membrane in samples (c) and (d) in Figure 8. In essence, stacking the membranes causes the peak sound-absorption frequency of the porous sound-absorbing material to shift to a lower frequency.

4.3. Experimental and Theoretical Values for Samples with Three Material Stacks

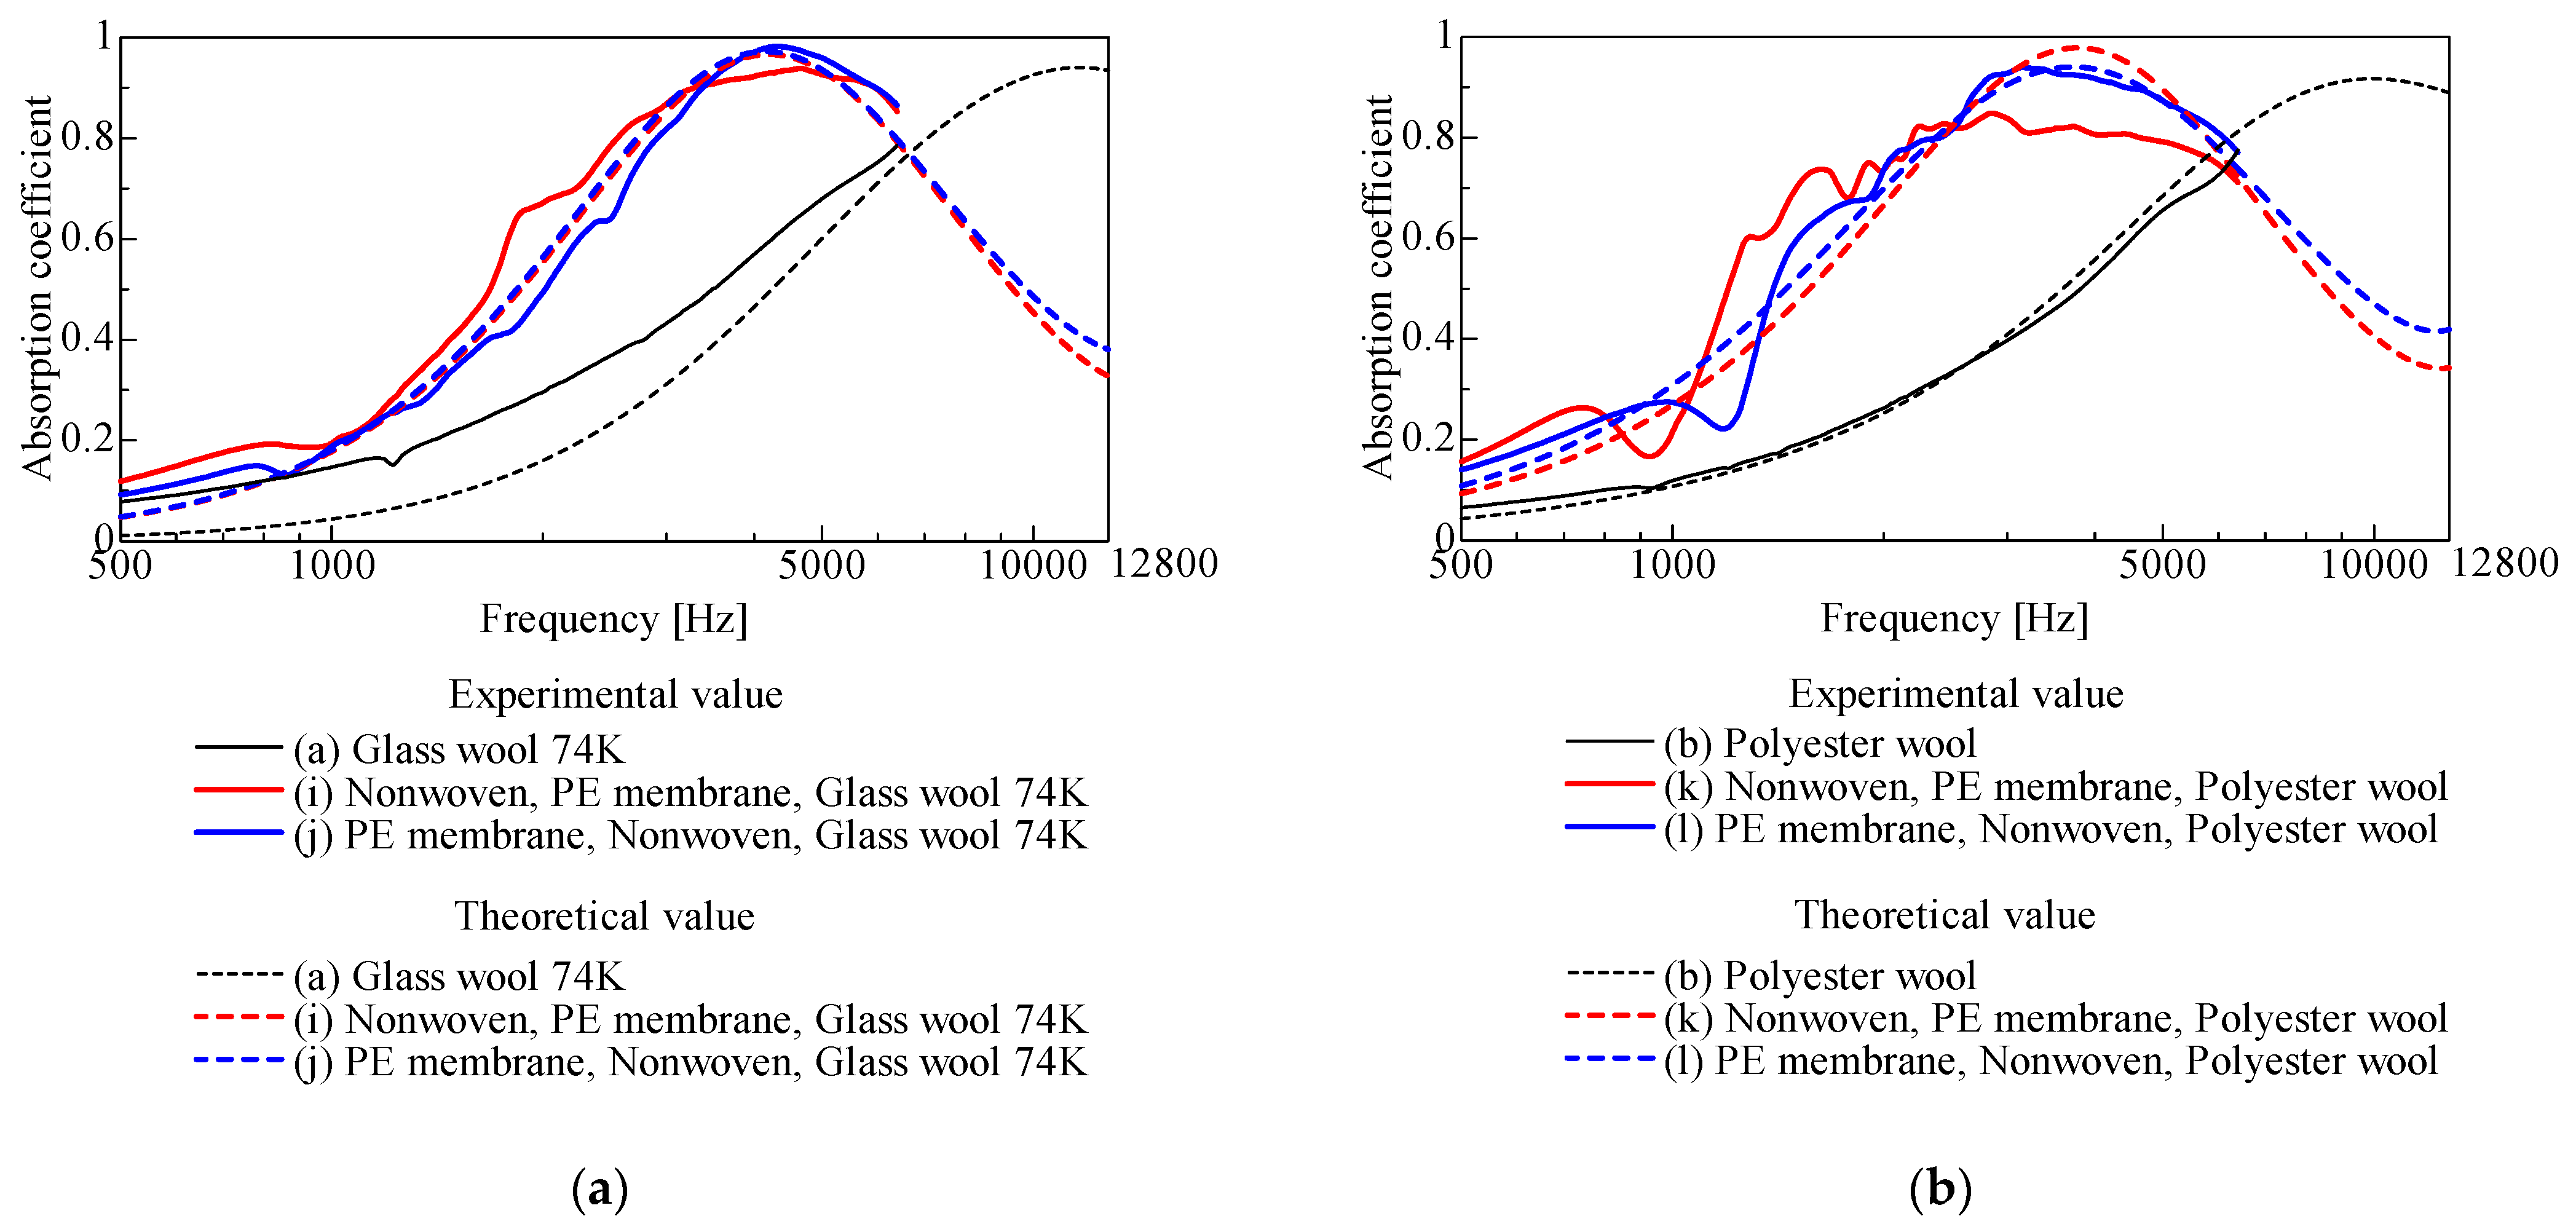
Figure 10a displays the experimental and theoretical values for samples (i) and (j), while Figure 10b shows the experimental and theoretical values for samples (k) and (l), respectively. The theoretical analysis in Figure 10a,b corresponds to the transfer matrices depicted in Figure 7i–l.
In Figure 10, reversing the order of PE film and nonwoven fabric results in a slight change in experimental values, while theoretical values remain largely unchanged. When both nonwoven fabric and PE films are used as the outer layers, the peak frequency of sound absorption shifts to the lower-frequency side compared to samples (a) and (b) individually. Additionally, the sound-absorption curve broadens in the mid-frequency range compared to the two-layer configurations (e)–(h) shown in Figure 9.

4.4. Sensitivity Analysis of the Theoretical Results for Different Nonwoven Fabric Thicknesses

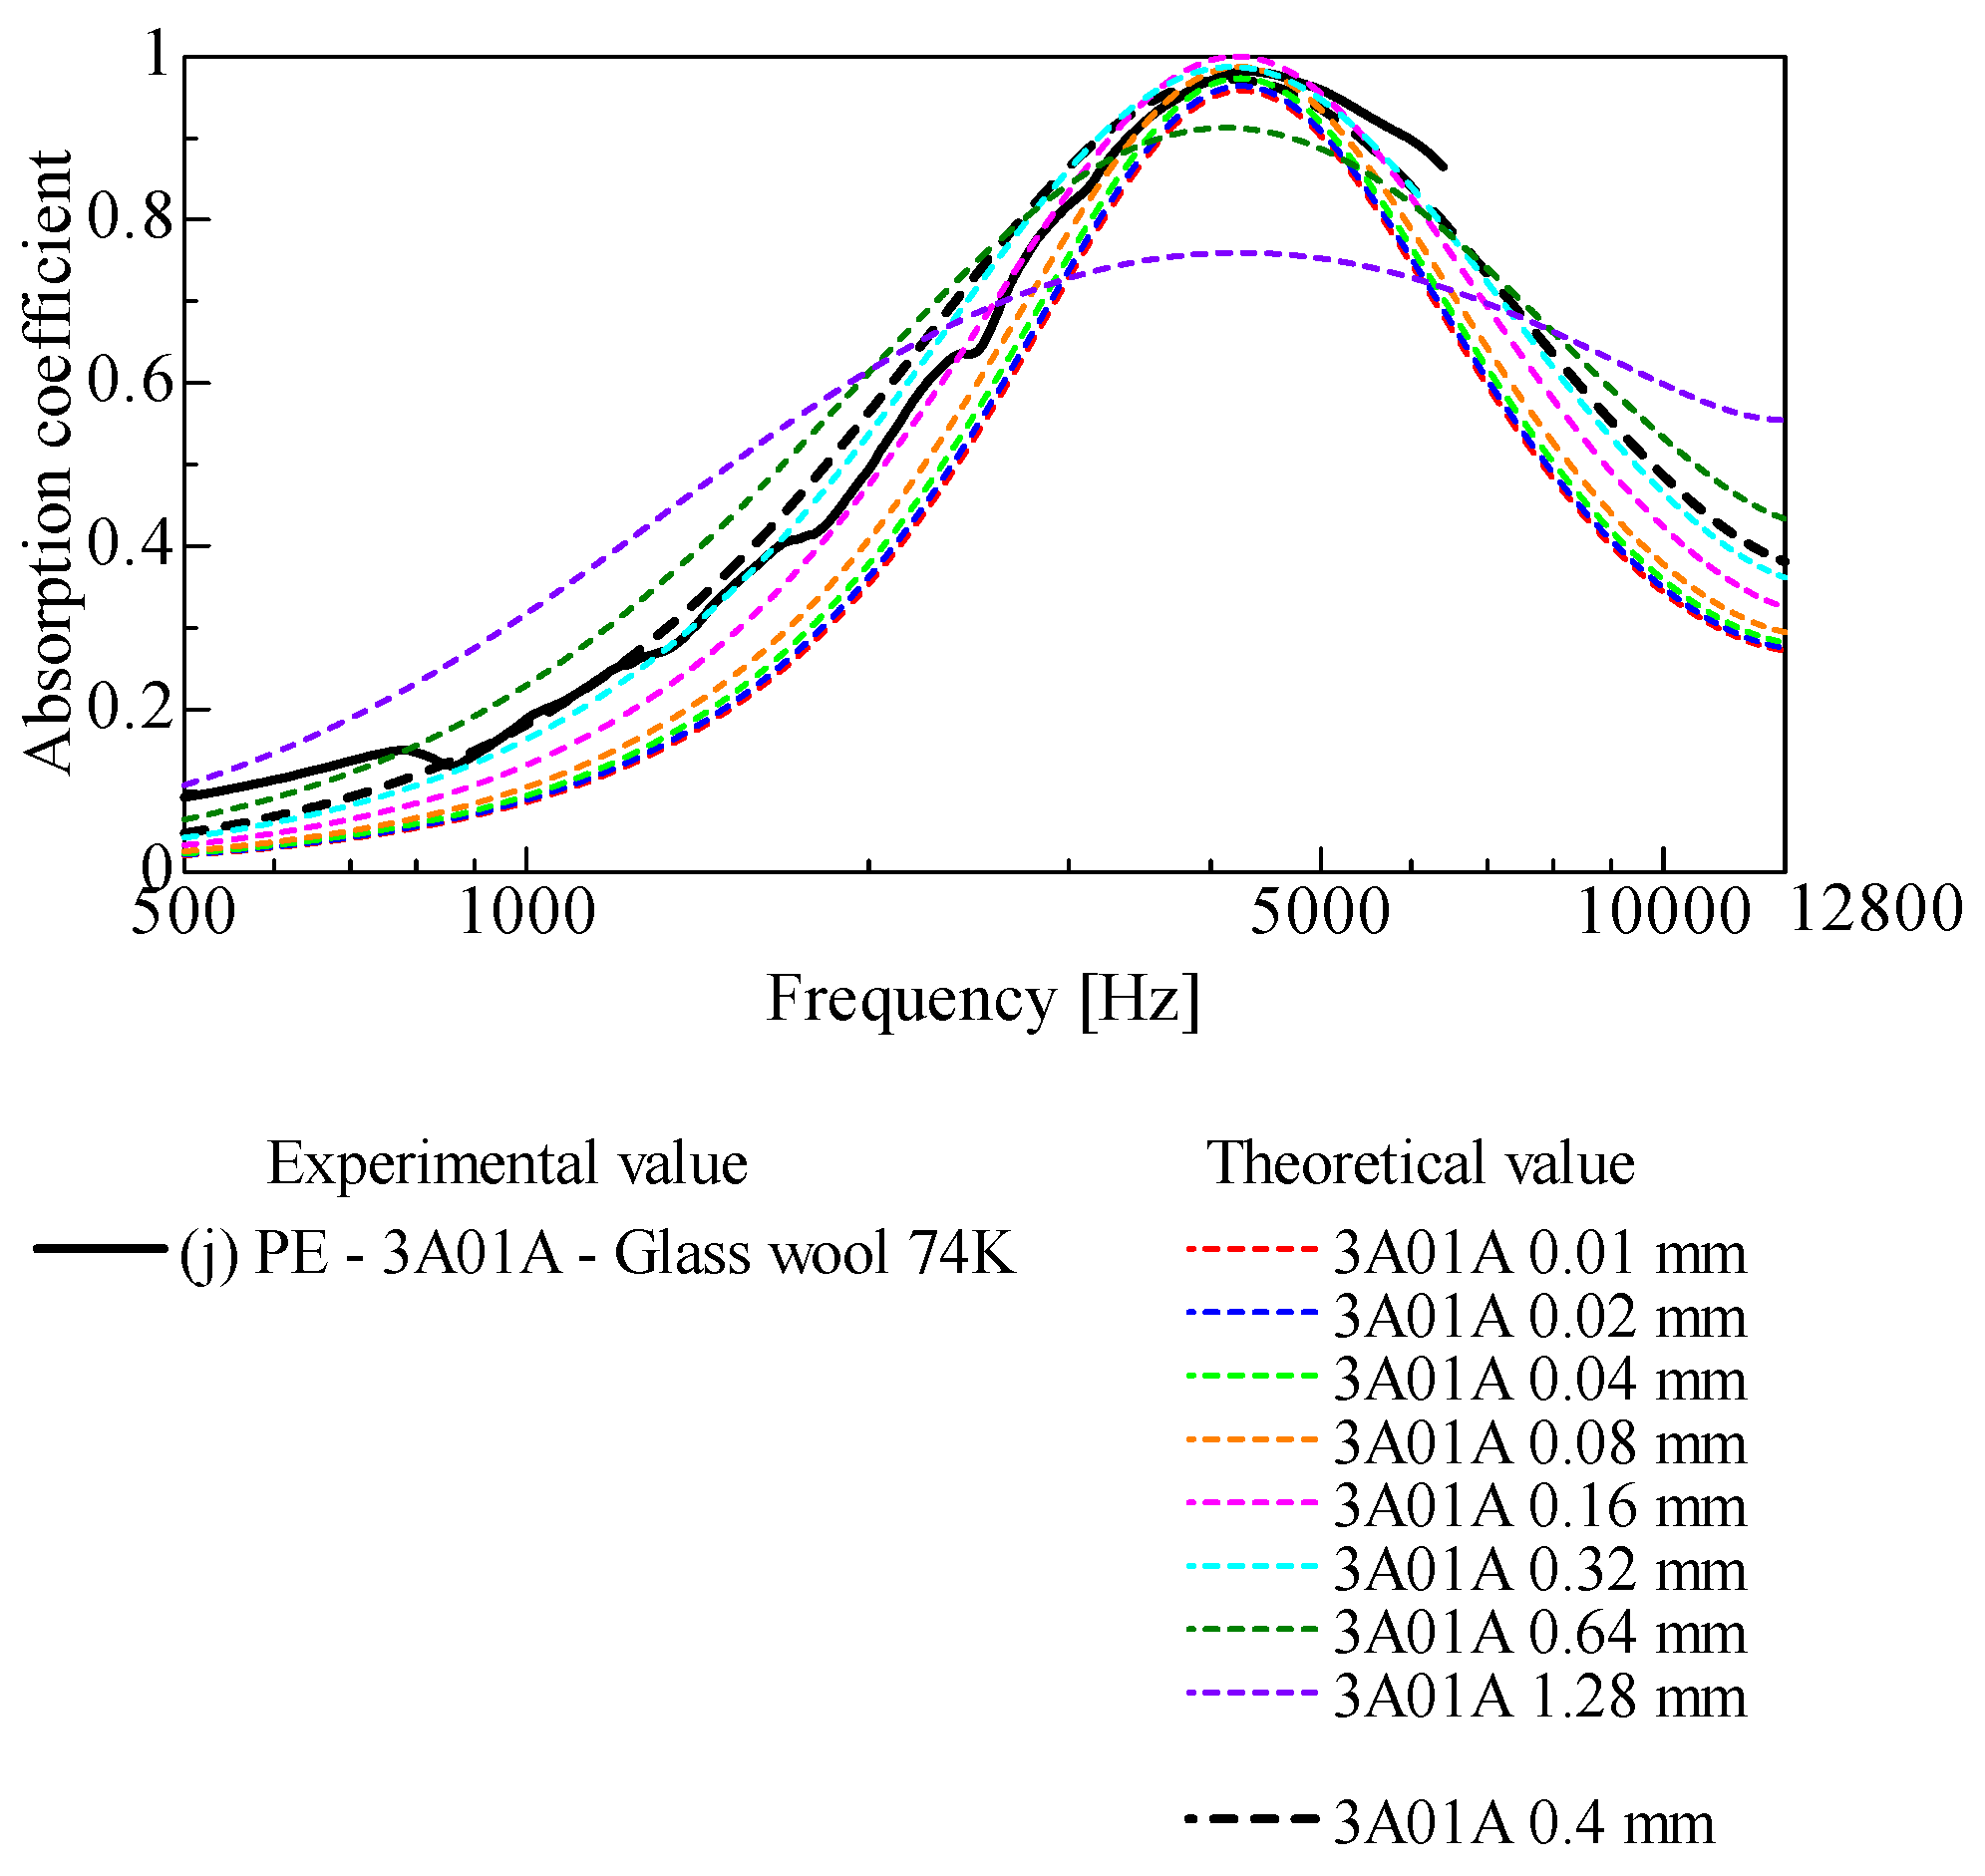
Figure 11 shows the variation in the sound-absorption coefficient for sample j, assuming a variation in the thickness of the nonwoven sheet 3A01A without altering the flow resistivity. For comparison, the experimental sound-absorption coefficient values for sample j and the calculated values for the original ventilation resistance of 3A01A, which have already been shown in Figure 10a, are also shown in Figure 11. We observe that as the thickness of the nonwoven sheet increases (due to the increase in ventilation resistance), the peak value of the sound-absorption coefficient decreases, thereby broadening the sound-absorption curve. In other words, if the ventilation resistance of the nonwoven fabric sheet is too high, the sound-absorption performance will decline.

4.5. Improvement of Sound-Absorption Coefficient by Addition of Thin Film

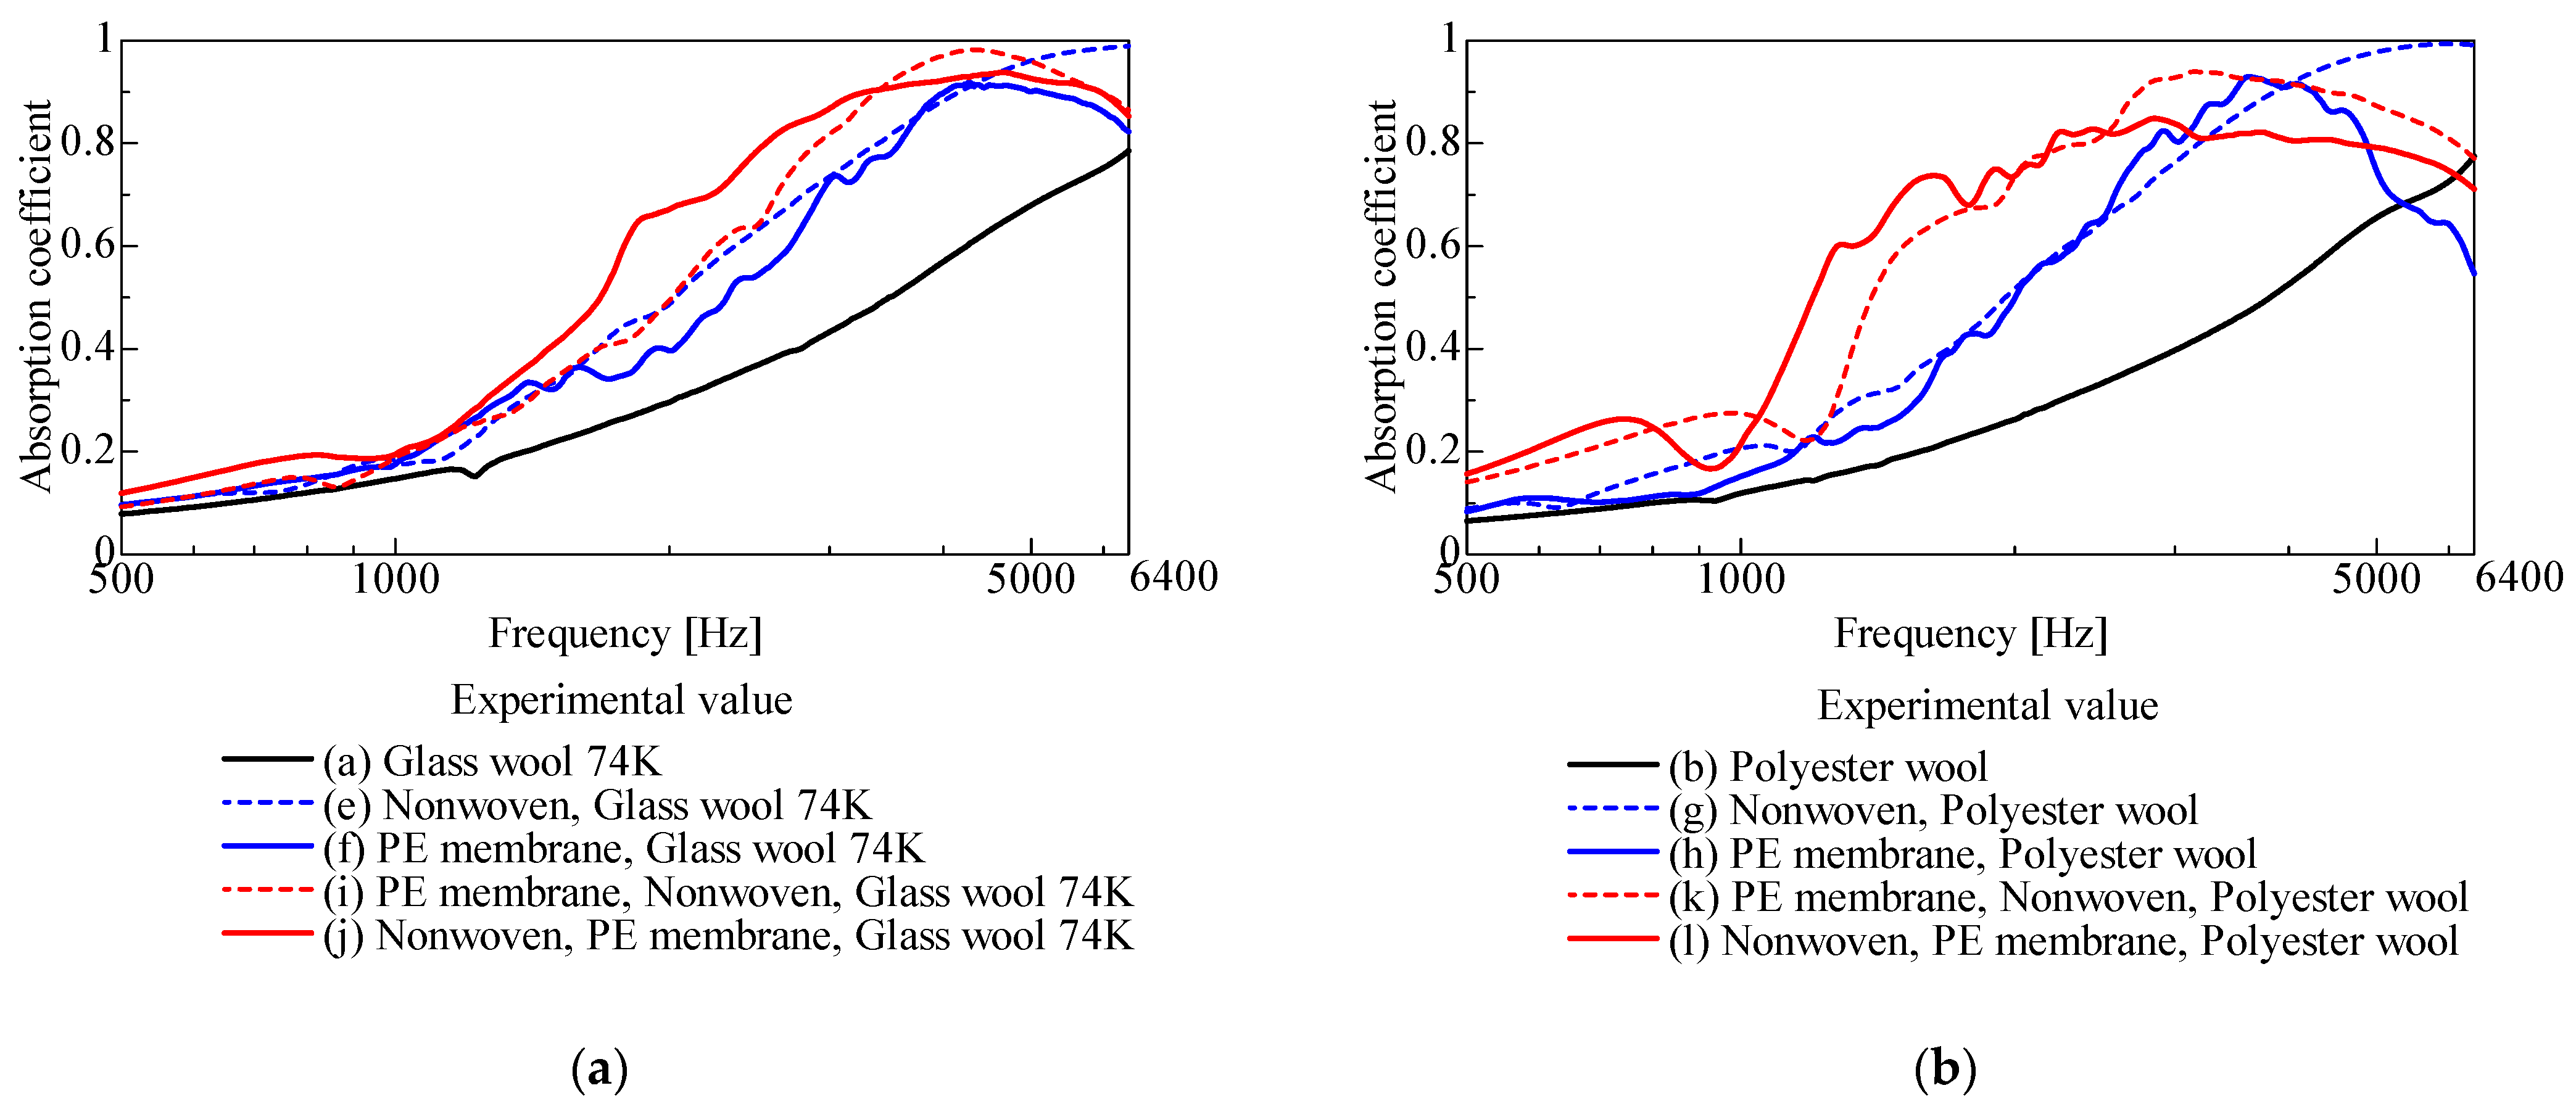
Figure 12a displays the experimental values for samples (a), (e), (f), (i), and (j), while Figure 12b shows the experimental values for samples (b), (g), (h), (k), and (l). In Figure 9a, it is evident that the sound-absorption coefficient improves progressively with the addition of PE film and then nonwoven fabric to the glass wool. Furthermore, the sound-absorption coefficient of the stacked samples surpasses that of the glass wool alone across the entire frequency range. This indicates that the sound-absorption coefficient of glass wool is significantly enhanced using the PE membrane and nonwoven fabric as outer layers. Similarly, Figure 12b demonstrates that the sound-absorption coefficient of polyester wool improves incrementally (with some exceptions at high frequencies) by sequentially adding PE film and nonwoven fabric to the polyester wool.

4.6. Comparison with Samples with an Occupied Thickness of 20 mm

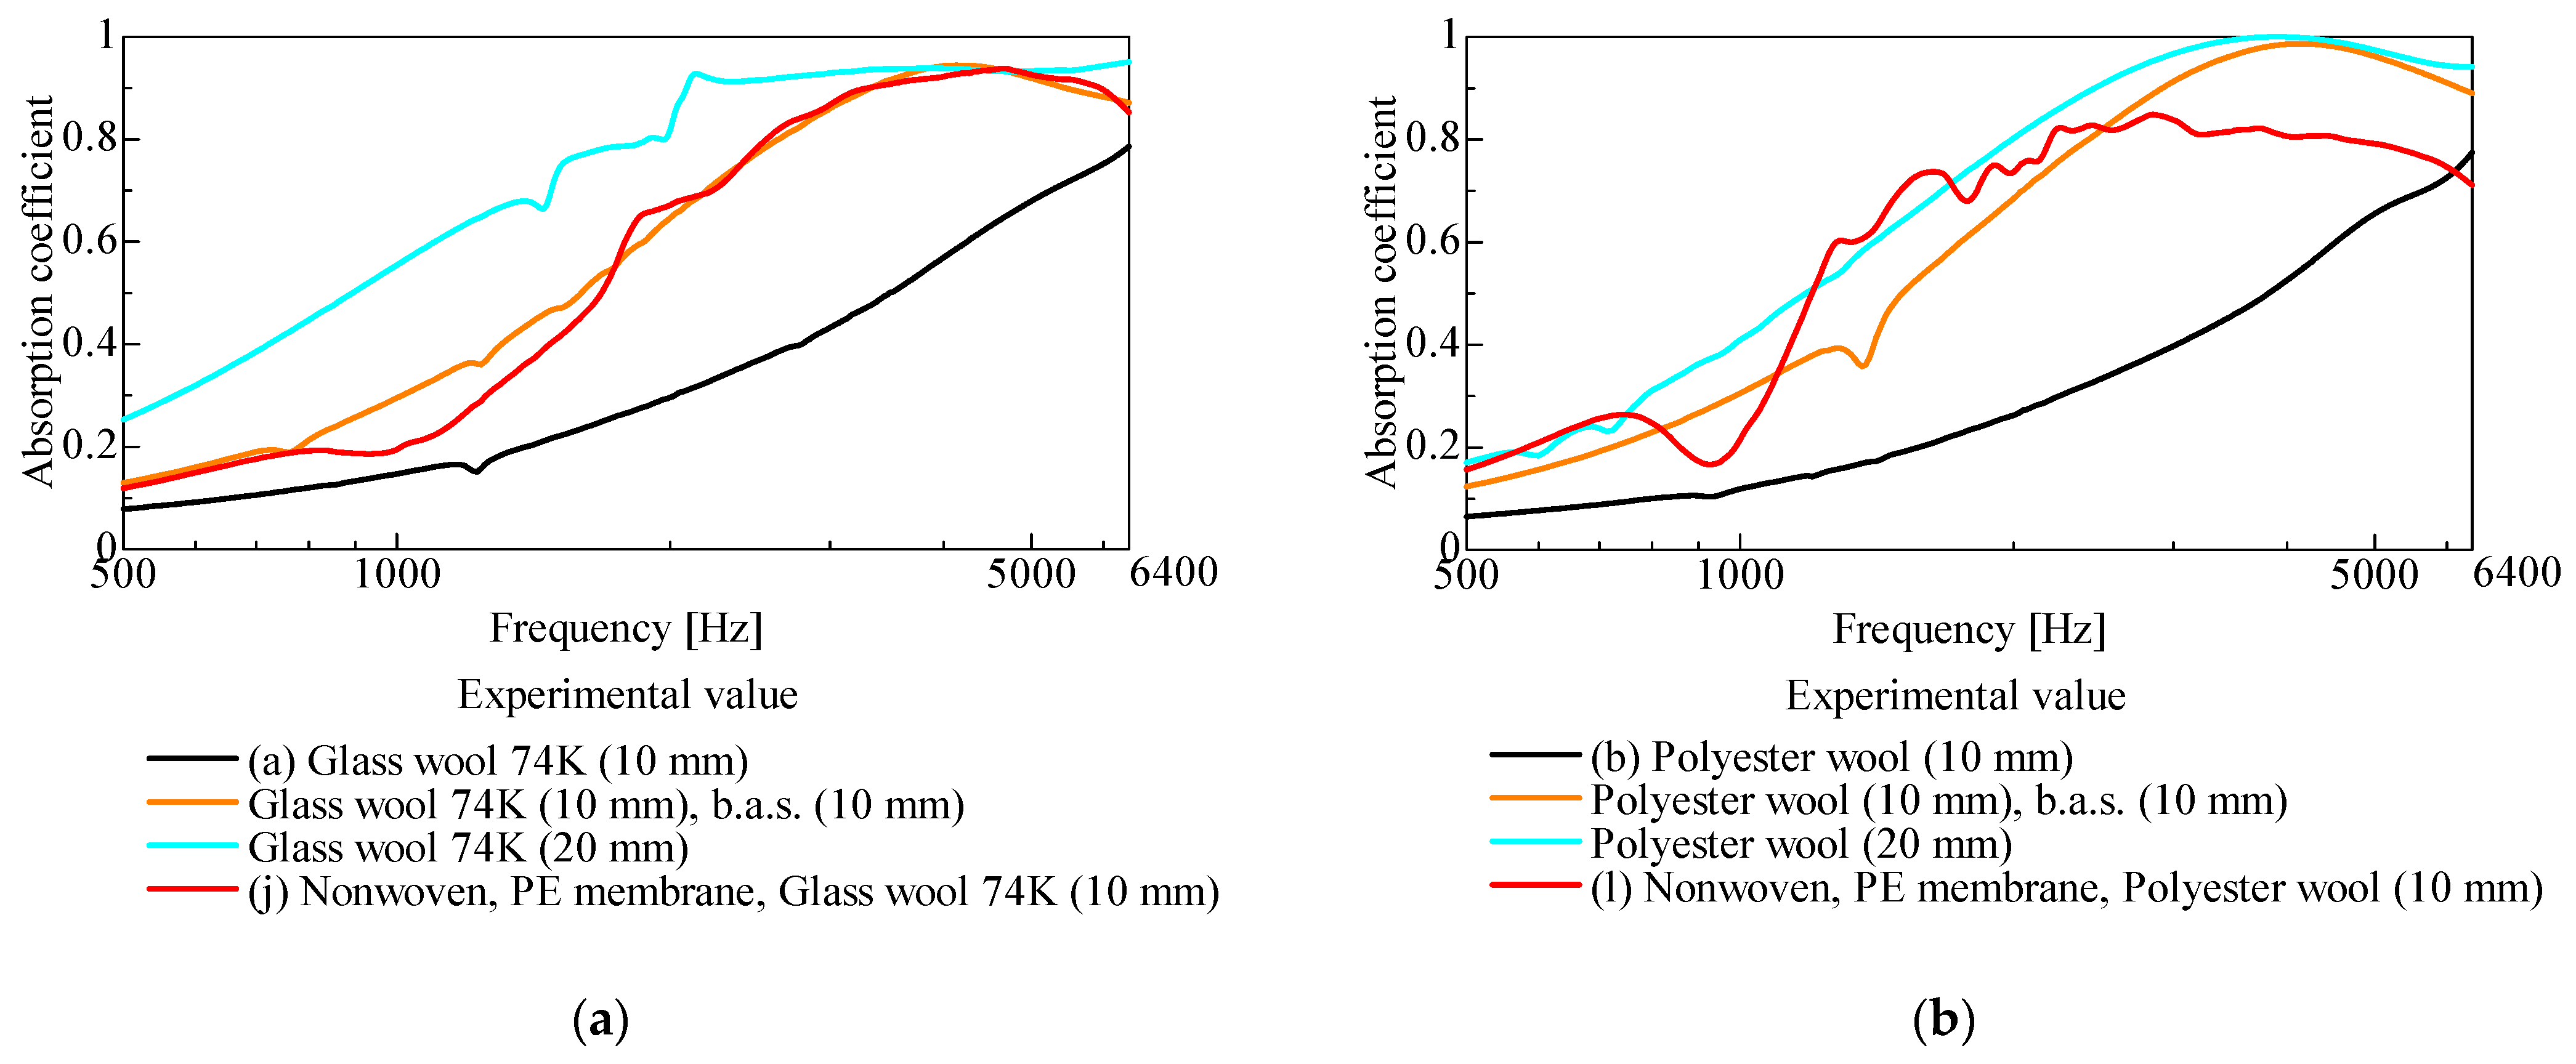
Figure 13a,b compare samples with a total thickness of 20 mm against samples (j) and (l) with a total thickness of approximately 10 mm. Here, the samples with a total thickness of 20 mm consist of porous sound-absorbing materials with a 20 mm thickness, while the 10 mm thick porous sound-absorbing materials include a 10 mm thick back air layer.
Figure 13a illustrates that sample (j), with a total thickness of approximately 10 mm, achieves a sound-absorption coefficient comparable to that of 20 mm thick glass wool occupying 10 mm, along with a 10 mm back air layer. Figure 13b demonstrates that sample (l), also with a total thickness of about 10 mm, achieves a sound-absorption coefficient similar to that of 20 mm thick polyester wool, particularly in the range from 1200 to 2000 Hz. In the mid- and low-frequency range, the frequency range is wider than that of a sound-absorption coefficient achieved by 20 mm, comprising 10 mm of polyester wool with a 10 mm air layer behind it.

5. Conclusions

The following conclusions were made regarding the use of permeable and nonpermeable membranes as outer layers for porous sound-absorbing materials.
The sound-absorption coefficients of glass wool and polyester wool were progressively enhanced by sequentially adding suitable nonwoven fabric and PE membranes.
A sample approximately 10 mm thick, featuring permeable and nonpermeable membranes as outer layers of porous sound-absorbing material, achieved a sound-absorption coefficient equivalent to that of a sample occupying 20 mm thickness (10 mm of porous sound-absorbing material with a 10 mm back air layer).
Theoretical analysis of sound-absorbing materials with laminated permeable and nonpermeable membranes enables estimation of the sound-absorption coefficient.

Author Contributions

Conceptualization, S.S.; data curation, G.M.; formal analysis, K.S. and G.M.; project administration, S.S.; software, K.S.; supervision, S.S. All authors have read and agreed to the published version of the manuscript.

Funding

This research received no external funding.

Data Availability Statement

Data are contained within the article.

Acknowledgments

Toyobo Co., Ltd. provided the nonwoven fabric sheet used in this study. The authors appreciate their support.

Conflicts of Interest

The authors declare no conflict of interest.

References

  1. Lee, J.W.; Park, S.W. Effect of Fiber Cross Section Shape on the Sound Absorption and the Sound Insulation. Fibers Polym. 2021, 22, 2937–2945. [Google Scholar] [CrossRef]
  2. Parikh, D.V.; Chen, Y.; Sun, L. Reducing Automotive Interior Noise with Natural Fiber Nonwoven Floor Covering Systems. Text. Res. J. 2006, 76, 813–820. [Google Scholar] [CrossRef]
  3. Fatima, S.; Mohanty, A.R. Acoustical and fire-retardant properties of jute composite materials. Appl. Acoust. 2011, 72, 108–114. [Google Scholar] [CrossRef]
  4. Geyer, T.F.; Sarradj, E. Self Noise Reduction and Aerodynamics of Airfoils with Porous Trailing Edges. Acoustics 2019, 1, 393–409. [Google Scholar] [CrossRef]
  5. Sakamoto, S.; Iizuka, R.; Nozawa, T. Effect of sheet vibration on the theoretical analysis and experimentation of Nonwoven fabric sheet with back air space. Materials 2022, 15, 3840. [Google Scholar] [CrossRef]
  6. Sakamoto, S.; Nozawa, T.; Sato, K. Nonwoven fabric sheet with back air space serving as Helmholtz resonator. Noise Control Eng. J. 2024, 72, 37–50. [Google Scholar] [CrossRef]
  7. Rayleigh, J.W.S. The Theory of Sound, 2nd ed.; Dover: New York, NY, USA, 1945; Volume II. [Google Scholar]
  8. Delany, M.E.; Bazley, E.N. Acoustic Properties of Fibrous Absorbent Materials. Appl. Acoust. 1970, 3, 105–116. [Google Scholar] [CrossRef]
  9. Allard, J.F.; Champoux, Y. New empirical equations for sound propagation in rigid frame fibrous materials. J. Acoust. Soc. Am. 1992, 91, 3346–3353. [Google Scholar] [CrossRef]
  10. Miki, Y. Acoustical properties of porous materials-Modifications of Delany-Bazley models. J. Acoust. Soc. Jpn. 1990, 11, 19–24. [Google Scholar] [CrossRef]
  11. Komatsu, T. Improvement of the Delany-Bazley and Miki models for fibrous sound-absorbing materials. Acoust. Sci. Technol. 2008, 29, 121–129. [Google Scholar] [CrossRef]
  12. Horai, H. Characteristics and the latest trend of glass-wool insulation. Sen’i Gakkaishi 2008, 64, 333–335. [Google Scholar] [CrossRef] [PubMed]
  13. Sugie, S.; Yoshimura, J.; Ogawa, H. Absorption characteristics of fibrous material covered with perforated facing and film. Acoust. Sci. Technol. 2006, 27, 87–96. [Google Scholar] [CrossRef]
  14. Kosten, C.W. Absorption of Sound by Coated Porous Rubber Wallcovering Layers. J. Acoust. Soc. Am. 1946, 18, 457–471. [Google Scholar] [CrossRef]
  15. Schwartz, M.; Buehner, W.L. Effects of Light Coatings on Impedance and Absorption of Open-Celled Foams. J. Acoust. Soc. Am. 1963, 35, 1507–1510. [Google Scholar] [CrossRef]
  16. Sakagami, K.; Nishio, J.; Morimoto, M. Effect of impervious films on the absorption characteristics of porous absorbent materials. Report. Res. Cent. Urban Saf. Secur. Kobe Univ. 2009, 13, 211–217. (In Japanese) [Google Scholar] [CrossRef]
  17. Parkinson, J.P.; Pearse, J.R.; Latimer, M.D. Sound absorption of elastic framed porous materials in combination with impervious films: Effect of bonding. Appl. Acoust. 2002, 63, 819–828. [Google Scholar] [CrossRef]
  18. Sakamoto, S.; Fujisawa, K.; Watanabe, S. Small plate vibration sound-absorbing device with a clearance and without surrounding restriction: Theoretical analysis and experiment. Noise Control Eng. J. 2021, 69, 30–38. [Google Scholar] [CrossRef]
  19. Tang, X.; Zhang, X.; Zhuang, X.; Zhang, H.; Yan, X. Sound Absorption Properties of Nonwoven Fabric Based Multi-Layer Composites. Polym. Compos. 2019, 40, 2012–2018. [Google Scholar] [CrossRef]
  20. Sakagami, K.; Kiyama, M.; Morimoto, M.; Takahashi, D. Sound absorption of a cavity-backed membrane: A step towards design method for membrane-type absorbers. Appl. Acoust. 1996, 49, 237–247. [Google Scholar] [CrossRef]
  21. Salmeia, K.A.; Gooneie, A.; Simonetti, P.; Nazir, R.; Kaiser, J.P.; Rippl, A.; Hirsch, C.; Lehner, S.; Rupper, P.; Hufenus, R.; et al. Comprehensive study on flame retardant polyesters from phosphorus additives. Polym. Degrad. Stab. 2018, 155, 22–34. [Google Scholar] [CrossRef]
  22. ISO 10534 2; Acoustics—Determination of Sound Absorption Coefficient and Impedance in Impedance Tubes—Part 2: Transfer-Function Method. International Standard: Geneva, Switzerland, 1998.
  23. Yu, G.C.; Park, J.J.; Kang, E.H.; Lee, S.Y.; Huh, Y.; Lee, S.G. Study on the Sound Absorption Properties of Recycled Polyester Nonwovens through Alkaline Treatment and Dimple Processing. Surfaces 2024, 7, 238–250. [Google Scholar] [CrossRef]
  24. Suyama, E.; Hirata, M. The four terminal matrices of tube system based on assuming of plane wave propagation with frictional dissipation: Acoustic characteristic analysis of silencing systems based on assuming of plane wave propagation with frictional dissipation part 2. J. Acoust. Soc. J. 1979, 35, 165–170. (In Japanese) [Google Scholar] [CrossRef]
Figure 1. Schematic diagram of a two-microphone impedance tube for measuring the absorption coefficient.
Technologies 12 00195 g001
Figure 2. Block diagram of ventilation resistance tester (Kato Tech KES-F8-AP1).
Technologies 12 00195 g002
Figure 3. Test samples: (a) glass wool; (b) polyester wool; (c) PE membrane; (d) nonwoven fabric 3A01A; (e) nonwoven, glass wool; (f) PE membrane, glass wool; (g) nonwoven, polyester wool; (h) PE membrane, polyester wool; (i) nonwoven, PE membrane, glass wool; (j) PE membrane, nonwoven, glass wool; (k) nonwoven, PE membrane, polyester wool; (l) PE membrane, nonwoven, polyester wool.
Technologies 12 00195 g003aTechnologies 12 00195 g003b
Figure 4. Micrographs of measured samples: (a) glass wool; (b) polyester wool; (c) nonwoven fabric 3A01A.
Technologies 12 00195 g004
Figure 5. Sample tube: (a) image; (b) dimensions.
Technologies 12 00195 g005
Figure 6. Schematic diagram of the samples used in the experiment (The colors correspond to each material).
Technologies 12 00195 g006
Figure 7. Equivalent circuits for samples (al).
Technologies 12 00195 g007
Figure 8. Comparison of experimental and theoretical values (single layer) (b.a.s. = back air space 10 mm).
Technologies 12 00195 g008
Figure 9. Comparison of experimental and theoretical values (two layers): (a) combination with glass wool; (b) combination with polyester wool.
Technologies 12 00195 g009
Figure 10. Comparison of experimental and theoretical values (three layers): (a) combination with glass wool; (b) combination with polyester wool.
Technologies 12 00195 g010
Figure 11. Sensitivity analysis with nonwoven fabric of the sound-absorption coefficient for different thicknesses of the nonwoven fabric sheet.
Technologies 12 00195 g011
Figure 12. Improved sound-absorption coefficient by stacked samples: (a) combination with glass wool; (b) combination with polyester wool.
Technologies 12 00195 g012
Figure 13. Comparison with thicker samples (b.a.s. = back air space): (a) combination with glass wool; (b) combination with polyester wool.
Technologies 12 00195 g013
Table 1. Specifications of materials.
NameVentilation Resistance
R [kPa·s/m]
Thickness
t [mm]
Resistivity
σ [kPa·s/m2]
Areal Density
ρa [g/m2]
Density
ρ [kg/m3]
Fiber Diameter
[μm]
Porosity *
Glass wool 74k0.4251057.3738.573.8512.40.029
Polyester wool0.2181021.890090.00200.065
Nonwoven fabric (3A01A)0.3360.4880103257.512.10.19
PE membrane 0.017 16.15950
* The actual density of the glass fibers in glass wool was 2.55 g/cm3, and that of the fibers in polyester wool and nonwoven sheet was 1.38 g/cm3.
Disclaimer/Publisher’s Note: The statements, opinions and data contained in all publications are solely those of the individual author(s) and contributor(s) and not of MDPI and/or the editor(s). MDPI and/or the editor(s) disclaim responsibility for any injury to people or property resulting from any ideas, methods, instructions or products referred to in the content.