Abstract
In this article, the behavior of the thrust force on the blades of a 10 kW wind turbine was obtained by considering the characteristic wind speed of the Isthmus of Tehuantepec. Analyzing mechanical forces is essential to efficiently and safely design the different elements that make up the wind turbine because the thrust forces are related to the location point and the blade rotation. For this reason, the thrust force generated in each of the three blades of a low-power wind turbine was analyzed. The angular position () of each blade varied from 0° to 120°, the blades were segmented (r), and different wind speeds were tested, such as cutting, design, average, and maximum. The results demonstrate that the thrust force increases proportionally with increasing wind speed and height, but it behaves differently on each blade segment and each angular position. This method determines the angular position and the exact blade segment where the smallest and the most considerable thrust force occurred. Blade 1, positioned at an angular position of 90°, is the blade most affected by the thrust force on P15. When the blade rotates 180°, the thrust force decreases by 9.09 N; this represents a 66.74% decrease. In addition, this study allows the designers to know the blade deflection caused by the thrust force. This information can be used to avoid collision with the tower. The thrust forces caused blade deflections of 10% to 13% concerning the rotor radius used in this study. These results guarantee the operation of the tested generator under their working conditions.
1. Introduction
The rotor of a wind turbine is the first energy converter. It converts the wind kinetic energy into mechanical energy through the rotor blades. Rotor design affects power yield, power conversion efficiency, loading, and dynamic stability of a wind power generation system [1]. The function of the blades is to capture a higher amount of kinetic energy and convert it into rotational energy; moreover, the blade geometry is vital to generate lift. When the wind affects the blade surface, a pressure difference is generated between the intrados and the extrados, generating lift. Given the natural movement of the rotor, the blades are affected by different aerodynamic loads due to the stochastic forces that occur because of wind turbulence [2]. Rotor power is directly related to the forces generated by the blades. The resultant of the force depends on the interaction between wind speed and blade rotation speed. This force is divided into tangential and axial forces (axial force, also called thrust forces). The magnitudes of these forces are calculated in sections which are divided depending on the length of the blade; in wind turbines of 10 kW power, these can be assumed to be 15 to 30 sections, starting from 15 to 20% of the rotor radius and ending at the blade tip [3].
The thrust force () can be defined as the force in the direction of the current resulting from the pressure drop on the rotor and is used to reduce the wind speed [4]. The amount of thrust depends mainly on three factors: the geometry of the blade and material used in its manufacture, the wind speed, and the wind direction. Wind shear has also been shown to reduce mean rotor thrust. The wind shear and the wind tower shadow cause thrust variations that oscillate with the pitch frequency of the blades; however, the effect of wind shear is small compared to the effect of the wind tower shadow [5]. Another way of expressing the thrust force is through the thrust coefficient, which is a dimensionless number that compares the axial force exerted on the flow by the wind turbine with the incoming momentum of the flow [6]. The total thrust force over the entire length of the blade can be calculated with the following procedure. The blade can be sectioned into small elements, and the aerodynamic forces for each section are calculated for each element [7]. The thrust force is one of the aerodynamic loads of most significant interest. It is a fundamental concept in the design and operation of wind turbines [8]. Noppe proposes a thrust load reconstruction technique and neural network analysis [9]. On the other hand, Huang et al. propose a methodology to analyze the thrust force of blades in a wind tunnel [10]. The relevance of the thrust is not only because it interferes in the wind turbine rotor, but also because this force is transmitted to the tower, the support structure, and other components, such as the bearings that support radial and axial loads, causing vibrations with a consequent increase in fatigue, so the thrust force must be included in the design of the tower and the foundations. For these reasons, the thrust force must be considered for the aerodynamic and structural design of blades and other wind turbine components [11,12,13,14,15,16,17]. There are mainly three aerodynamic methods for wind turbine rotor design to analyze the blade thrust force: Blade Element Momentum (BEM), Computational Fluid Dynamics (CFD), and Vortex-based model. The methods used in studies related to blade design to analyze the blade thrust force are presented in Table 1.

Table 1.
Methods used in studies related to blade design to analyze the blade thrust force.
Due to its importance in research, we thus studied the behavior of the thrust force on a 10 kW nominal power wind turbine, designed and built in the wind energy laboratory of the Universidad del Istmo. For its analysis, four analyses were considered: thrust force on point P15 with variable angular position () and average wind speed (); thrust force on point P15 with constant angular position and variable wind speed; thrust force on points P1 to P15 with constant angular position and average wind speed; and thrust force on points P1 to P15 with constant angular position and variable wind speed. The variable wind speeds were average speed (), design speed (), generation output speed (), and maximum speed (). All these procedures were implemented in an algorithm to facilitate the study of the thrust force on each blade section in the wind conditions of a given location. In this study, BEM is used to analyze the thrust force on the blades. The azimuthal angle of the blade and the effect of the vertical wind profile are taken into account for the thrust force. The thrust force is of great interest due to the deflection that can occur in the blade and that can avoid collision with the tower.
The paper is structured as follows: In Section 2, the characteristics of aerodynamics and the main fundamentals of the wind resource are presented. In Section 3, the methodologies of the different analyses are described. In Section 4, the results are shown; in Section 5, the results are discussed; and in Section 6, the conclusions are mentioned.
2. Aerodynamics Fundamentals
2.1. Rotor Frame
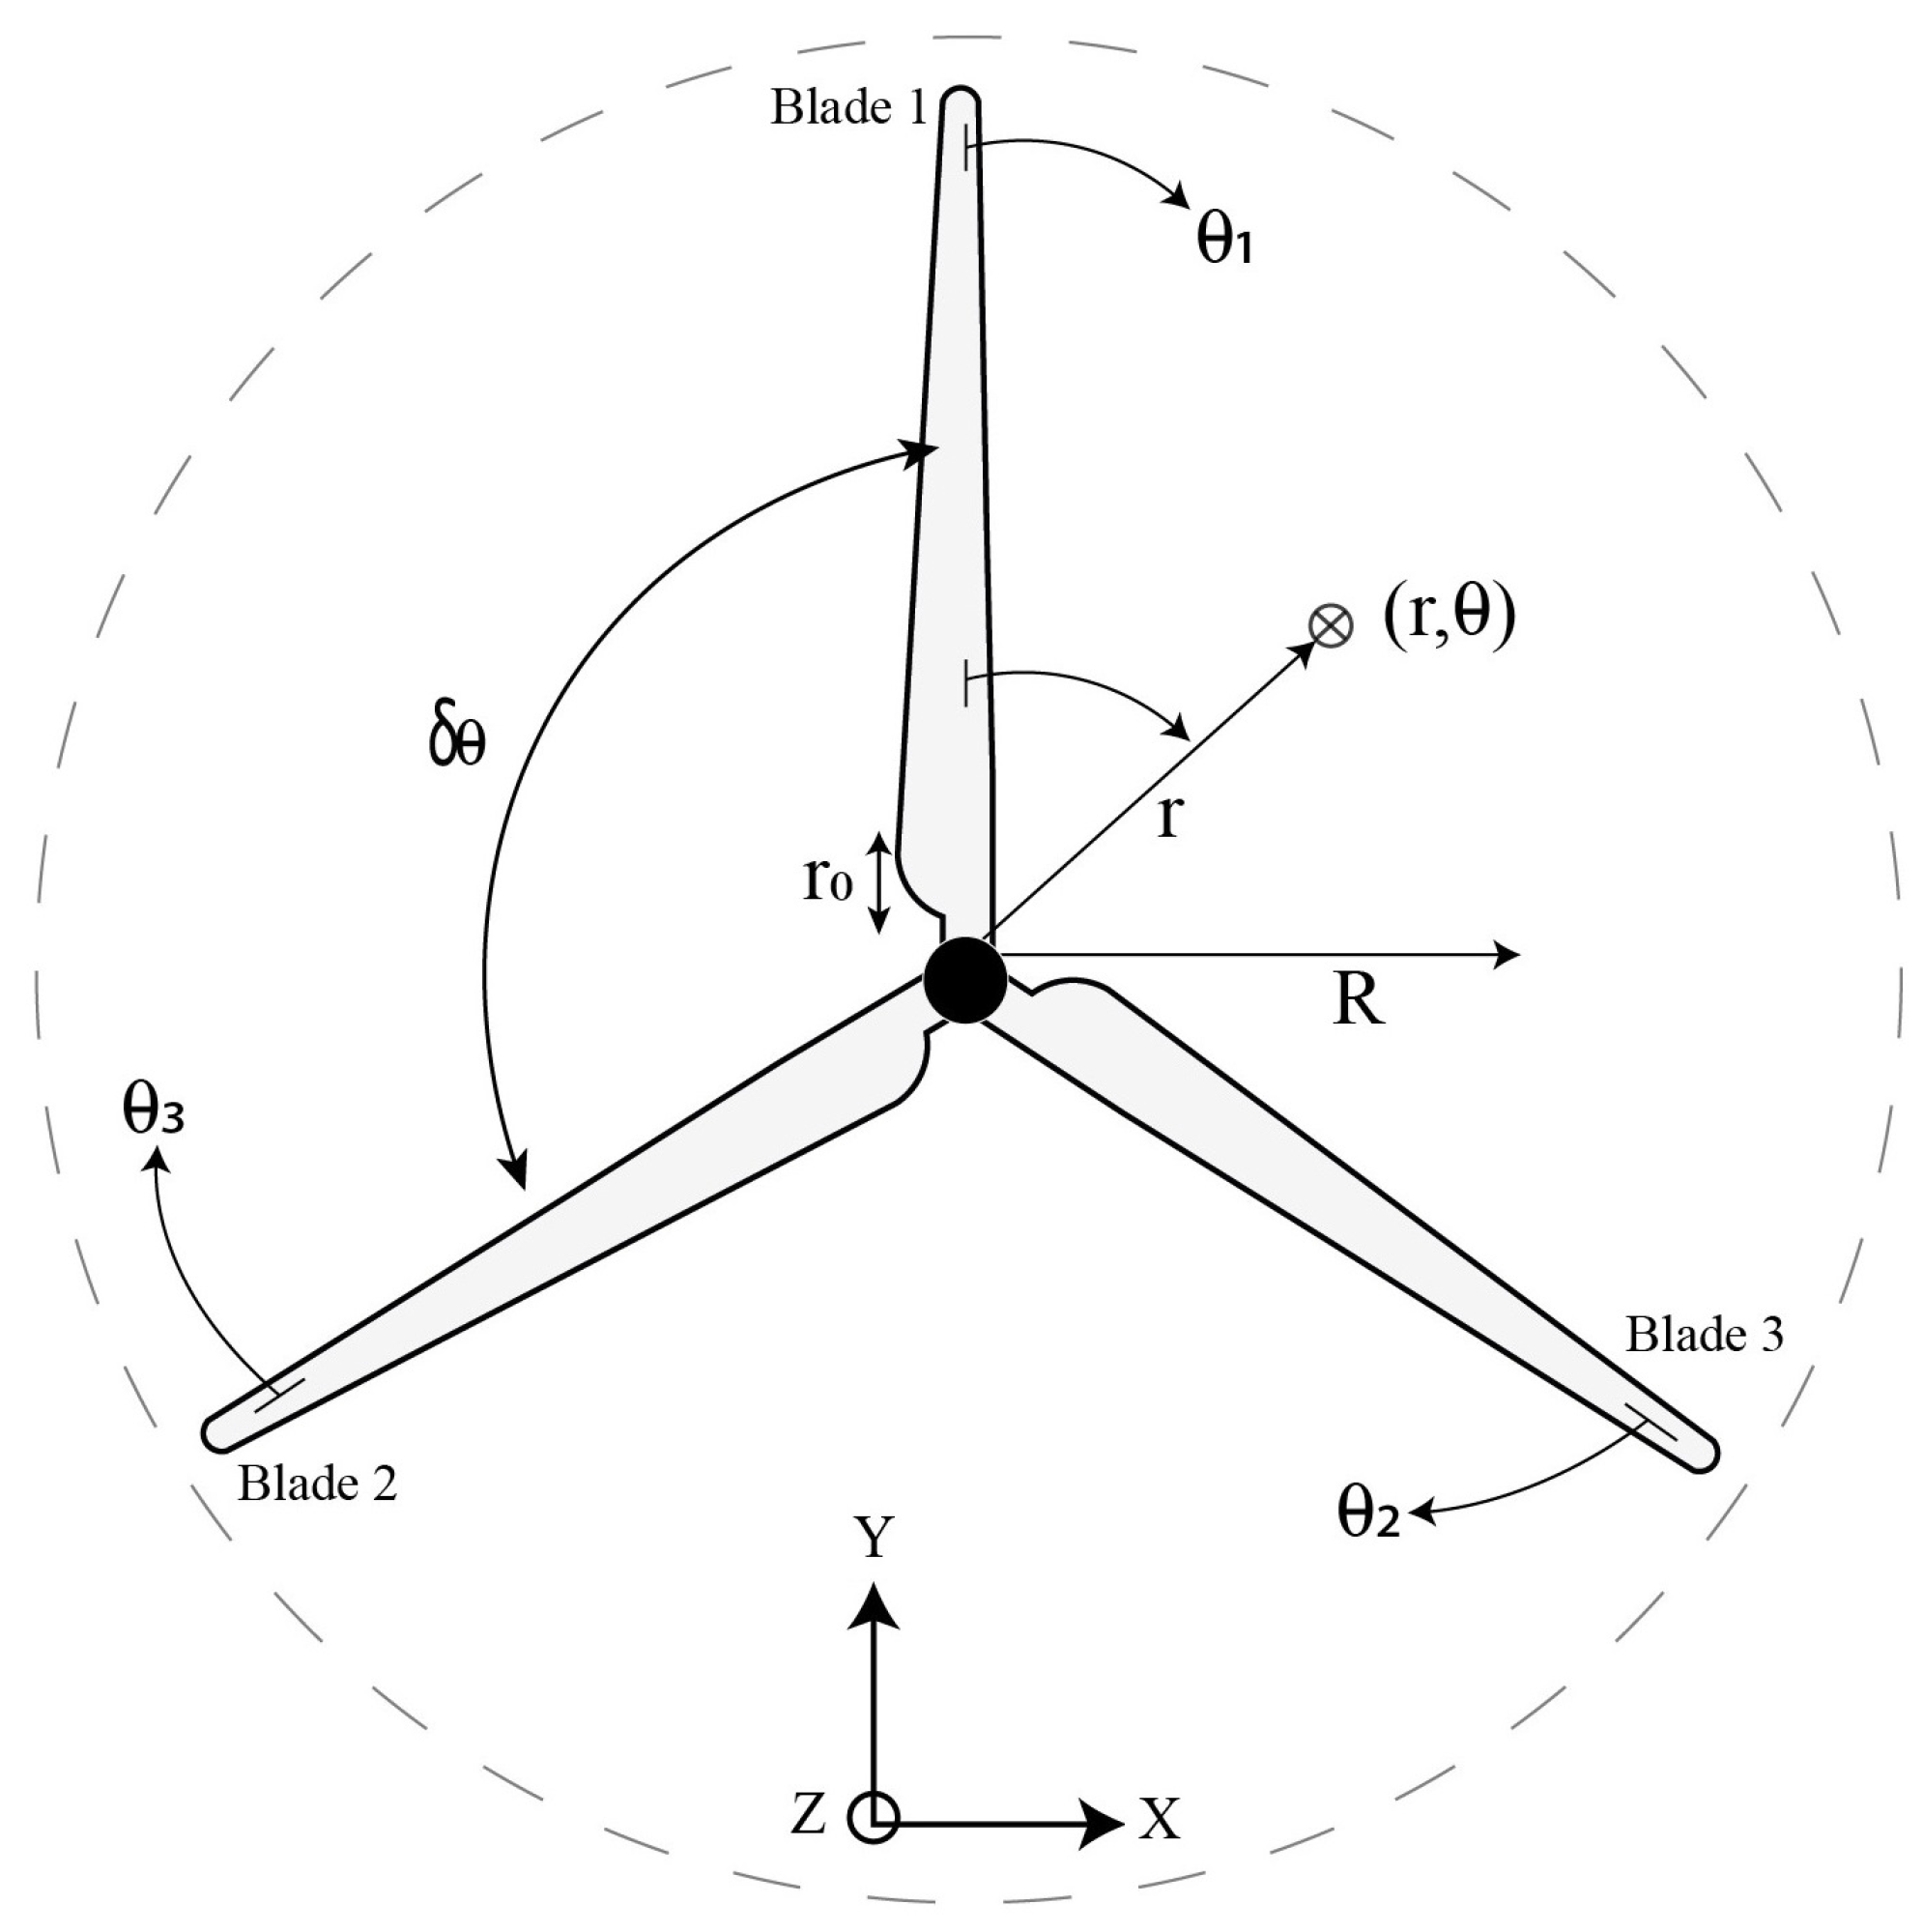
Figure 1 shows the rotor reference frame and the blade rotation by varying the angular position () from 0° to 120°.
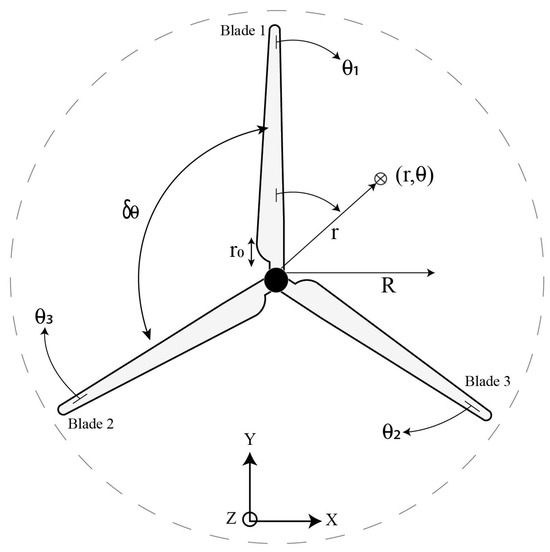
Figure 1.
Rotor reference frame.
2.2. Aerodynamic Thrust
The aerodynamic thrust force that passes through the swept area of the rotor is given by Equation (1):
where is the air density, A is the swept area of the rotor, is the wind speed, is the specific design speed, is the pitch angle, and is the thrust coefficient. The total thrust force on the rotor is the sum of the thrust force of each blade. In addition, the thrust force of each blade is obtained by adding the force of each section (Equation (2)):
where is the total thrust force, is the thrust force by section, n is number blade and s is number section by blade.
From the blade design data, the thrust coefficient (, ) is calculated using Equation (3) [23]:
where is the power coefficient that is a function of the specific design speed () and the pitch angle (), for which the is calculated using Equations (4) and (5) [23]:
where is the local specific velocity.
2.3. Wind Shear
A significant phenomenon in wind resource assessment and wind turbine design is the increase in wind speed with height, as shown in Figure 2. This phenomenon is because the roughness of the Earth’s surface and the surface obstacles slow down the low-altitude wind. This variation in wind speed with height above the ground is often called the vertical wind profile. There are two general methods for modeling the vertical profile of wind speed: the logarithmic profile method and the power law method [24].
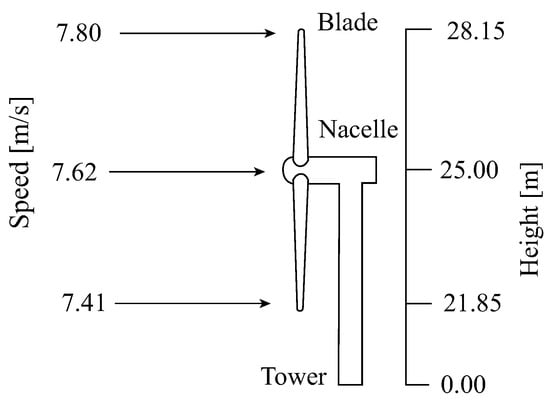
Figure 2.
Vertical wind profile variation in the wind turbine.
The model used to obtain the vertical wind profile is the power law model, which was proposed by Hellmann in 1915. See Equation (6) below [24]:
where is the roughness exponent of the ground; h is the desired height, which in this case is considered the height of the wind turbine hub; is the wind speed at hub height (h); and is the given height.
2.4. Tower Shadow
The presence of the tower alters the local wind field. When the wind flow through the tower, the magnitude and direction of the wind vector vary due to the change in airflow distribution. This effect is called tower shadow, which, in turn, causes a periodic decrease in thrust that fluctuates with the pitch frequency of the blade when facing the tower. Equation (8) is used to determine the wind field near the tower [24]:
The term is the observed disturbance in the wind speed due to the shadow of the tower, represents the mean space speed of the wind, a is the radius of the tower, y is the lateral distance from the blade to the mean line of the tower, and x the distance from the origin of the blade to the midline of the tower. The disturbance can be modeled using the potential flow theory for the behavior of the wind around the tower [25].
2.5. Stochastic Thrust Variations
Short-term wind variations are called turbulence since they are usually associated with wind gusts that change both speed and direction. A good measure of the level of turbulence can be determined by Equation (9):
where is the standard deviation of the wind fluctuations and is the mean wind speed. Turbulence intensity depends on surface, roughness, and local weather effects; therefore, it is a site-specific parameter.
2.6. Thrust Force on Each Segment of the Blade
The thrust force on each section of the blade is determined by Equation (10):
where is the thrust induced on the rotor, is the thrust coefficient, and is the difference between the wind speed in each section and the extrapolated wind speed. The total thrust force is the sum of the thrust force on each blade; see Equation (11) below:
3. Materials and Methods
The aim of this work was to seek an understanding of the operating behavior of the blades for a 10 kW generator with the wind resource conditions of the Isthmus of Tehuantepec, Oaxaca, Mexico. Our methodology was the use of four analyses of the thrust force as a function of the angular position at the points of application (P1 to P15). In the first analysis, the average wind speed on P15 and the variation of the angle position of each of the three blades were considered when the wind turbine was in operation for a 360° rotation. In the second analysis, the static position of each of the three blades of the wind turbine and variable wind speed were considered to obtain the thrust force on P15. The angular positions of each blade were 90°, 210°, and 330°, whereas the variable wind speeds were , , , and . In the third analysis, the static position of each of the three blades of the wind turbine and the average wind speed were considered to obtain the thrust force on P1 to P15. Finally, the static position of each of the three blades of the wind turbine and variable wind speeds were considered in the fourth analysis of the thrust force on P1 to P15. Figure 3 shows the proposed methodology.
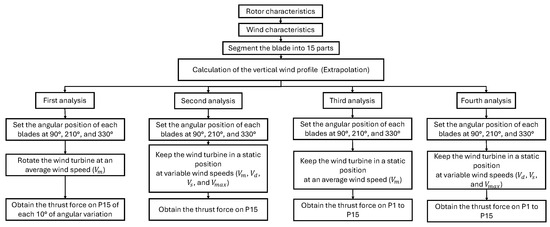
Figure 3.
General methodology.
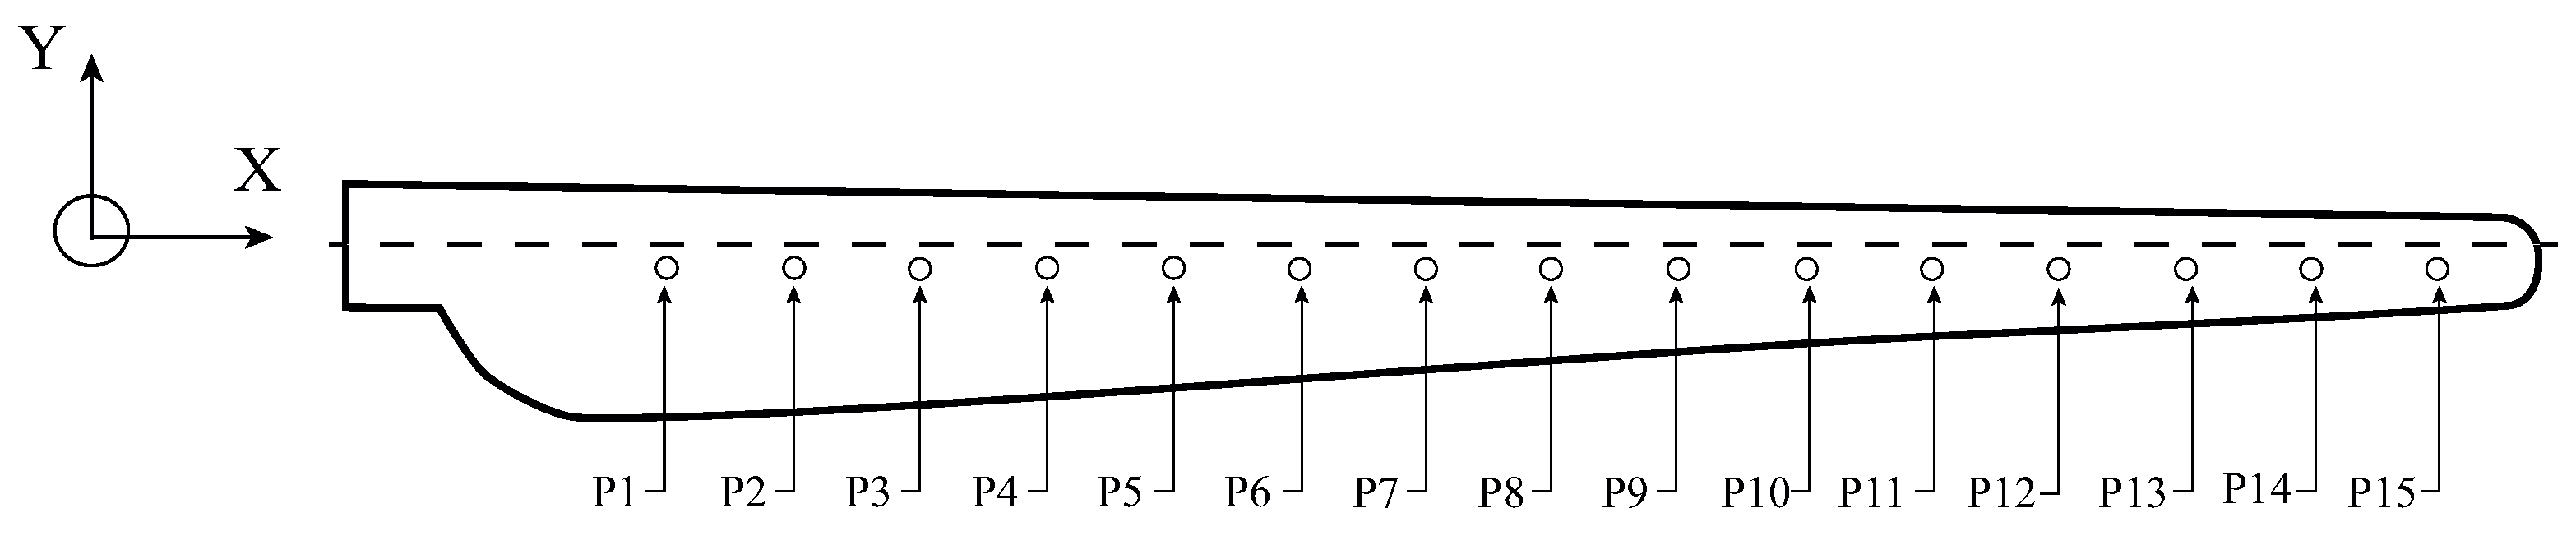
Table 2 shows the essential parameters of the 10 kW wind turbine. In its design process, the blade was divided into 15 sections [26], and the application points of the thrust forces were located at the midpoint of each section, obtaining 15 application points () as shown in Figure 4. This blade was designed according to the IEC 61400-2 standard on small wind turbines [27]. Also, Table 3 shows the geometrical parameters of the blade and the coordinates of the thrust force application points of 10 kW wind turbine blades.
Table 2.
Data of the 10 kW wind turbine.

Figure 4.
Thrust force application point on the blade.
Table 3.
Application point coordinates on the blade and geometric data of 10 kW wind turbine blades.
3.1. Wind Profile
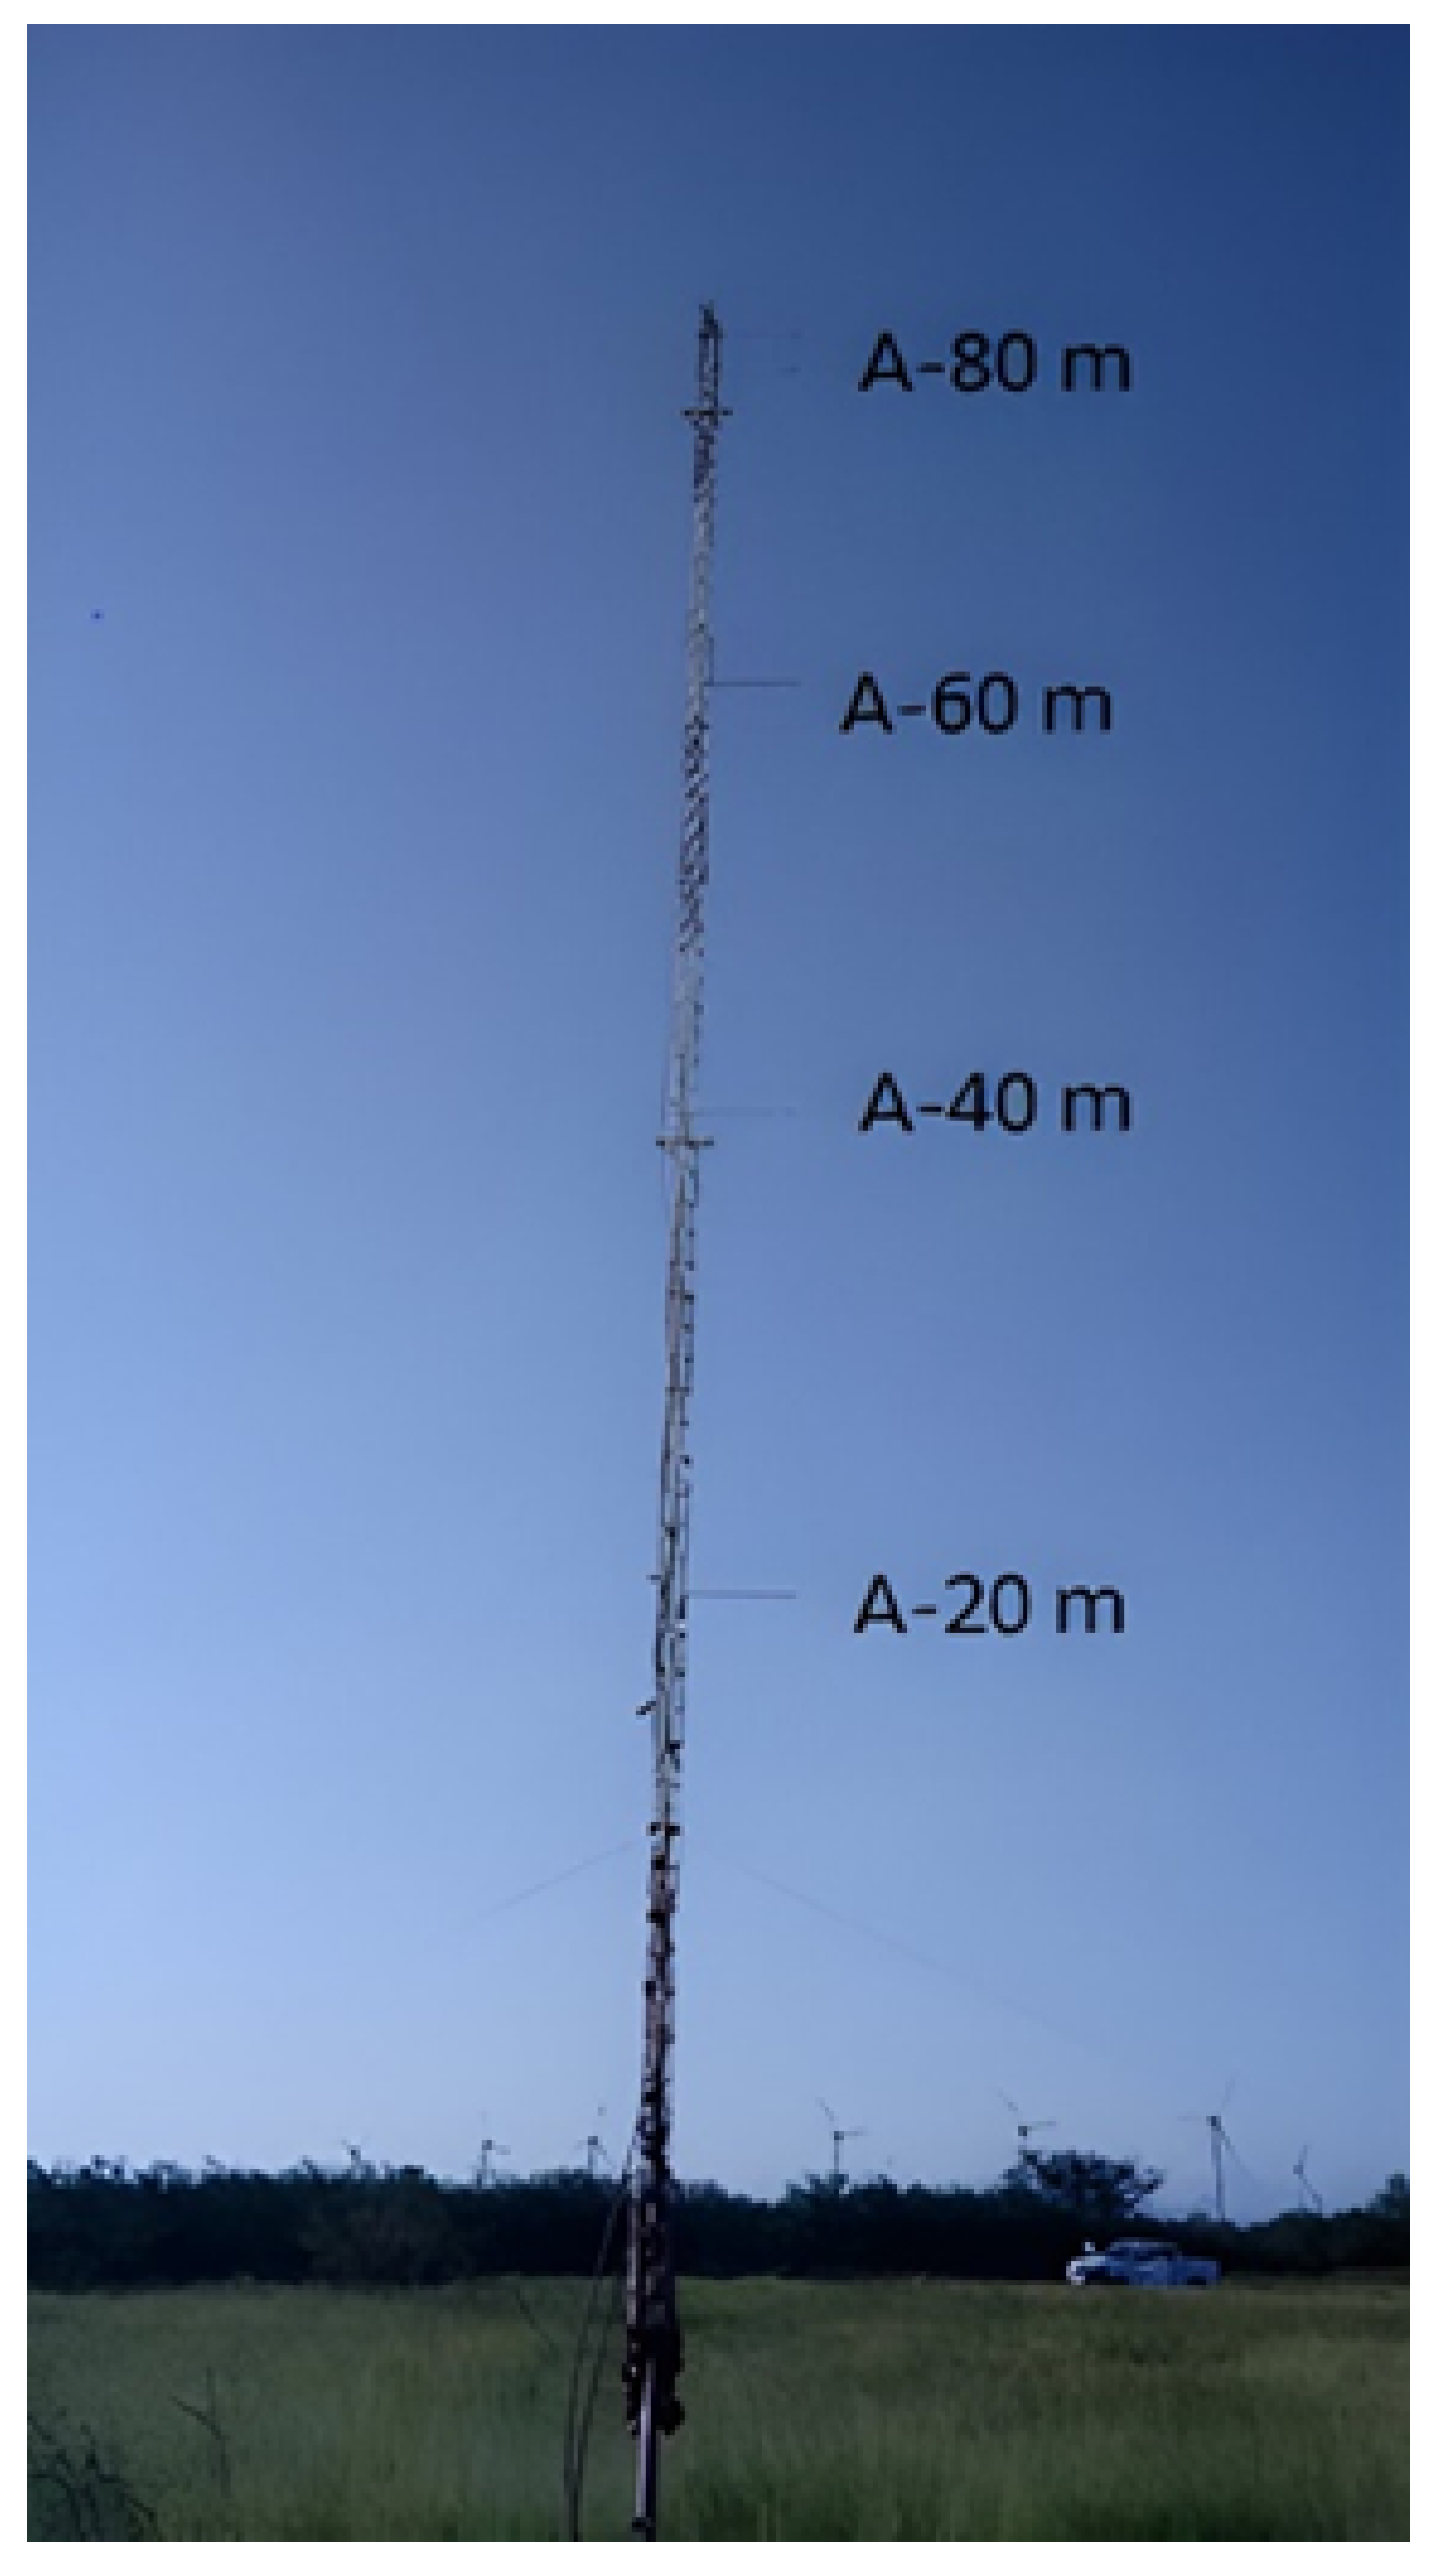
Wind speed data, recorded every second and averaged every ten minutes for one year, were used to study the wind resource. The wind speed sensors were the Wind-Sensor P2546A model calibrated by Svend Ole Hansen ApS. For the calibration of the sensors, the wind tunnel procedures and requirements set out in IEC 61400-12-1:2017 were followed [28], and these were installed at 20 m, 40 m, 60 m, and 80 m height on the anemometric tower M4, as shown in Figure 5. The tower is located at the Regional Wind Technology Center in the state of Oaxaca with the coordinates latitude 16°32′49.27″ N and longitude 94°57′20.83″ W [29].

Figure 5.
Meteorological tower, 80 m (M4).
An algorithm was developed in MATLAB for the analysis of the wind resource. This algorithm extrapolates the wind speed to determine the average speed, design speed, maximum speed, and operating output speed.
3.2. First Analysis: Thrust Force on P15 with Variable Angular Position and Average Wind Speed
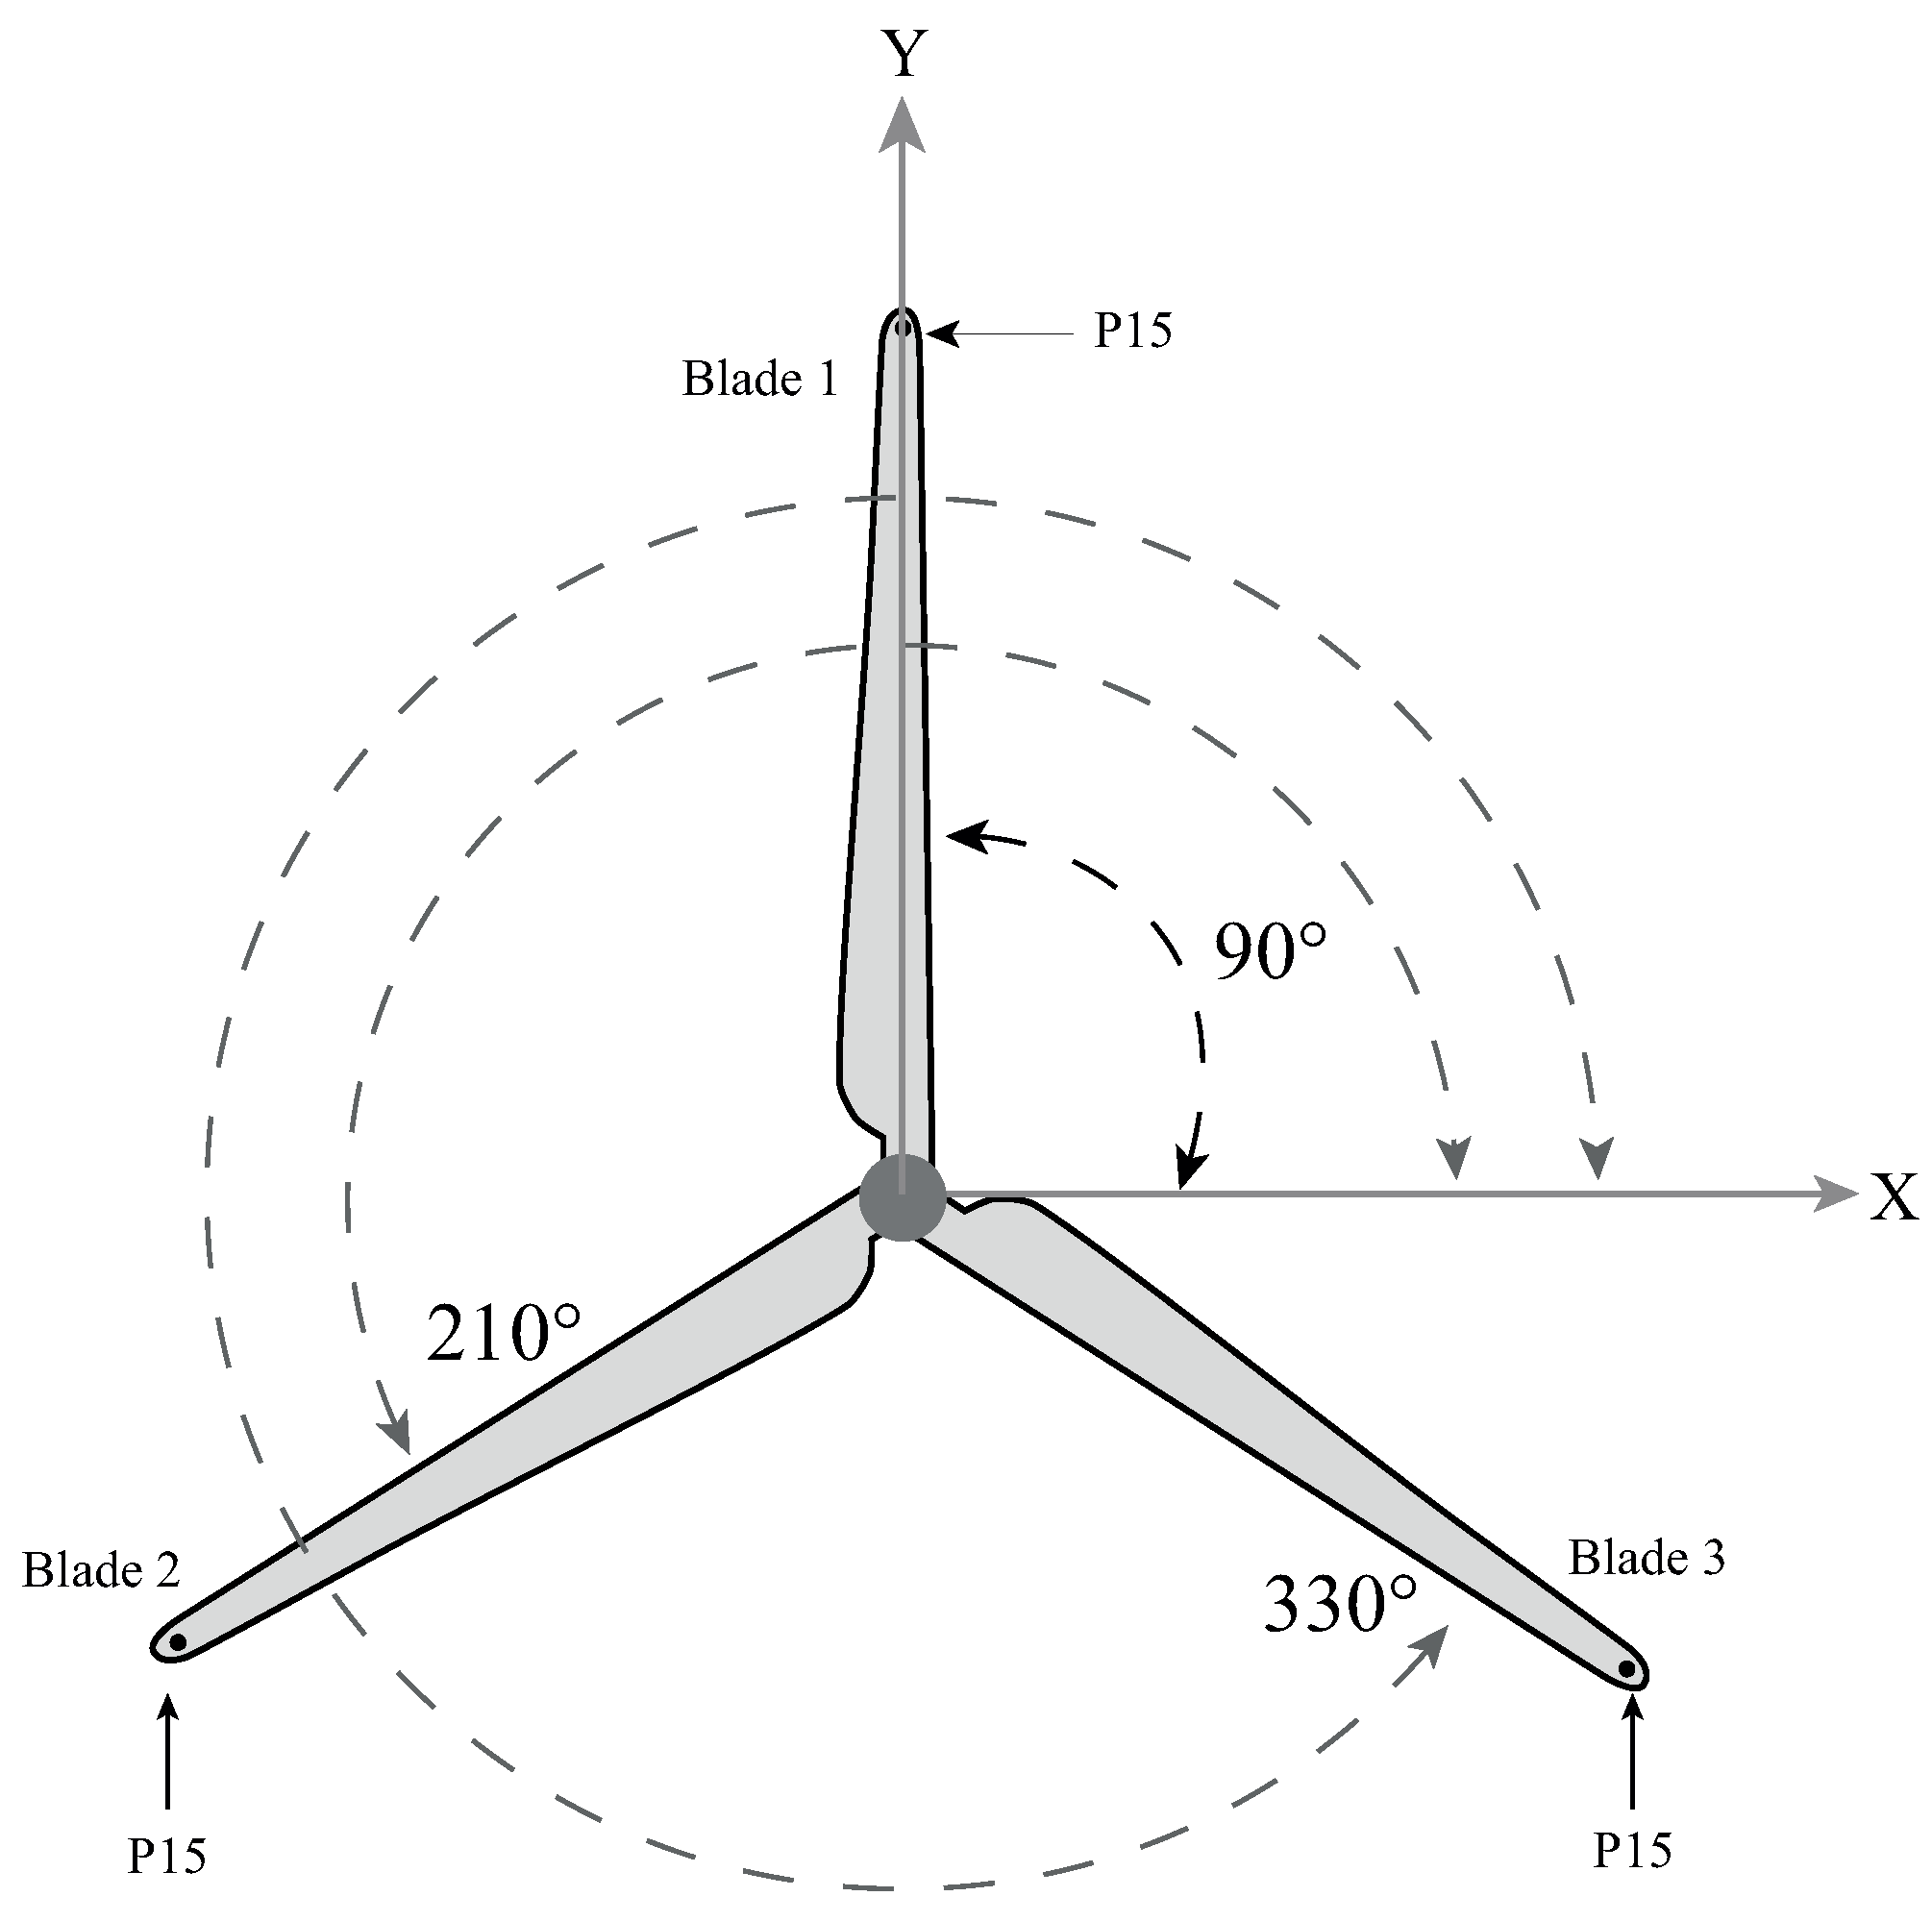
In the first analysis, the behavior of the thrust force was studied when the average wind speed of 7.62 [m/s] occurred. The starting positions of each blade were as follows: the first blade started at 90°, the second at 210°, and the third at 330°, as shown in Figure 6.
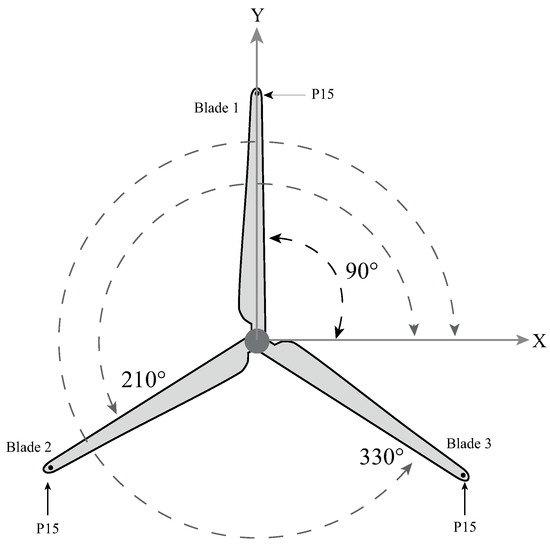
Figure 6.
Thrust force application point on the blade, P15.
When the wind turbine is in operation, its three blades rotate clockwise. So its angular position, referenced as a Cartesian plane, begins to change at each instant of time. For this first analysis, the complete rotation is considered at 360°, whereby intervals of 10° are analyzed.
3.3. Second Analysis: Thrust Force on P15 with Constant Angular Position and Variable Wind Speed
In the second analysis, the behavior of the thrust force on the three wind turbine blades was analyzed with static angular positions of 90°, 210°, and 330° for each blade, and variable wind speeds were tested. These values were = 7.62 m/s, = 10.91 m/s, = 22.86 m/s, and = 26.76 m/s.
3.4. Third Analysis: Thrust Force on P1 to P15 with Constant Angular Position and Average Wind Speed
The thrust force was calculated at each of the 15 blade application points while considering static angular positions of 90°, 210°, and 330° for each of the three blades. In this analysis, only of 7.62 m/s was considered.
3.5. Fourth Analysis: Thrust Force on P1 to P15 with Constant Angular Position and Variable Wind Speed
The thrust force was calculated at each of the 15 blade application points while considering variable wind speed and static angular positions of 90°, 210°, and 330° for each of the three blades. The variable wind speeds were = 10.91 m/s, = 22.86 m/s, and = 26.76 m/s.
4. Results
In this section, the results are presented in a detailed manner. Key observations and insights derived from the analysis are highlighted.
4.1. Wind Profile
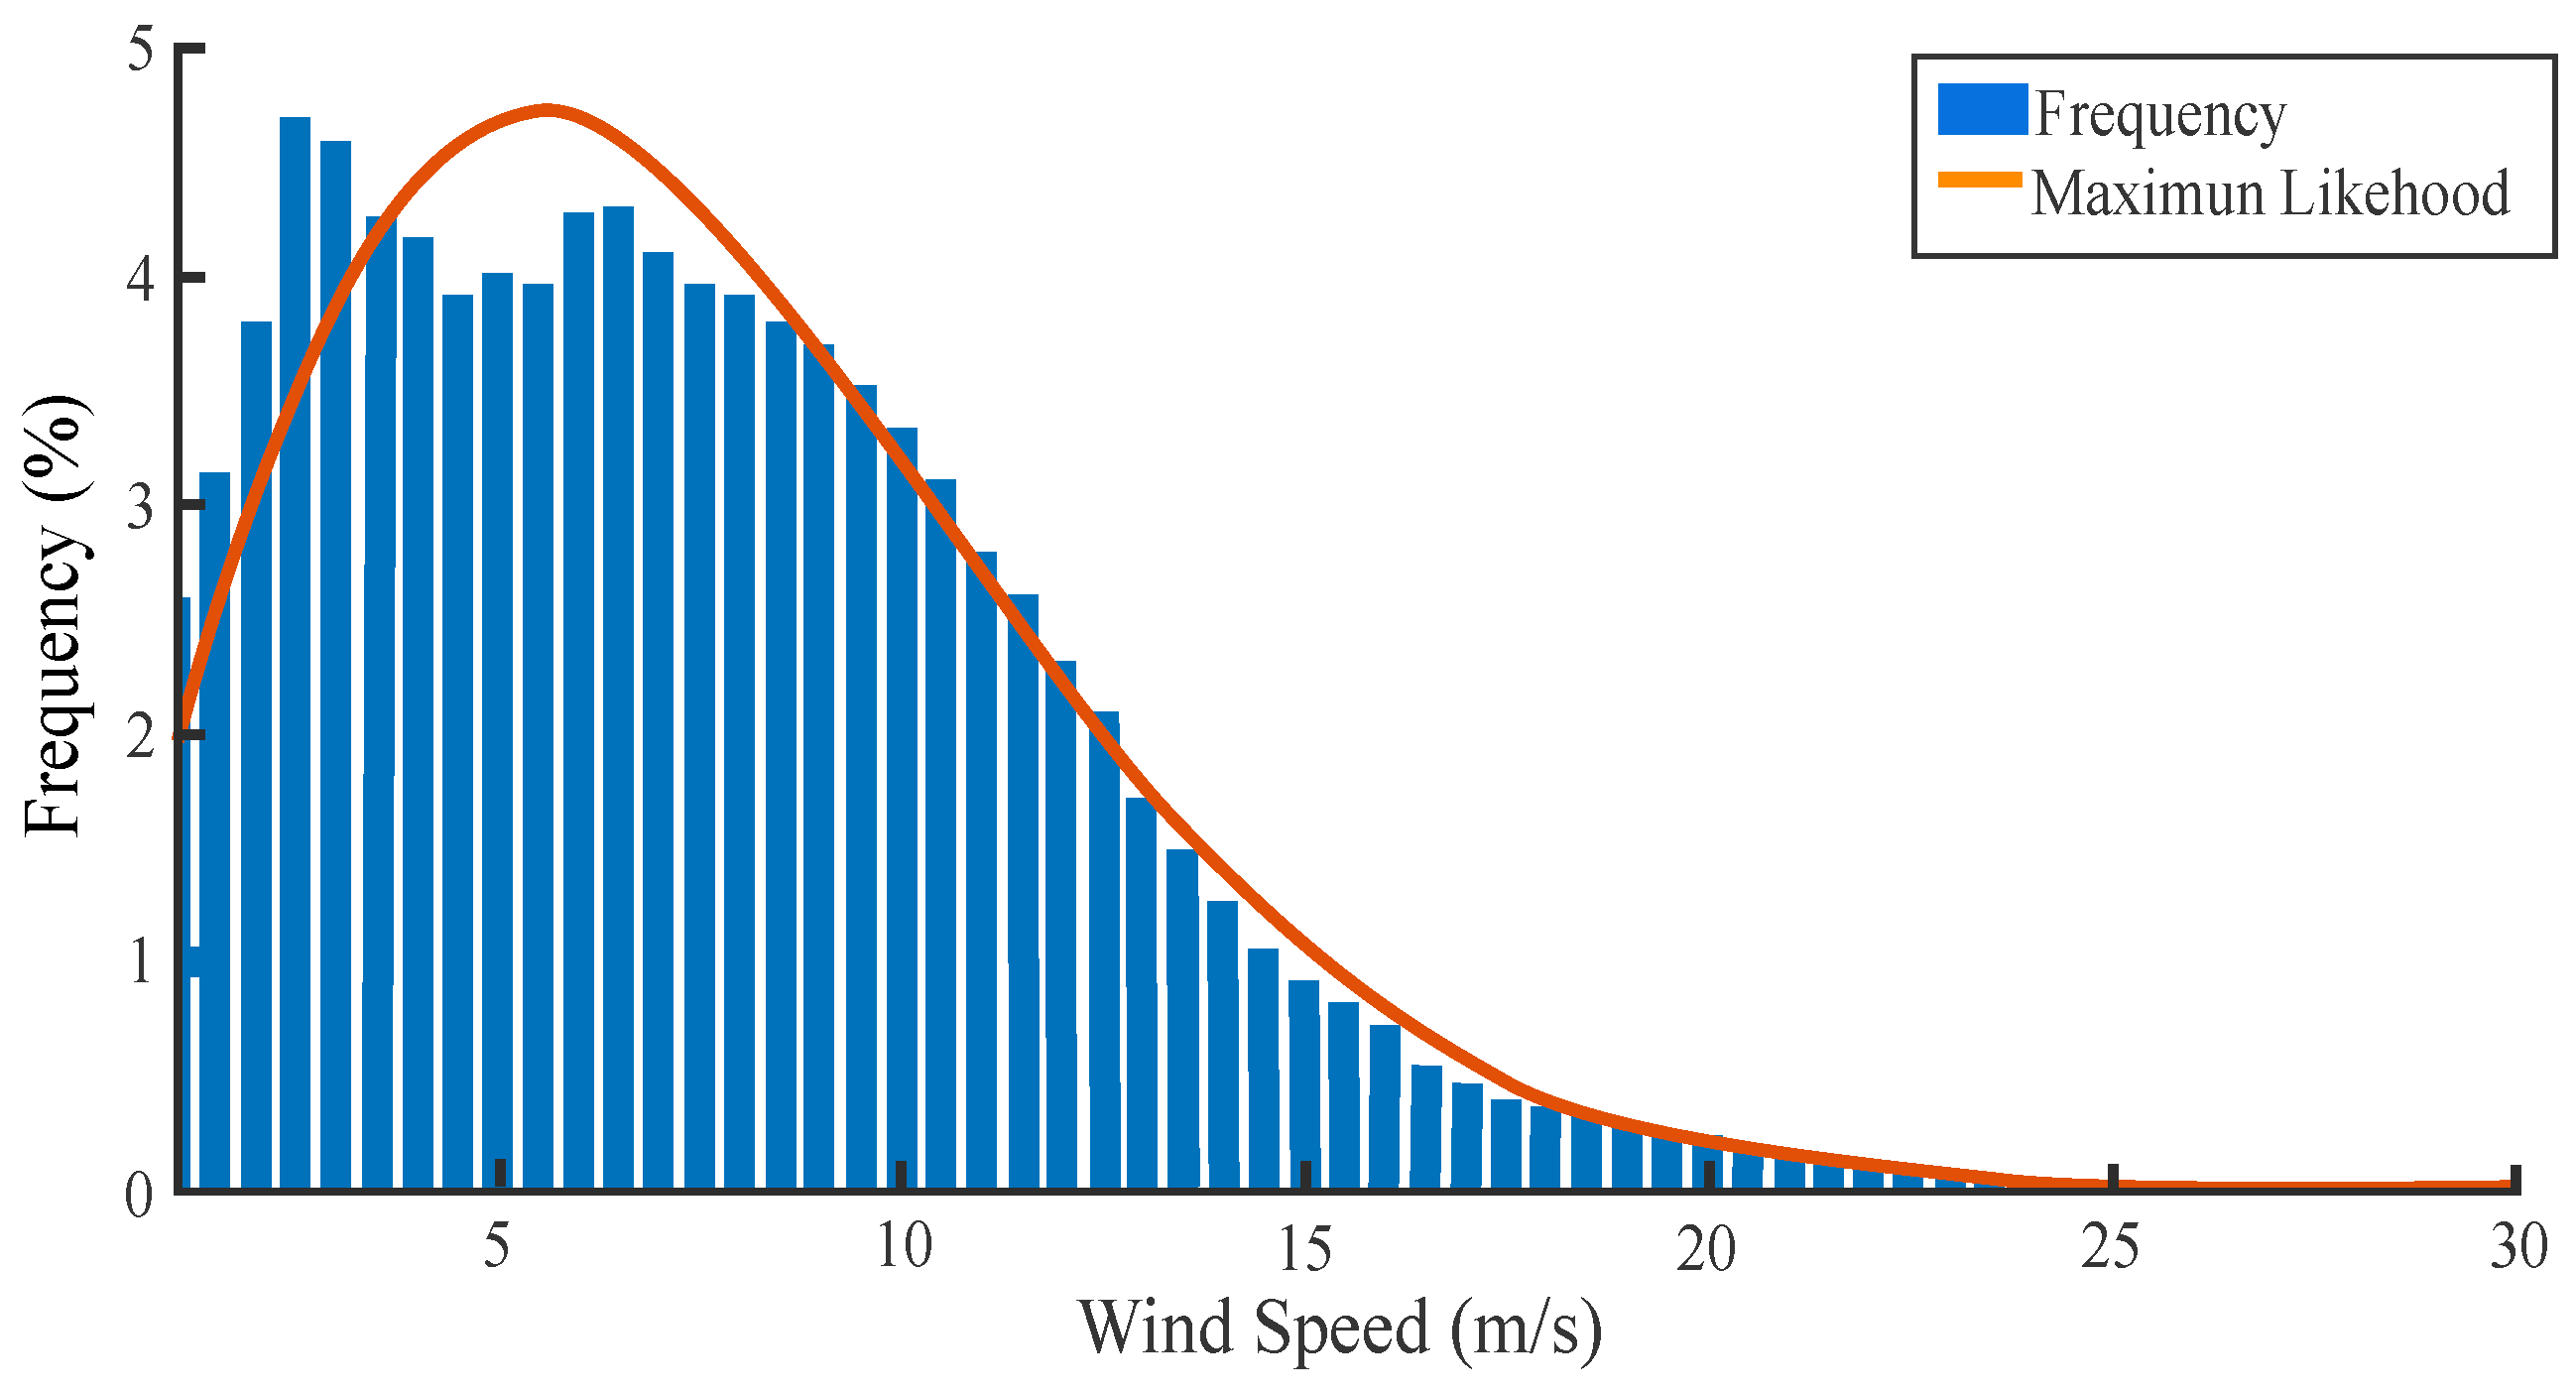
Figure 7 shows the histogram of wind speeds obtained from meteorological station M4. The data are extrapolated to a height of 25 m, the height where the wind turbine hub is located. The histogram is fitted with the Weibull probability density function, which corresponds to the maximum likelihood. Furthermore, it considers a shape factor of k = 1.81, a scale factor of c = 6.81 m/s, and an average speed of 7.62 m/s.
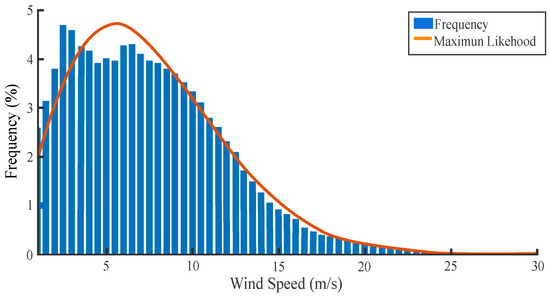
Figure 7.
Weibull probability density of average speeds at 25 m elevation.
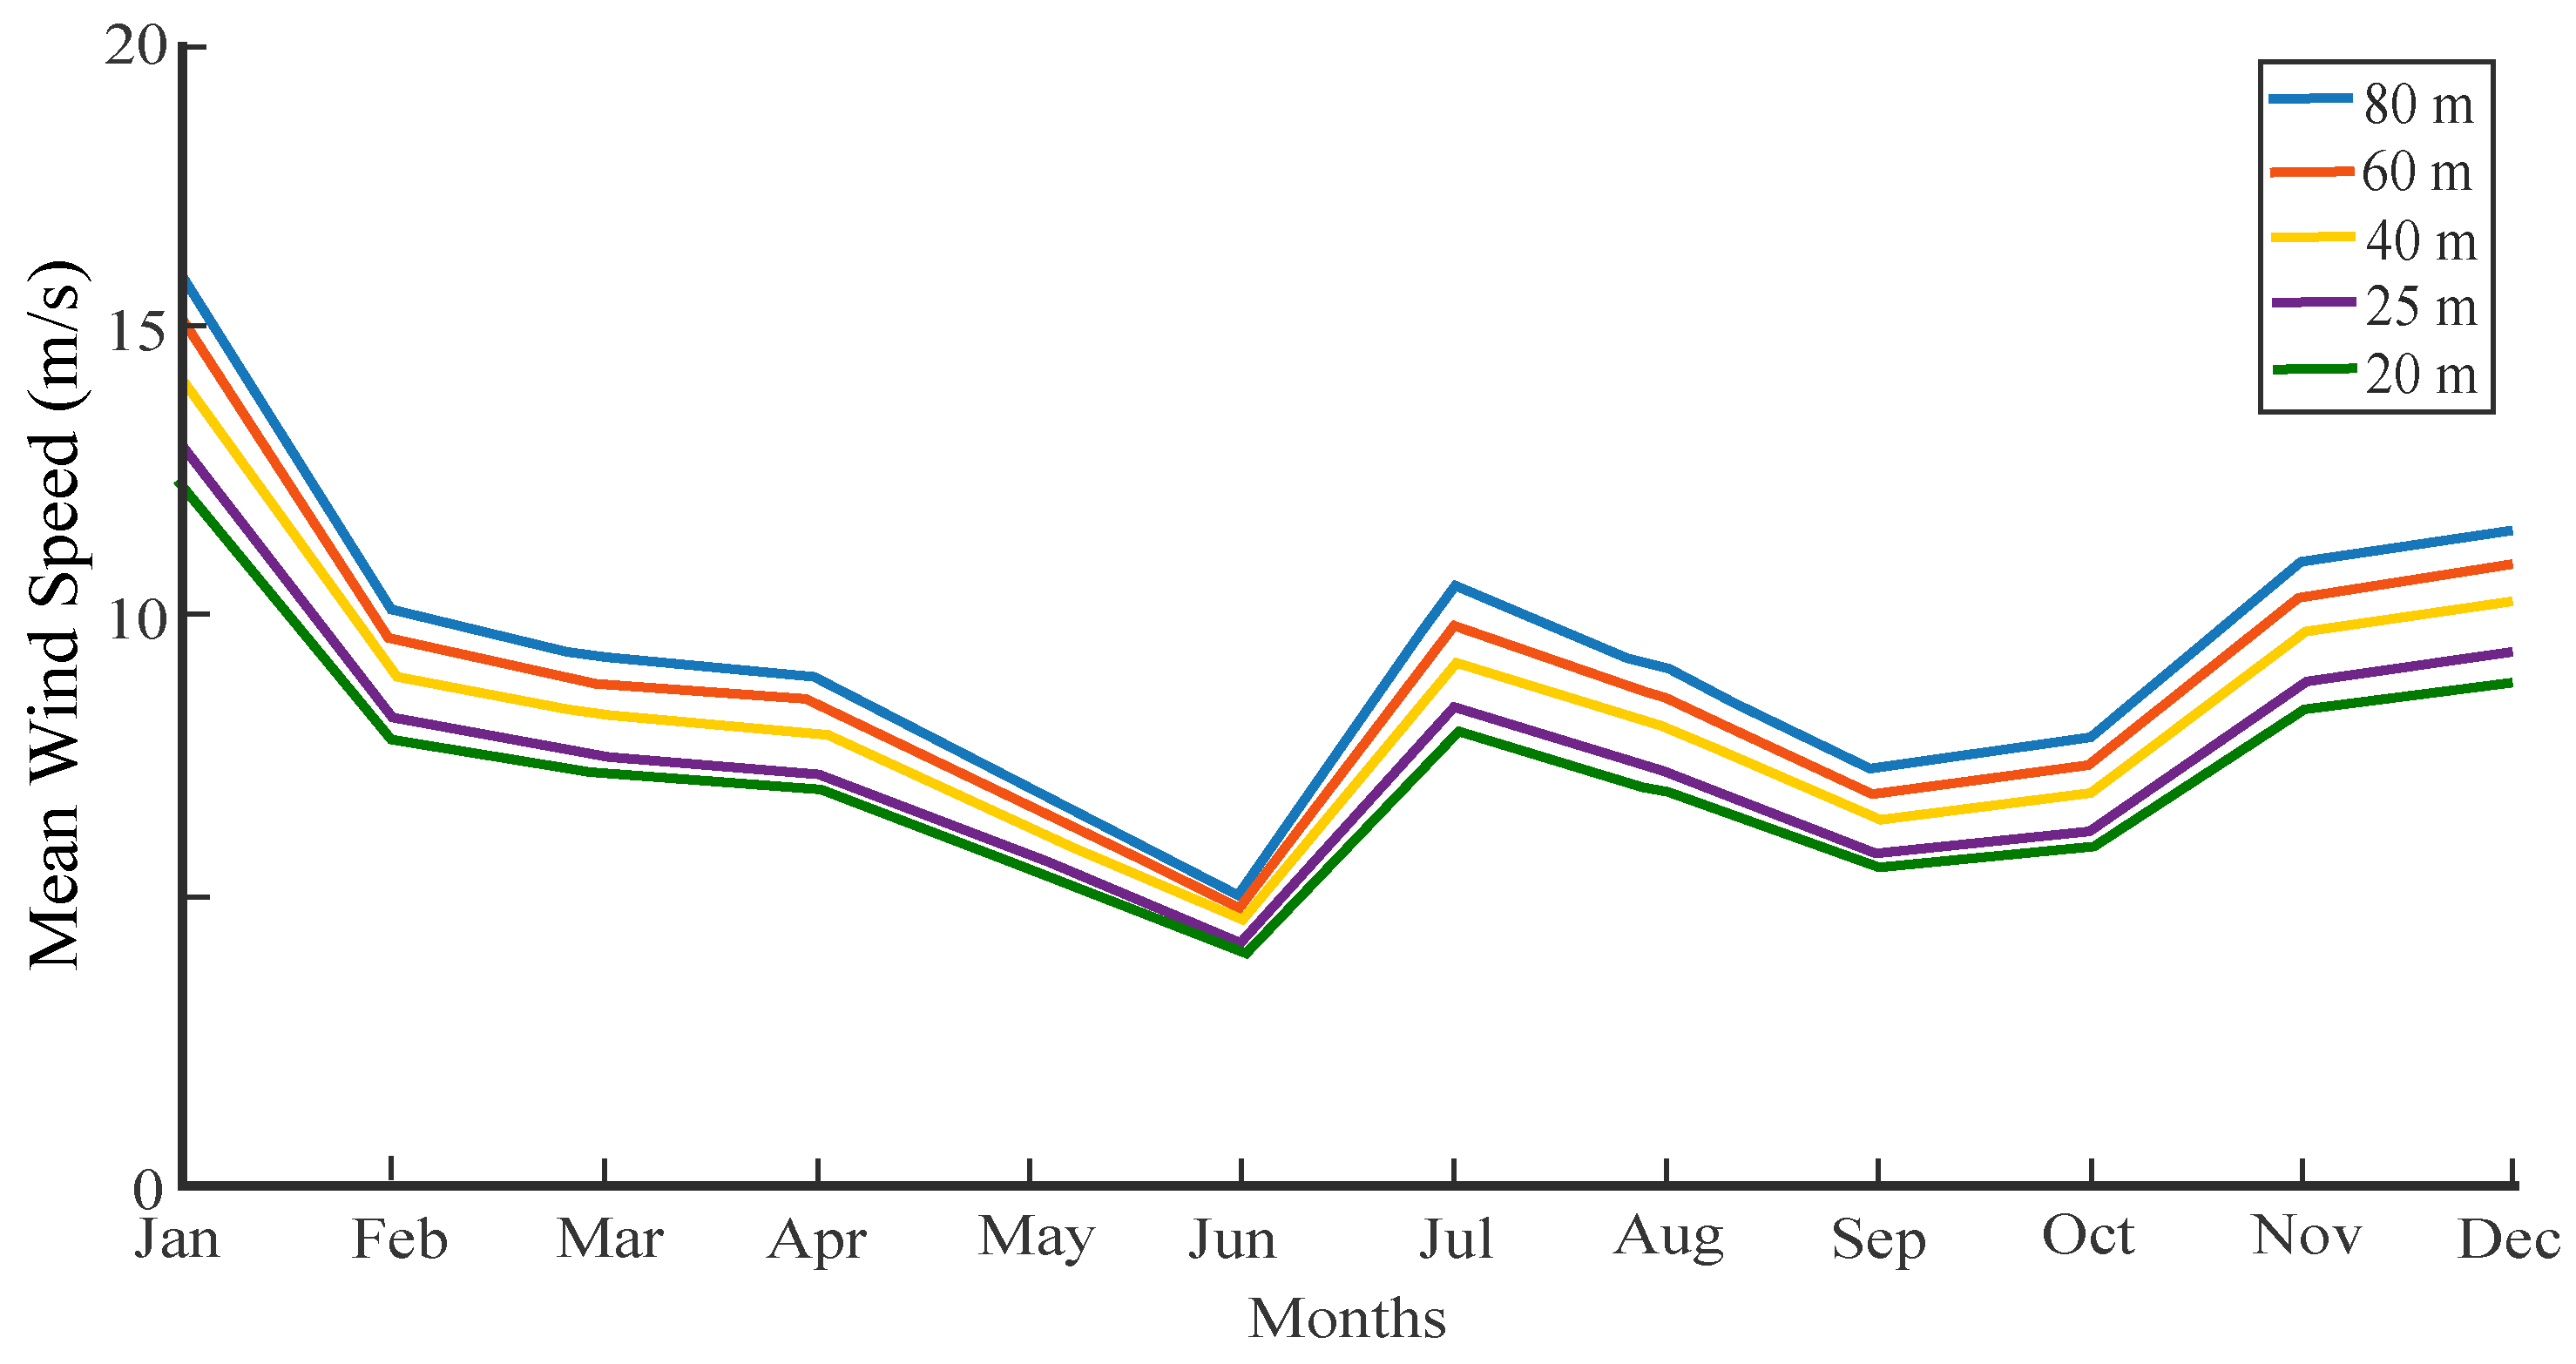
The average wind potential speed in the site area (M4) are measured and extrapolated to a height of 25 m; at this height, the hub of the 10 kW wind turbine is located. The mean wind speeds are shown in Figure 8 for each month of the year 2018.
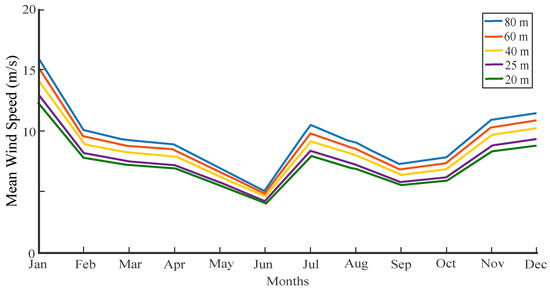
Figure 8.
Average wind speeds for each month of the year 2018 at 25 m elevation.
4.2. First Analysis: Thrust Force on P15 with Variable Angular Position and Average Wind Speed
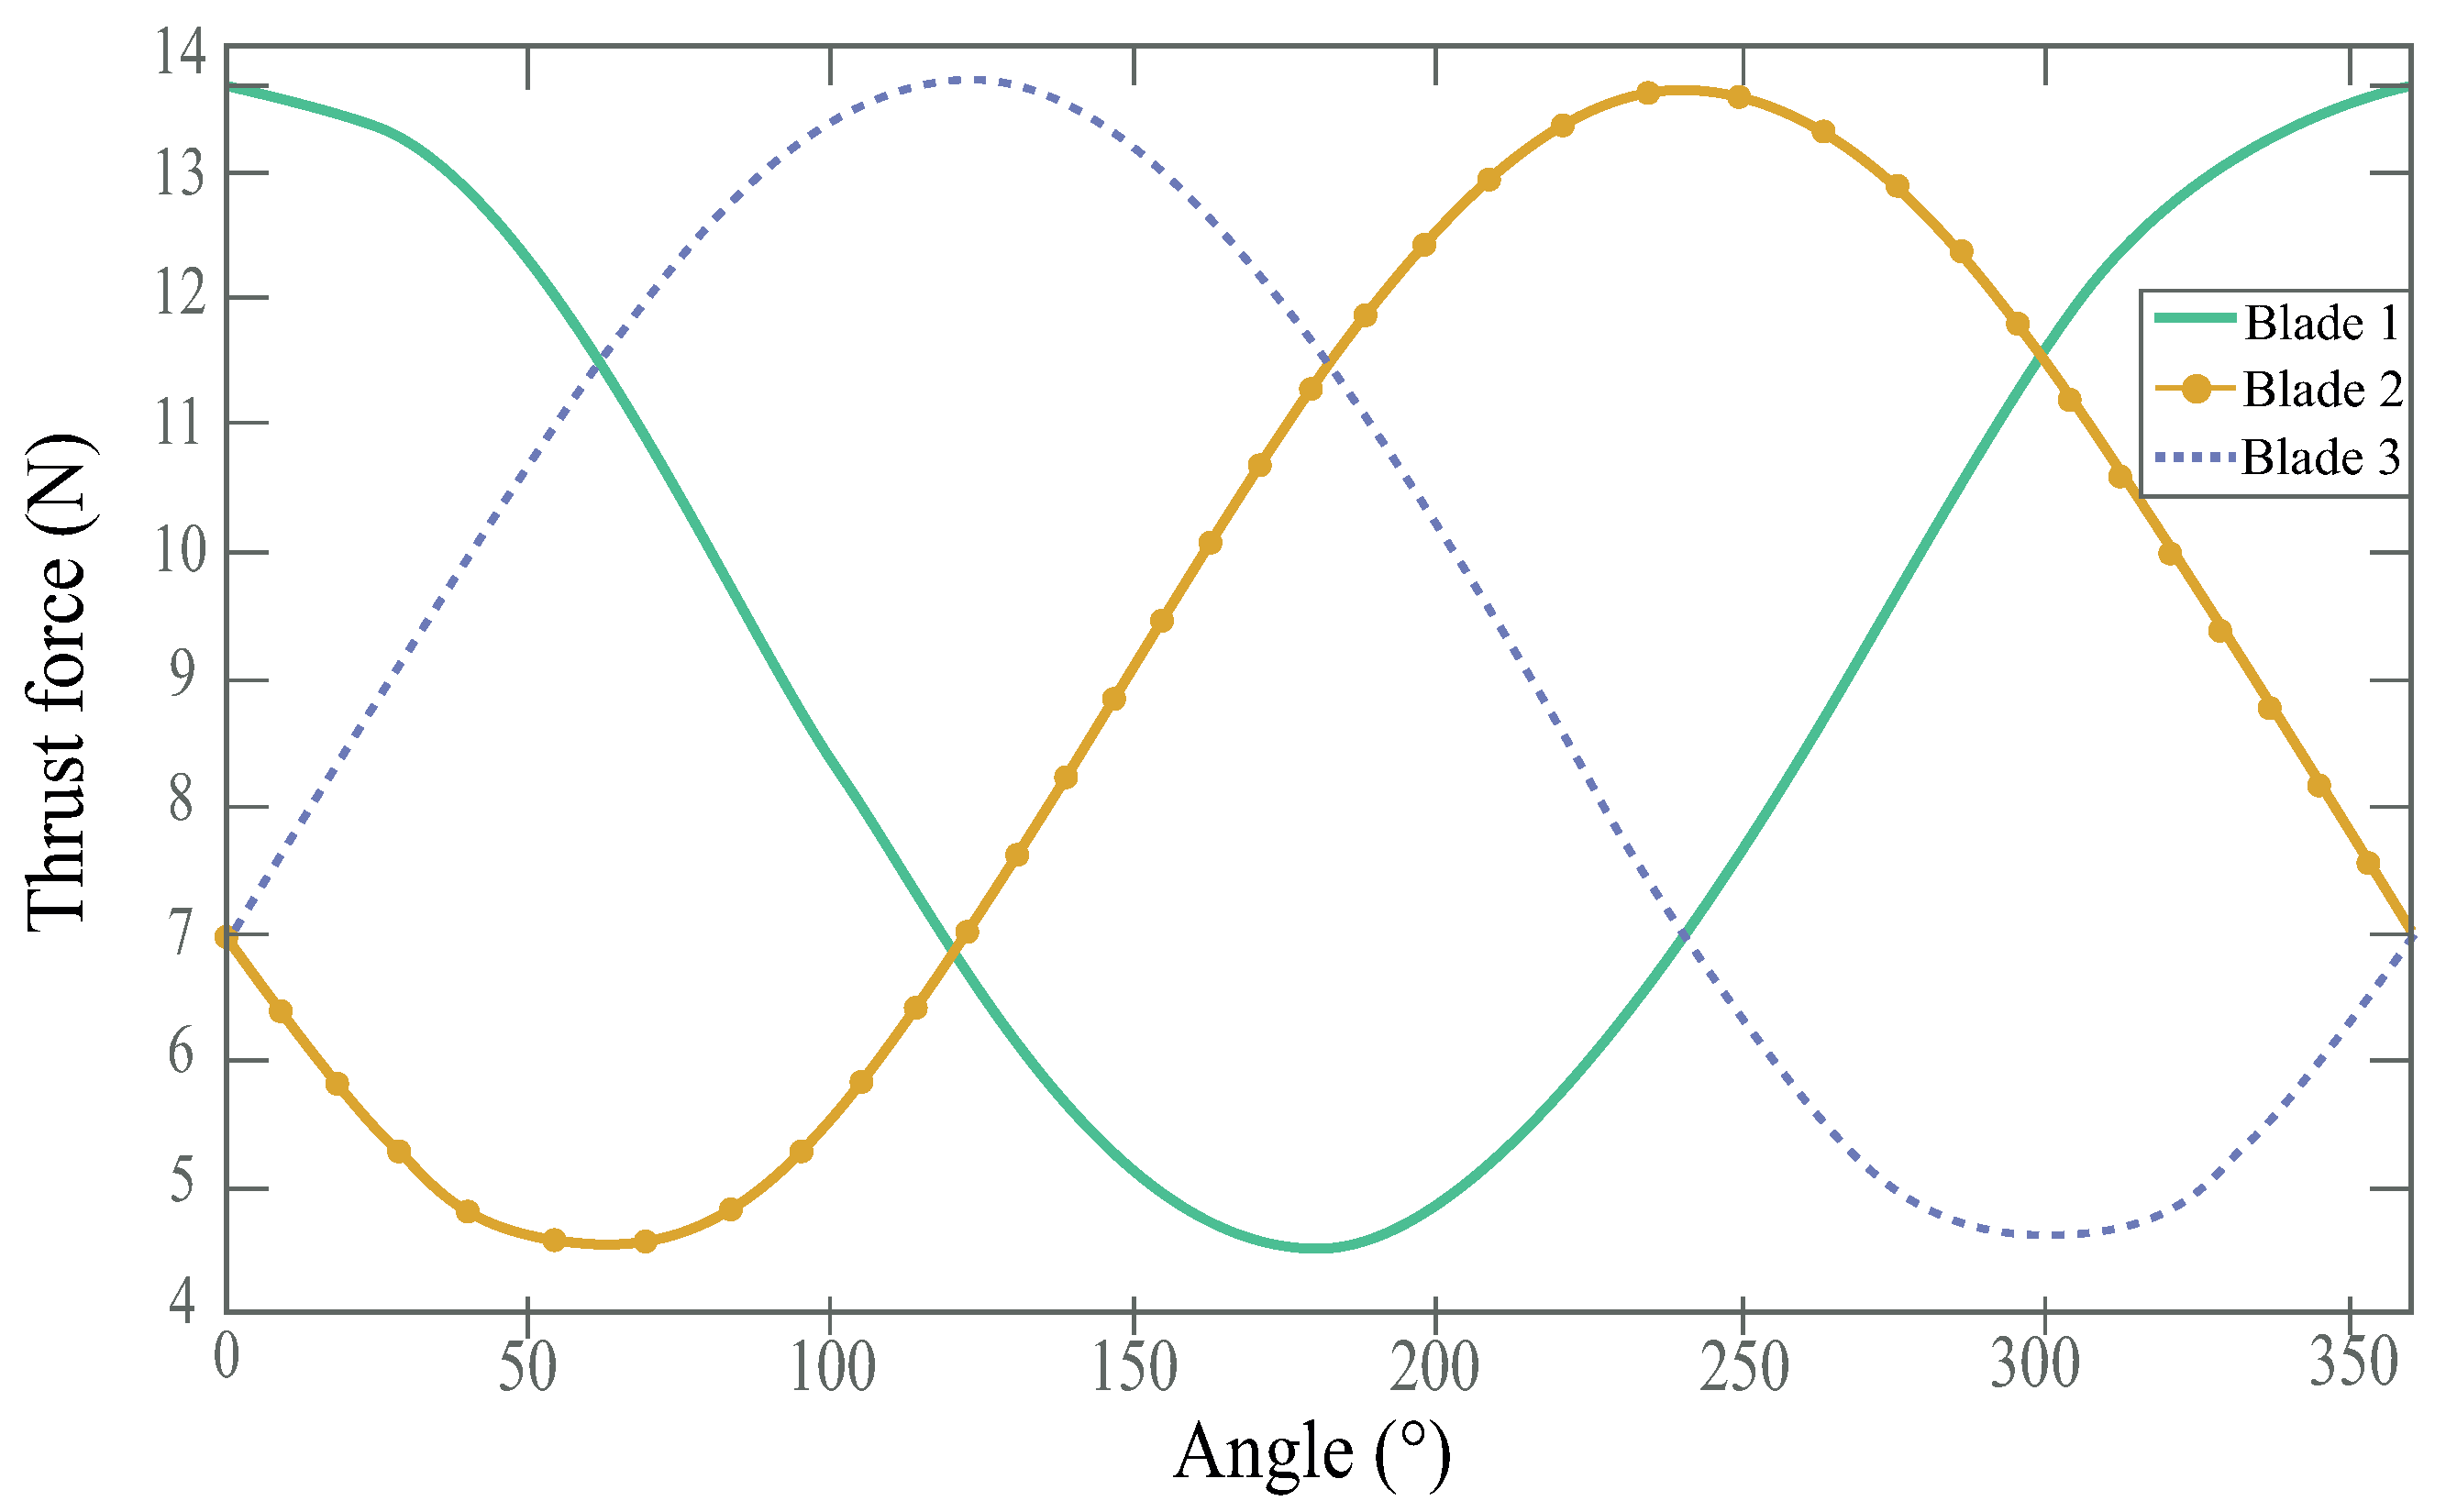
Figure 9 presents the simultaneous change in the thrust force on the three blades when the wind turbine is in operation. Table 4 summarizes these values.
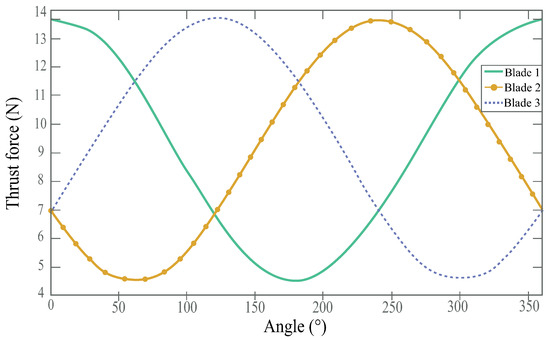
Figure 9.
Thrust force on the three blades for 360° rotation.
Table 4.
Thrust force on P15 with variable angular positions.
4.3. Second Analysis: Thrust Force on P15 with Constant Angular Position and Variable Wind Speed
The behavior of the thrust force on the three wind turbine blades at variable wind speed and with the static positions are shown in Table 5.
Table 5.
Thrust force on P15 with variable wind speed.
4.4. Third Analysis: Thrust Force on P1 to P15 with Constant Angular Position and Average Wind Speed
Table 6.
Thrust force on the 15 sections of the three blades.
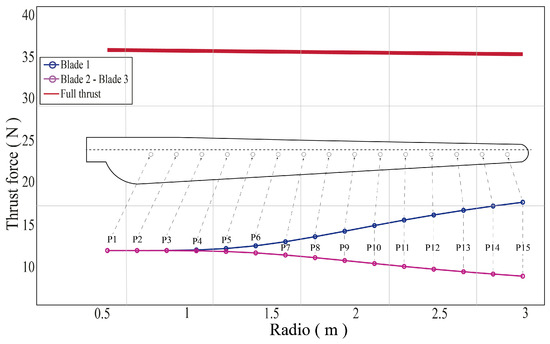
Figure 10.
Thrust force on the 15 sections of the three blades.
4.5. Fourth Analysis: Thrust Force on P1 to P15 with Constant Angular Position and Variable Wind Speed
Table 7 shows the results of the thrust force experienced by each blade under the speeds mentioned above.
Table 7.
Thrust force on the 15 sections of the three blades with variable wind speed.
5. Discussions
This section analyzes and discusses the results obtained in Section 4.
5.1. First Analysis: Thrust Force on P15 with Variable Angular Position and Average Wind Speed
From Table 4, it can be seen that the initial thrust force of blade 1 is 13.62 N and it occurs at an angular position of 90°. Blade 2 has an initial position of 330° with a thrust force of 6.95 N, and blade 3 has an initial position of 210° and presents the same thrust force as blade 2 (6.95 N). When the wind turbine starts operating and rotates its first 10°, the blades change their positions on the Cartesian plane; blade 1 is positioned at 80°, blade 2 at 320°, and blade 3 at 200°. The thrust force decreases on blades 1 and 2 to 13.56 N and 6.27 N, respectively, while on blade 3, the force increases to 7.69 N. When blade 1 turns by 30°, it is positioned on the Cartesian plane at 60°, thus presenting a thrust force of 13.06 N. When blade 2 turns by 30°, it is positioned on the Cartesian plane at 300° with a thrust force of 5.19 N, and for blade 3, it is positioned at 180° with a thrust force of 9.26 N. When rotating a total of 60°, blade 1 is located at an angular position of 30°, and the thrust decreases to 13.06 N, while blade 2 is located at an angular position of 270°. In this position, the thrust decreases to reach its minimum value of 4.53 N, and blade 3 reaches the angular position of 150°, where the thrust force on this blade increases to 5.19 N, presenting the same thrust force as on blade 1. When blade 1 rotates 120°, it reaches the angular position of 330° and the thrust force decreases to 6.95 N. When blade 2 is positioned at 210°, it has the same thrust force as blade 1 (6.95 N). While blade 3 reaches the 90° angular position, its thrust force reaches the maximum value of 13.62 N, and the cycle starts again.
5.2. Second Analysis: Thrust Force on P15 with Constant Angular Position and Variable Wind Speed
Table 5 shows that for , the maximum thrust force of blade 1 in P15 is 11.85 N, and for blades 2 and 3, it decreases to 6.04 N. This variation represents a difference of 5.81 N, equivalent to a decrease of 49.02%. For , which is the nominal power that the wind turbine reaches for the thrust force on blade 1, it presents a value of 27.91 N, and on blades 2 and 3, the thrust force decreases to 14.23 N; this represents a decrease of 49.01%. In the case of , the thrust force on blade 1 is 122.57 N, which, compared with the thrust force at average wind speed, represents an increase of 90.33%. For blades 2 and 3, the thrust force decreases to 62.51 N. For , the thrust force that occurs on blade 1 is 167.83 N which, compared with the thrust force that occurs at average wind speed, represents an increase of 92.93%. For blades 2 and 3, the thrust force decreases to 85.60 N.
5.3. Third Analysis: Thrust Force on P1 to P15 with Constant Angular Position and Average Wind Speed
Figure 10 and Table 6 show that blades 2 and 3, whose angular positions are 210° and 330°, respectively, present the same behavior in each of their segments because both blades are located at the same height. The section with the higher thrust force is closest to the origin of the same P1 with a value of 11.9017 N. The lowest thrust force is found in P15, with 8.8358 N. These variations represent a difference of 3.0659 N, equivalent to an increase of 25.76%. On blade 1, whose angular position is 90°, the behavior of the thrust force is different; the section with the higher thrust is the closest to the tip of the blade. P15 is where it reaches the maximum value of 17.6654 N, and P1 is where the lower value of the thrust force of 11.9017 N is presented. Therefore, the range of variation of the thrust force on this blade is 5.7637 N, equivalent to an increase of 32.62% of the thrust force on P1 concerning that which occurs in P15.
5.4. Fourth Analysis: Thrust Force on P1 to P15 with Constant Angular Position and Variable Wind Speed
Table 7 shows that the maximum thrust force (162.01 N) occurs in section P15 of the blade with a 90° position, obtained at the maximum wind speed (26.76 m/s). While at the same wind speed of 26.76 m/s, the lowest thrust force is 92.17 N; this thrust occurred in section P15 of the blades, with angular positions of 210° and 330°.
6. Conclusions
In this research, an algorithm was proposed to calculate the thrust force according to the angular position and the segments of each of the three blades of a 10 kW wind turbine. When the rotor is in a static position (see Figure 6), blade 1 is the blade most affected by the thrust force in P15. In other words, blade 1 has an initial angular position of 90°; this thrust force is 13.63 N. When the blade rotates 180°, this thrust force is 4.53 N; this represents a 66.74% decrease. Meanwhile, blade 2 and blade 3 have an angular position of 330° and 210°, respectively, and they are rotated 180°. Then, the thrust force changes from 6.95 N to 11.48 N; this represents a 39.45% increase.
In addition, the proposed method calculates the thrust force that occurs in each blade segment, which allows a qualitative understanding of the progressive increase in the thrust force along it; this increase occurs differently from one segment to another, depending on the position of the blade.
Blades are elements that are subjected to various types of loads. This type of load generates thrust force along the entire length of the blade. This thrust force causes the blades to deflect during operation, and this deflection can cause a collision with the wind turbine tower. The proposed method helps to predict the deflection behavior due to the thrust force applied to the blade. The thrust forces caused blade deflections of 10% to 13% with regard to the rotor radius used in this study. These results guarantee the operation of the 10 kW generator under the working conditions of the Tehuantepec isthmus, Oaxaca. Thrust forces can be used in future studies of stress–strain in blades.
Author Contributions
Formal analysis, investigation, review, and editing: J.R.D.-P., J.B.R.-O., P.Y.S.-C., C.A.M.-M., M.A. and J.R.-R.: Conceptualization, methodology, formal analysis, software, validation, resources, data curation, writing—original draft preparation, writing—visualization, and supervision. Contributions A.E.P.-M., E.P.-C. and J.P.-A. All authors have read and agreed to the published version of the manuscript.
Funding
This research received no external funding.
Institutional Review Board Statement
Not applicable.
Informed Consent Statement
Not applicable.
Data Availability Statement
The data presented in this study are available on request from the corresponding author due to confidentiality of research in some aspects.
Conflicts of Interest
The authors declare no conflicts of interest.
Abbreviations
| Symbol | Description | Symbol | Description |
| Thrust force induced on the rotor [N] | a | Radius of the tower [m] | |
| Average speed [m/s] | I | Turbulence intensity [-] | |
| Power coefficient [-] | k | Shape parameter [-] | |
| Thrust force coefficient [-] | c | Scale parameter [m/s] | |
| A | Swept area of the rotor [] | Mean wind speed [m/s] | |
| Wind speed at hub height [m/s] | |||
| Wind speed at a given height [m/s] | Difference between the wind speed in each section and the extrapolated wind speed [m/s] | ||
| Roughness length [m] | Sum of the thrust force on each blade [N] | ||
| Wind speed due to the shadow of the tower [m/s] | Distance from the root of the blade to the position of the first profile [m] | ||
| Design speed [m/s] | R | Rotor radius [m] | |
| Generation output speed [m/s] | Azimuthal angle [°] | ||
| Maximum speed [m/s] | Air density [kg/m3] | ||
| Thrust force given by the blade [N] | Local specific speed [-] | ||
| h | Hub height [m] | Specific design speed [-] | |
| Given height [m] | Pitch angle [°] | ||
| y | Lateral distance from the blade to the mean line of the tower [m] | Ground roughness [-] | |
| x | Distance from the origin of the blade to the midline of the tower [m] | Standard deviation of the wind fluctuations [-] | |
| Wind shear shape function [m/s] | r | Radial distance from rotor axis [m] |
References
- Kim, B.; Kim, W.; Bae, S.; Park, J.; Kim, M. Aerodynamic design and performance analysis of multi-MW class wind turbine blade. J. Mech. Sci. Technol. 2011, 25, 1995–2002. [Google Scholar] [CrossRef]
- Ullah, H.; Alam, K.; Iqbal, M.; Husain, A.; Silberschmidt, V.V. Simulation of buckling-driven progressive damage in composite wind turbine blade under extreme wind loads. Eng. Fail. Anal. 2022, 140, 106–574. [Google Scholar] [CrossRef]
- Spera, D.A. Wind Turbine Technology: Fundamental Concepts of Wind Turbine Engineering; ASME Press: New York, NY, USA, 2009. [Google Scholar] [CrossRef]
- Hansen, M.O. Aerodynamics of Wind Turbines: Rotors, Loads and Structure; Earthscan: Oxford, UK, 2000; Volume 17. [Google Scholar]
- Li, Z.; Wen, B.; Dong, X.; Peng, Z.; Qu, Y.; Zhang, W. Aerodynamic and aeroelastic characteristics of flexible wind turbine blades under periodic unsteady inflows. J. Wind Eng. Ind. Aerodyn. 2020, 197, 104057. [Google Scholar] [CrossRef]
- Martínez-Tossas, L.A.; Branlard, E.; Shaler, K.; Vijayakumar, G.; Ananthan, S.; Sakievich, P.; Jonkman, J. Numerical investigation of wind turbine wakes under high thrust coefficient. Wind Energy 2022, 25, 605–617. [Google Scholar] [CrossRef]
- Vaal, J.B.D.; Hansen, M.O.; Moan, T. Effect of wind turbine surge motion on rotor thrust and induced velocity. Wind Energy 2014, 17, 105–121. [Google Scholar] [CrossRef]
- Eason, G.; Noble, B.; Sneddon, I.N. On Certain Integrals of Lipschitz-Hankel Type Involving Products of Bessel Functions. Philos. Trans. R. Soc. Lond. 1955, 247, 529–551. [Google Scholar] [CrossRef]
- Noppe, N.; Weijtjens, W.; Devriendt, C. Modeling of quasi-static thrust load of wind turbines based on 1s SCADA data. Wind Energy Sci. 2018, 3, 139–147. [Google Scholar] [CrossRef]
- Huang, G.; Zhang, S.; Yan, B.; Yang, Q.; Zhou, X.; Ishihara, T. Thrust-matched optimization of blades for the reduced-scale wind tunnel tests of wind turbine wakes. J. Wind Eng. Ind. Aerodyn. 2022, 228, 105–113. [Google Scholar] [CrossRef]
- Wood, D. Small Wind Turbines: Analysis, Design, and Application. Green Energy and Technology; Springer: Berlin/Heidelberg, Germany, 2011; Volume 38. [Google Scholar] [CrossRef]
- Burton, T.; Sharpe, D.; Jenkins, N.; Bossanyi, E. Wind Energy Handbook-Wiley, 3rd ed.; John Wiley & Sons Ltd.: Hoboken, NJ, USA, 2021. [Google Scholar]
- Maxwell, J.C. A Treatise on Electricity and Magnetism; Oxford University Press: Oxford, UK, 1873; Volume 1. [Google Scholar]
- Mouhsine, S.E.; Oukassou, K.; Ichenial, M.M.; Kharbouch, B.; Hajraoui, A. Aerodynamics and structural analysis of wind turbine blade. Procedia Manuf. 2018, 22, 747–756. [Google Scholar] [CrossRef]
- Schubel, P.J.; Crossley, R.J. Wind Turbine Blade Design. Energies 2012, 5, 3425–3449. [Google Scholar] [CrossRef]
- Fischer, B.; Shan, M. A Survey on Control Methods for the Mitigation of Tower Loads; Fraunhofer-Institute for Wind Energy and Energy Systems Technology: Bremerhaven, Germany, 2013. [Google Scholar]
- Taylor, G.I. The Spectrum of Turbulence. Proc. R. Soc. London Ser. A-Math. Phys. Sci. 1938, 164, 476–490. [Google Scholar] [CrossRef]
- Mahmuddin, F. Rotor Blade Performance Analysis with Blade Element Momentum Theory. Energy Procedia 2017, 105, 1123–1129. [Google Scholar] [CrossRef]
- Horcas, S.G.; Ramos-García, N.; Li, A.; Pirrung, G.; Barlas, T. Comparison of aerodynamic models for horizontal axis wind turbine blades accounting for curved tip shapes. Wind Energy 2022, 26, 5–22. [Google Scholar] [CrossRef]
- Fritz, E.K.; Ferreira, C.; Boorsma, K. An efficient blade sweep correction model for blade element momentum theory. Wind Energy 2022, 25, 1977–1994. [Google Scholar] [CrossRef]
- Rodriguez, C.V.; Celis, C. Design optimization methodology of small horizontal axis wind turbine blades using a hybrid CFD/BEM/GA approach. J. Braz. Soc. Mech. Sci. Eng. 2022, 44, 254. [Google Scholar] [CrossRef]
- Grundkötter, E.; Melbert, J. Precision blade deflection measurement system using wireless inertial sensor nodes. Wind Energy 2021, 25, 432–449. [Google Scholar] [CrossRef]
- Manwell, J.F.; McGowan, J.G.; Rogers, A.L. Wind Energy Explained: Theory, Design and Application; John Wiley and Sons: Hoboken, NJ, USA, 2010; Volume 19, pp. 115–117. [Google Scholar] [CrossRef]
- Chapman, D.R.; Mark, H.; Pirtle, M.W. Computers vs. wind tunnels for aerodynamic flow simulations. Astronaut. Aeronaut. 1975, 13. [Google Scholar]
- Dolan, D.S.; Lehn, P.W. Simulation model of wind turbine 3p torque oscillations due to wind shear and tower shadow. IEEE Trans. Energy Convers. 2006, 21, 717–724. [Google Scholar] [CrossRef]
- Forcier, L.C.; Sumner, J.; Gagnon, T.; Charron, J.F.; Joncas, S. Structural design and validation of a 10 kW wind turbine blade. In Proceedings of the The 19th International Conference on Composite Materials, Montréal, Canada, 28 July–2 August 2013. [Google Scholar]
- IEC 61400-2; Wind Turbines—Part 2: Design Requirements for Small Wind Turbines, 3 ed. International Electrotechnical Commission: Geneva, Switzerland, 2013. Available online: https://webstore.iec.ch/publication/5433 (accessed on 15 November 2023).
- IEC 61400-12-1:2017; Wind Energy Generation Systems—Part 12-1: Power Performance Measurements of Electricity Producing Wind Turbines, 3 ed. International Electrotechnical Commission: Geneva, Switzerland, 2017. Available online: https://webstore.iec.ch/publication/26603. (accessed on 15 November 2023).
- Dorrego Portela, J.R.; Hernández Galvez, G.; Hernandez-Escobedo, Q.; Saldaña Flores, R.; Sarracino Martínez, O.; Lastres Danguillecourt, O.; López de Paz, P.; Perea-Moreno, A.J. Microscale wind assessment, comparing mesoscale information and observed wind data. Sustainability 2022, 14, 11991. [Google Scholar] [CrossRef]


Disclaimer/Publisher’s Note: The statements, opinions and data contained in all publications are solely those of the individual author(s) and contributor(s) and not of MDPI and/or the editor(s). MDPI and/or the editor(s) disclaim responsibility for any injury to people or property resulting from any ideas, methods, instructions or products referred to in the content. |
© 2024 by the authors. Licensee MDPI, Basel, Switzerland. This article is an open access article distributed under the terms and conditions of the Creative Commons Attribution (CC BY) license (https://creativecommons.org/licenses/by/4.0/).