Abstract
This study investigates the effects of the number of layers, x-yarn (weft) density, and z-yarn (binder) path on the mechanical behavior of E-glass 3D orthogonal woven (3DOW) composites during low-velocity impacts. Meso-level finite element (FE) models were developed and validated for 3DOW composites with different yarn densities and z-yarn paths, providing analyses of stress distribution within reinforcement fibers and matrix, energy absorption, and failure time. Our findings revealed that lower x-yarn densities led to accumulations of stress concentrations. Furthermore, changing the z-yarn path, such as transitioning from plain weaves to twill or basket weaves had a noticeable impact on stress distributions. The research highlights the significance of designing more resilient 3DOW composites for impact applications by choosing appropriate parameters in weaving composite designs.
1. Introduction
3D woven composites, distinguished by their intricate interlaced fiber architecture, have attracted substantial interest in recent years owing to their enhanced mechanical attributes, such as superior strength, dimensional stability, and heightened resistance to delamination and impact [1,2,3,4,5]. In contrast to conventional 2D woven composites, which feature yarns interweaving in the warp (y-yarn) and weft (x-yarn) directions, 3D woven composites incorporate an additional set of yarns oriented in the thickness dimension. This design allows for precise control over the fiber distribution across all three dimensions, enabling customization of the composite’s strength based on applications [6]. A study conducted by Fang Peng et al. [7] highlighted the augmented impact resistance observed in 3D printed components with structured filaments, underscoring the advantages of 3D weaving in improving impact properties. Further, M. Saeedifar et al. [8] noted that while 3D woven composites demonstrated a gradual damage progression retaining higher residual strength post-impact, 2D woven composites exhibited a more abrupt and catastrophic failure.
The 3D orthogonal woven composite (3DOW) is distinguished by its intricate design, where three sets of yarns are integrated in three orthogonal directions [9,10,11,12,13]. In this architecture, the x-yarns (weft) and y-yarns (warp) remain straight without any crimp, while the binder (z-yarn) travels from the fabric’s top to its bottom, oriented in the through-thickness direction. Several studies have been dedicated to elucidating the role of the z-yarn in shaping the mechanical performance of 3DOW. Notably, Turner and Zeng [14] demonstrated the absence of visible delamination in the 3DOW composite upon impact, contrasting with unidirectional laminates. This finding accentuated the z-yarn’s pivotal role in mitigating delamination damage propagation, underscoring its viability in applications necessitating impact resistance. Subsequent analyses, integrating both experimental techniques and finite element methods, affirmed the diminished delamination in 3DOW composites [4,15,16,17,18]. This outcome resonates with findings from Sohail et al. [19] and Luo et al. [20], who reported that the major failure mechanisms in 3DOW composite under impact are fiber tearing and matrix crushing, while delamination failure was not significant due to the binding from z-yarns. Ghosh and De’s simulations [21], conducted at the yarn level, revealed that z-yarns played an instrumental role in confining fiber-tensile damage by efficiently directing stress waves. However, they also highlighted potential vulnerabilities: matrix shear damage at the z-yarn interaction points could precipitate cracks and engender void growth, potentially compromising the composite’s structural integrity. Such insights underscore the pressing need for optimal design and integration strategies for z-yarns within 3DOW composites.
Miao et al.’s comparative study accentuated the z-yarn’s role in impeding horizontal propagation of resin damage, resulting in a discontinuous resin damage pattern [22]. Concurrently, other studies, including those by Midani [23] and Dai et al. [24], brought to the fore the nuanced effects of the binder yarn path on a composite’s mechanical attributes, particularly its tensile, compressive, and flexural properties. These studies collectively emphasized the profound influence of the distribution of binding interlacements and resin-rich areas on the composite’s resilience, particularly against delamination. Kumar and Bijiya [25] delved into the mechanical properties of 3DOW fabrics defined by distinct binder yarn paths. Their findings illustrated the intricate relationship between the fabric’s crossover points and its impact absorption capacity. However, their study left a noticeable gap, neglecting an in-depth impact analysis, an oversight that calls attention to potential vulnerabilities in damage initiation sites and delamination lengths under impact loading. Given the significance of impact resistance in the application of 3DOW composites, understanding how binder yarn paths influence impact behavior is crucial.
Another crucial factor that influences the mechanical and impact performance of 3DOW composites is the x-yarn density. Sun’s utilization of micro-CT for evaluating low-velocity damage in 3D composites revealed that the directionality of impact damage was predominantly governed by the weft/warp orientation [26]. Subsequent finite element analyses accentuated the critical role of x- and y-yarns in energy absorption at the impact’s onset. This observation is corroborated by Nasrun et al.’s investigation into the tensile strength of 3D woven fabrics across varied x-yarn densities, which highlighted a direct correlation between tensile strength and increasing x-yarn density [27]. Similarly, Neale et al. [28,29] observed that augmenting the x-yarn density in 3DOW composites not only enhanced specific energy absorption but also total energy absorption. They inferred that nuanced modifications in x-yarn density and weave can substantially bolster energy absorption and strength, eliminating the need for an overhaul of the reinforcement structure. This proposition is further strengthened by Li et al.’s finite element analysis [30], which established a definitive relationship between the mechanical properties of 3D composites and x-yarn density. Hamouda et al.’s statistical examination [31], using the general linear model, emphasized the pronounced impact of x-yarn density on the mechanical properties, namely bending strength, flexural modulus, flexural strength, and tensile strength, of 3DOW composites. Moreover, Midani et al.’s experimental approach [32], subjecting 3DOW composites with varied x-yarn densities to Izod, Tup, and Charpy impacts, elucidated that even though increasing the number of layers may have a more pronounced impact on total penetration energy, variations in x-yarn density still markedly influence total energy absorption.
This study aims to delve deeper into understanding the nuanced effects of x-yarn density and z-yarn path on the impact performance of 3DOW composites, employing finite element models for in-depth analyses. Finite element models are created based on measured dimensions, and in-depth analyses are carried out. We have incorporated the ABAQUS/Explicit user-defined subroutine (VUMAT) based on MAT162 [33,34,35], a progressive composite damage model, to simulate the impregnated E-glass fiber’s damage behavior. Detailed FE analyses and model validation are conducted to reveal the effect of these structural parameters, from aspects of energy absorption, penetration time, and stressed areas in both reinforcement and matrix.
2. Materials and Methods
2.1. Development of the Geometric Model
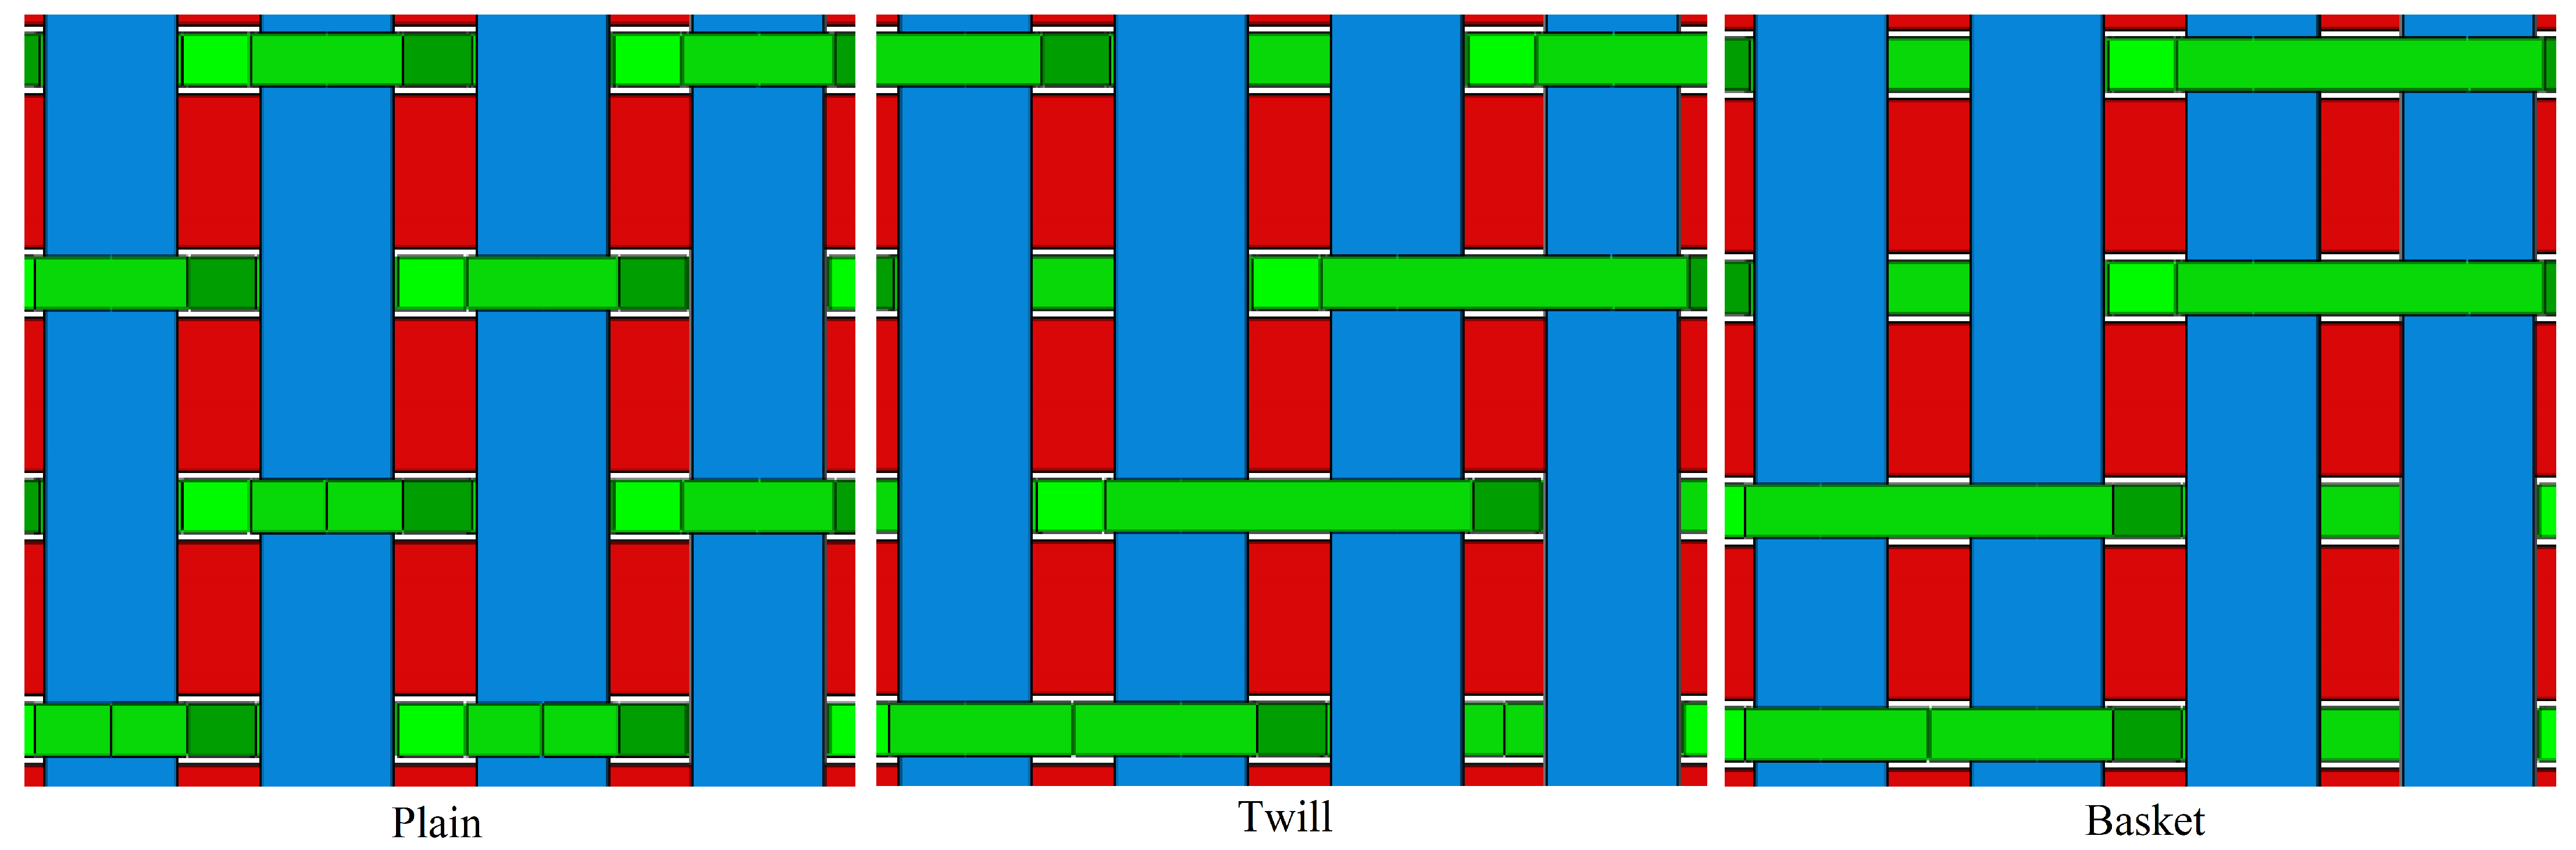
Midani [32] fabricated 3DOW composite samples with a consistent y-yarn density. The samples varied in z-yarn paths (plain weave, 2 × 2 basket, and 2 × 2 twill) and x-yarn densities (4.87, 5.45, and 5.87 picks/cm/layer). Figure 1 presents schematic views of plain, 2 × 2 twill, and 2 × 2 basket weave patterns, illustrating the distinct weaving structures employed in this study. Low-velocity impact tests were conducted to investigate how these geometrical parameters influence the impact performance of 3DOW composites. Based on the experimental data, we developed eleven models, as depicted in Table 1. The 11 models included three different x-yarn densities for each of the 2-layer, 3-layer, and 4-layer models, and three two-layer models with different z-yarn paths. Using the finite element method, we analyzed how structural parameters influence stress variation in 3DOW composites under low-velocity impacts (Table 1).
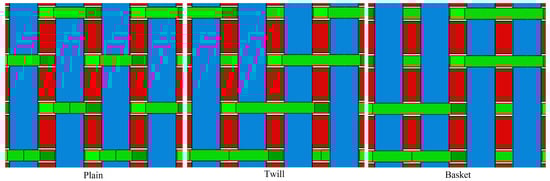
Figure 1.
Schematic view of different z-yarn configurations. (the x-yarn is depicted in blue, the z-yarn is shown in green, and the y-yarn is represented in red).

Table 1.
Specifications of 3DOW models.
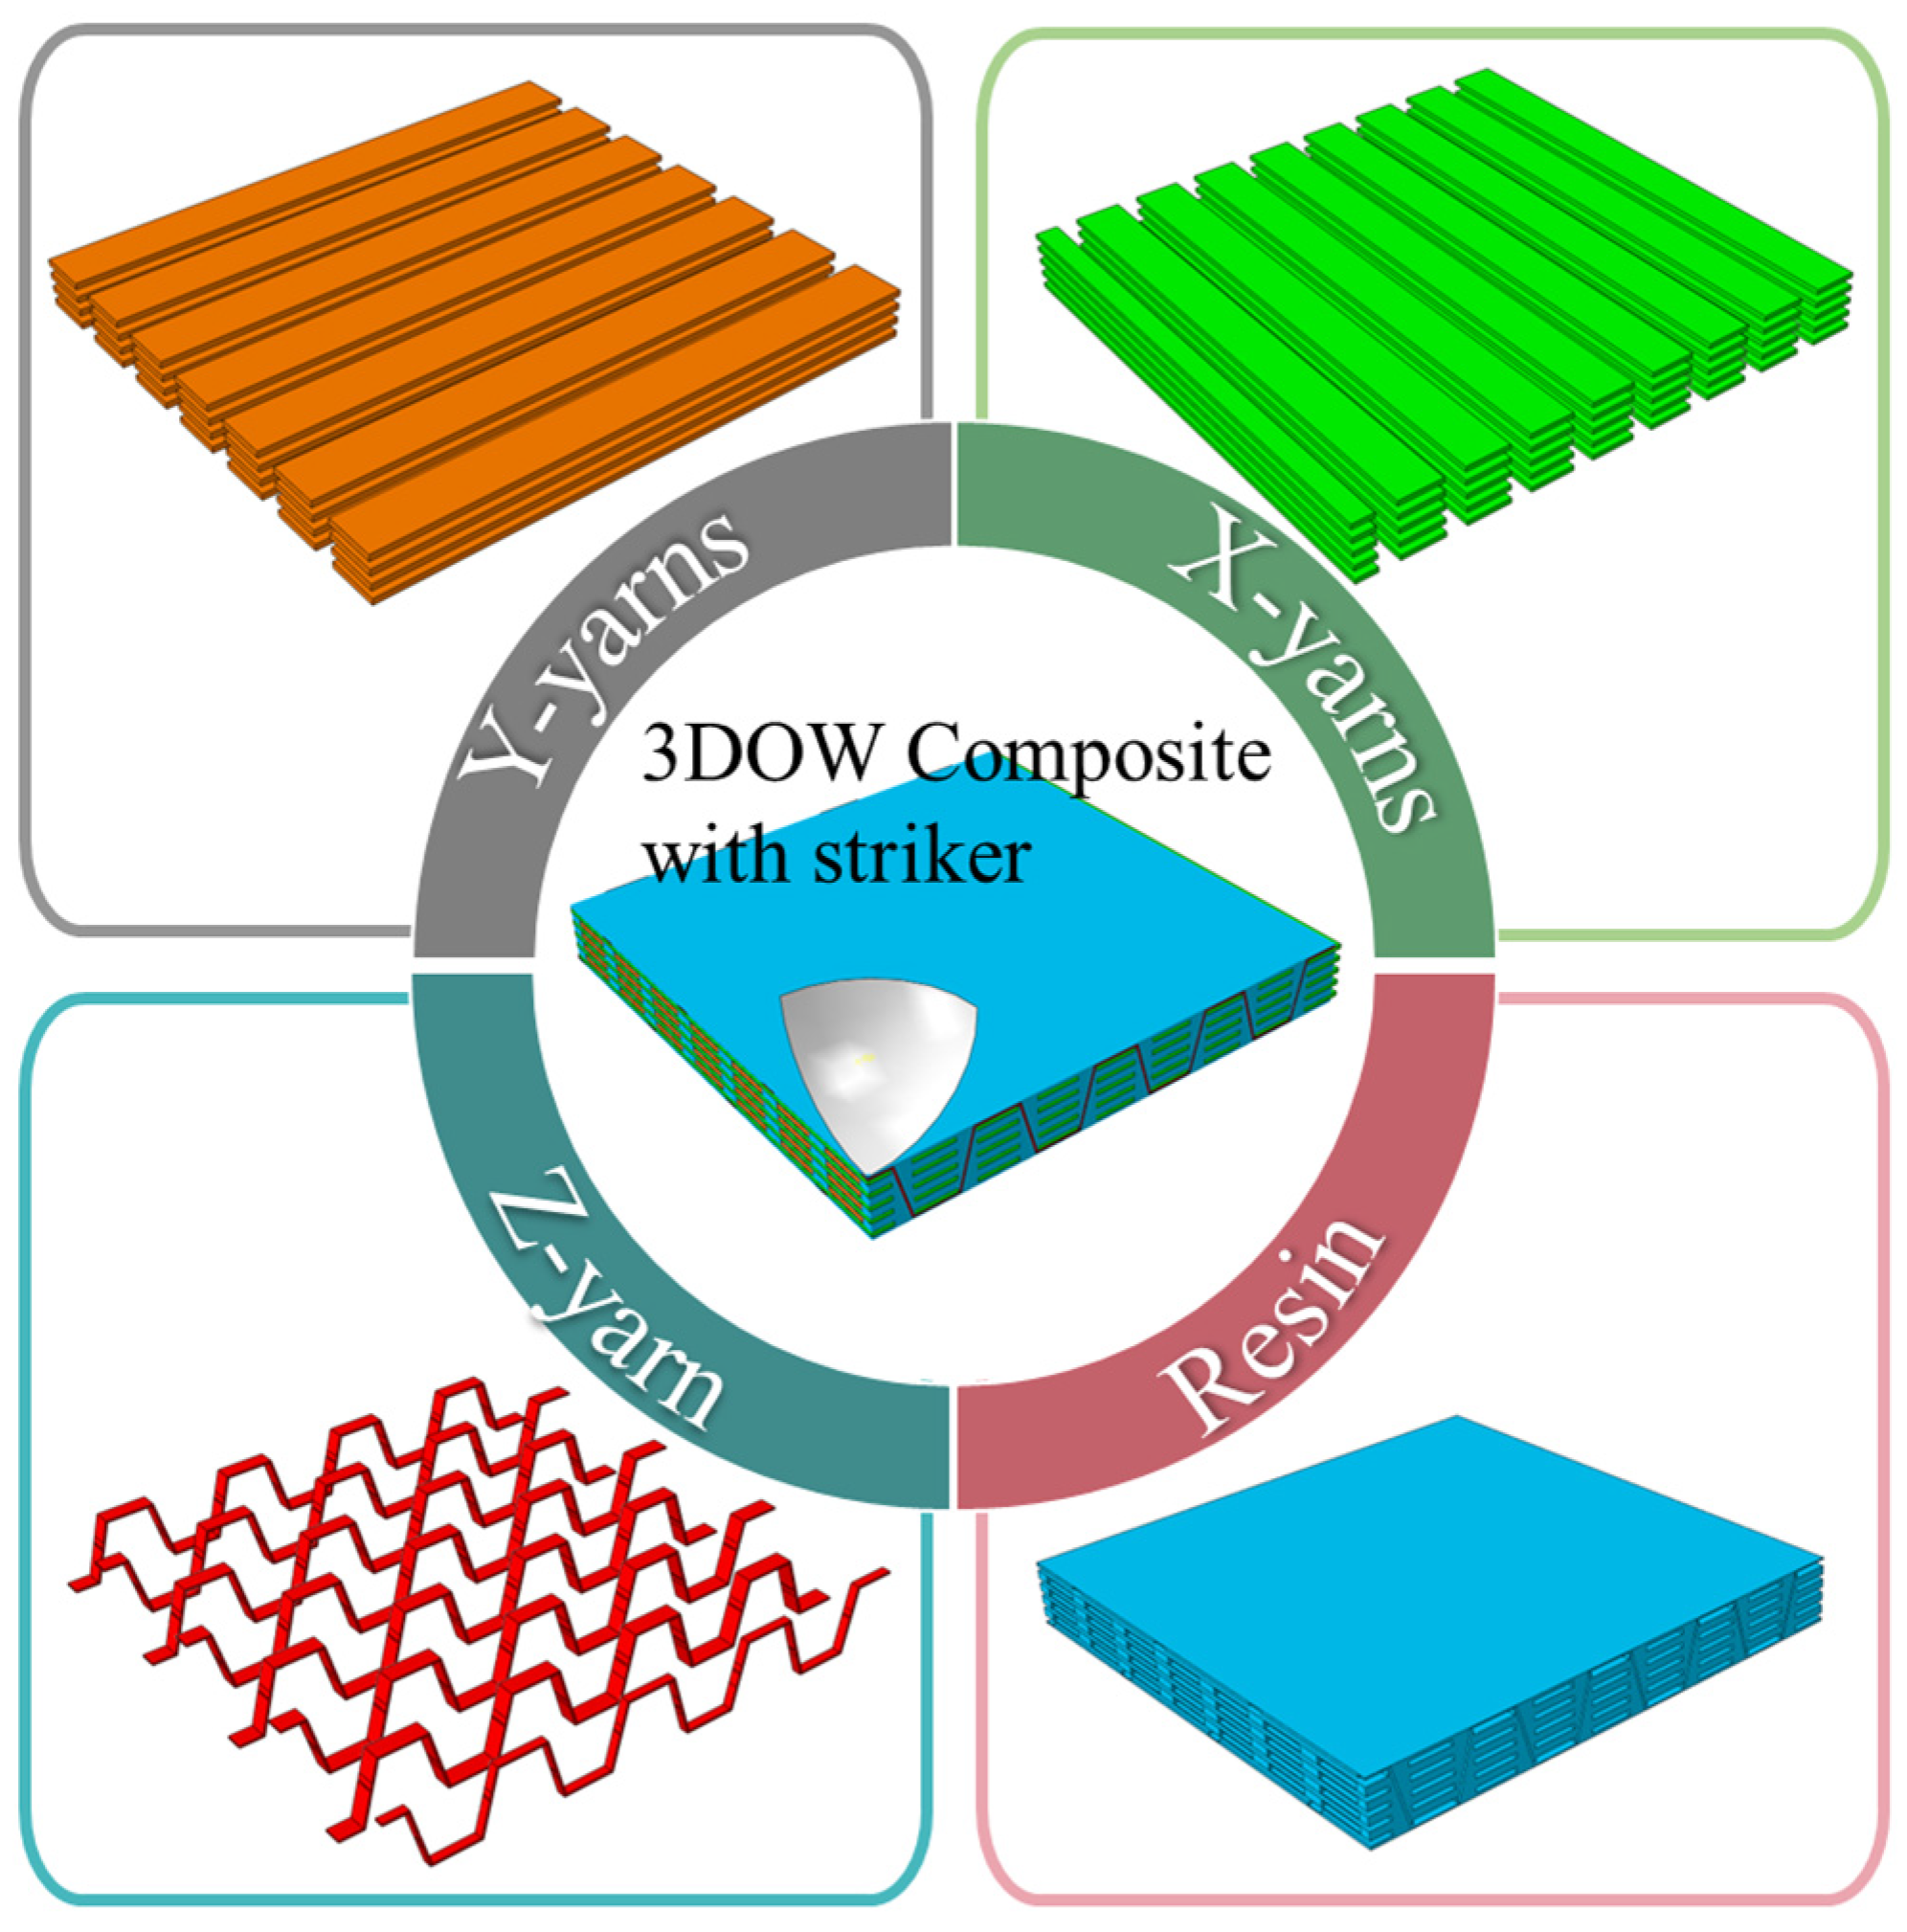
Figure 2 shows the yarn-level 3DOW geometry, which was obtained by the commercial finite element software ABAQUS. Here, the orange y-yarn, green x-yarn, and red z-yarn are integrated with a resin matrix to create the 3DOW composite model. In the composite, both y-yarn and x-yarn are considered straight, devoid of any crimp. The z-yarn path was assumed to have a W-shape, as shown in Figure 2.
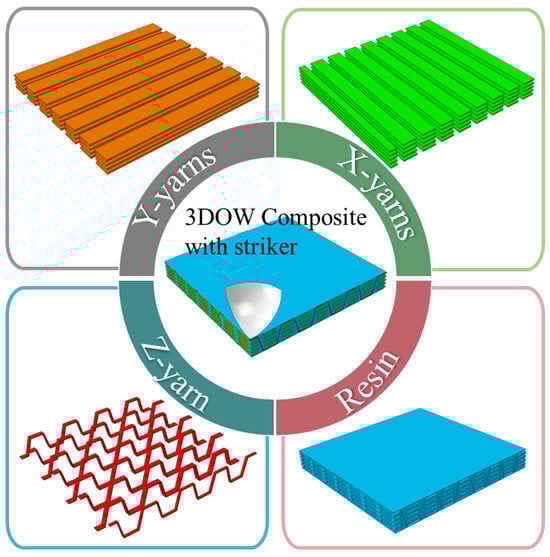
Figure 2.
Establishment of the FE model of E-glass 3D orthogonal woven composite.
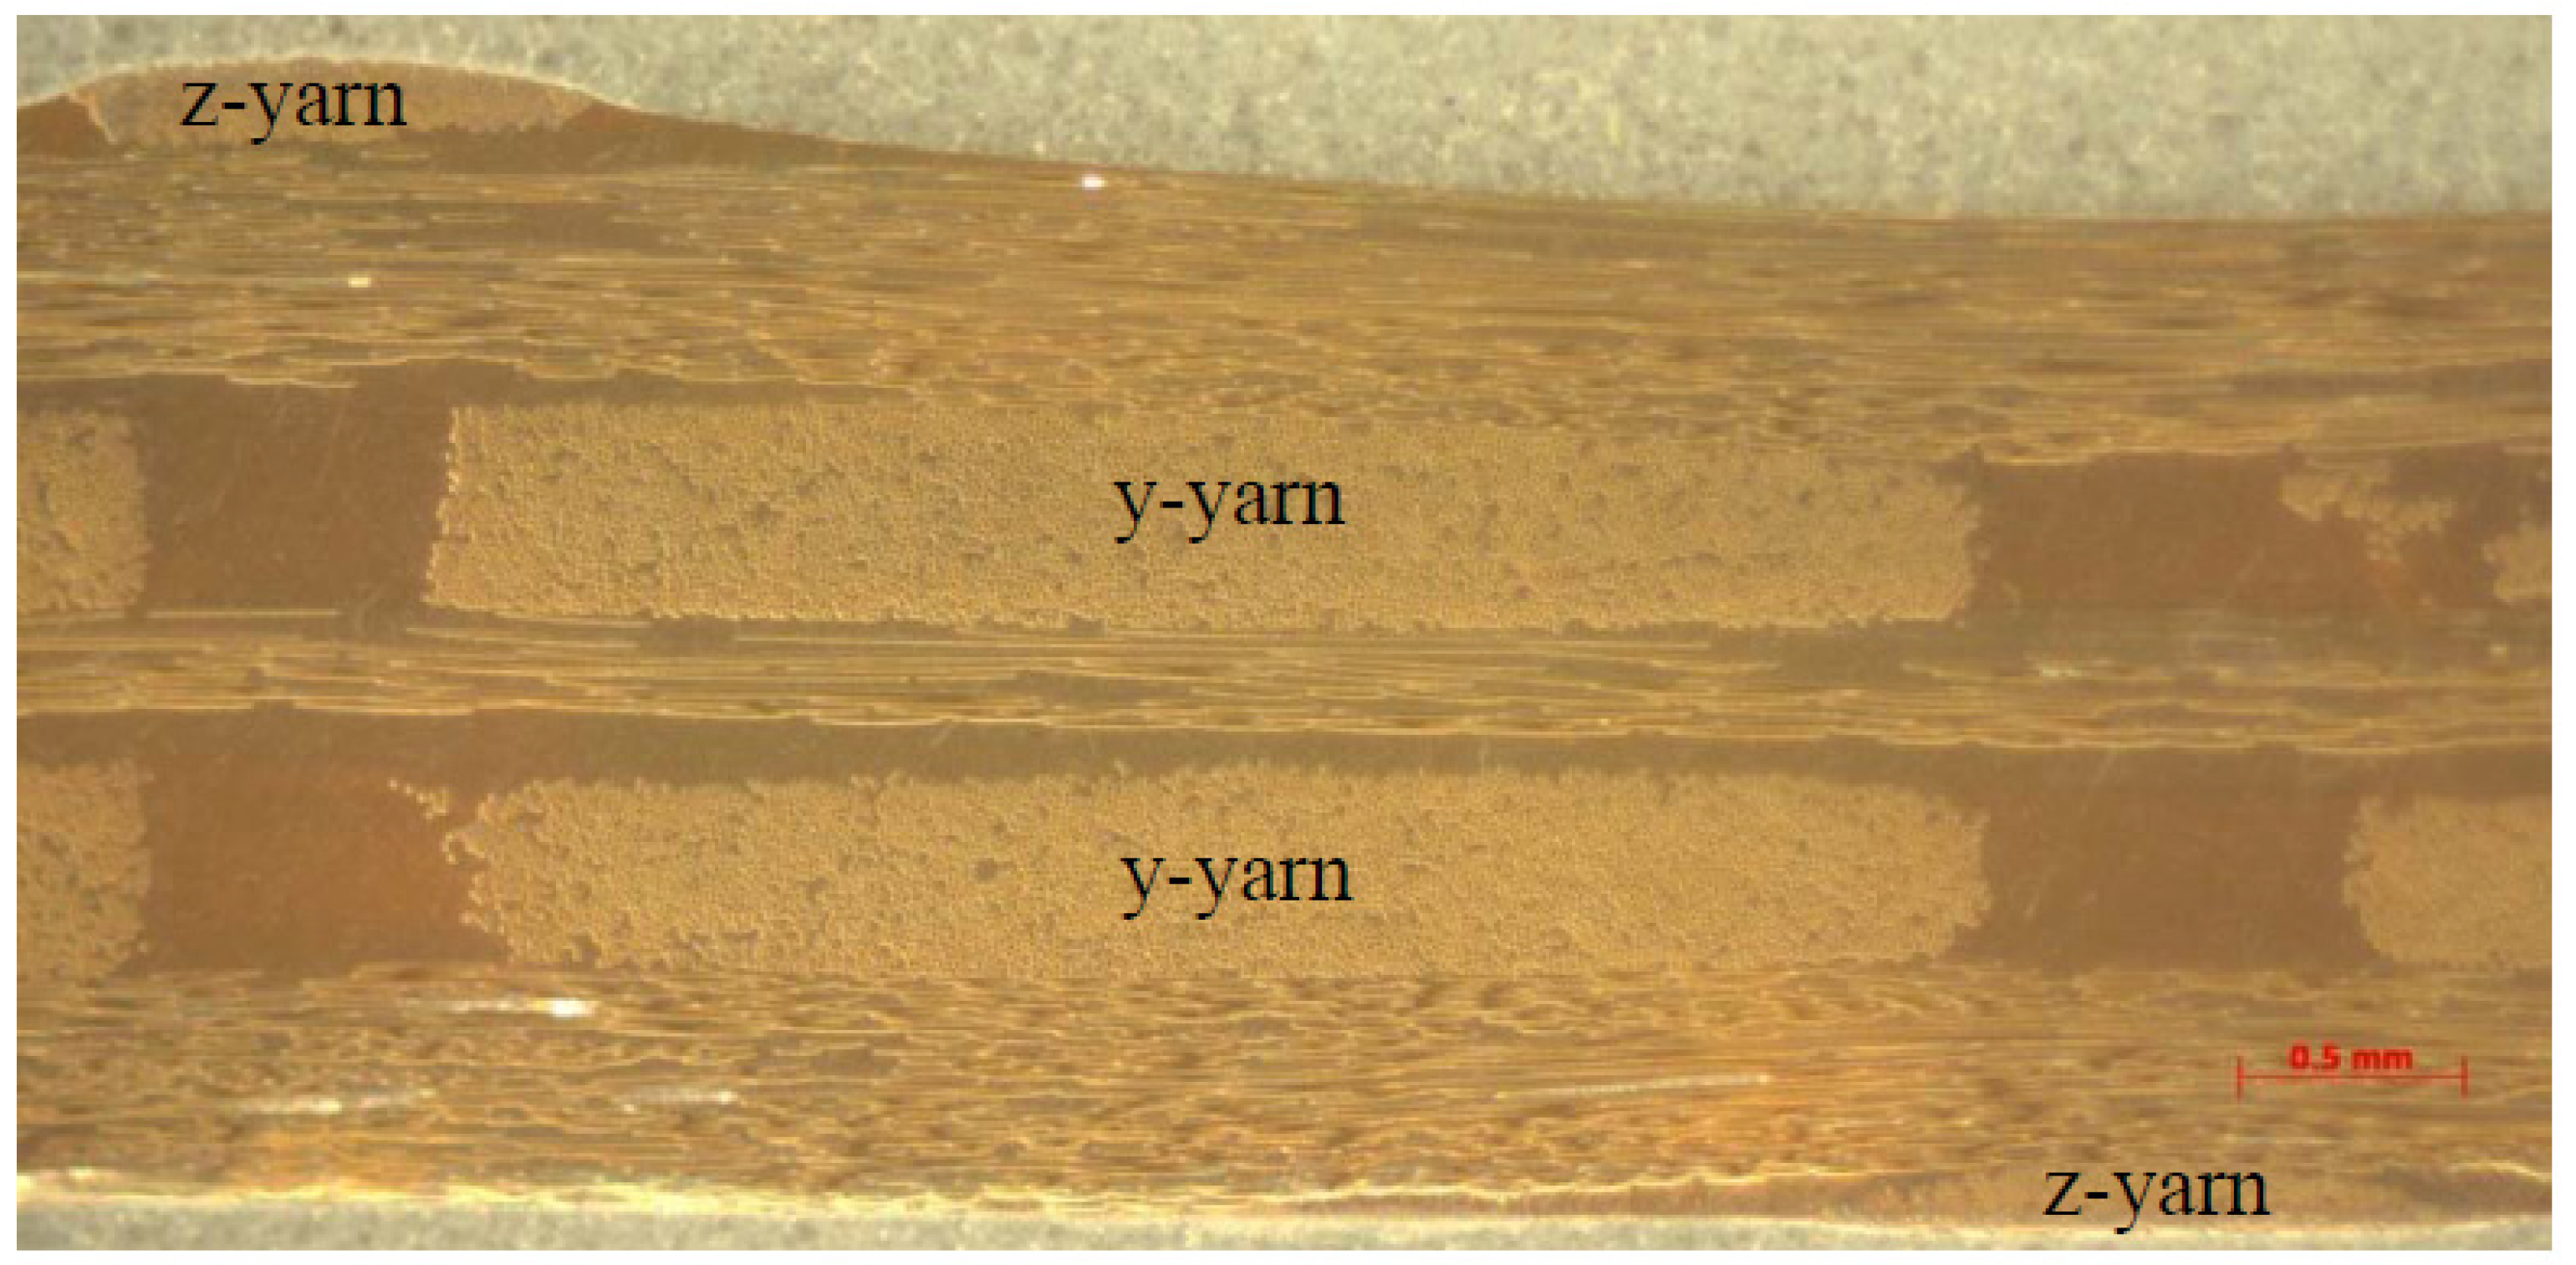
All reinforcements were assumed to have rectangular cross-sectional shapes with measured dimensions to optimize computational efficiency. Figure 3 showcases a y-yarn cross-sectional shape from a 2L487 plain weave 3DOW composite, clearly illustrating its resemblance to a rectangle, thus supporting the validity of this assumption in the modeling process. The reinforcement and resin are constrained together by a tie constraint to define the contact between them. For computational efficiency, a quarter model with symmetry in both the x- and y-directions was used. A rigid-body model of a spherical striker with a radius of 5.56 mm was placed on top of the composite model, as shown in Figure 2. The reinforcement is meshed using an eight-node solid element (C3D8R in ABAQUS), while the resin mesh combines six-node solid elements (C3D6 in ABAQUS notation) and C3D8R.
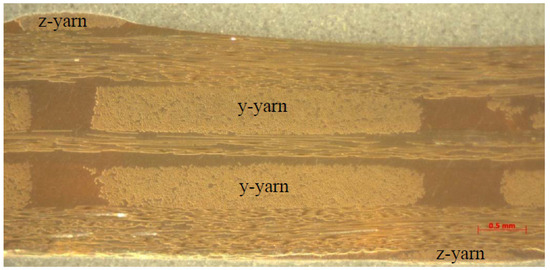
Figure 3.
Y-yarn cross sections of 2L487 plain weave 3DOW composite [36].
2.2. Damage Criterion
As the reinforcements are modeled to mimic unidirectional composites, damage algorithms from traditional laminate composites were utilized. MAT162 is a progressive composite damage model for both unidirectional and woven fabric composites based on Hashin criteria. MAT162 includes the effect of strain rate on material properties like elastic moduli, and its accuracy has been verified and validated [34,35,37,38,39]. While MAT162 encompasses six damage modes for composite materials, this study excludes the delamination mode because it is relevant only when predefined interface layers are applied. Consequently, the damage initiation criteria used in this study include fiber tension-shear, fiber compression, fiber crush through thickness, transverse compression matrix, and perpendicular shear matrix. The detailed damage initiation criteria are listed in Table 2., where subscripts 1, 2, and 3 are local element axes in longitudinal, transverse, and thickness directions, subscripts T and C represent the tension and compression, S1T and S1C are the tensile and compressive strengths in the fiber direction, S2T and S2C are the transverse tensile strengths of the corresponding tensile mode, S12 and S23 are the shear strength in direction 12 and 23, and SFS and SFC are the failure strengths against fiber shear and crush.
Table 2.
Damage criteria for UD laminate in MAT162.
A set of damage variables ϖi (i = 1, …, 5) were introduced to associate the growth extents of the damage with the stiffness losses, which can be expressed by:
where is the scalar damage functions controlling the extents of growth and qij is the damage coupling matrix for the unidirectional lamina model. is expressed by:
where mj are the material constants for softening behaviors and rj are the damage thresholds given in Equation (5), listed in Table 2. The damage coupling matrix qij for the unidirectional lamina model is presented as follows:
where i represents the 6 moduli (E1, E2, E3, G12, G23, G31), while j represents the five failure modes.
The damage algorithm was implemented in ABAQUS/Explicit using the user-defined subroutine VUMAT. Figure 4 illustrates the logic flow of the VUMAT damage model. At the beginning of each increment, the load is applied to the model, and each element is deformed following the VUMAT-defined linear elastic material. The program performs the calculation and produces the strain, while ABAQUS uses the stiffness matrix set in VUMAT to calculate the new stresses. Once the VUMAT possesses both the strain and the stress, it can determine the failure index (Fi) for each damage mode calculated based on the failure initiation equations listed in Table 2. If the failure index of the element is less than 1, it will advance to the next increment and apply a fresh load, but if it approaches 1, it will calculate the associated damage evolution factor, as shown in Figure 4. The user-defined damage propagation algorithms are then utilized to compute the associated damage factors, which are then used to degrade the corresponding stiffness matrix component. When the damage factor hits 1, the element is marked in VUMAT. If further prerequisites for element deletion are met, ABAQUS will delete the element. Otherwise, the new stresses are calculated based on the modified stiffness matrix and transferred to the following increment until the model element is eroded.
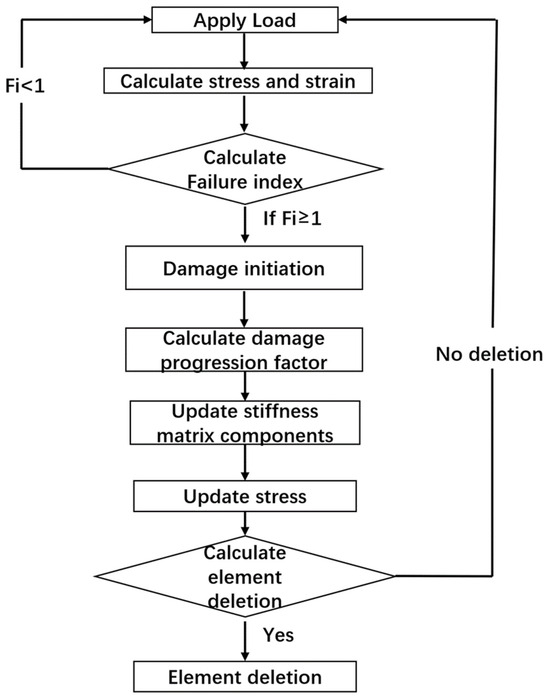
Figure 4.
The algorithm logic about the deformation, damage, failure, and deletion of the elements.
2.3. Model Set-Up and Validation
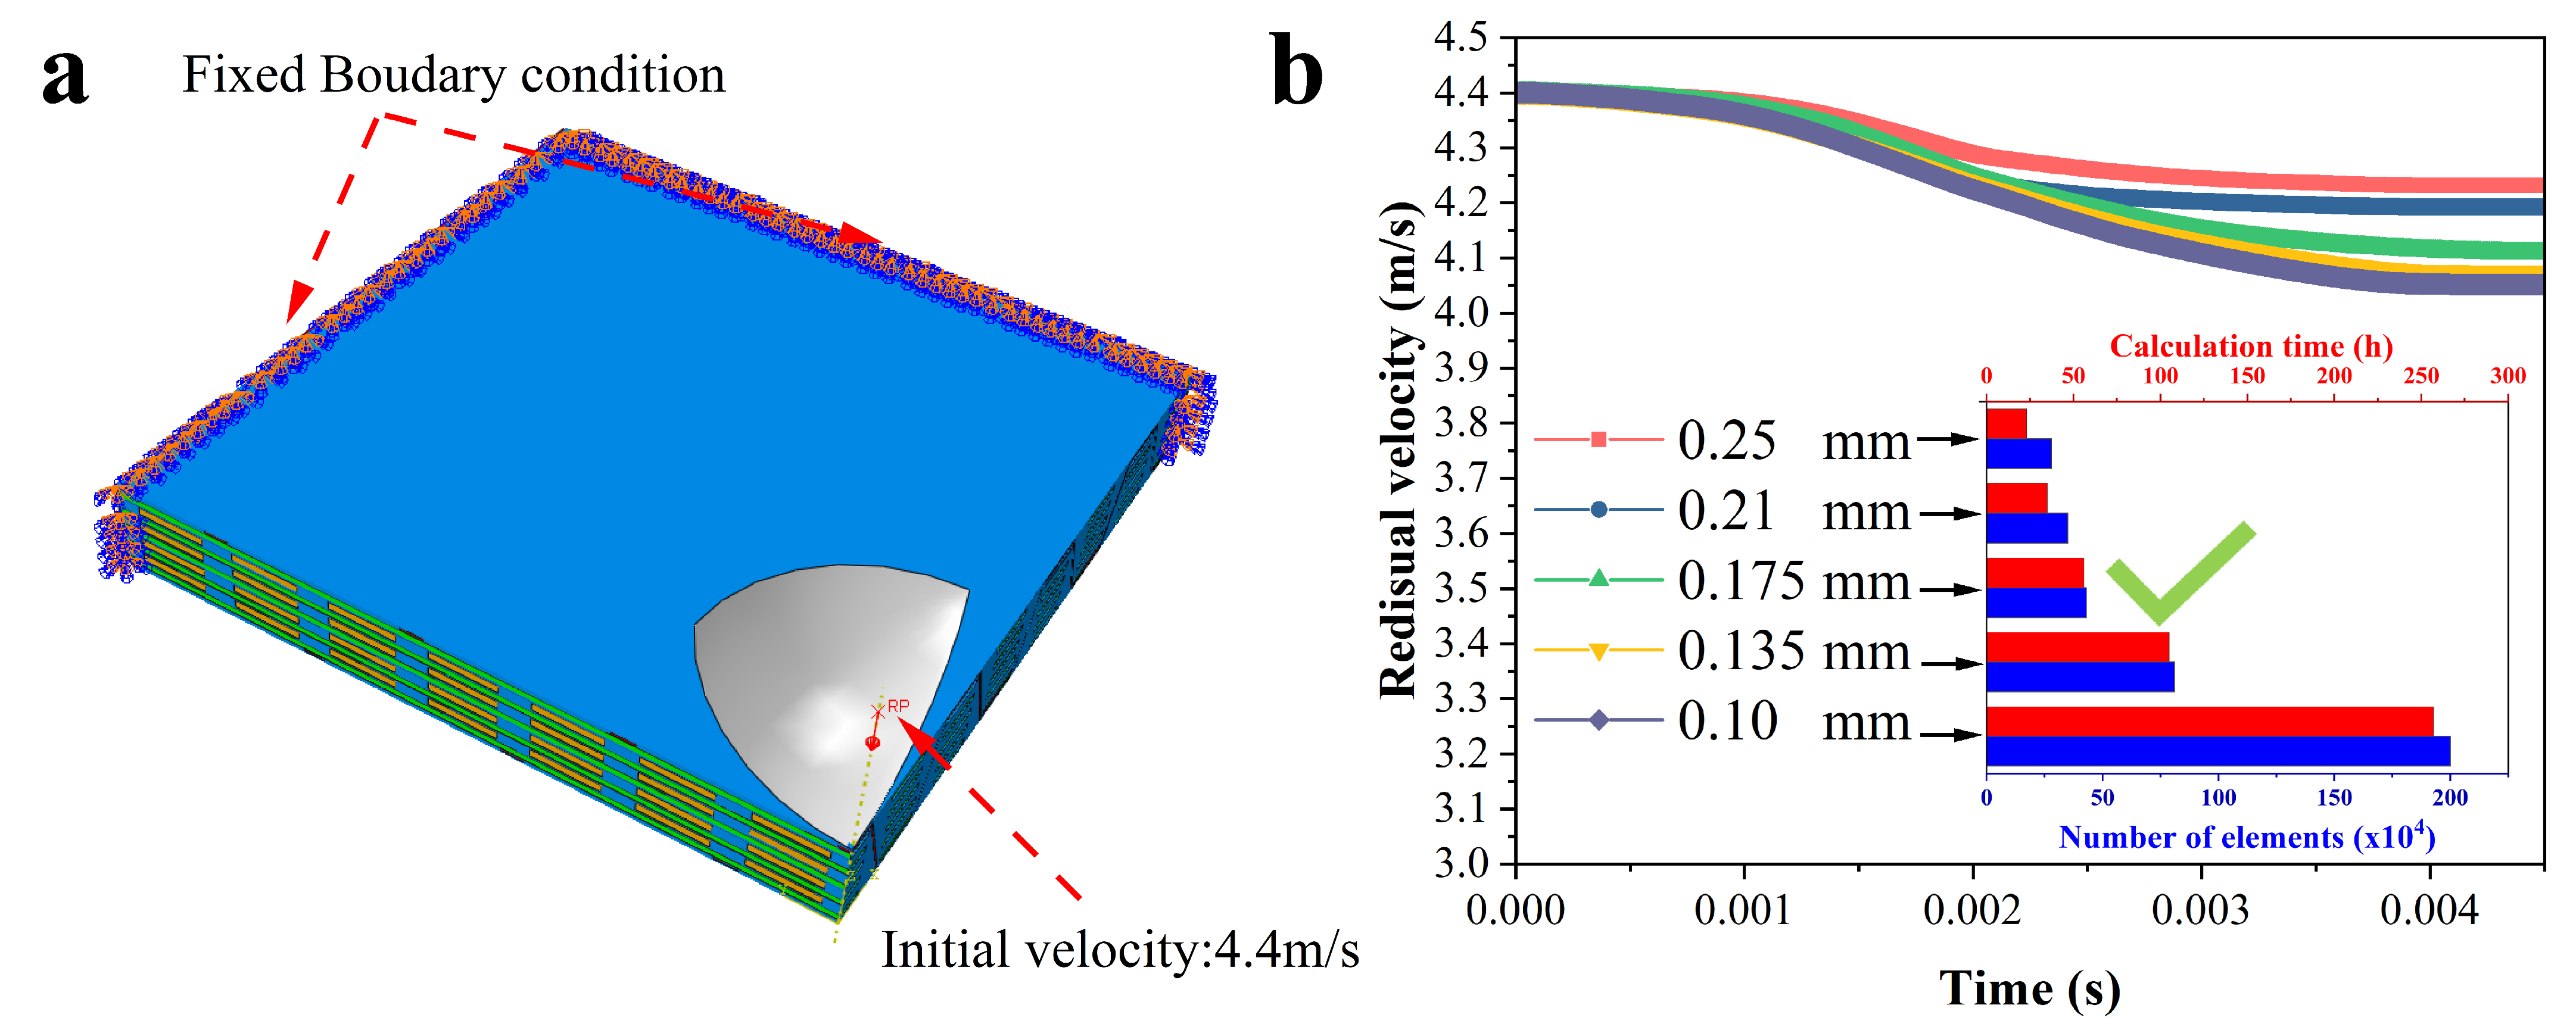
In our FE analysis conducted using ABAQUS, we meticulously detailed the boundary conditions (BCs) and initial conditions (ICs), as illustrated in Figure 5a. The model emulates the experimental setup through circumferential clamping to ensure equivalent constraint conditions. A tie constraint was applied between the reinforcements and the matrix, securing them together to eliminate any relative motion, thus replicating the integral behavior observed in physical samples. The impact energy was simulated by applying an initial velocity of 4.4 m/s to the striker, correlating to an impact energy of approximately 219 J, with the striker’s mass set at 5.66 kg.
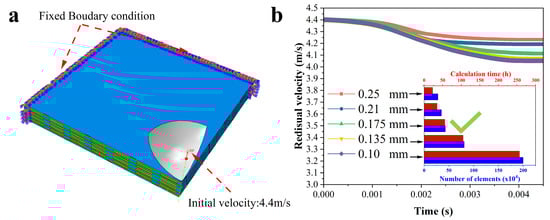
Figure 5.
Setup of FE model of E-glass 3DOW composites. (a) The boundary conditions and initial conditions; (b) study of mesh sensitivity.
Mesh sensitivity analysis was performed to determine the most efficient mesh configuration for our model, balancing accuracy with computational resource requirements. The analysis led to a reduction in the number of elements from approximately two million in the finest mesh to 281,972 in the coarsest configuration, with corresponding calculation times extending from 23 to 257 h. The selected mesh, featuring an element size of 0.175 mm utilizing C3D8R and C3D6 elements, represents the optimal compromise for this study. This decision, as well as further methodological details, are expounded in Figure 5b, optimizing the balance between computational efficiency and accuracy.
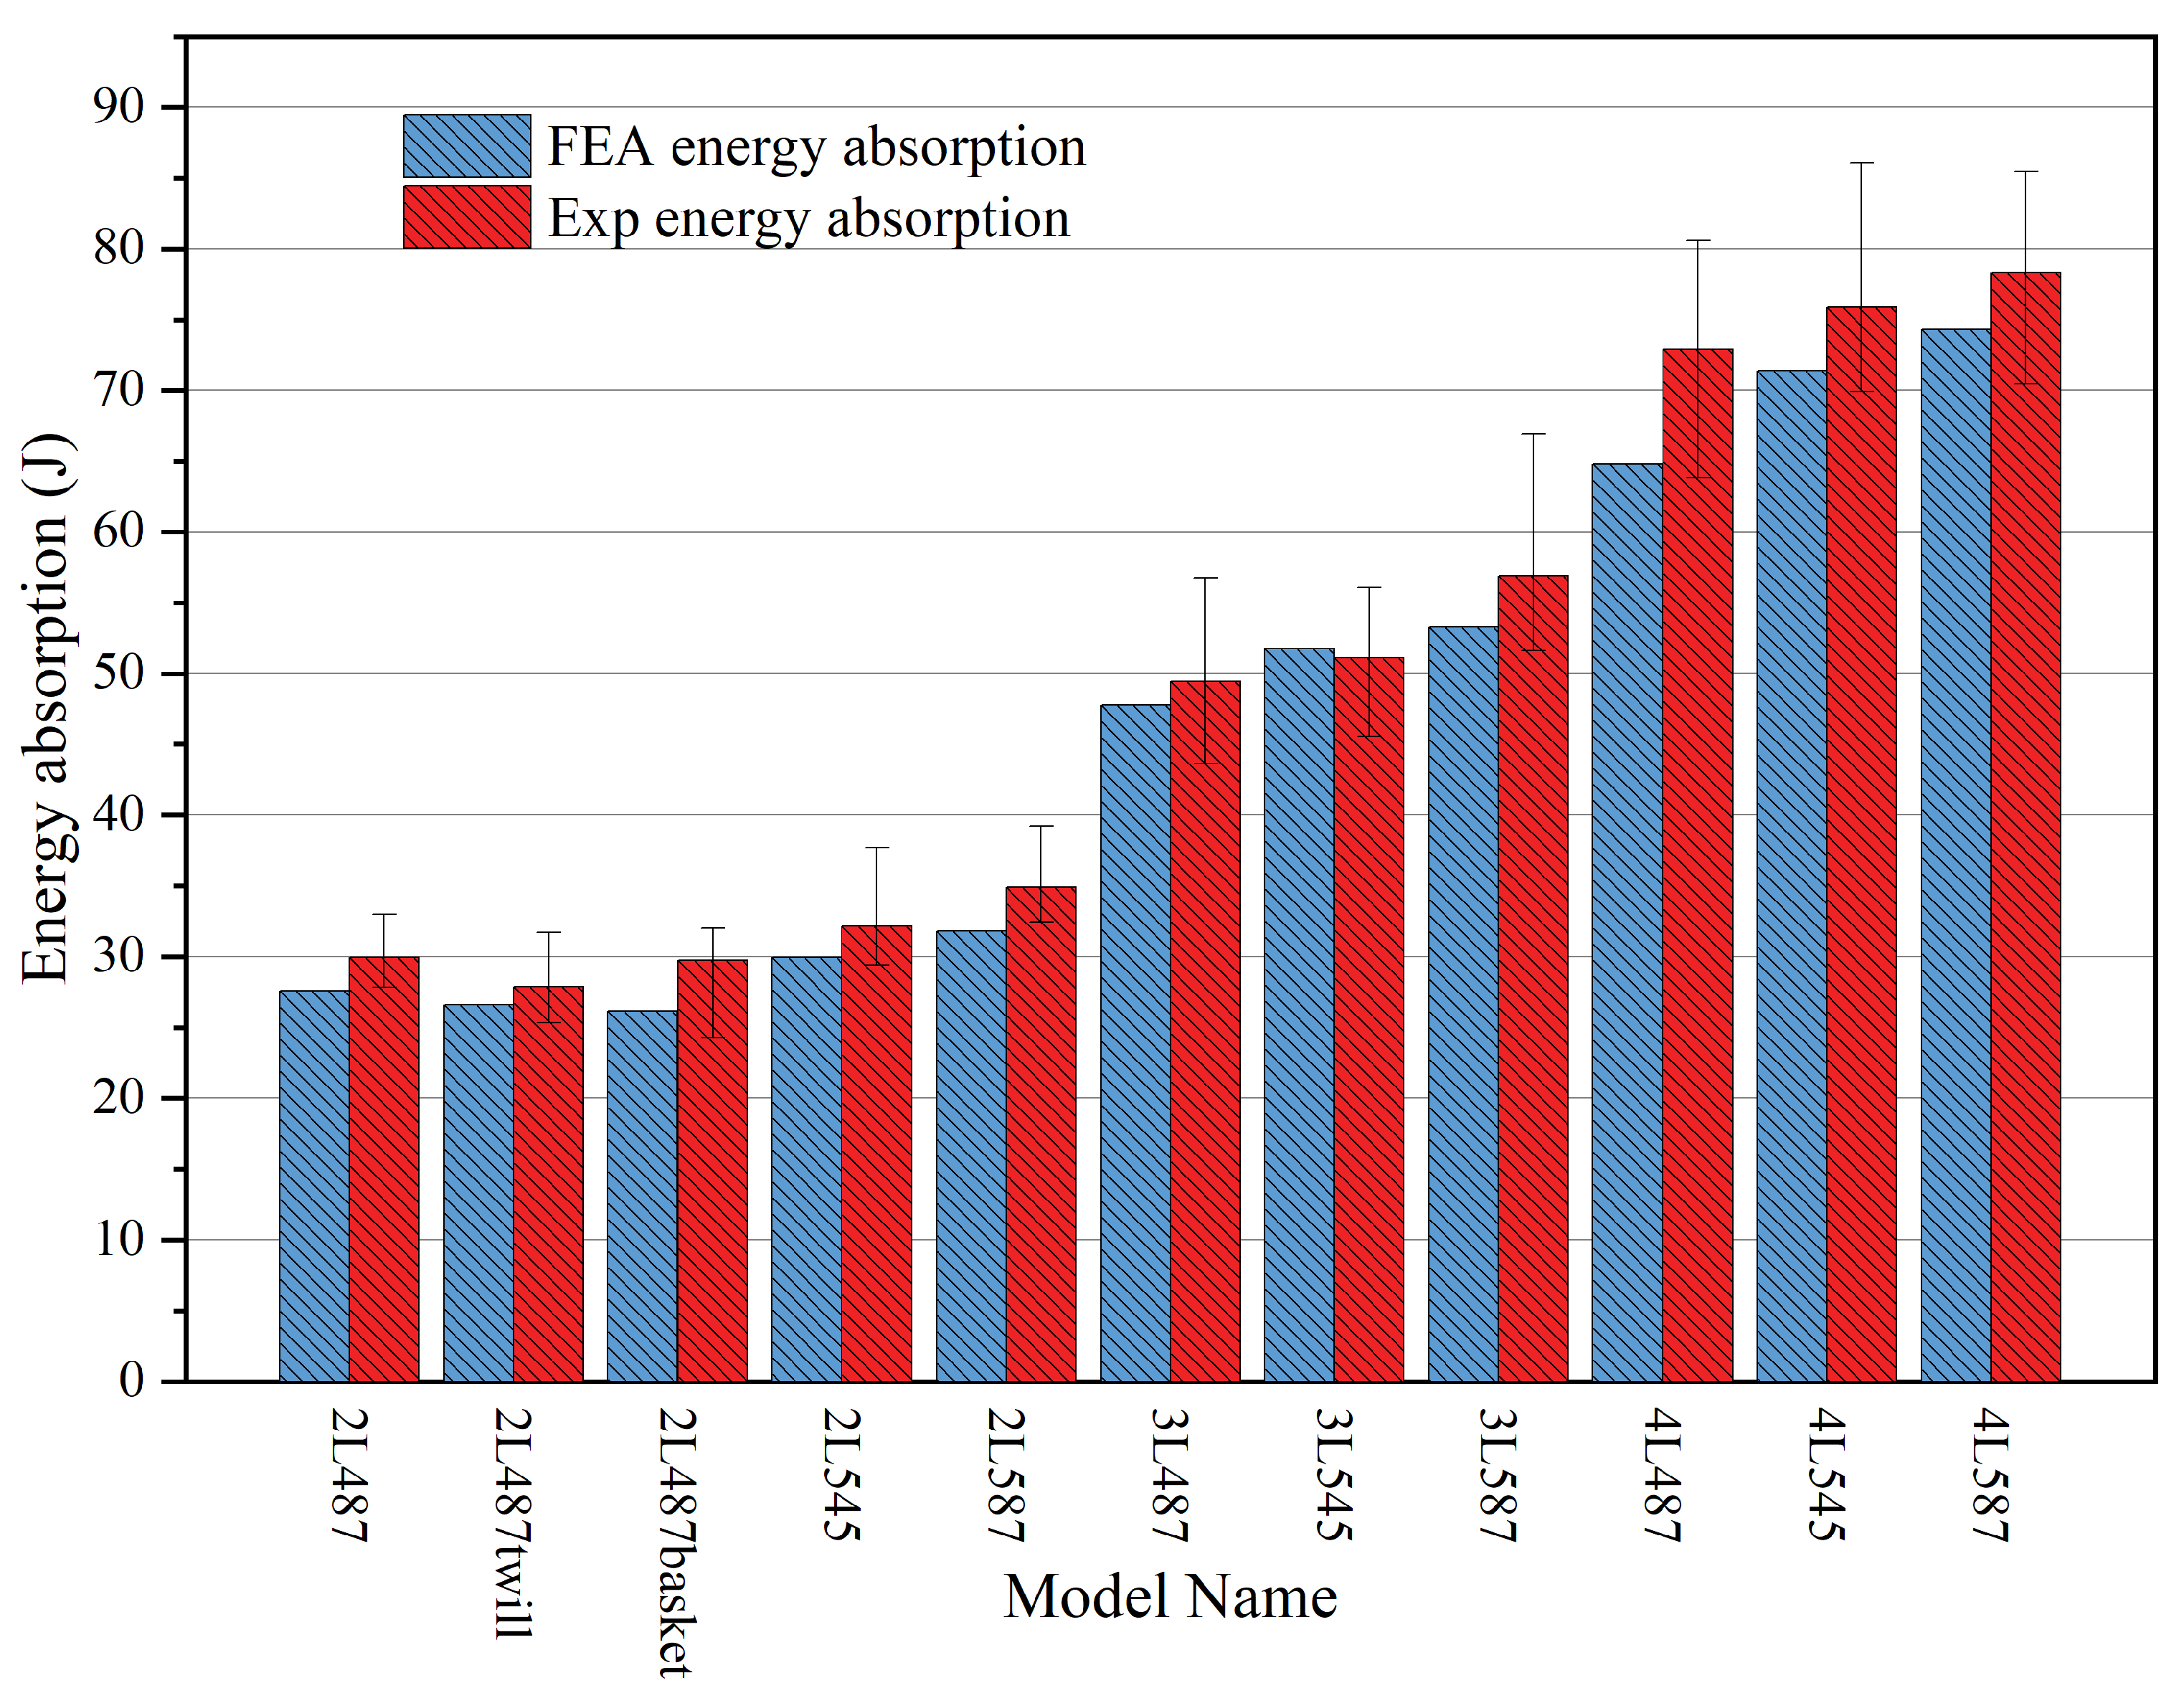
Model validation involved comparing experimental results with FEA predictions regarding energy absorption. In the tup-impact tests conducted by Midani [22], while the test velocity was fixed at 4.4 m/s, actual velocities ranged between 4.36 to 4.45 m/s. The test provides the total energy absorptions, which are then applied by averaging the findings of six to eleven impacts on each structure. In the FEA analysis, the impact velocity is set to 4.4 m/s. Figure 6 compares the total energy absorption predicted by FE models employing the MAT162 damage algorithm to the experimental values. The energy absorption predicted by simulation corresponds well with experimental findings. The majority of FE findings are within the error bar range of experimental results, with only a few falling significantly below the lowest errors, as demonstrated in Figure 6. Moreover, it is evident that the predicted findings are lower than the experimental data, with the exception of 3L487.
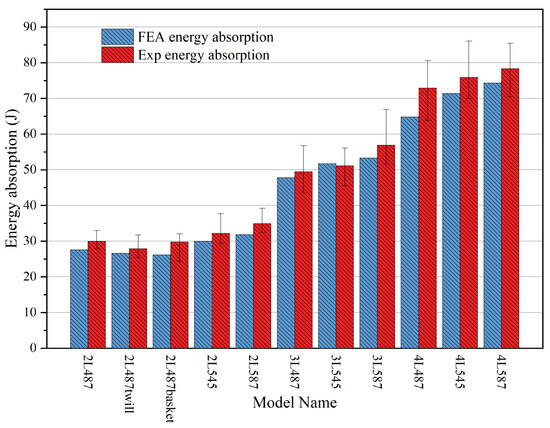
Figure 6.
Comparison of energy absorption from simulation and experiment of 3DOW woven composites.
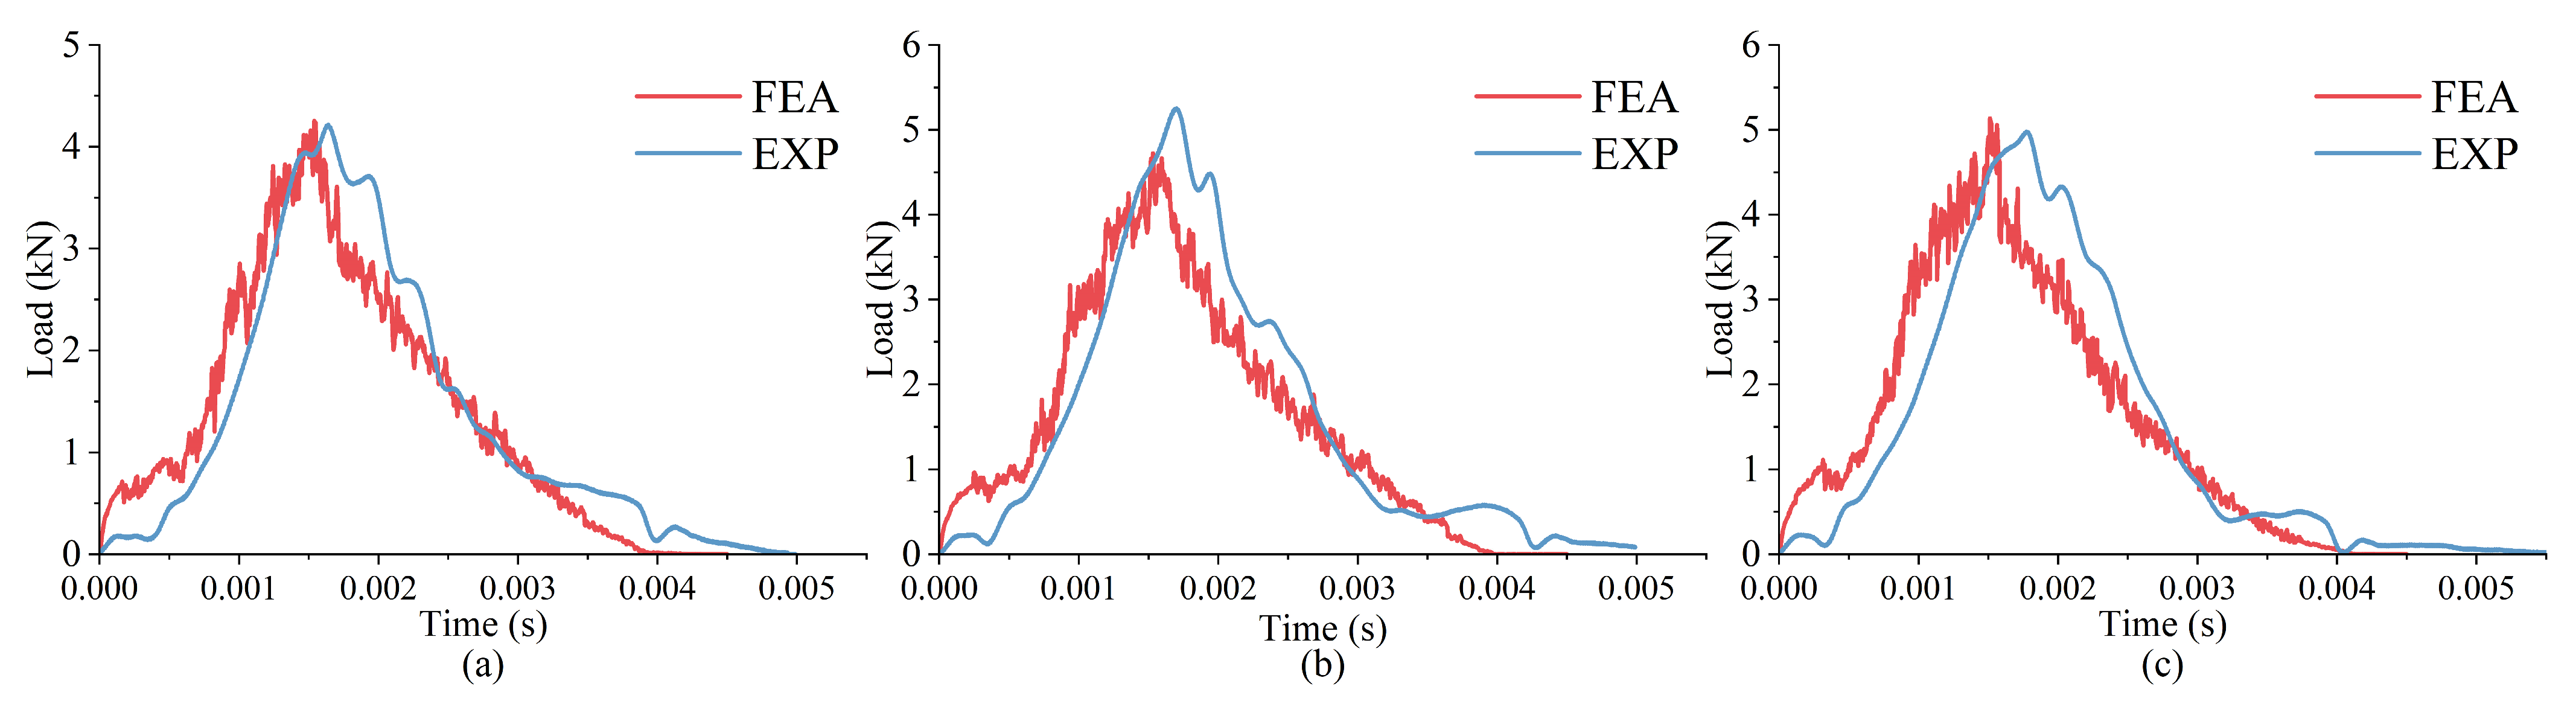
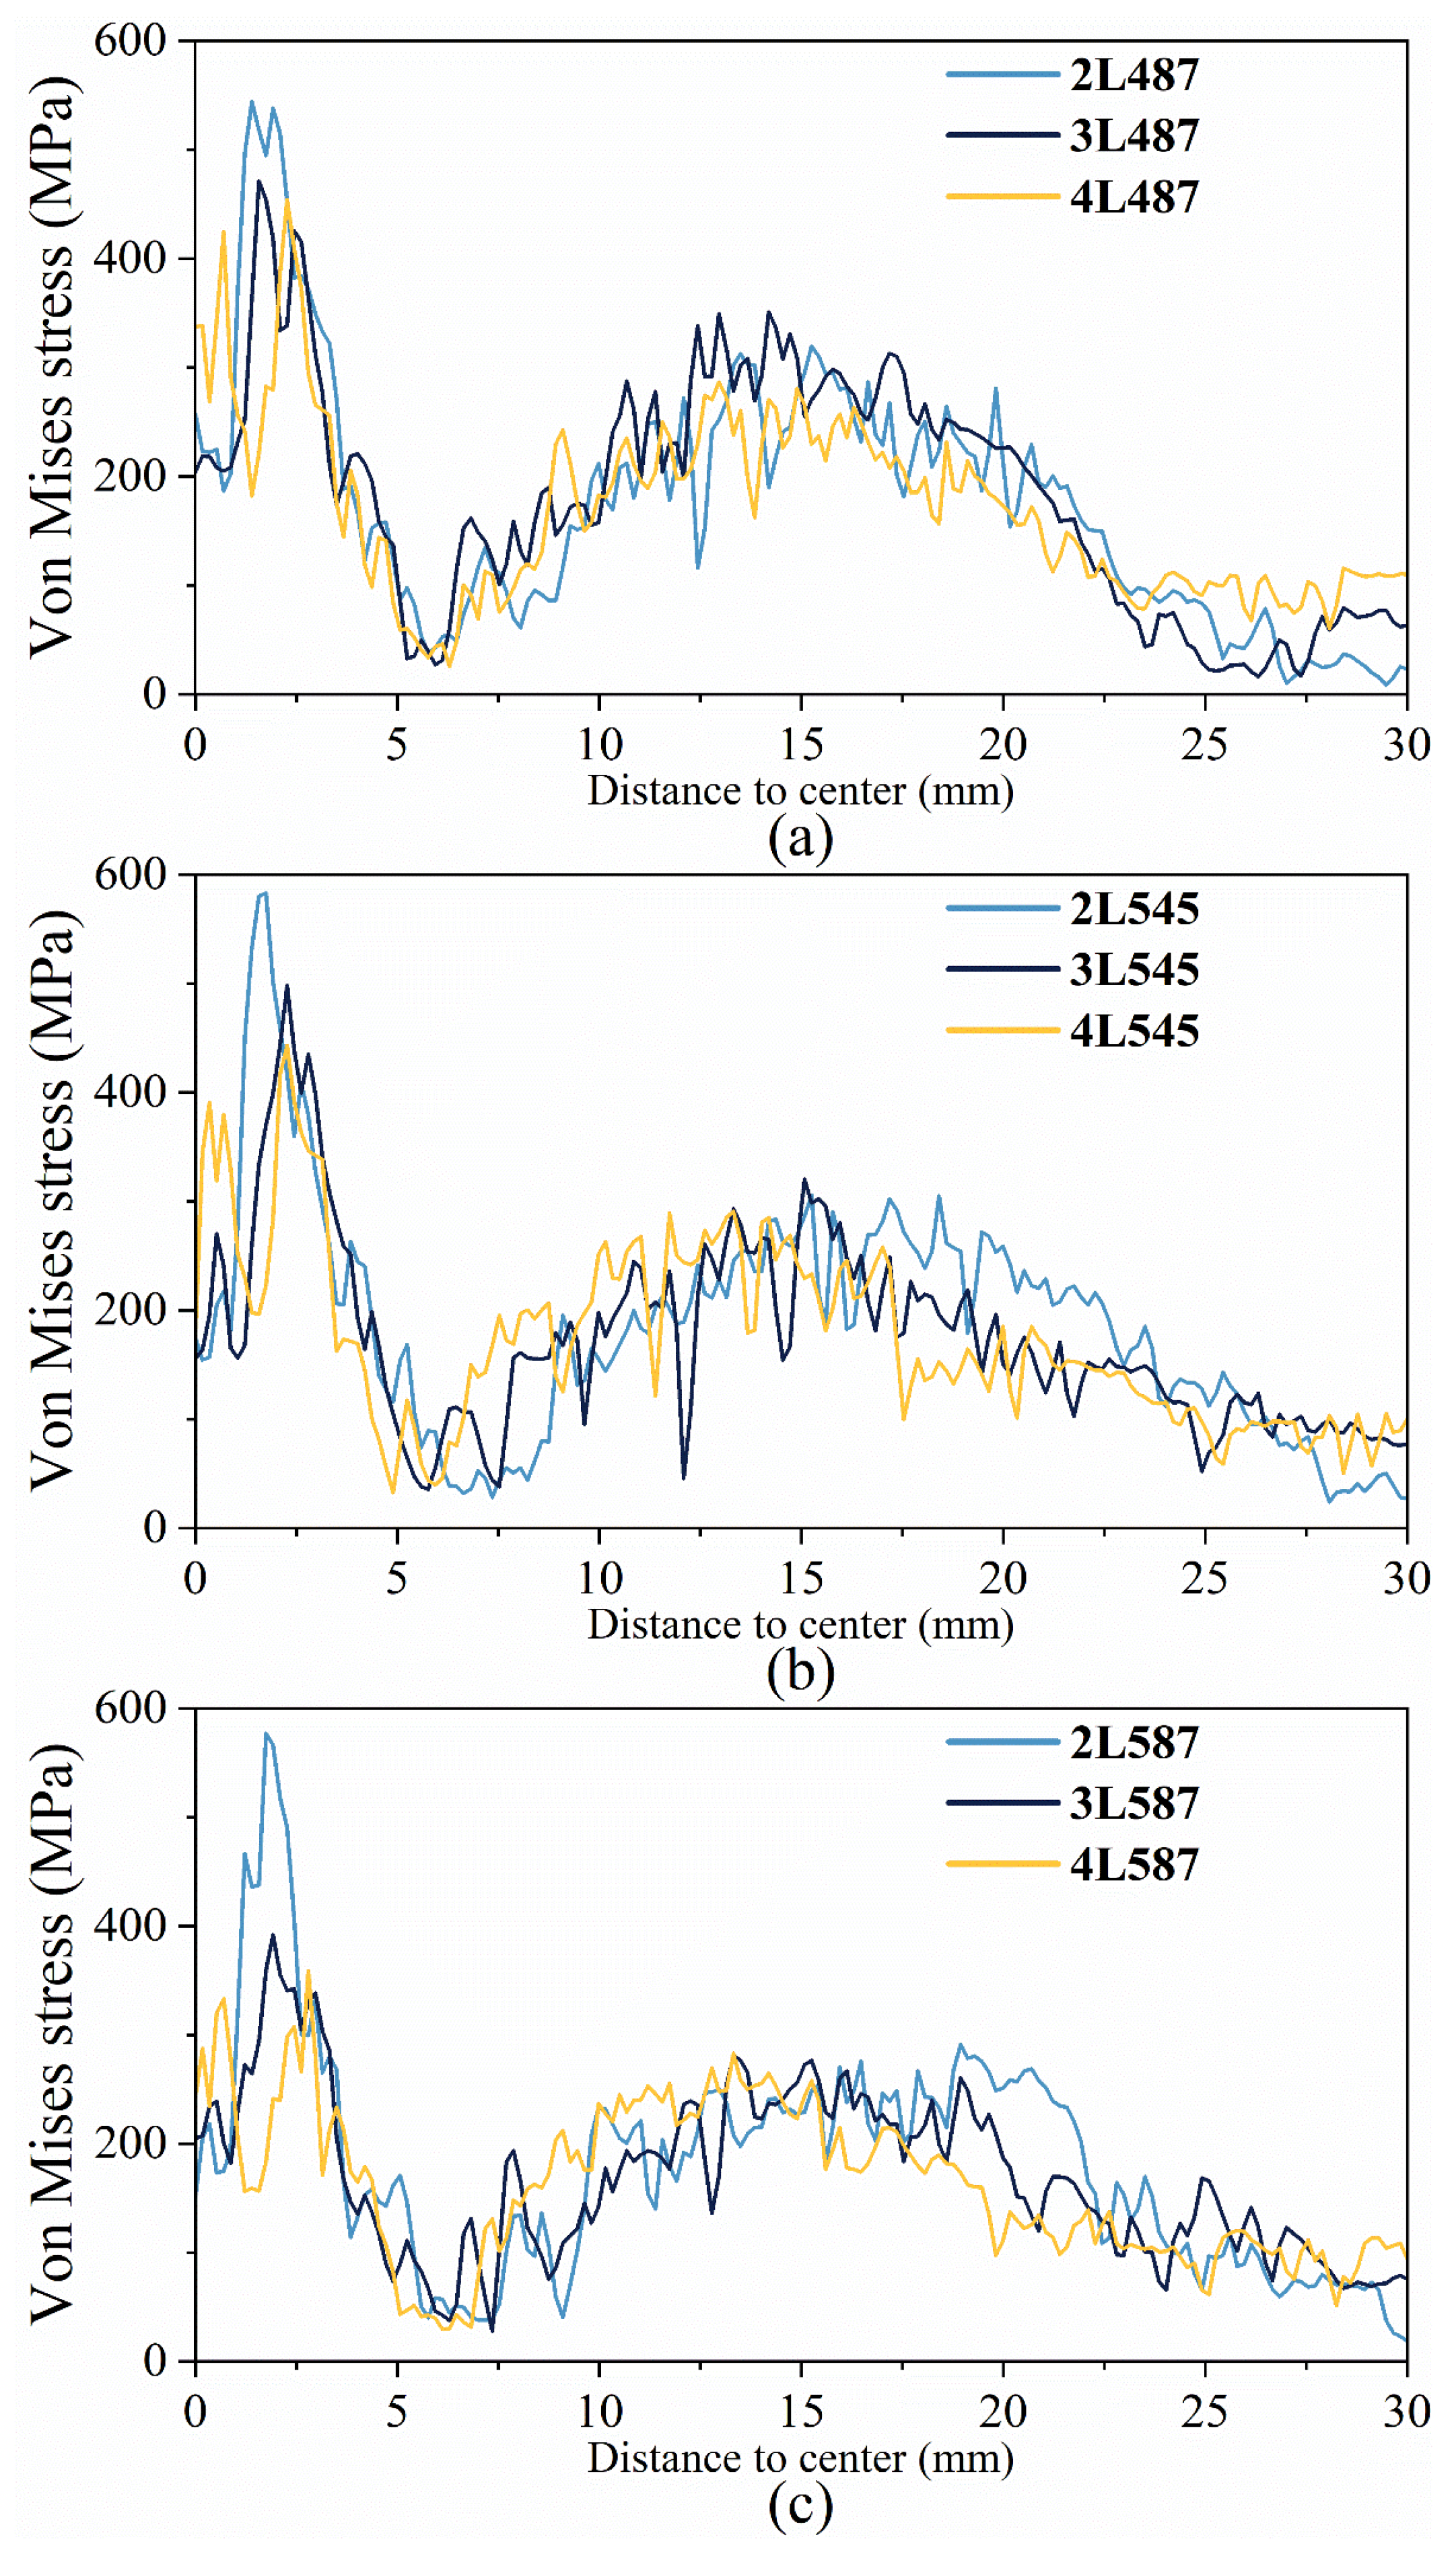
Figure 7 presents a comparison between FE model simulations and experimental load-time curves for three 2-layer 3DOW configurations. The simulation for 2L487P initially predicts a higher load than observed experimentally, reaching a slightly Increased peak before following a smooth decline, contrasting with the experimental curve’s rebound and subsequent drop. Similar trends are observed in the other configurations, with 2L545P’s peak notably lower in simulation than in the experiment. This detailed comparison underscores the overall accuracy of the FE models in replicating the load-time response of 3DOW composites under impact, despite certain discrepancies in post-peak behaviors.
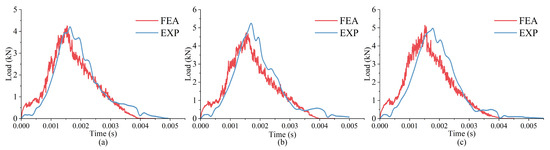
Figure 7.
Experimental and numerical load-time curve comparison for (a) 2L487, (b) 2L545, and (c) 2L587.
For comparison, Table 3 displays the normalized energy absorption of simulations and tests by thickness, total areal density, and preform area density. Except for 2L545P and 2L587, where the experimental tests show often a greater energy-to-thickness ratio than numerical models, the agreement remains strong across other configurations. The model with the largest discrepancy is 4L487P at 15.16%, and the model with the smallest discrepancy is 3L487P at 1.29%. In terms of energy absorption normalized by areal density, most numerical results underpredict compared to experimental findings, with significant differences noted in 2L487twill and 2L487basket at 12.07% and 15.49%, respectively. However, when normalized by preform areal density, the experimental and numerical energy absorptions closely align, reinforcing the validity of our FE analyses. This detailed comparison underscores the overall alignment of normalized energy absorption from FE analyses with experimental results, thereby confirming the close correspondence between simulated and experimental observations in energy absorption metrics. Table 4 shows the damage initiation and panel failure time for 2-, 3- and 4-layer models and these moments will be used in the next section for comparisons.
Table 3.
Comparison of normalized numerical and experimental energy absorption.
Table 4.
Moment for reinforcement damage initiation and failure under low-velocity impact.
3. Results and Discussions
3.1. Effect of X-Yarn Density
3.1.1. Effect of X-Yarn Density on Stress Distribution in the Reinforcement
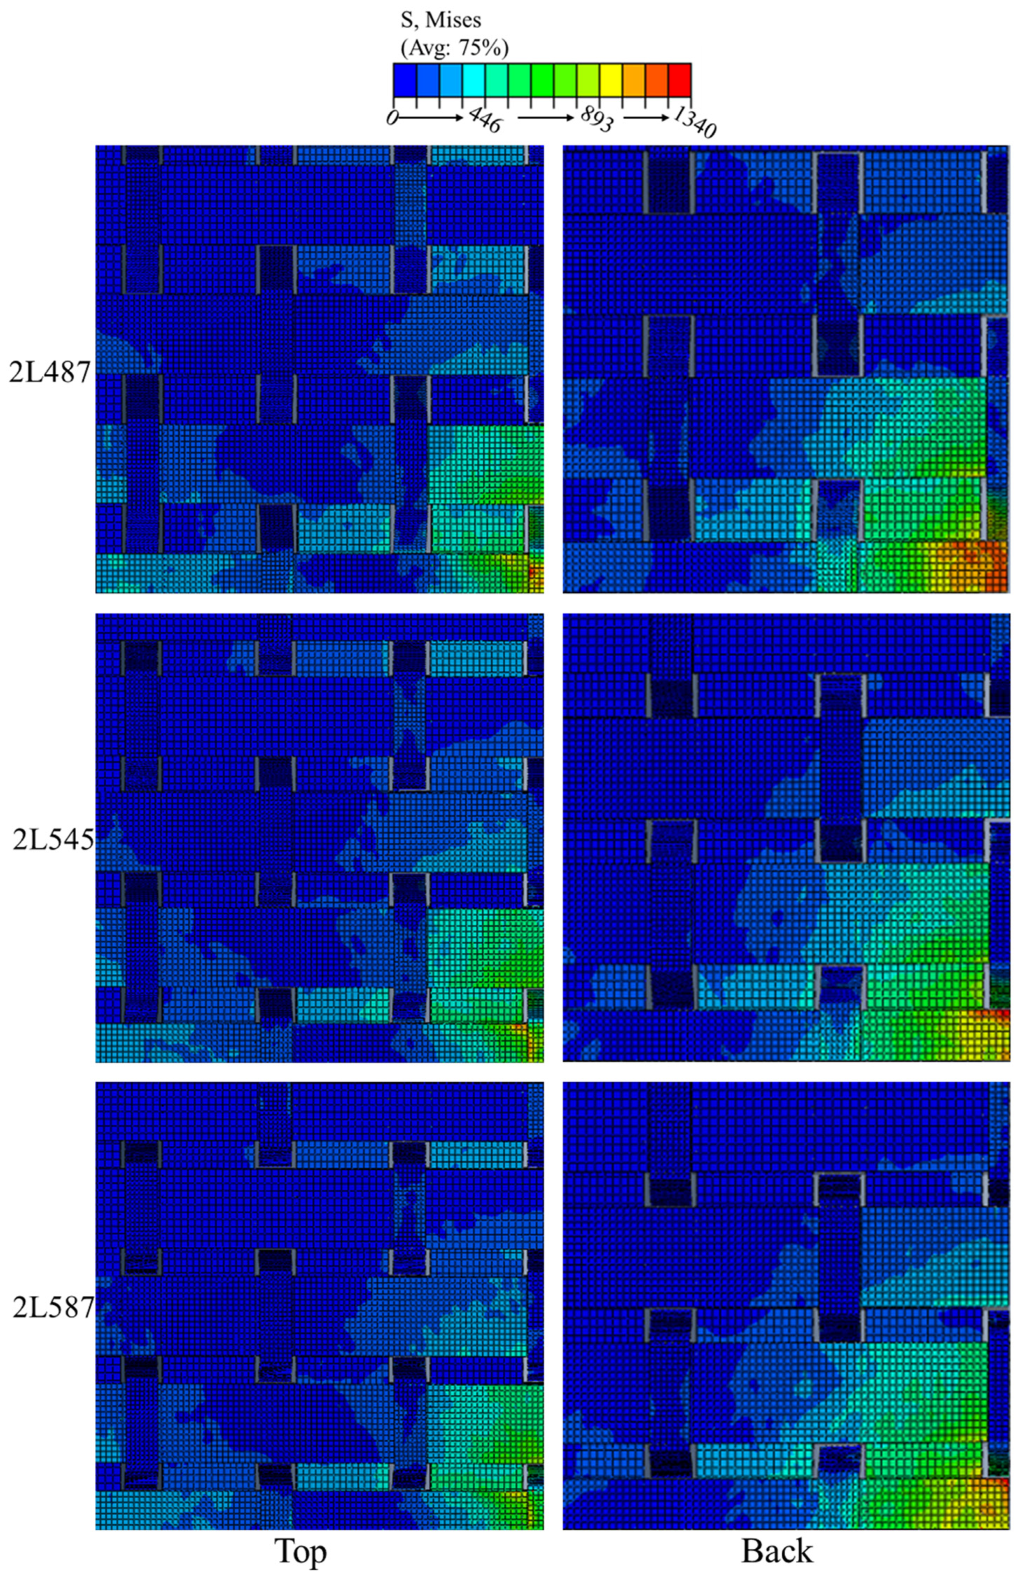
During low-velocity impact, changes in x-yarn density greatly influence how stress is dissipated within the reinforcement. 2-layer 3DOW models with varied x-yarn densities are shown in Figure 8, with y- and z-yarns are along the y-axis and x-yarns along the x-direction. It is evident that as the x-yarn density increases, the areas of stress concentration (marked in yellow and red) decrease. As depicted in Figure 8, this trend is especially noticeable at the bottom of the composite, where 2L487 displays a significantly larger high-stress area than 2L545. Additionally, the stress region in the third x-yarn from the impact center broadens with increasing x-yarn density. It is worth noting that changing from 5.45 to 5.87 picks/cm/layer doesn’t drastically change the size of the high-stress region. However, there is a noticeable decrease in stress magnitudes in the back of 2L545 and 2L587, as shown in Figure 8.
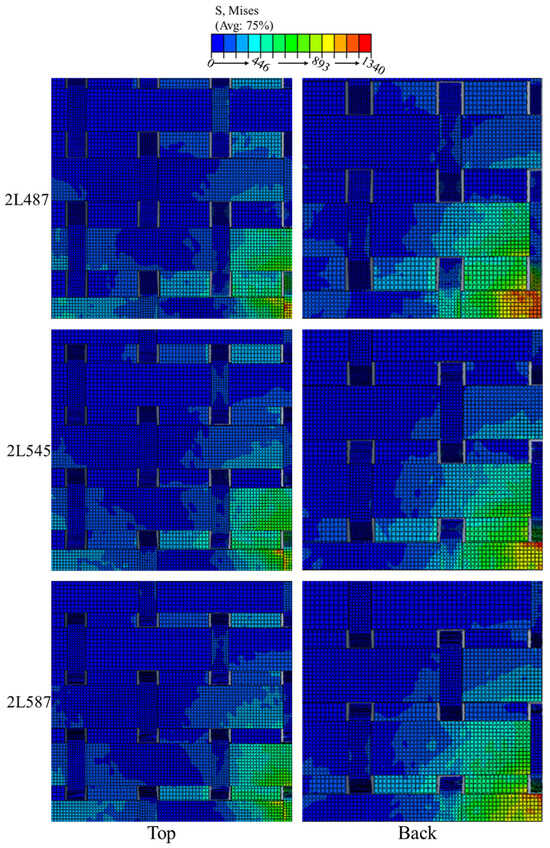
Figure 8.
Stress dissipation at the top and back of 2-layer 3DOW with different x-yarn densities. (y and z-yarn along the y-axis, and x-yarn along the x-axis).
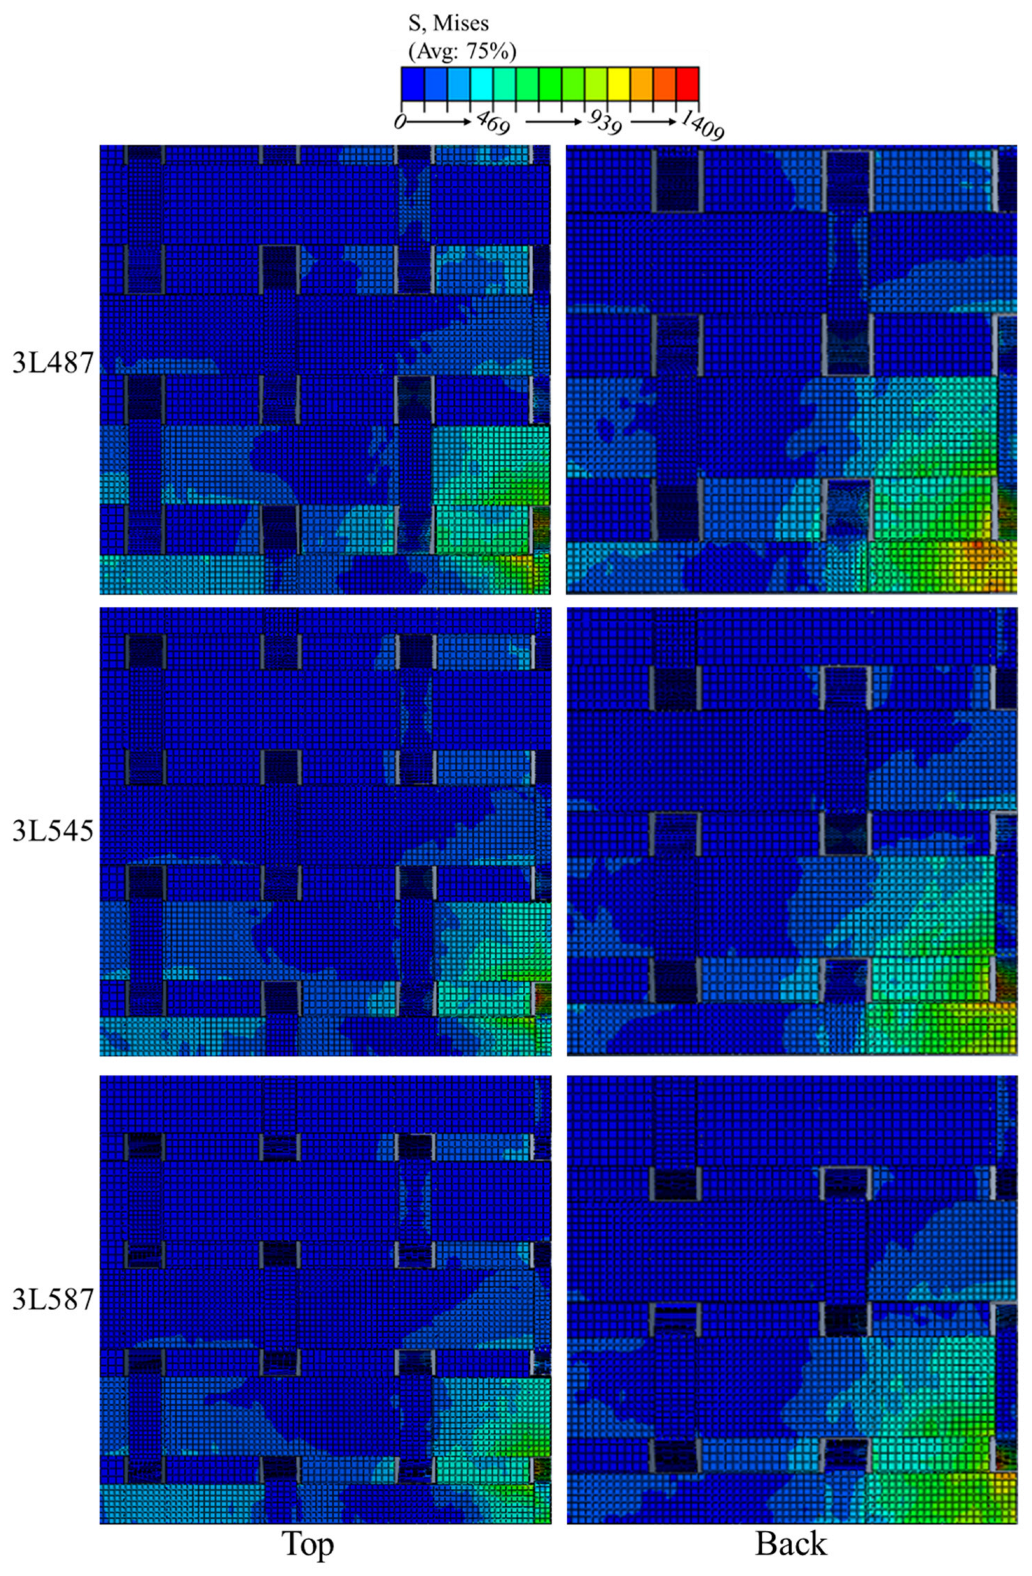
Figure 9 presents the stress distribution in three-layer 3DOW composite models with different x-yarn densities. Similar to the two-layer 3DOW, a increase in x-yarn density is associated with a decrease in high-stress areas for a specific time point. Specifically, the three-layer model, 3L487, exhibits a more expansive high-stress region at its back compared to the 3L545 and 3L587 models, as depicted in Figure 9. The central x-yarn of 3L487 reveals increased stress zones, in contrast to 3L545 and 3L587, which show only minor stress areas, as denoted by the yellow and orange contours.
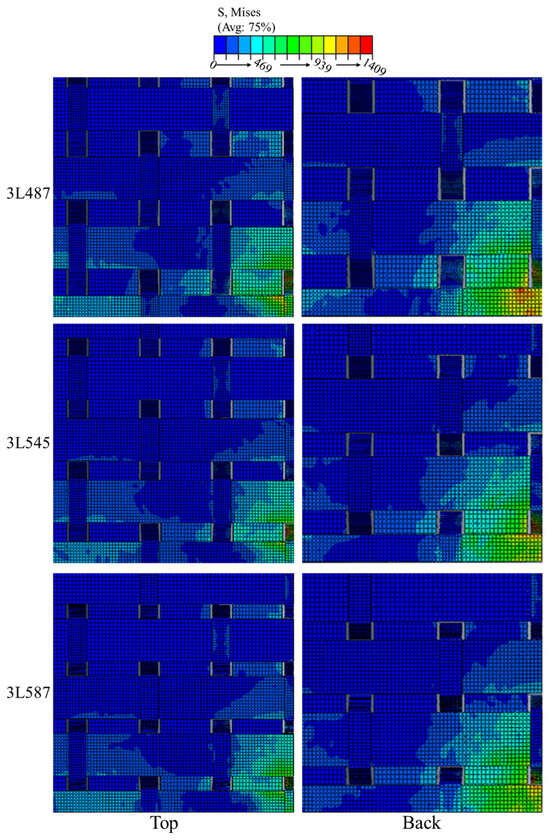
Figure 9.
Stress dissipation at top and back of 3-layer 3DOW with different x-yarn densities.
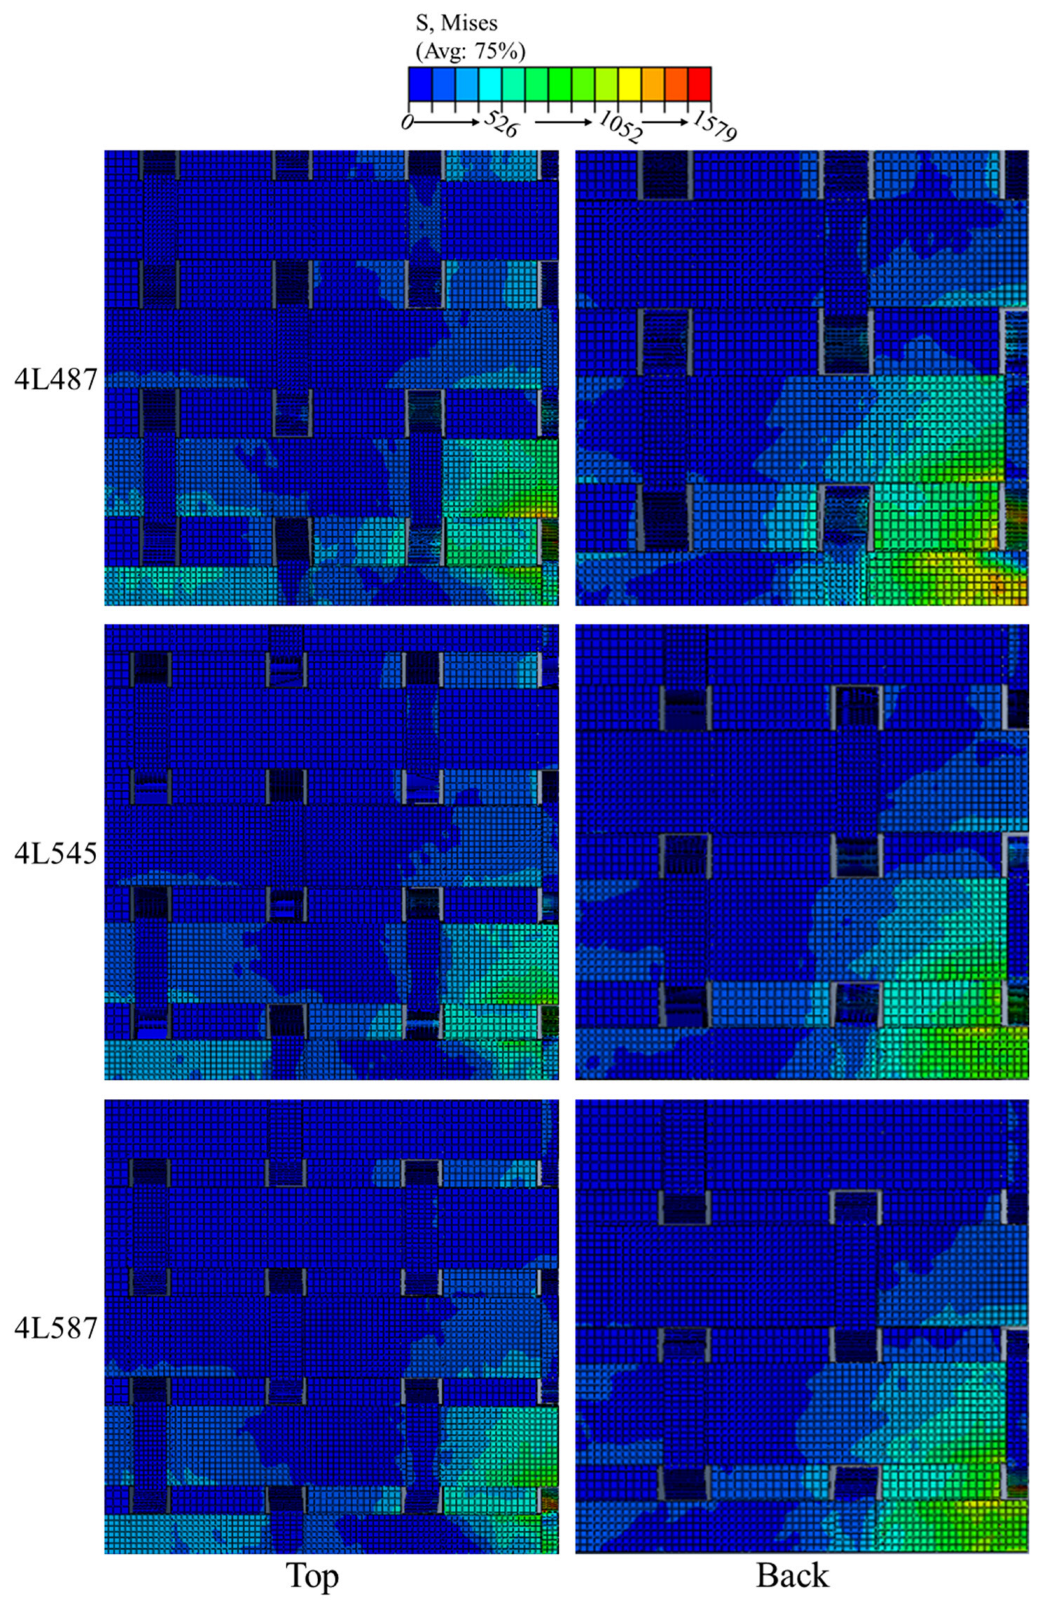
This trend of x-yarn density influencing stress distribution becomes even more pronounced in the four-layer 3DOW models, as illustrated in Figure 10. The reinforcement’s upper section, especially the central two x-yarns, indicates a much smaller stressed area in models with 5.87picks/cm of x-yarn density than in their lower-density counterparts. For the model’s back, high-stress regions (designated in orange in Figure 10) are nearly absent in 4L545 and 4L587. Furthermore, as x-yarn density increases, the stress propagation along the second x-yarn diminishes in the x-yarn direction.
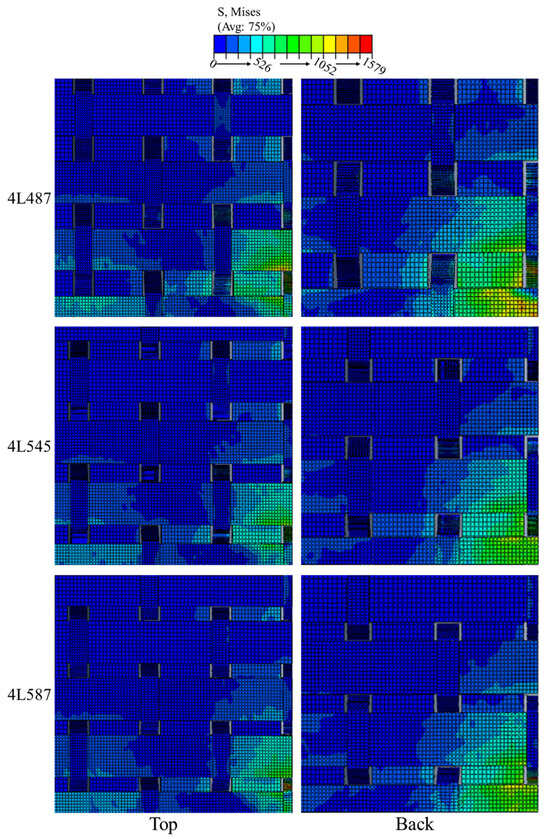
Figure 10.
Stress dissipation at the top and back of 4-layer 3DOW with different x-yarn densities.
While the stress contours illustrate the minimal variation in the stress magnitudes at the composite model’s top surface across different x-yarn densities, the influence of x-yarn density on stress distribution becomes more pronounced when analyzing the stress distribution of the middle x-yarn at the back of composite. The stresses are characterized by von Mises stresses across each yarn, and their distribution in various 3DOW models has been studied using finite element modeling.
Figure 11a depicts the von Mises stress distribution on the central x-yarn in the bottom layer of 2-, 3-, and 4-layer 3DOW models subjected to low-velocity impacts. Notably, 2L487 shows the highest stress approaching 1200 MPa—approximately 150 MPa greater than 2L545. In contrast, 2L587 exhibits the lowest peak stress at roughly 900 MPa. This increased stress concentration in 2L487 leads to damage initiation as early as 0.75 ms (refer to Table 4), and by 1.75 ms post-impact, 2L487 has experienced complete failure, while the other models remain undamaged. In the 3-layer model (Figure 11b), the peak stresses observed are approximately 1200 MPa for 3L487, 1050 MPa for 3L545, and just above 990 MPa for 3L587. Furthermore, 3L487 experiences damage onset earlier than its counterparts. The four-layer model accentuates these disparities, as shown in Figure 11c, with 4L487 exhibiting a peak stress significantly exceeding the approximately 930 MPa observed for both 4L545 and 4L587.
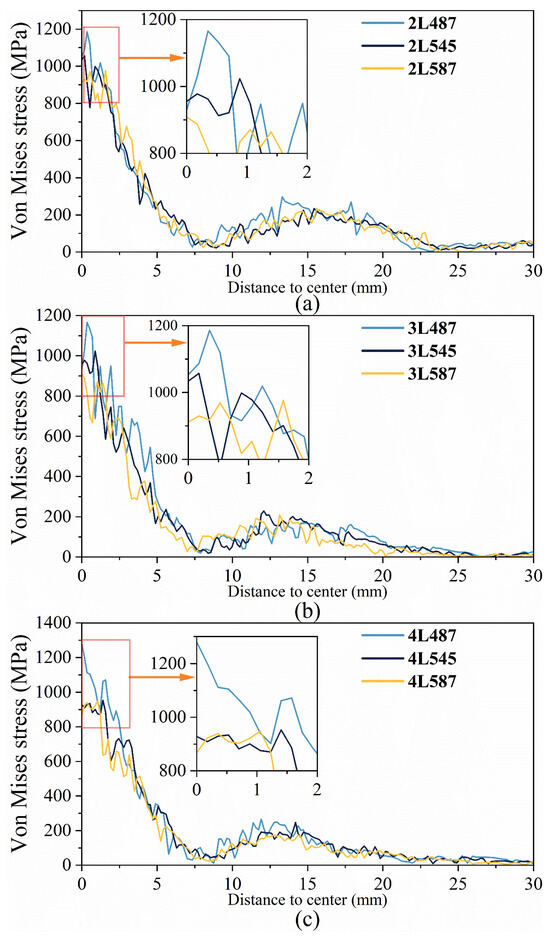
Figure 11.
The von Mises stress distribution along centered x-yarn at the bottom layer in (a) 2-layer models, (b) 3-layer models, (c) 4-layer models.
The 2-layer model highlights pronounced stress disparities at the back of 2L487 when compared to 2L545, emphasizing the sensitivity of these composites to x-yarn density variations. For 3-layer models, this sensitivity becomes more evident, particularly in the 3L487 model as shown in Figure 9. The four-layer models further reinforce these observations, emphasizing the enhanced influence of x-yarn density with added layers. A critical observation is the inverse relationship between x-yarn density and high-stress concentration areas. Increased x-yarn densities correlate with reduced high-stress zones, denoted by diminishing yellow and red regions on stress contour plots. This phenomenon is likely attributed to a higher x-yarn density, facilitating improved stress distribution across yarns. Such observations imply that increased x-yarn densities could potentially enhance impact resistance through more even stress dispersion. Peak von Mises stresses provide crucial insights into potential material failure points. For instance, 2L487, with its peak stress of approximately 1200 MPa, initiates damage at 0.75 µs and fails completely by 1.75 ms post-impact. In contrast, 2L545 and 2L587 remain intact, highlighting the susceptibility of certain models to impact-induced damage. The early damage onset in models such as 2L487 and 3L487 is directly associated with stress concentrations. This correlation between peak stresses and damage onset offers a robust metric for evaluating material durability under impact. Increased stress concentrations, modulated by x-yarn densities, can induce early damage, leading to complete failure upon impact. These findings underscore the significance of x-yarn density in determining a composite’s impact resilience. A nuanced observation is the marginal difference in peak stresses between 4L545 and 4L587, with 4L487 exhibiting Increased values. This might suggest a potential x-yarn density threshold beyond which stress distribution benefits plateau. Intriguingly, while composite top layers exhibit minimal stress disparities across x-yarn densities, deeper layers, particularly the bottom’s middle x-yarn, reveal pronounced differences.
3.1.2. Axial Stress Distribution
Stress distribution throughout a material’s thickness is a crucial indicator of potential damage. This section addresses the stress variation, specifically the in-plane stress σ1, 5 mm from the impact center.
As the 2-layer composite (2L487) shown in Figure 12, the upper layer significantly shows the highest compressive stresses by 0.15 ms, compared to other models. The distinct compressive stresses observed in the upper layer of 2L487 at 0.15 ms underscore the sensitivity of these materials to change in the x-yarn density. Conversely, tensile stresses at the back remain consistent. This becomes even more evident by 0.45 ms, as depicted in Figure 12, where the bottom layer of this model experiences intensification of tensile stresses beyond those of 2L545 and 2L587.
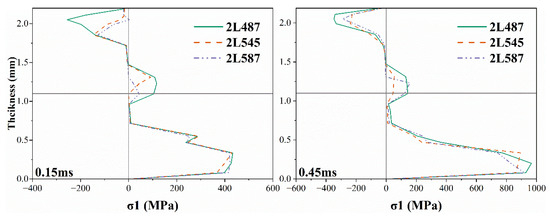
Figure 12.
In-plane stress distribution in 2-layer 3DOW at 0.15 and 0.45 ms.
For three-layer models, as shown in Figure 13, the trend becomes more pronounced. The 3L487 model displays pronounced differential stresses early in the assessment. By 0.15 ms, the top layer of the 3L487 model endures increased compressive stresses, whereas its bottom layer showcases augmented tensile stresses, exceeding those observed in models with a denser x-yarn. A notable transition emerges by 0.45 ms: the top layers predominantly experience tensile stresses, marking a distinct shift from their two-layer counterparts. In particular, the 3L487 model’s bottom layer exhibits significantly increased tensile stresses, as shown in Figure 13.
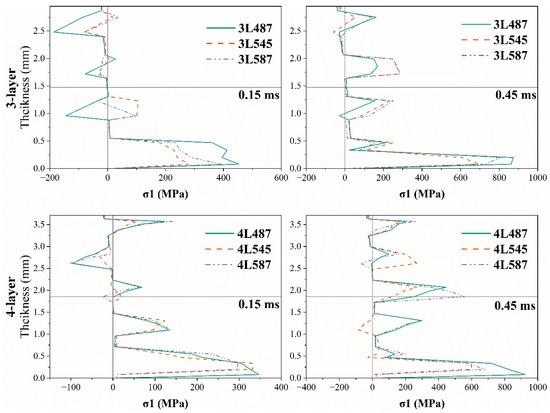
Figure 13.
In-plane stress distribution in 3- and 4-layer 3DOW at different times.
At 0.15 ms, the 4-layer models display a behavior that markedly differs from both the 2-layer and 3-layer counterparts, as illustrated in Figure 13. Contrary to expectations, their top layers undergo tension. This trend, underscored by the pronounced tensile stresses in the bottom layers of models such as 4L487, elucidates the nuanced effects of x-yarn densities on stress distribution. By 0.45 ms, as seen in Figure 13, most of the 4-layer models are predominantly subjected to tensile stress, echoing the behavior seen in the 3-layer models but differing from the 2-layer configurations. The 4L487 model has the highest peaks, and the differences in these tensile stresses are obvious, especially at the back.
By investigating 3DOW composites’ stress response to impact, our findings highlight the essential role played by yarn density and layering. Initial assessments show that 2-layer composites, particularly the 2L487 model, exhibit noticeable compressive stress at their top layer by 0.15 milliseconds, underscoring how x-yarn density affects performance. By 0.45 ms, this shifts towards intensified tensile stress at the bottom, a trend more pronounced than in other two-layer configurations. Transitioning to three-layer composites, the 3L487 model especially shows early differential stress behaviors, with a shift from compressive to predominantly tensile stresses across layers by 0.45 ms. Four-layer composites show unexpected tensile stresses across layers—intensified further in the 4L487 model. These observations underline the intricate interplay between structural parameters and stress distribution.
3.1.3. Effect of X-Yarn Density on Stress Distribution in the Resin Matrix
The influence of x-yarn density on stress distribution is assessed, focusing on the resin matrix at the composite’s back. The model’s stresses are denoted by the von Mises stresses on the matrix’s back.
Figure 14 illustrates the von Mises stress distribution progression in the composite back of the three two-layer models over four discrete time intervals post-impact. By 0.3 ms, a distinct high-stress region (highlighted in red) appears at the impact center of 2L487 and grows as the impact continues. By 0.5 ms, this stress region has significantly expanded. By 0.7 ms, the stress propagation mainly follows the x-yarn direction, except for 2L487, where propagation along the y-yarn direction is evident, as presented in Figure 14a. The models with denser x-yarn display stress propagation in the y-yarn direction. A notable feature in 2L487 is the premature convergence of stress regions within the resin-rich gaps between y-yarns, as seen in Figure 14a, a phenomenon missing in models with higher x-yarn density. As the impact progresses, 2L487’s stress regions predominantly follow the y-yarn direction, whereas other models transition dynamically from y-yarn to x-yarn directions, highlighting the intricate interplay between yarn alignment and impact response.
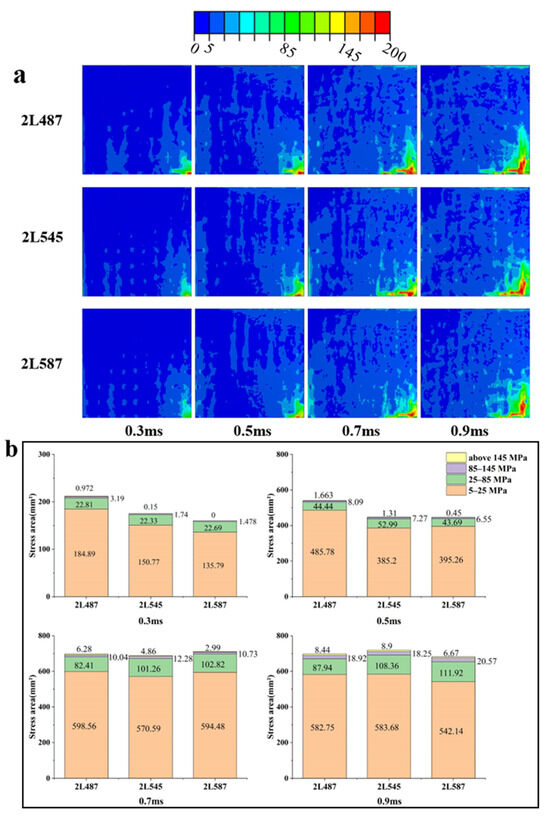
Figure 14.
Stress distribution in 2-layer 3DOW with different x-yarn density. (a) Stress contour and (b) stressed area at different moments.
Figure 14b measures the areas of variously colored stress zones. At 0.3 ms, the composite back of 2L487 displays a broader stress area, especially under the resin, with stress values exceeding 145MPa. This area is considerably larger in 2L487 than in 2L545, while 2L587 has no regions with stresses above 145MPa, as shown in Figure 14. Moving to 0.5 ms, 2L487 remains predominant in terms of the vast high-stress zone. By 0.7 ms, the overall stress regions of the three models appear to merge, although 2L487 still has a prominent high-stress area. By 0.9 ms, the variations in both the comprehensive and high-intensity stress zones among the models decrease, with 2L587 consistently showcasing the smallest high-stress (represented by red in Figure 14a) region, hinting at potential resin damage.
Figure 15a shows the stress distribution within the resin matrix of the three-layer models. At 0.3 ms, while 3L487’s overall stress region exceeds that of its counterparts, the high-stress domains are similar in size across all models. This trend persists at 0.5 ms. Moreover, Figure 15 depicts minimal stress in the left resin-rich section of 3L587. By 0.7 ms, the adjacent resin-rich areas in 3L487 almost combine. By 0.9 ms, central high-stress regions, resulting from the impact, have spread along the x-yarn direction; however, 3L587’s region is more restricted compared to that of 3L487.
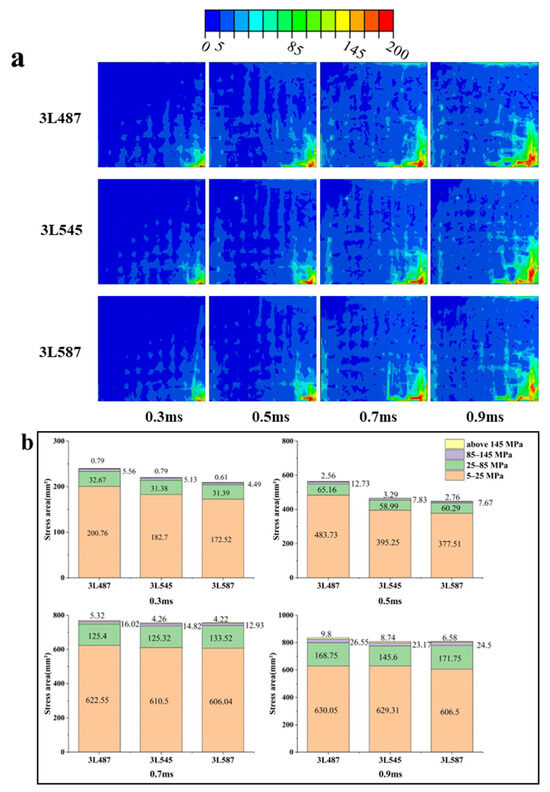
Figure 15.
Stress distribution in 3-layer 3DOW with different x-yarn density. (a) Stress contour and (b) stressed area at different moments.
Referring to the quantified stress regions in Figure 15b, initial observations at 0.3 ms show 3L487 with a distinct overall stress region and similar high-stress areas compared to models with denser x-yarn configurations. At 0.5 ms, while 3L487 maintains the most expansive overall stress area, the high-stress (red) regions across models approach similar magnitudes in Figure 15. By 0.7 ms, differences in the stress contour become less pronounced. However, by 0.9 ms, even as the overall stress regions are similar, models with higher x-yarn densities have smaller high-stress areas, as depicted in Figure 15a.
Essentially, the three-layer model intensifies the influence of x-yarn density on stress distribution. Initial post-impact phases predominantly feature 3L487 with an expansive stress region. However, as the impact progresses, models such as 3L587 demonstrate limited stress propagation, highlighting the critical role of x-yarn density in regulating stress dynamics.
In the four-layer models, the influence of x-yarn density is more evident. Significantly, 4L587, with its increased yarn density, displays markedly reduced stress concentration areas, mainly centered at the impact point, as shown in Figure 16a. Notably, 4L587, with its higher yarn density, showcases significantly diminished stress concentration regions, primarily centered at the impact point, as depicted in Figure 16a. Especially at 0.3 and 0.5 ms, the difference in the stress contour of the resin is more obvious, as shown in Figure 16a. The stress contour variation on the back of the four-layer model is more pronounced. At 0.7 and 0.9 ms, the area of the high-stress region represented by the red color in Figure 16b is significantly smaller on the stress contour of 4L587. The stress concentration area is shown to propagate in the x-yarn direction followed by the y-yarn direction after 0.7 ms. By 0.9 ms, the stress concentration predominantly aligns with the y-yarn direction. It can also be seen from Figure 16b that the stress concentration region, which decreases significantly with increasing x-yarn density, is located at the center of the impact.
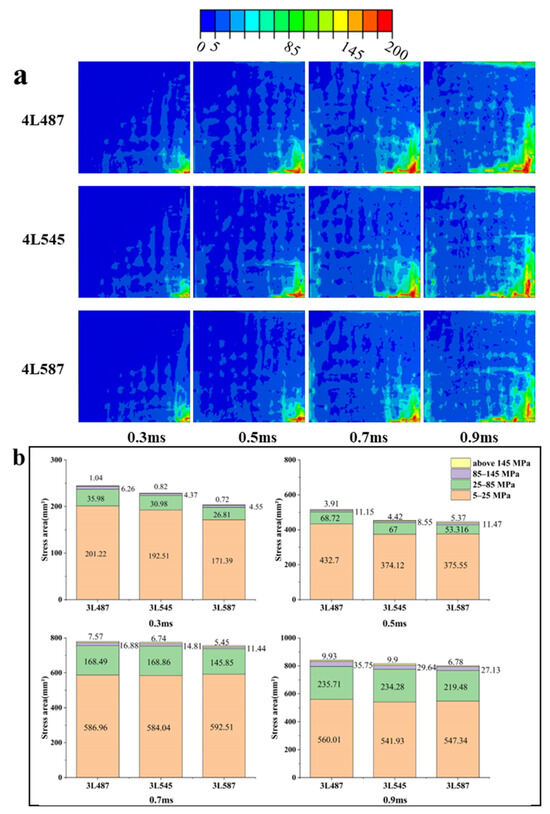
Figure 16.
Stress distribution in 4-layer 3DOW with different x-yarn density. (a) Stress contour and (b) stressed area at different moments.
A clear trend is observed: as x-yarn density increases, stress concentrations decrease. This relationship suggests that higher x-yarn densities might lead to superior stress distribution, thereby potentially enhancing the composite’s impact resistance. Additionally, the unique stress propagation patterns seen in resin-rich zones, particularly in two-layer models, emphasize x-yarn density’s significant role in identifying potential weak points within the composite.
3.2. Effect of the Number of Layers
Regardless of the number of layers, the stress distribution within the central yarn at the bottom layer of 3DOW models demonstrates a remarkable consistency. This phenomenon potentially indicates that the foundational role of the bottom yarn remains invariant, providing a robust structural base irrespective of subsequent layer additions. In contrast, the top yarn’s stress distribution exhibits distinct variations contingent on the layer count, as delineated in Figure 17. This suggests that the top layer predominantly interfaces with external impacts, making it more sensitive to modifications in the composite’s configuration.
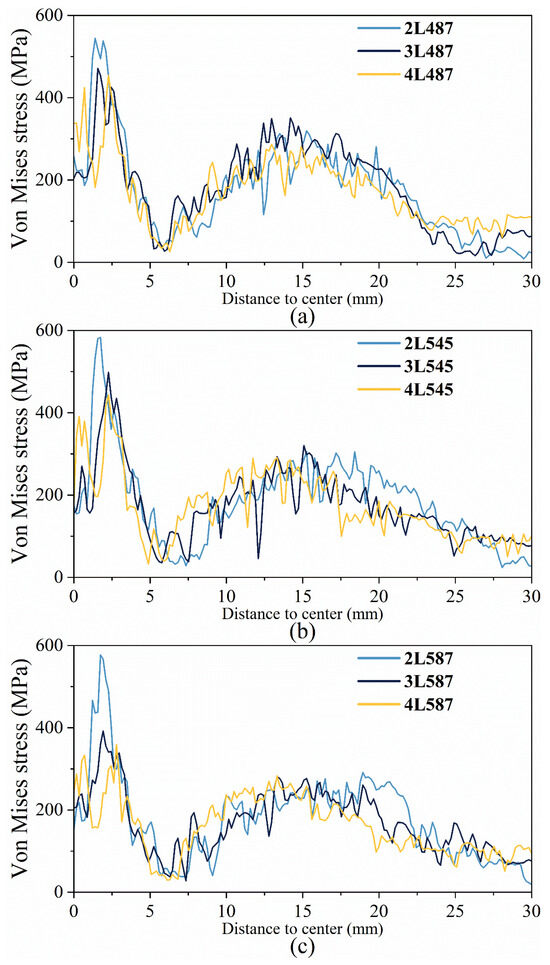
Figure 17.
The von Mises stress distribution along the centered x-yarn at the bottom layer: (a) with 4.87 picks/cm, (b) 5.45 picks/cm, and (c) 5.87 picks/cm.
In 3DOW models with 4.87 picks/cm x-yarn density, the 2-layer model has the highest peak stress, about 100 MPa more than the 3-layer and 4-layer models, as shown in Figure 17a. The stress waveform morphologies undergo transformations contingent on the layer count. With an x-yarn density of 5.45 picks/cm (refer to Figure 17b), the 2-layer model has much higher peak stress than the 3-layer and 4-layer models. Similar to the 2-layer model, the 3-layer and 4-layer models exhibit stress distribution shifts commensurate with layer variations. The 4L545 model, as depicted in Figure 17c, is characterized by a bimodal peak stress distribution within the impact center.
With a 5.87 picks/cm x-yarn density, the stress difference between the 2-layer and 3-layer models becomes more pronounced. The difference is more noticeable between 2L587 and 4L587, with the former having about 200 MPa higher peak stress. These observations underscore a non-linear interrelation between layer count and peak stress magnitudes. Additionally, the 4L587 model exhibits a bimodal peak stress distribution within the impact zone, mirroring the 4L545 model. The stress waveform’s changes, particularly in 3DOWs with 4.87 picks/cm x-yarn density, relate closely to layer differences. Such morphological changes in the stress waveform might lead to the differential energy absorption and propagation mechanics across the composite with different number of layers. A noteworthy observation for configurations with x-yarn densities of 5.45 and 5.87 picks/cm is the consistently increased stress in the 2-layer models at approximately 20 mm from the impact center, relative to their 3-layer and 4-layer counterparts. This localized stress elevation intimates a heightened susceptibility of 2-layer configurations to localized impacts within this region.
The analysis of 3DOW composites under impact reveals that bottom yarn stress distribution remains stable across different layer counts, highlighting its foundational stability. Top yarn stress, however, varies with the number of layers, reflecting its direct interaction with impacts. Notably, 2-layer models exhibit higher peak stresses than those with more layers, indicating a nuanced relationship between layering and stress response, particularly influenced by x-yarn density. This suggests that layer count, like x-yarn density, is a critical factor in a composite’s impact resilience.
3.3. Effect of Z-Yarn Path
3.3.1. Effect of X-Yarn Density on Stress Distribution in the Reinforcement
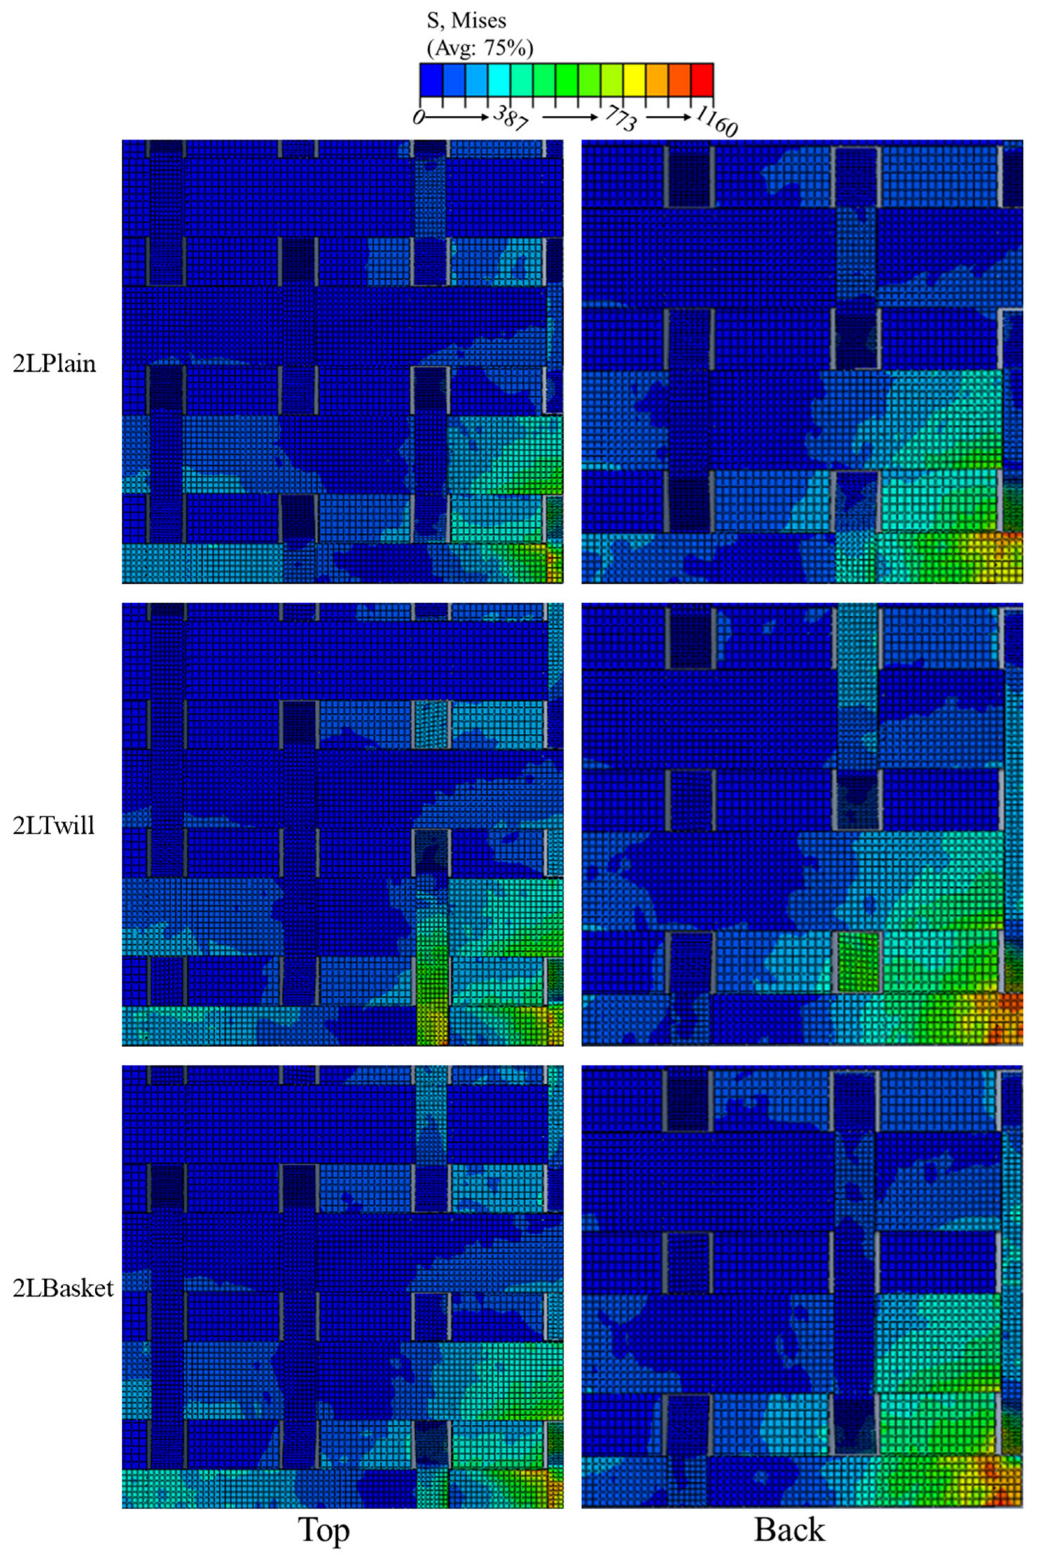
When analyzing the stress distribution of the 2-layer group with different z-yarn paths, there is a more pronounced difference in stress dissipation for different x-yarn densities within the group. As shown in Figure 18, the twill structure shows that the second z-yarn near the center of impact undergoes two successive interlacements with the x-yarn at the top of the composite. As a result, this z-yarn has a higher stress level compared to similar z-yarns in the plain and basket structures.

Figure 18.
Stress dissipation at the top and back of 2-layer 3DOW with different z-yarn paths.
In the basket structure, the z-yarn located at the center of impact at the top of the model has a higher level of stress concentration. At the same time, the central x-yarn on top shows increased stress, as shown in Figure 18. It is noteworthy that in both the basket model and the twill model, the interaction between the second z- and x-yarns occurs in the top region of the composite, which is in contrast to the internal interaction in the plain model. This particular interaction increases the stress in the basket and twill models.
The difference in stress distribution is more pronounced at the bottom. The stress concentration area (marked in orange and red in Figure 18) is smaller in plain weave compared to twill weave and basket weave. A closer look at the stress distribution in the z-yarn shows that the stress region in the center z-yarn of the plain weave is significantly lower than in the other two weaves. Although, as in the twill model, the second z-yarn of the basket intersects the center x-yarn on the top surface, this yarn intersects the x-yarn at two consecutive intersections at the bottom of the reinforcement, as shown in Figure 18. This results in the basket’s z-yarns being subjected to relatively low stresses, in contrast to the stresses evident in the twill weave's z-yarns.
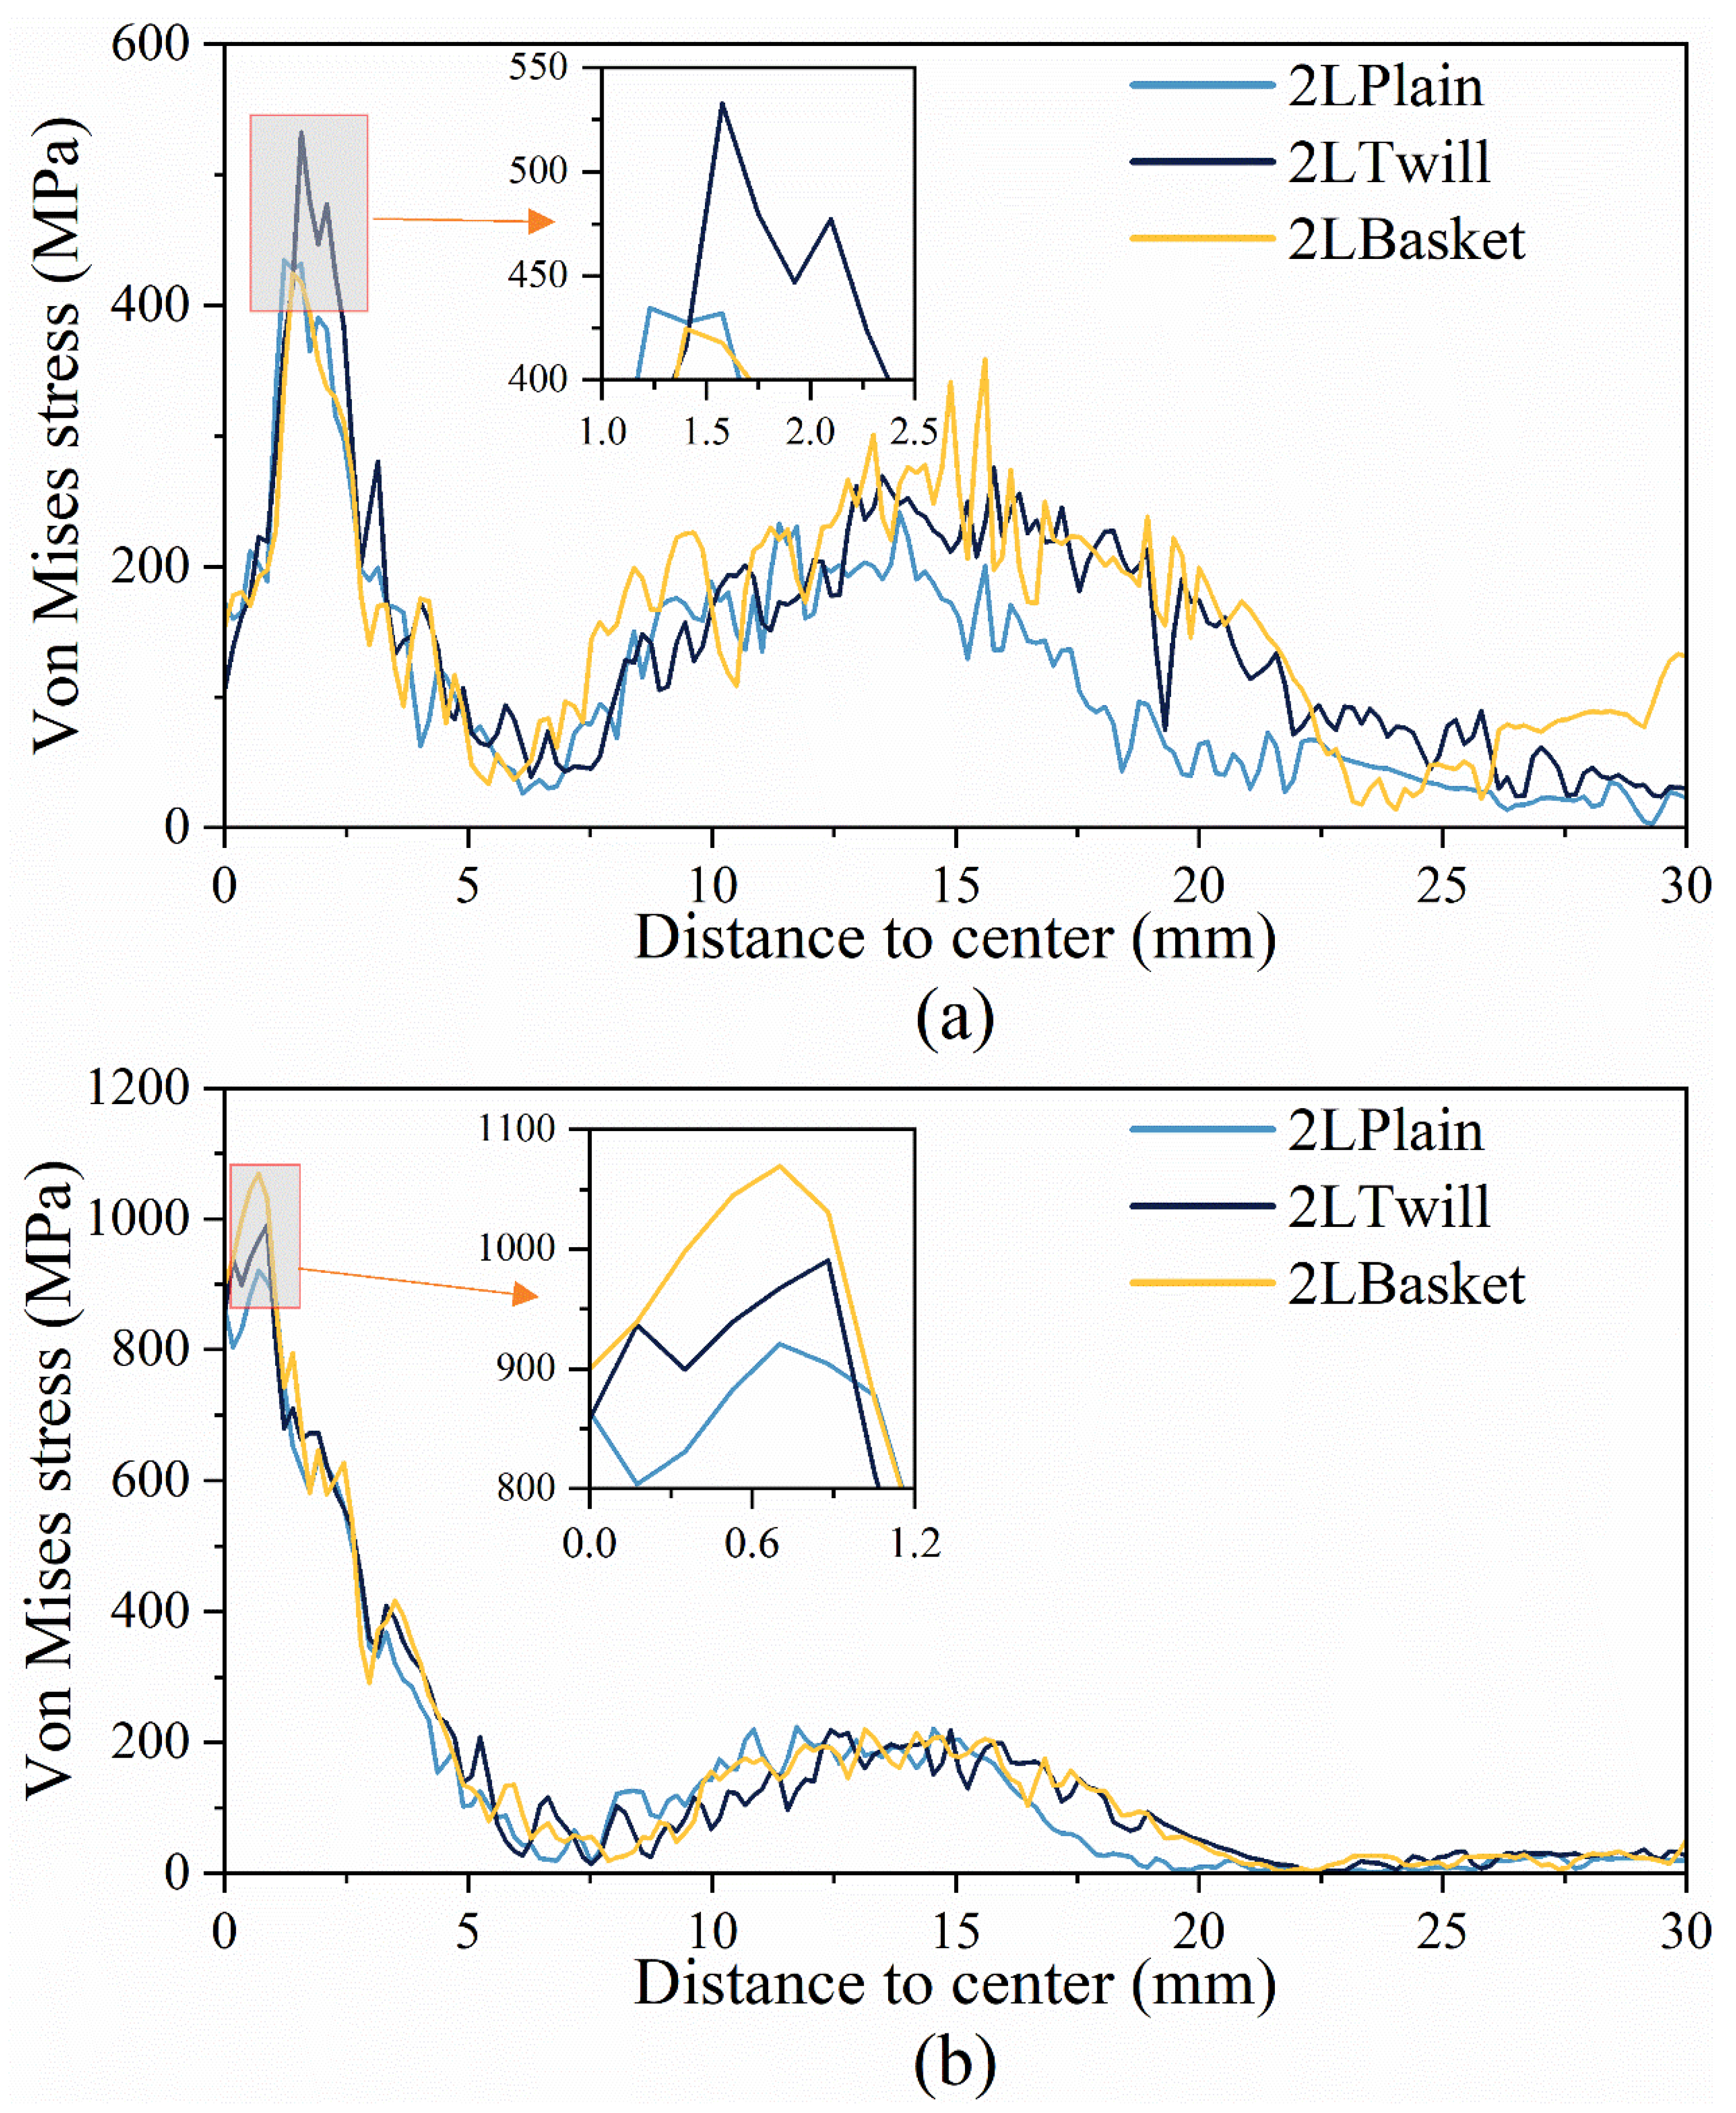
Figure 19 illustrates the stress distribution variation along the top and bottom middle x-yarn at 1 ms post-impact. The twill structure’s peak von Mises stress for this yarn is approximately 560 MPa—surpassing the stress observed in both plain and basket structures by over 100 MPa, as depicted in Figure 19a. Between 14 and 22 mm from the impact center, the plain structure’s yarn exhibits considerably reduced stress compared to the other two models.

Figure 19.
Von Mises stress distribution along centered x-yarns under impact at (a) top surface and (b) bottom surface.
From the bottom stress profile in Figure 19b, the basket structure has the highest peak von Mises stress, followed by the twill structure, while the plain structure has the lowest peak stress. As shown in Table 4, the increase in stress concentration resulted in early damage to the basket structure at 0.6 ms. This resulted in the structure failing of the basket model at 1.58 ms after impact, approximately 0.07 ms earlier than the plain structure. These results indicate that the primary yarn stresses in the plain and twill yarns were more uniformly distributed than in the basket yarns at the impact locations simulated.
As shown in Figure 19a, the peak stress of the twill center x-yarn is about 560 MPa, which is significantly higher than that of the plain and basket yarns. Basket models are more susceptible to stress peaks as damage occurs earlier and eventually destroys quickly. In contrast, the delayed damage of the plain model after impact emphasizes their inherent elasticity, suggesting that a more uniform stress distribution enhances impact resistance, as observed in both plain and twill fabrics.
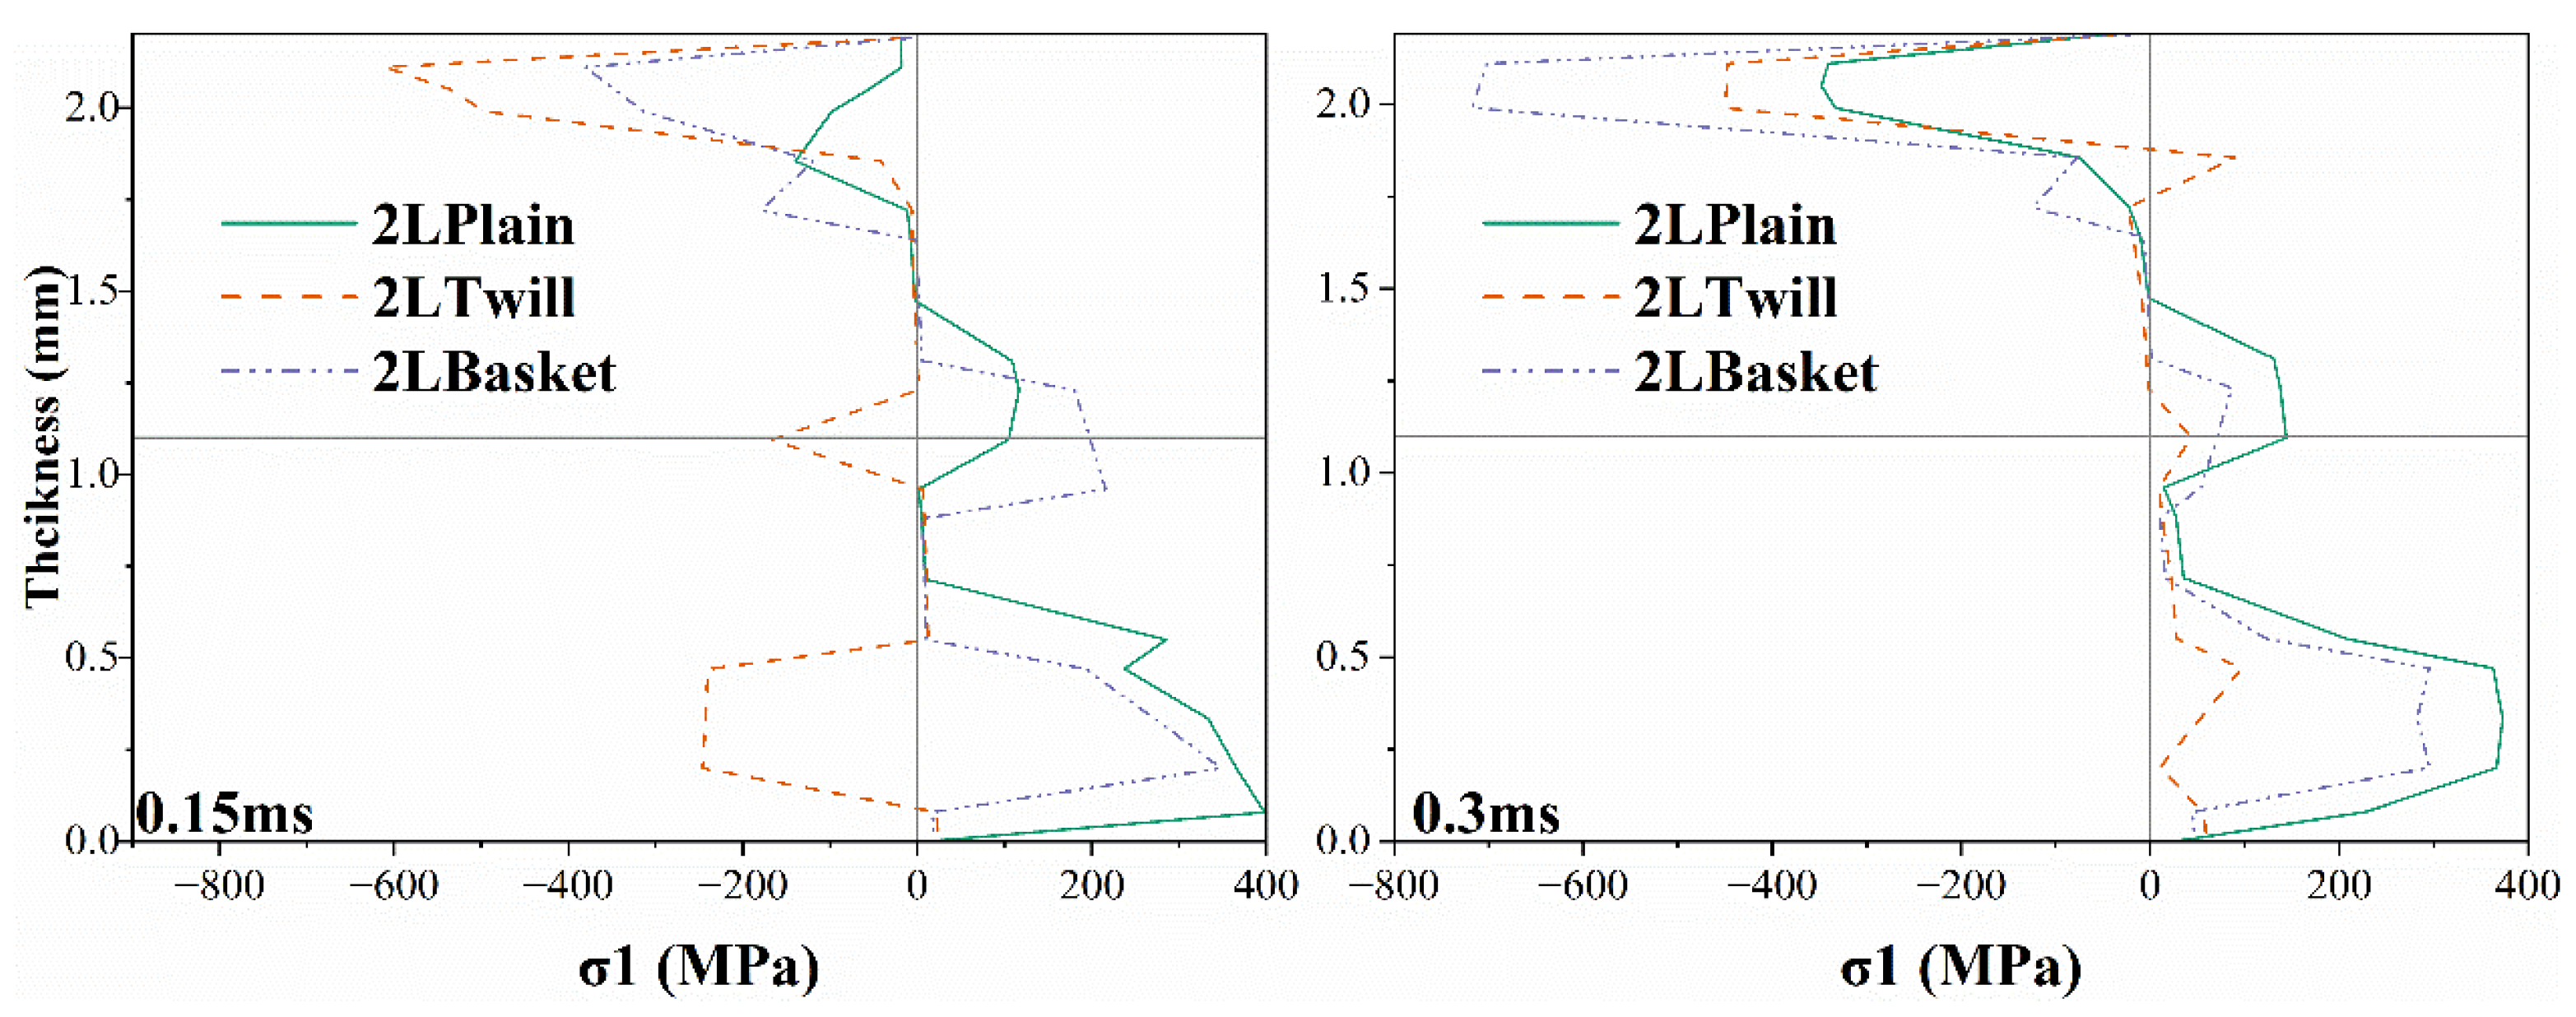
Incorporating the effect of the z-yarn path into the analysis adds to our understanding. As shown in Figure 20, the 2LTwill model at 0.15 ms stands out for its pronounced top compressive stress, thus emphasizing the role of the z yarn path in shaping the mechanical response. This is emphasized by the stress pattern in the middle of the model, as shown in Figure 20; the twill yarn is in compression, while the yarns in plain and basket models exhibit predominantly tensile stresses, further emphasizing this point. 2LTwill’s pronounced compressive stress on the back surface contrasts with the tensile stresses in the 2LTwill and the 2LBasket, showing the profound effect of the variation of the z-yarn paths on the distribution of the stresses along the thickness direction. At 0.3 ms, the top surface of the 2LBasket shows significant compressive stress of 700 MPa (see Figure 20), which greatly exceeds the values of the 2LTwill and 2LPlain. This observation contrasts with the rear surface of 2LTwill, which transitioned from compression to tension, further emphasizing the role of the z-yarn path in determining stress dissipation in 3DOW composites. In conclusion, the weave pattern, whether plain, twill, or basket, greatly affects the stress distribution and impact properties of 3DOW composites.
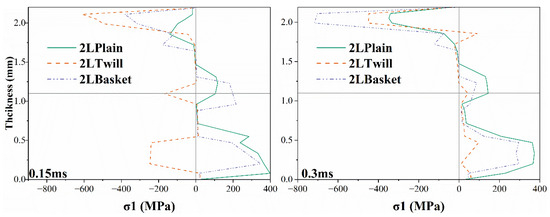
Figure 20.
In-plane stress distribution in 2-layer 3DOW with different z-yarn paths.
3.3.2. Effect of X-Yarn Density on Stress Distribution in the Resin Matrix
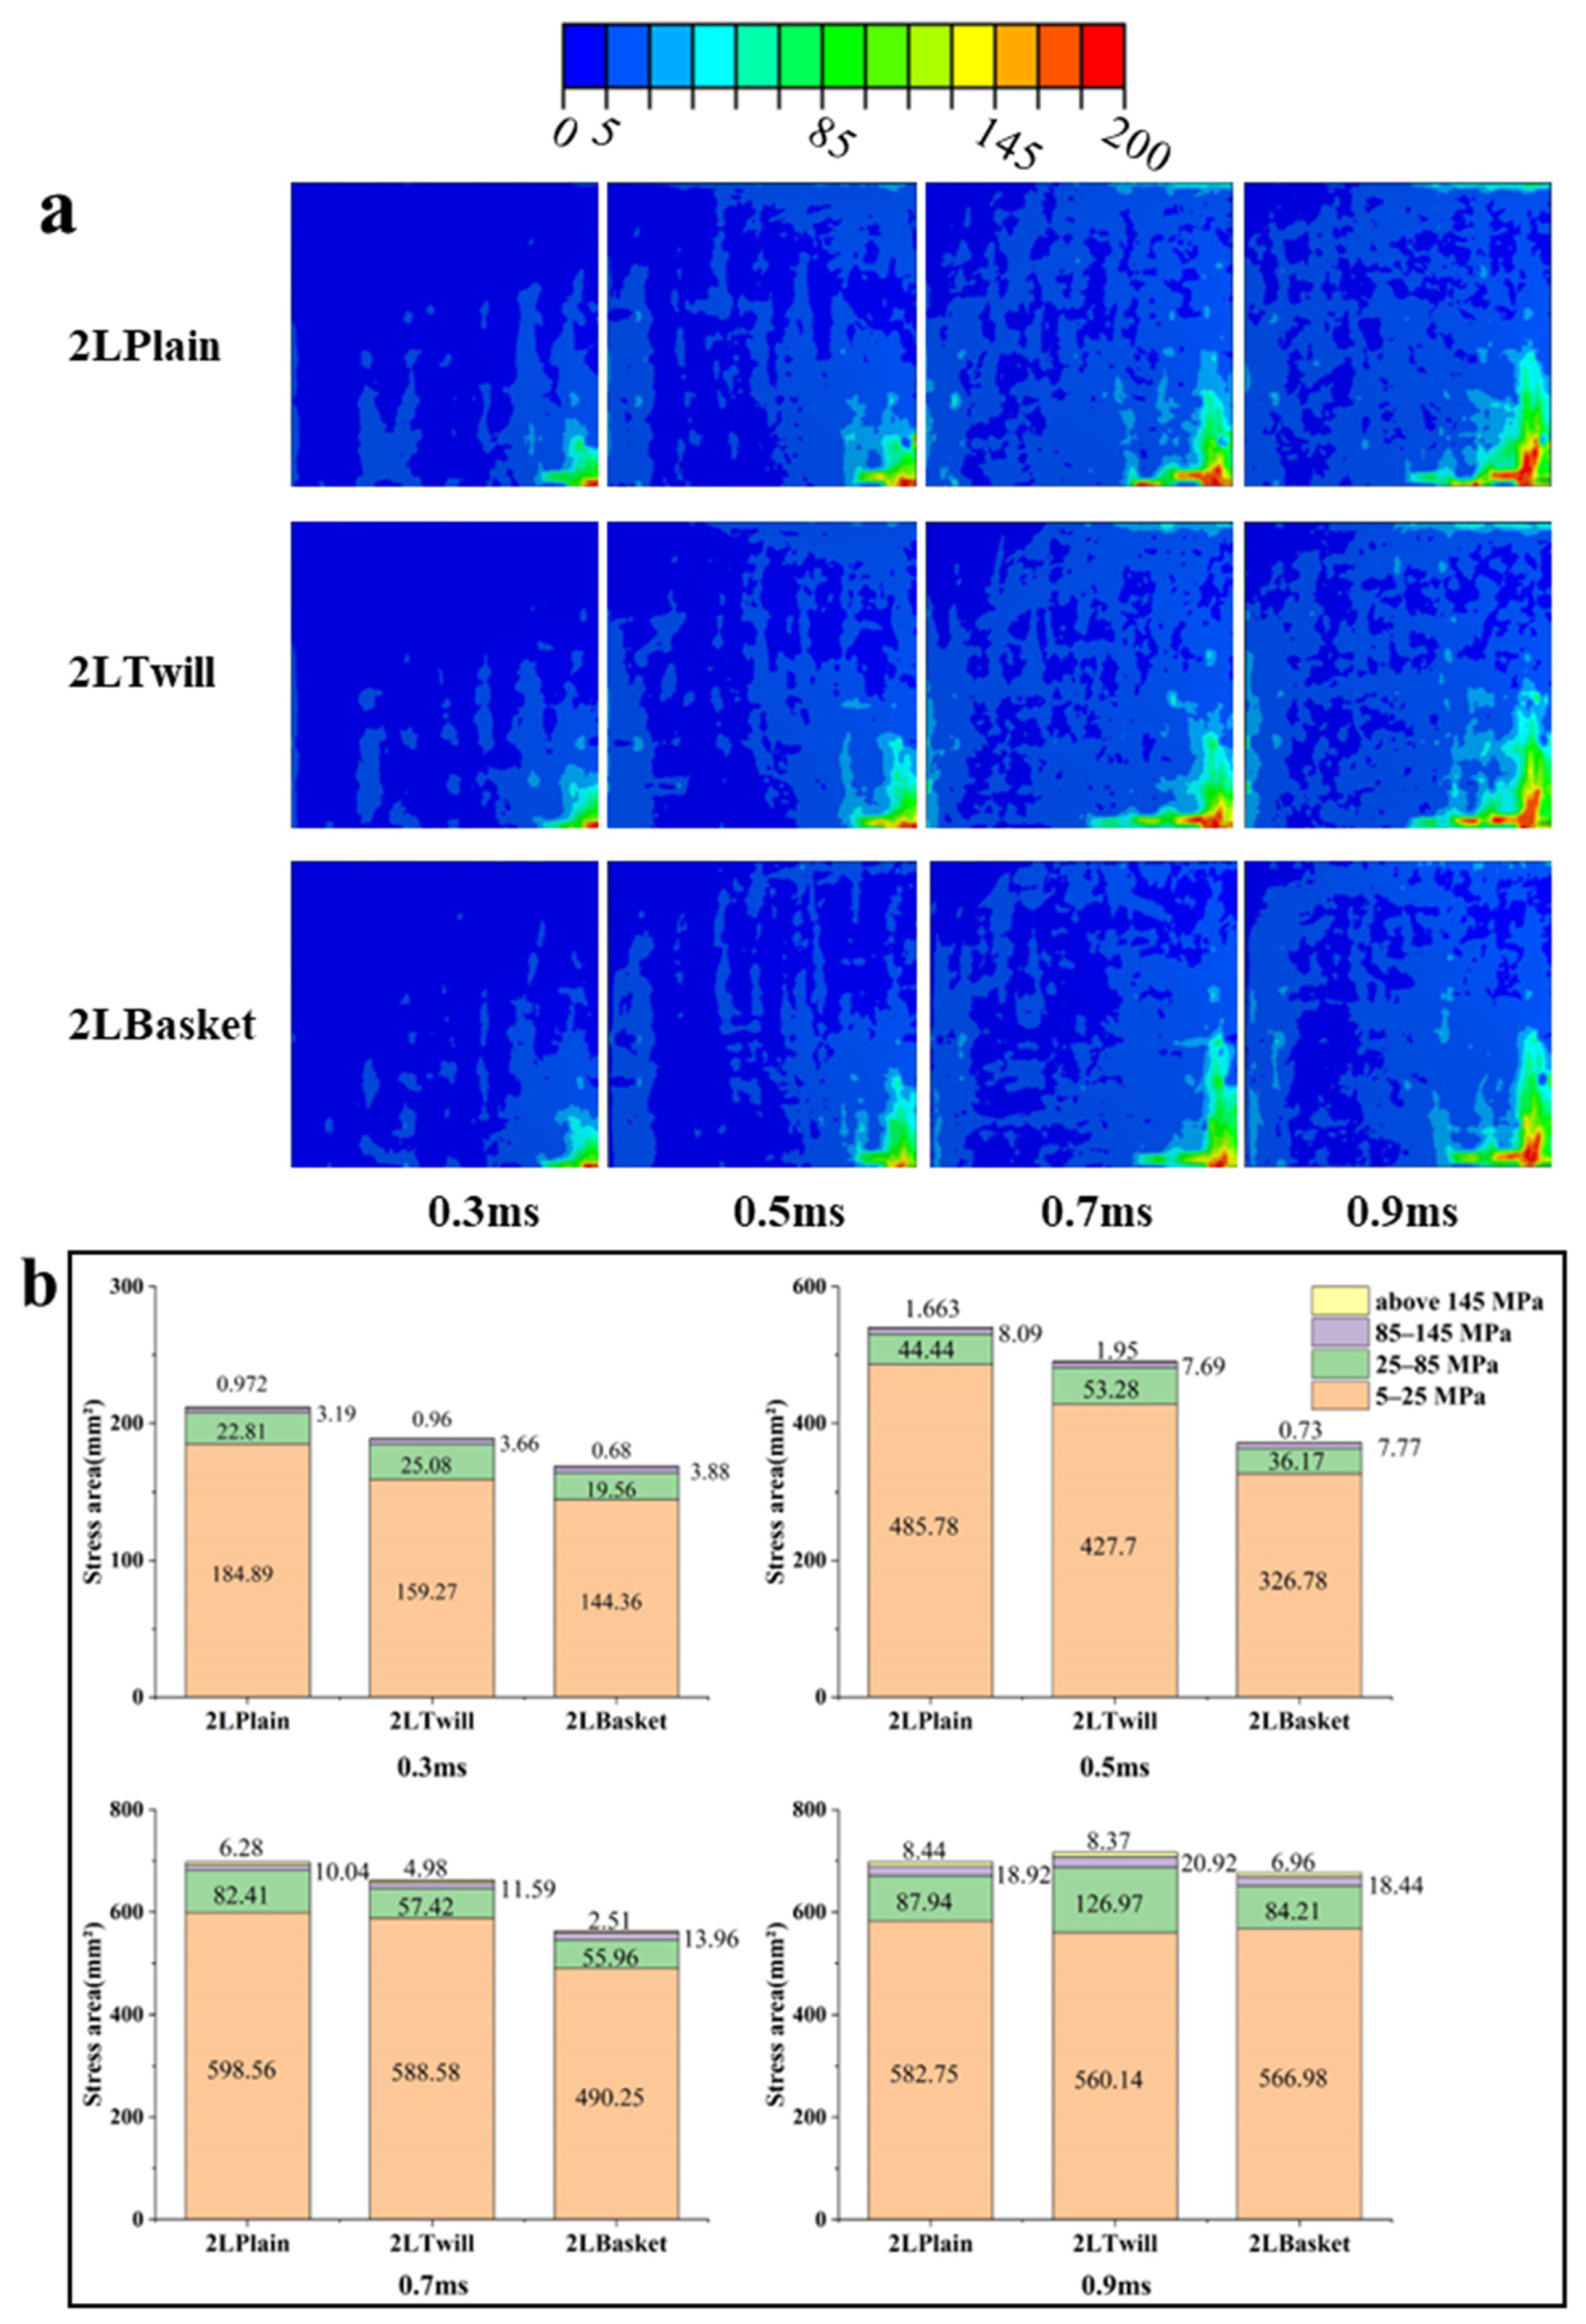
Figure 21 provides a thorough assessment of stress contours on the back surface of 2-layer 3DOW composite matrix, showing that different z-yarn paths significantly influence stress distribution under impact. This effect is more pronounced in the 2LBasket, where the stress levels in these areas are significantly lower (by 0.5 milliseconds). At 0.7 milliseconds, a continuous section in 2LBasket indicates a stress estimate of about 5 MPa, as shown in Figure 21a. Interestingly, this section extends from the central to the left region, highlighting the complexities of stress propagation depending on the z-yarn path.
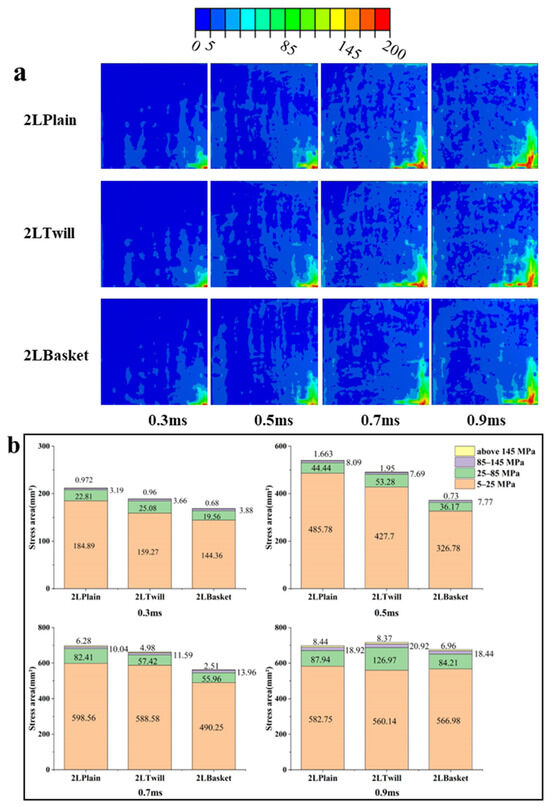
Figure 21.
Stress distribution in 2-layer 3DOW with different z-yarn paths. (a) Stress contour and (b) stressed area at different moments.
Comparative examination of stress contours illustrated by Figure 21b shows that stress areas for 2LTwill and 2LBasket components are substantially smaller than for the area of the 2LPlain model. Specifically, the 2LBasket’s area subjected to a stress range of 5–25 MPa is roughly 76% of that of 2LPlain, pointing to a substantial reduction in the overall stress footprint. By 0.5 ms and 0.7 ms, the stressed area in 2LPlain slightly exceeds that in 2LTwill, with both being notably larger than in 2LBasket. However, it is crucial to note that 2LBasket demonstrates a notably reduced region undergoing stresses exceeding 145 MPa, starkly contrasting with 2LPlain. By 0.9 ms, as shown in Fig. 21b, while the differences between models diminish, the plain weave consistently has the largest stress region near the impact center, with the basket weave a close second.
Comparing 2-layer 3DOW models reveals the pivotal role that the z-yarn path plays in shaping stress dynamics. Switching from plain weave to twill weave narrows stress regions; selecting basket weave reduces both high-stress areas and total stress areas. Choosing a basket weave not only diminishes the high-stress areas but also shrinks the total stressed region. Given the same resin volumes in 2LTwill and 2LBasket, it is reasonable to suggest that the stress distribution in the 2LBasket matrix is not as even as in 2LTwill and 2LPlain. This difference is further highlighted by the noticeable gap in the 2LBasket’s stress contour. This gap consequently suggests that the matrix in this structure likely absorbs diminished impact energy.
Despite its apparent effect on stress distribution, choosing between twill weave and basket weave requires making some compromises. While basket weave minimizes areas of high stress levels while not having as uniform of stress distribution compared to twill or plain weaves may affect its ability to absorb impact energy effectively. These findings offer a basis for fine-tuning 3DOW composites to meet specific applications while emphasizing its role in attaining specific mechanical properties.
4. Conclusions
Finite element models using ABAQUS were developed and validated to study the effects of 3DOW structural parameters on stress dissipation. Stress dissipation in 2-, 3-, and 4-layer 3DOW configurations, with varying x-yarn densities and z-yarn paths, was assessed based on von Mises stress for both reinforcement and resin matrix. In the 2-layer models, the significant impact of x-yarn density on stress distribution is evident, particularly with the pronounced stress concentrations in 2L487. Transitioning to 3-layer and 4-layer models further emphasizes these findings, highlighting the nonlinear relationships among stress distributions, layers, and x-yarn densities.
A key insight from this study is the pivotal role of x-yarn density in influencing stress propagation and concentration. As the x-yarn density increases, there is a marked reduction in high-stress regions, highlighting the potential of denser construction to offer superior impact resistance. This claim is further supported by damage onset in models such as 2L487, illustrating the relationship between increased stress concentrations and premature damage initiation.
Additionally, introducing varied z-yarn paths, especially transitioning from plain to twill or basket weaves, considerably impacts stress dynamics. Importantly, the basket weave, even with its smaller high-stress regions, does not distribute stress as evenly as other weaves. This intriguing behavior offers a trade-off between minimizing high-stress regions and potentially compromising on impact energy absorption.
In summary, this study emphasizes the complex interactions between the number of layers, x-yarn density, and z-yarn paths and their effect on the mechanical performance of 3DOW composites under low-velocity impact. The insights gained suggest potential strategies for customizing these parameters to optimize the material’s performance for specific applications. The results also stress the importance of a deep understanding of each factor’s influence on material behavior, setting the stage for future advancements in composite design and utilization.
Author Contributions
Conceptualization, A.-F.M.S.; methodology, A.-F.M.S., W.X. and M.Z.; software, W.X.; validation, A.-F.M.S., W.X. and M.Z.; investigation, A.-F.M.S., W.X. and M.Z.; resources, A.-F.M.S.; data curation, W.X.; writing—original draft preparation, W.X.; writing—review and editing, A.-F.M.S. and M.Z.; visualization, W.X.; supervision, A.-F.M.S. and M.Z.; project administration, A.-F.M.S. and M.Z.; funding acquisition, A.-F.M.S. All authors have read and agreed to the published version of the manuscript.
Funding
This research received no external funding.
Institutional Review Board Statement
Not applicable.
Informed Consent Statement
Not applicable.
Data Availability Statement
The data is available upon request.
Acknowledgments
We acknowledge the use of Grammarly in correcting the grammatical errors in the manuscript.
Conflicts of Interest
The authors declare no conflicts of interest.
References
- Huang, T.; Wang, Y.; Wang, G. Review of the Mechanical Properties of a 3D Woven Composite and Its Applications. Polym. Plast. Technol. Eng. 2018, 57, 740–756. [Google Scholar] [CrossRef]
- Abtew, M.A. A comprehensive review on advancements, innovations and applications of 3D warp interlock fabrics and its composite materials. Compos. B Eng. 2024, 278, 111395. [Google Scholar] [CrossRef]
- Wen, F.; Qian, Y.; Gao, Y.; Zhou, X.; Lyu, L. 3D woven tubular composites with bamboo-structures for enhanced energy absorption: Designing, manufacturing and performance analysis. Polym. Compos. 2024. [Google Scholar] [CrossRef]
- Saleh, M.N.; Yudhanto, A.; Potluri, P.; Lubineau, G.; Soutis, C. Characterising the loading direction sensitivity of 3D woven composites: Effect of z-binder architecture. Compos. Part A Appl. Sci. Manuf. 2016, 90, 577–588. [Google Scholar] [CrossRef]
- Bilisik, K. Multiaxis 3D Woven Preform and Properties of Multiaxis 3D Woven and 3D Orthogonal Woven Carbon/Epoxy Composites. J. Reinf. Plast. Compos. 2009, 29, 1173–1186. [Google Scholar] [CrossRef]
- Hu, Q.; Memon, H.; Qiu, Y.; Wei, Y. The Failure Mechanism of Composite Stiffener Components Reinforced with 3D Woven Fabrics. Materials 2019, 12, 2221. [Google Scholar] [CrossRef] [PubMed]
- Peng, F.; Zhao, Z.; Xia, X.; Cakmak, M.; Vogt, B.D. Enhanced Impact Resistance of Three-Dimensional-Printed Parts with Structured Filaments. ACS Appl. Mater. Interfaces 2018, 10, 16087–16094. [Google Scholar] [CrossRef]
- Saeedifar, M.; Saleh, M.N.; El-Dessouky, H.M.; Teixeira De Freitas, S.; Zarouchas, D. Damage assessment of NCF, 2D and 3D woven composites under compression after multiple-impact using acoustic emission. Compos. Part A Appl. Sci. Manuf. 2020, 132, 105833. [Google Scholar] [CrossRef]
- Dewangan, M.K.; Panigrahi, S.K. Finite element analysis of hybrid 3D orthogonal woven composite subjected to ballistic impact with multi-scale modeling. Polym. Adv. Technol. 2021, 32, 964–979. [Google Scholar] [CrossRef]
- Kumar, S.; Kumar, A.; Devi, G.R.; Gupta, A.K. Preparation of 3D orthogonal woven C–SiC composite and its characterization for thermo-mechanical properties. Mater. Sci. Eng. A 2011, 528, 6210–6216. [Google Scholar] [CrossRef]
- Pan, Z.; Wang, M.; Ying, Z.; Cheng, X.; Wu, Z. Failure mechanism of Ω-shape 3D orthogonal woven composite component under transverse low-velocity impact and subsequent axial compression load. Int. J. Damage Mech. 2021, 31, 246–274. [Google Scholar] [CrossRef]
- Liu, L.; Shao, H.; Zhu, X.; Zhao, Z.; Zhang, G.; Luo, G.; Chen, W. Bird impact response and damage mechanism of 3D orthogonal woven composite aeroengine blades. Compos. Struct. 2023, 304, 116311. [Google Scholar] [CrossRef]
- Liu, L.; Yang, Z.; Ji, J.; Chen, G.; Luo, G.; Chen, W. Development and experimental verification of a modified constitutive model for 3D orthogonal woven composite under bird impact. Compos. Struct. 2023, 303, 116305. [Google Scholar] [CrossRef]
- Turner, P.; Liu, T.; Zeng, X. Collapse of 3D orthogonal woven carbon fibre composites under in-plane tension/compression and out-of-plane bending. Compos. Struct. 2016, 142, 286–297. [Google Scholar] [CrossRef]
- Castaneda, N.; Wisner, B.; Cuadra, J.; Amini, S.; Kontsos, A. Investigation of the Z-binder role in progressive damage of 3D woven composites. Compos. Part A Appl. Sci. Manuf. 2017, 98, 76–89. [Google Scholar] [CrossRef]
- Baucom, J.N.; Zikry, M.A. Evolution of Failure Mechanisms in 2D and 3D Woven Composite Systems under Quasi-Static Perforation. J. Compos. Mater. 2003, 37, 1651–1674. [Google Scholar] [CrossRef]
- Baucom, J.N.; Zikry, M.A. Low-velocity impact damage progression in woven E-glass composite systems. Compos. Part A Appl. Sci. Manuf. 2005, 36, 658–664. [Google Scholar] [CrossRef]
- Panwar, A.; Neelakrishnan, S. An evaluation of the loading direction sensitivity of 3D woven composite with novel web-shaped Z-binder architecture. Mater. Res. Express 2022, 9, 075601. [Google Scholar] [CrossRef]
- Ahmed, S.; Zheng, X.; Zhang, D.; Yan, L. Impact Response of Carbon/Kevlar Hybrid 3D Woven Composite under High Velocity Impact: Experimental and Numerical Study. Appl. Compos. Mater. 2020, 27, 285–305. [Google Scholar] [CrossRef]
- Luo, Y.; Lv, L.; Sun, B.; Qiu, Y.; Gu, B. Transverse impact behavior and energy absorption of three-dimensional orthogonal hybrid woven composites. Compos. Struct. 2007, 81, 202–209. [Google Scholar] [CrossRef]
- Ghosh, R.; De, S. Z-fiber influence on high speed penetration of 3D orthogonal woven fiber composites. Mech. Mater. 2014, 68, 147–163. [Google Scholar] [CrossRef]
- Miao, H.; Wu, Z.; Ying, Z.; Hu, X. The numerical and experimental investigation on low-velocity impact response of composite panels: Effect of fabric architecture. Compos. Struct. 2019, 227, 111343. [Google Scholar] [CrossRef]
- Midani, M.; Seyam, A.-F.; Saleh, M.N.; Pankow, M. The effect of the through-thickness yarn component on the in- and out-of-plane properties of composites from 3D orthogonal woven preforms. J. Text. Inst. 2019, 110, 317–327. [Google Scholar] [CrossRef]
- Dai, S.; Cunningham, P.R.; Marshall, S.; Silva, C. Influence of fibre architecture on the tensile, compressive and flexural behaviour of 3D woven composites. Compos. Part A Appl. Sci. Manuf. 2015, 69, 195–207. [Google Scholar] [CrossRef]
- Kumar, A.; Bijoya, D.; Behera, K.; Dash, A.K.; Behera, B.K. Role of weave design on the mechanical properties of 3D woven fabrics as reinforcements for structural composites. J. Text. Inst. 2017, 109, 952–960. [Google Scholar]
- Sun, J.; Dai, Y.; Huang, L.; Zhang, D.; Zhao, J. Micromechanisms and Characterization of Low-Velocity Impact Damage in 3D Woven Composites. Materials 2022, 15, 6636. [Google Scholar] [CrossRef] [PubMed]
- Nasrun, F.M.Z.; Yahya, M.F.; Ghani, S.A.; Ahmad, M.R. Effect of weft density and yarn crimps towards tensile strength of 3D angle interlock woven fabric. AIP Conf. Proc. 2016, 1774. [Google Scholar]
- Kohri, Y.; Takebe, T.; Minami, Y.; Kanai, T.; Takarada, W.; Kikutani, T. Structure and properties of low-isotacticity polypropylene elastomeric fibers prepared by sheath-core bicomponent spinning: Effect of localization of high-isotacticity component near the fiber surface. J. Polym. Eng. 2014, 35, 277–285. [Google Scholar] [CrossRef]
- Neale, G.; Dahale, M.; Yoo, S.; Toso, N.; McGarrigle, C.; Quinn, J.; Kelly, J.; McIlhagger, A.; Archer, E.; Harkin-Jones, E. Improved crush energy absorption in 3D woven composites by pick density modification. Compos. B Eng. 2020, 192, 108007. [Google Scholar] [CrossRef]
- Li, Z.G.; Li, D.S.; Zhu, H.; Guo, Z.X.; Jiang, L. Mechanical properties prediction of 3D angle-interlock woven composites by finite element modeling method. Mater. Today Commun. 2020, 22, 100769. [Google Scholar] [CrossRef]
- Hamouda, T.; Seyam, A.F.M.; Peters, K. Evaluation of the integrity of 3D orthogonal woven composites with embedded polymer optical fibers. Compos. B Eng. 2015, 78, 79–85. [Google Scholar] [CrossRef]
- Midani, M.; Seyam, A.F.; Pankow, M. The Effect of the Structural Parameters of 3D Orthogonal Woven Composites on their Impact Responses under Different Modes of Impact. Key Eng. Mater. 2018, 786, 215–223. [Google Scholar] [CrossRef]
- Gama, B.A.; Bogetti, T.A.; Gillespie, J.W., Jr. Progressive Damage Modeling of Plain-Weave Composites using LS-Dyna Composite Damage Model MAT162. In Proceedings of the 7th European LS-DYNA Conference, Salzburg, Austria, 14–15 May 2009. [Google Scholar]
- Gama, B.A.; Gillespie, J.W. Finite element modeling of impact, damage evolution and penetration of thick-section composites. Int. J. Impact Eng. 2011, 38, 181–197. [Google Scholar] [CrossRef]
- Xiao, J.R.; Gama, B.A.; Gillespie, J.W. Progressive damage and delamination in plain weave S-2 glass/SC-15 composites under quasi-static punch-shear loading. Compos. Struct. 2007, 78, 182–196. [Google Scholar] [CrossRef]
- Ince, M.E. Performance of Composites from 3D Orthogonal Woven Preforms in Terms of Architecture and Sample Location during Resin Infusion. Ph.D. Thesis, North Carolina State University, Raleigh, NC, USA, 2013. [Google Scholar]
- Yuan, Z.; Ma, W.; Xu, W.; Sun, Y.; Gu, B.; Chen, X. A numerical study on stress wave propagation in quasi-isotropic stacks of Dyneema® compliant composite laminates. Compos. Struct. 2023, 312, 116869. [Google Scholar] [CrossRef]
- Yuan, Z.; He, J.; Yang, Y.; Xu, P.; Lu, Z.; Xu, W. Estimating shear modulus of yarn on impact by lazy learning. Int. J. Mech. Sci. 2024, 270, 109074. [Google Scholar] [CrossRef]
- Jordan, J.B.; Naito, C.J.; Haque, B.Z. Progressive damage modeling of plain weave E-glass/phenolic composites. Compos. B Eng. 2014, 61, 315–323. [Google Scholar] [CrossRef]


Disclaimer/Publisher’s Note: The statements, opinions and data contained in all publications are solely those of the individual author(s) and contributor(s) and not of MDPI and/or the editor(s). MDPI and/or the editor(s) disclaim responsibility for any injury to people or property resulting from any ideas, methods, instructions or products referred to in the content. |
© 2024 by the authors. Licensee MDPI, Basel, Switzerland. This article is an open access article distributed under the terms and conditions of the Creative Commons Attribution (CC BY) license (https://creativecommons.org/licenses/by/4.0/).