Abstract
The application of arresters is critical for the safe operation of electric grids against lightning. Arresters limit the consequences of lightning-induced over-voltages. However, surge arrester protection in electric grids is challenging due to the intrinsic complexities of distribution grids, including overhead lines and power components such as transformers. In this paper, an optimal arrester placement technique is developed by proposing a multi-objective function that includes technical, safety and risk, and economic indices. However, an effective placement model demands a comprehensive and accurate modeling of an electric grid’s components. In this light, appropriate models of a grid’s components including an arrester, the earth, an oil-immersed transformer, overhead lines, and lightning-induced voltage are developed. To achieve accurate models, high-frequency transient mathematical models are developed for the grid’s components. Notably, to have an accurate model of the arrester, which critically impacts the performance of the arrester placement technique, a new arrester model is developed and evaluated based on real technical data from manufacturers such as Pars, Tridelta, and Siemens. Then, the proposed model is compared with the IEEE, Fernandez, and Pinceti models. The arrester model is incorporated in an optimization problem considering the performance of the over-voltage protection and the risk, technical, and economic indices, and it is solved using the particle swarm optimization (PSO) and Monte Carlo (MC) techniques. To validate the proposed arrester model and the placement technique, real data from the Chopoghloo feeder in Bahar, Hamedan, Iran, are simulated. The feeder is expanded over three different geographical areas, including rural, agricultural plain, and mountainous areas.
1. Introduction
Lightning is a transient phenomenon with a high-current electric discharge, and it induces hazardous over-voltages in electric equipment in distribution grids. Lightning can strike in two ways, including cloud-to-ground events (so-called indirect lightning) and at phase-conductor/tower-shield wires (direct lightning). Also, back-flashovers occur in distribution overhead lines (DOHLs) that appear as temporary line-to-ground faults that can be cleared by auto-re-closers.
Over-voltage due to lightning strikes to an overhead distribution line can cause damage to expensive grid equipment, mainly to transformers, and they also raise human safety issues. For this reason, zinc oxide-ZnO surge arresters are used in DOHLs to bypass lightning currents to the ground. Surge currents, probabilistic distributions, flashover rates, and arrester modeling are vital challenges in distribution-grid lightning protection. Further, several parameters need to be considered for improving lightning performance such as earth resistance, tower height, and line arrester placement. In this light, the optimal placement of a line arrester is essential for protecting lines, equipment, and humans from lightning over-voltages in distribution grids. Further, selecting an insulation level for a distribution grid is critical, and it is based on the following factors: (1) neutral earth conditions, (2) the lightning arrester and its characteristics, (3) the distance between the arrester’s location and the equipment to be protected, and (4) the safety margins.
Past research has studied lightning protection problems and possible solutions. A method based on technical and economical parameters for the optimal placement of a surge arrester in a distribution grid has been presented [1]. The optimization of a surge arrester’s location based on statistical analyses of surges and mathematical techniques to find the minimum risk of failure rate is represented in [2]. A cost-effective solution is proposed in [3] based on a genetic algorithm to find the optimum location for a surge arrester in a power network to minimize the global risk to the grid and to improve reliability. The method proposed in [4] enhances power supply security by considering risk constraints and reducing the number of surge arresters to protect the grid against lightning effects. An artificial neural network method is proposed in [5] to optimize the number of surge arresters and their locations. The presented method was based on genetic algorithms, and an economic approach was taken into account using an evaluation of the cost of an insulation flashover. A method based on an optimization algorithm using fuzzy logic techniques was proposed in [6,7] for surge arrester placements in distribution grids, and this method worked with the known risks of failure.
Another critical issue is the calculation of induced voltages due to lightning over the equipment of a distribution grid. Regarding this, references [8,9] aimed at defining a methodology for evaluating the lightning performance of a system of overhead distribution lines. The crucial characteristics of lightning include its waveshape and velocity and the I2t of the lightning, and these were considered in these works. In [10], a theoretical method for mitigating lightning over-voltages on distribution networks is presented. In this study, lightning-induced voltages and transferred-lightning surges through distribution transformers were considered using a combined method to achieve an accurate estimate of the lightning over-voltages on the distribution grids. In [11], lightning characteristics were modeled by a normal probability distribution, and the probability distribution of the peak lightning-induced over-voltages was determined by applying the Monte Carlo (MC) method considering the probability distributions of the peak stroke currents, return stroke velocities, and distance between the overhead lines and the striking points. In [12], the finite-difference time-domain (FDTD) method was proposed to estimate the induced over-voltage into a control cable by the ground grid.
Many researchers have also proposed component modeling using both low and high frequencies to analyze lightning impacts on distribution grids. In [13], the FDTD method was used for a transient grounding resistance (TGR) analysis of the Faraday’s contour path. In [14], researchers improved a transient grounding behavior analysis by applying a rigorous electromagnetic model and a realistic waveform of lightning current pulses.
Transformers are the most critical and expensive components in distribution grids. Therefore, transient modeling and, consequently, transformer lightning protection for both low and medium frequencies are essential. In this light, ref. [15] proposed a model for the calculation of transferred-lightning over-voltages in transformers. The model was developed based on a frequency–response analysis, along with the application of the four-terminal network theory called the black-box model. The authors of [16] presented a high-frequency circuit for an oil-immersed transformer model with three serially connected LC parallel circuits operating with several MHz to several MHz. In [17,18], the authors reviewed transformer models to simulate low- and mid-frequency transients. For the sake of minimizing the relative error between the calculated and manufacturer’s measured residual voltage peak values for lightning, an improved self-adaptive particle swarm optimization (ISAPSO) algorithm was developed for estimating the best set of surge arrester model parameters in [19,20].
In most studies for surge arrester placement in distribution grids, only one or two components are considered in the modeling. Further, a comprehensive multi-objective index has not been considered in existing studies. To bridge the research gap, the contributions of our paper are listed as follows:
- (1)
- A comprehensive modeling is presented and a new algorithm for the intelligent protection of distribution grids is proposed. The proposed method considers the inherent complexity of distribution grids including feeders and critical grid components such as transformers, surge arresters, and loads.
- (2)
- In the modeling stage, lightning and flashover rates are determined by mathematical formulations in the time domain and using the Anderson method. Then, the calculation of random values for surge peak current magnitude is performed by MC in 80,000 iterations.
- (3)
- A new surge arrester model is proposed using technical data from Pars, Tridelta, and Siemens manufacturers. The proposed model is compared with the IEEE, Fernandez, and Pinceti models. For detailed and optimal surge arrester placement in the distribution grid, all grid components including the arrester, earth, oil-immersed transformer, overhead lines, and induced voltage due to lightning are modeled in high frequency.
- (4)
- A multi-objective function is developed considering the performance of the over-voltage protection, risk, and economics indices and the optimization problem is solved utilizing particle swarm optimization (PSO) and MC methods.
- (5)
- To validate the proposed method and the developed lightning arrester model, the Chopoghloo distribution grid feeder in Bahar, Hamedan, in Iran is used as the case study, in three different geographical areas, including rural, agricultural, and mountain areas, in three scenarios.
The rest of this paper is organized as follows: System modeling is presented in Section 2 by modeling the surge arrester considering the earth, oil-immersed transformer, overhead line, and lightning-induced over-voltage. The proposed surge arrester model is presented in Section 3. Risk modeling and estimation in two parts including the risk of failure of insulation and arrester is presented in Section 4. Proposed smart protection is explained in Section 5 by a multi-objective function including technical and economic indices and constraints including voltage at the component location and basic insulation level (BIL). The case study and results are presented in Section 6 by simulating the 20 kV Bahar, Hamedan, feeder Chopoghloo local grid located in the west of Iran as the local grid expanded in rural, agricultural, and mountainous areas.
2. Modeling and Methodology
Accurate modeling of grid components and risk assessment is essential for the effective placement and insulation costs of relevant protection devices. In this section, the modeling of grid components such as the earth, oil-immersed transformer, overhead lines, and lightning-induced over-voltage is considered. Notice that modeling of the vertical ground wires of the surge arresters is neglected because their length and impedance are too small compared to the other distribution network components.
2.1. Lightning Modeling
Lightning can be considered a current source whose shape is depicted by the Heidler function [21] or the Rusck formula [22]. In the IEEE standard (std. C62.45) [23], the double exponential and the triangular waveforms are used to represent lightning return stroke currents. In this study, the test waveform presented in the IEEE std. C62.45 [23] is used as follows:
where is maximum lightning current, is first-stroke time, and is second-stroke time. Parameters corresponding to the fast and slow lightning are presented in Table 1. The Heidler model is also obtained as follows [21]:
where Ip is the peak current, is a correction factor of the peak current, and is the current steepness factor, with and being the time constants determining the current rise.

Table 1.
Steep front of a lightning flashover.
2.2. Anderson Method
For handling the probabilistic distribution, the following expression is adopted based on the (Anderson) probability. The probability of a first-stroke current peak value that exceeds a certain value in the IEEE std. C62.45 [23] is given as
where is the probability that the first return stroke has a peak current that exceeds , which is the prospective first return stroke peak current (kA). Various values of are computed in Table 2.
Table 2.
The probability of a first-stroke current peak value in Anderson’s equation.
2.3. Monte Carlo Method
Monte Carlo simulations are often used when the calculation procedure is based on a probabilistic approach. Many calculation procedures in the protection of the distribution grids have been verified using MC simulations as a popular technique [24,25]. In this paper, MC is used to calculate random values for surge peak current magnitude.
Some essential steps in the MC procedure are summarized as follows:
- The calculation of the random values for surge peak current magnitude.
- The calculations of over-voltage and lightning flashover.
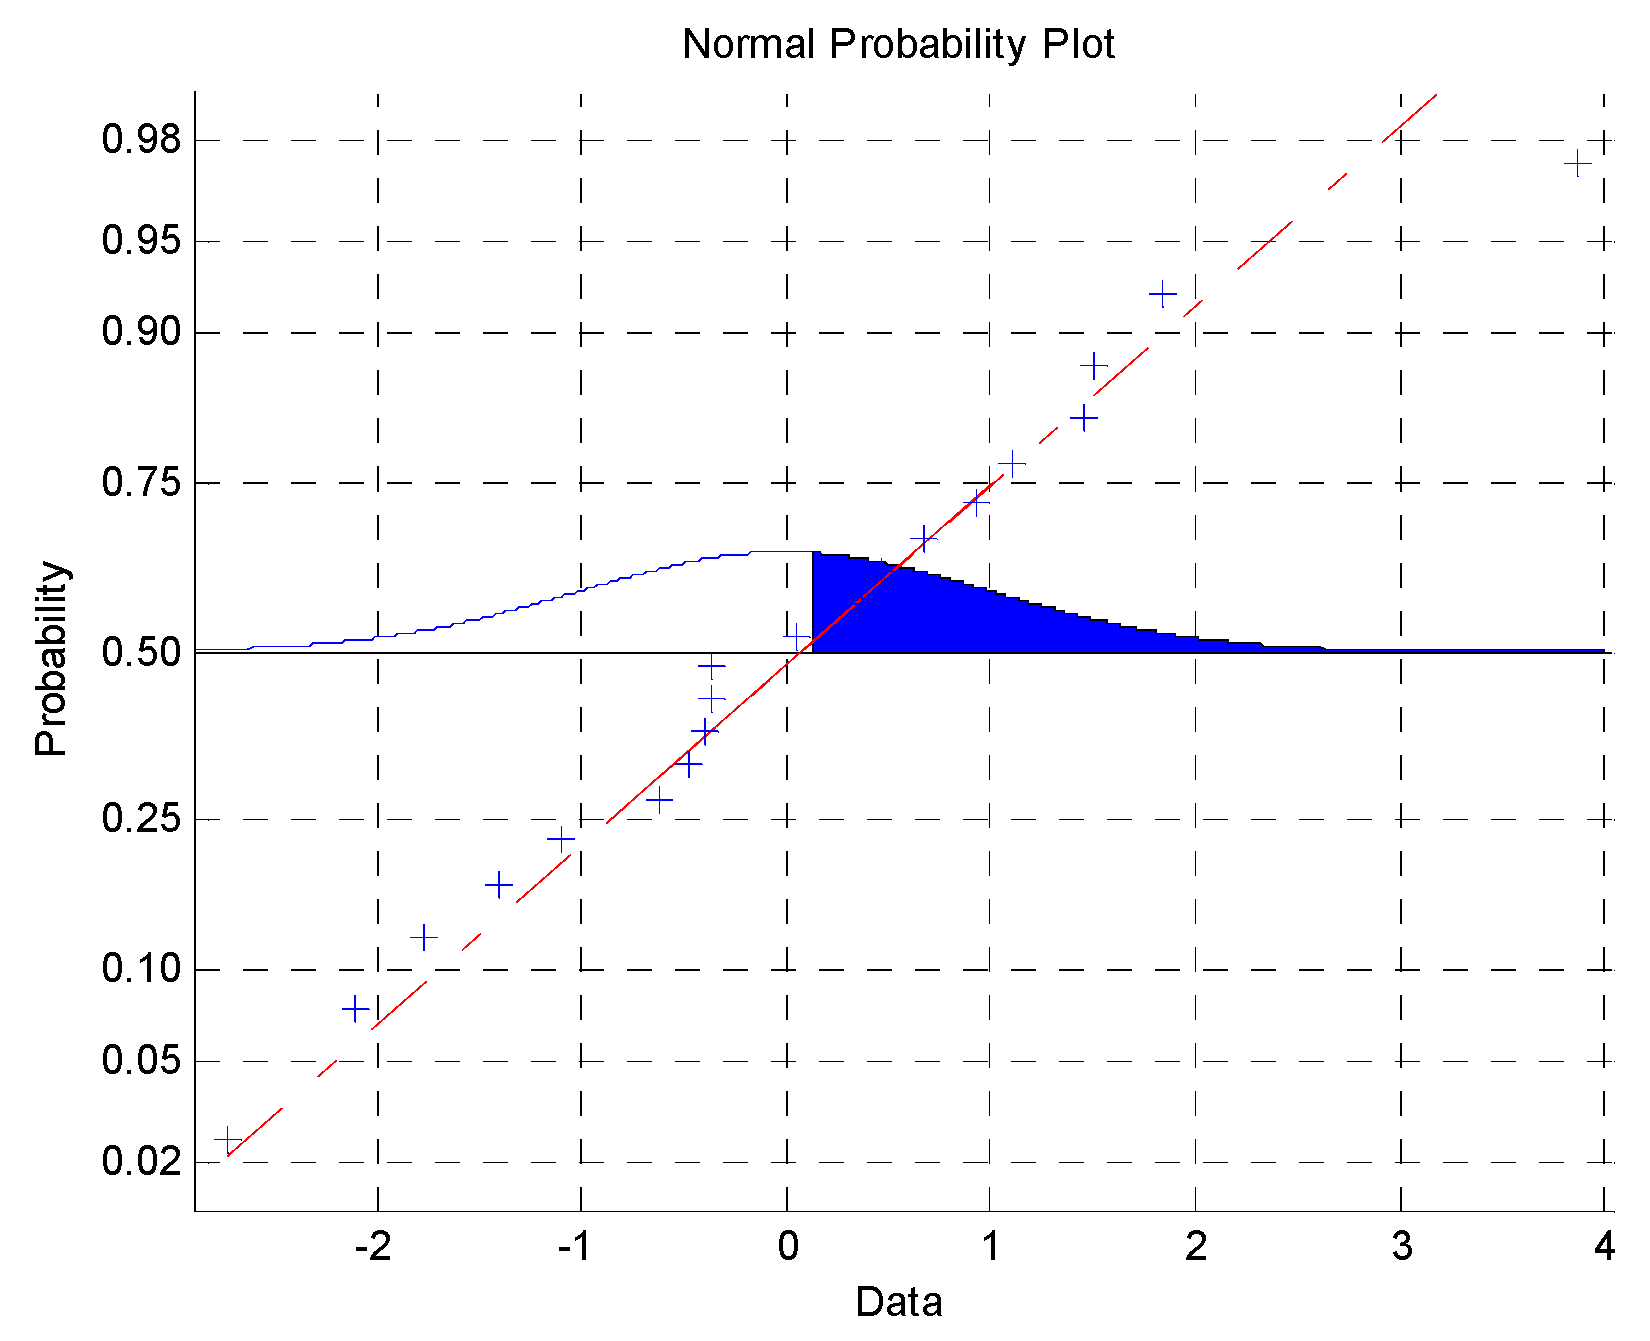
- The convergence of the MC method is checked by comparing the probability density function of all random variables with their theoretical functions and the procedure is stopped when they match within an error margin of 5%. The probability of the peak current magnitude is shown in Figure 1.
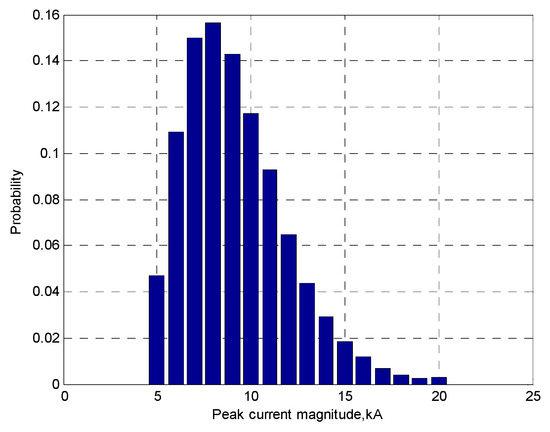 Figure 1. Distribution of stroke current to phase conductors that caused flashover in Monte Carlo method (80,000 episodes).
2.4. Flashover Rate Calculation
The ground flash density Ng for temperate areas may be estimated based on the Koranic level [21,22] and IEEE std. C62.45 [23] as follows:
where Ng is the ground flash density in flashes per km2 per year, and is the number of days with thunder per year.
2.5. Metal Oxide Arrester Modeling and Results Comparison
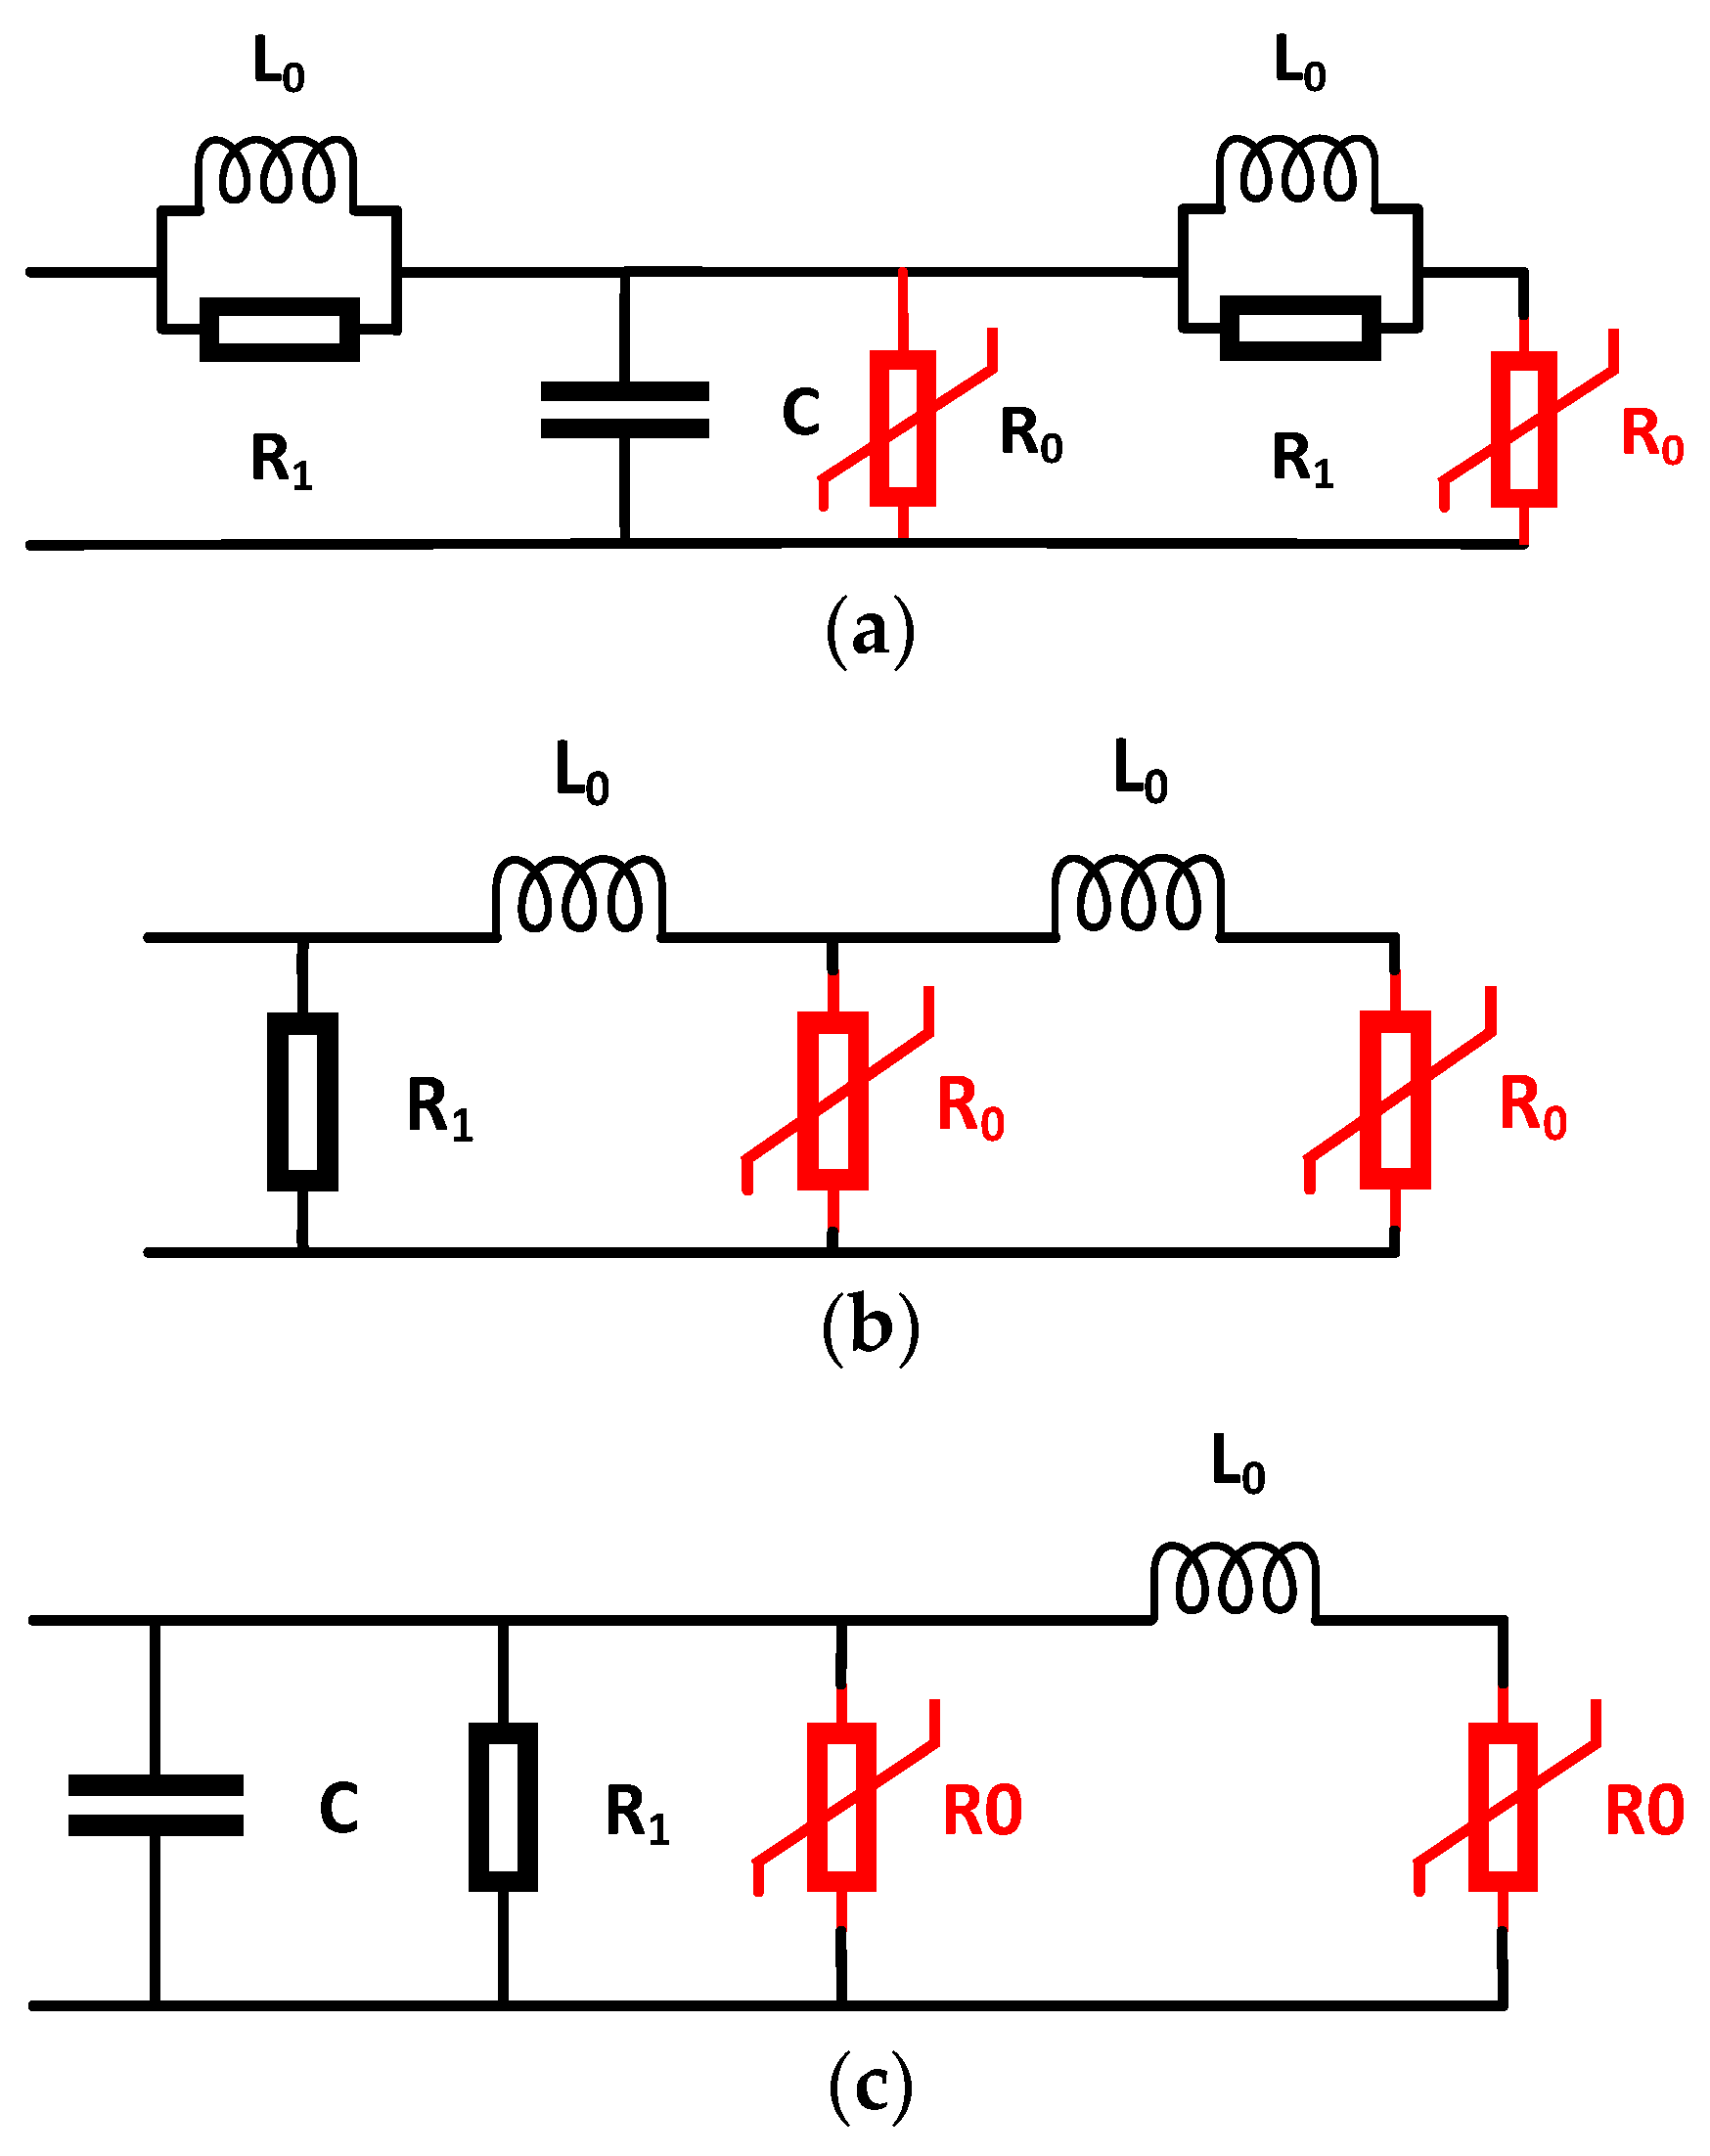
Metal oxide surge arresters, as important protective devices, have been widely used in distribution grids to reduce lightning effects and enhance power supply reliability. For this reason, various arrester models have been developed to demonstrate the frequency-dependent behavior of the surge arresters [26] such as (1) the IEEE model, in Figure 2a; (2) the Pinceti–Giannettoni model, in Figure 2b; and (3) the Fernandez–Diaz model, in Figure 2c.

Figure 2.
(a) IEEE model. (b) Pinceti–Giannettoni model. (c) Fernandez–Diaz model.
In the IEEE arrester modeling, parameters including and , , and are determined according to technical data provided by the manufacturer and Equations (4)–(14) as follows [12,13]; results are shown in Table 3a.
where is the height of the arrester and is the number of capsule arresters in the slander of the arrester.
Table 3.
Determination of surge arrester parameters in IEEE, Pinceti, and Fernandez models based on technical data of the Siemens, Tridelta, and Pars companies; (a) IEEE model, (b) Pinceti model, (c) Fernandez model.
In the Pinceti–Giannettoni arrester modeling, parameters including and in are estimated according to technical data provided by the manufacturer as follows [1,3]; results are shown in Table 3b.
where is the nominal voltage of the arrester, is the voltage on the arrester in 10 kA and the 8/20 s waveform in kV, and R1 = 1 MΩ.
In the Fernandez arrester modeling, and are estimated by technical data provided by the manufacturer in the 8/20 s test wave shape.
By using (12) and (13), and technical data provided by the manufacturer, the equilibrium points = are calculated [1,2,3], and is estimated, where V and I are provided by the manufacturer; R1 = 1 MΩ. is obtained [1,3]:
where results are shown in Table 3c. It should be noticed that in the Fernandez model, the ratio of the currents and over and remains constant for the entire voltage range of their protection characteristics. With this additional constraint, the voltage increases between the input terminals depending on the inductance , which is obtained using the selection curves of the percent increase in the residual voltage for different values of inductance .
Equations (5)–(14) and technical data provided by the surge arrester for Siemens, Tridelta, and Pars manufacturers are used for the evaluation and defining of the best operation of various surge arrester models. The models have been simulated in PSCAD software, and results including voltage in phase to phase, phase to ground, lightning point, and neutral are given in Table 4. For this reason, various models in Siemens/Germany including 3EK4-300-1CM4 models; Tridelta/Germany including SBK 27/5, SBK 27/10.1, HE-I 24, and HE 24/R models; and Pars/Iran including PAP 25T9D, PAW 25S6D, and PAV 25S6D models are selected as the case study. These models are used in distribution grids. The results of Table 4 show that the Pinceti model in the Pars company has relatively good performance compared to others.
Table 4.
Simulation results in PSCAD in IEEE, Pinceti, and Fernandez models based on technical data of the Siemens, Tridelta, and Pars companies; (a) IEEE model, (b) Pinceti model, (c) Fernandez model.
3. Proposed Component Modeling
3.1. Surge Arrester
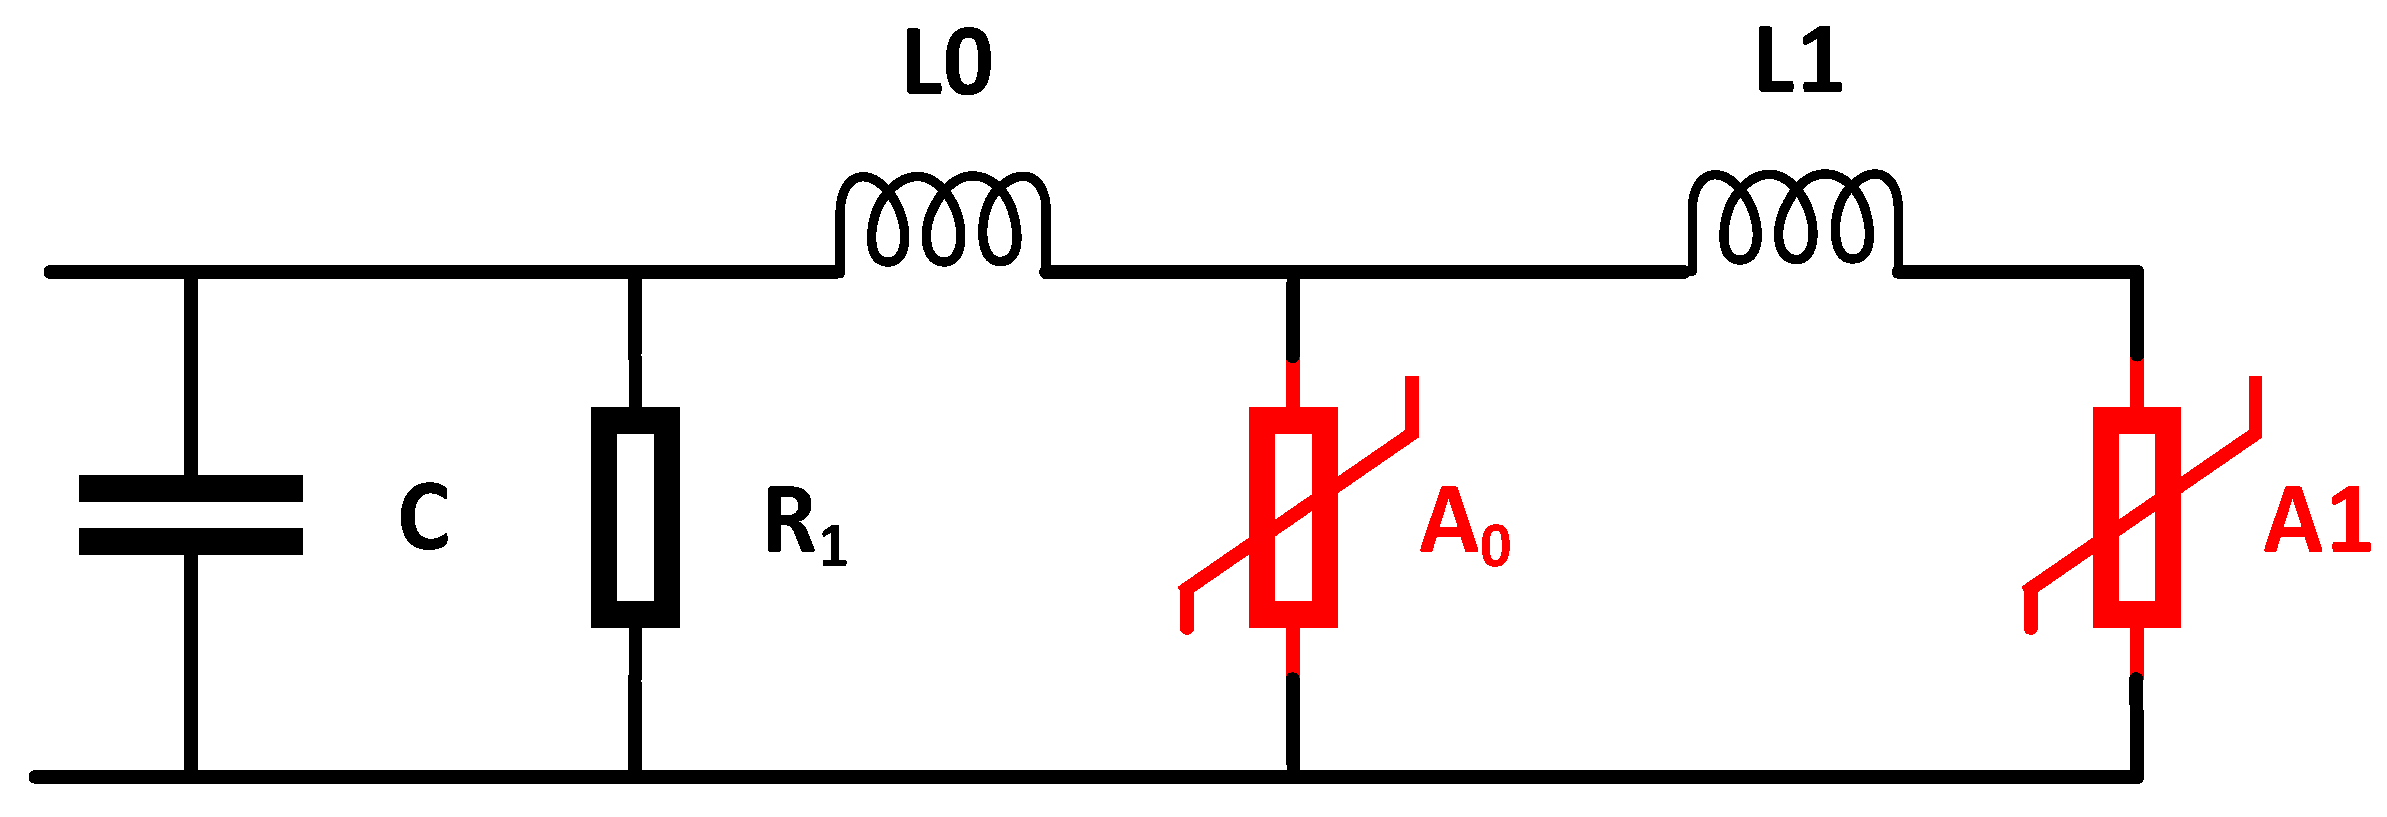
Based on the results of Table 3 and Table 4, the proposed surge arrester model is shown in Figure 3.

Figure 3.
Proposed surge arrester model.
Following the technical data of the Pars company and the proposed surge arrester model, parameters A0 and A1 are determined as follows according to Fernandez arrester modeling:
These determined parameters are most similar to standard models presented in EMTP/2018 and PSCAD/4.5 software, as the default models. Also, parameters V and I are provided by the manufacturer, and L0 and L1 are determined as follows according to the Pinceti model:
where R1 = 1 MΩ and capacitance in the presented model according to the IEEE model is
The determined parameters of the proposed model are given in Table 5.
Table 5.
Parameters of the proposed surge arrester model.
3.2. Earth Modeling in Transient Mode
A high-frequency model of a ground electrode is suggested in [27]. This circuit is illustrated in Figure 4.
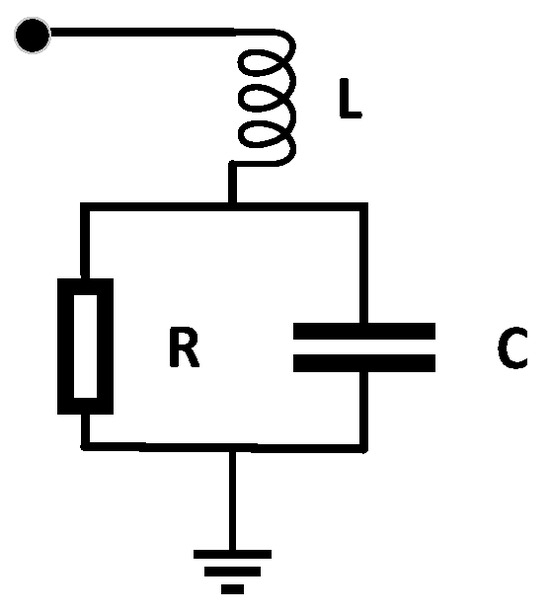
Figure 4.
Lumped-parameter equivalent circuit of ground electrode.
An earthing rod component of this circuit can be calculated using the following formulas [14]:
where is the resistance, is inductance, and is capacitance for the ground electrode. is the length, and is the diameter of the ground electrode.
3.3. Oil-Immersed Distribution Transformer Modeling
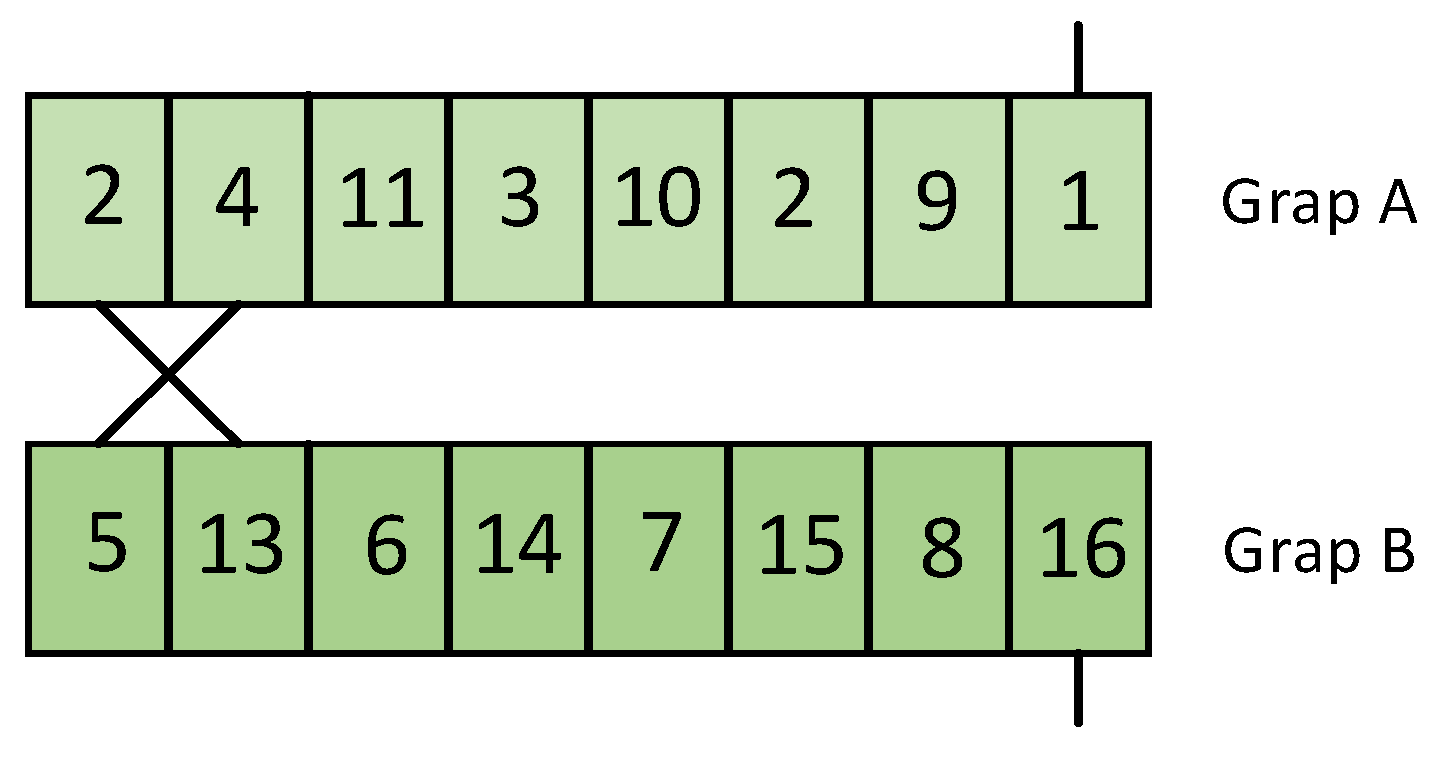
For modeling the oil-immersed distribution transformer in a high-frequency surge, a model based on interleaved disk winding of a single-phase transformer is given from the presented methods in [17] and extended to the three-phase transformer, based on the stored energy method presented in [27,28]. Capacitance in both ends of the winding section shown in Figure 5 is written as
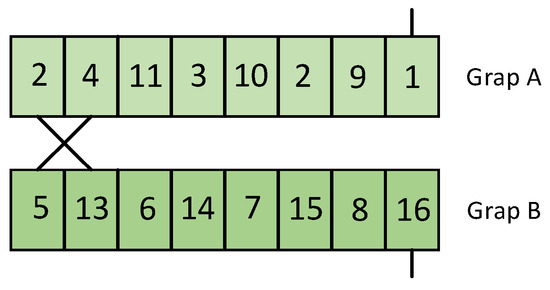
Figure 5.
Construction of an interleaved disk winding.
In this process, as shown in Figure 5, sections A (primary) and B (secondary) are like a transmission line model with capacitance C and inductance L. Consequently, the capacitance between two phase conductors is written as Equation (21), and the equivalent model is shown in Figure 6. The number of locations where conductors face each other is (n − 1) per section.
where is the relative permittivity of the turn-to-turn insulation, is the vacuum permittivity, D is the average winding diameter, b is the axial conductor width, and d is the turn-to-turn insulation thickness. The L is given by n/2 turns:
where is vacuum magnetic permeability.

Figure 6.
Equivalent circuit of interleaved disk winding; (a) detailed circuit and (b) simplified circuit.
In Figure 6, is the section-to-section capacitance; are section-to-section equal (simplified) inductance and capacitance, respectively. For the three-phase oil-emersed transformer model, according to Equations (23)–(25), all parameters are phase multipliers.
3.4. Overhead Distribution Lines
Maximum frequency, which can be presented by a Pi-cell corresponding length of the overhead distribution lines (l), is written as follows [28,29]:
where L and C are the inductance and the capacitance per unit length, respectively. The overhead distribution line length should be smaller than the following [5]:
where v is the velocity of the electromagnetic wave as
If the line is switched immediately in parallel to a capacitance of the feeding system side, this leads to an infinite current due to the direct connection of two capacitors if the two initial voltages are different. To avoid this problem, a resistor in the order of the surge impedance of the line should be connected in series with the first shunt capacitance of the first Pi-cell.
3.5. Lightning-Induced Over-Voltage Calculations by Chowdhuri–Gross Formula
One of the destructive phenomena in the distribution grids is the lightning stroke, which can cause a permanent or a transient fault. Due to the importance and sensitivity of the loads and grid equipment in over-voltages, adequate knowledge of the indirect and direct lightning phenomenon and its effects is fundamental. In practical studies, e.g., [30] and [1], a direct lightning stroke and its effects are investigated and formulated. For these reasons, in this study, Chowdhuri and Gross direct lightning stroke over-voltage equations are used as Equations (32)–(39). This phenomenon is shown in Figure 7, where is the line height, and is the horizontal distance between the lightning channel and the line. The closed-form solution, proposed by Chowdhuri and Gross [29,30], has been obtained starting with a coupling model developed by Chowdhuri and Gross themselves known as the “Chowdhuri–Gross model”. The coupling Equations are (29)–(31).
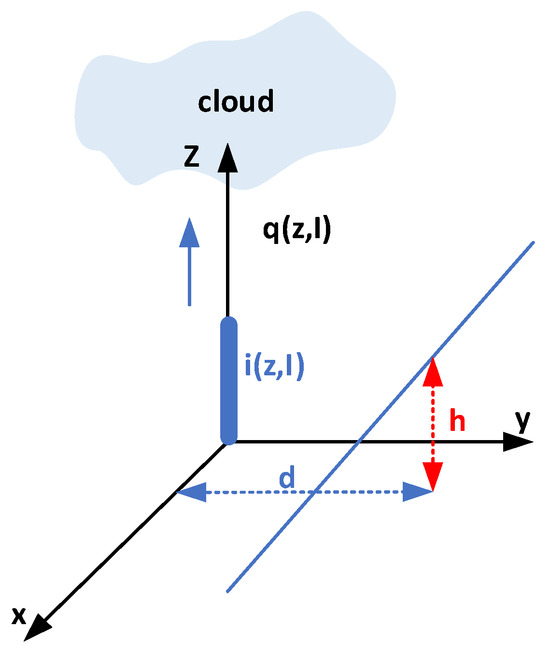
Figure 7.
Lightning-induced voltage model—initially charged channel.
To solve coupling Equations (29) and (30), Chowdhury and Gross made the following approximation:
where is the free-space light velocity (), is the line height, is the return stroke current, is the ratio between return stroke velocity and the light speed, , and is the horizontal distance between the lightning channel and the line.
As can be seen in Figure 8a, the maximum amplitude over-voltage in the direct lightning stroke is , and in Figure 8b, we can see that an increase in lightning distance is equal to a decrease in over-voltage due to the direct lightning stroke. On the other hand, if the line is protected by arresters, the induced voltage developed on grid equipment such as disconnectors and T-off connections without arresters can be calculated by
where is the lateral distance from the horizontal line to the vertical lightning stroke ground termination, is the return stroke velocity (), is the residual voltage of the arrester, is the span length (or distance between the lightning hit point and grid equipment), and is the lightning peak current.
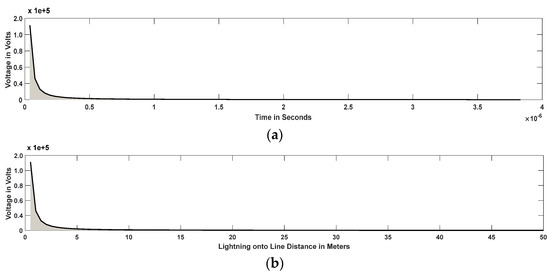
Figure 8.
Indirect lightning over-voltages in Chowdhury and Gross model; (a) voltage time and (b) voltage distance.
3.6. Flashover Rate
Based on the IEEE standard IEEE1410 [31], a lightning strike occurs when , where CFO is critical flashover voltage in 50% probability.
assuming that , , and is the average number of chronic flashes.
Final Strike Point (Lightning to Phase Line).
Based on IEEE 1410-2004 [31], the final strike point is written as
4. Risk Modeling
In practice, many random phenomena follow a normal distribution probability density function that is shown in the normal probability function p(v) and the probability density function of over-voltage , which are shown in Figure 9.
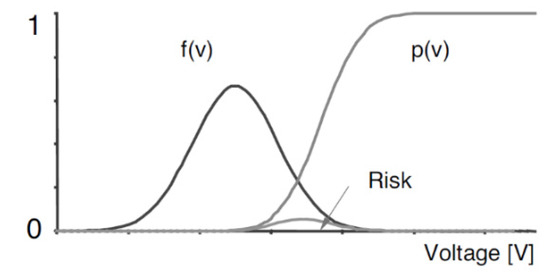
Figure 9.
The risk of damage to the component’s distribution network.
4.1. Risk of Failure of Insulation
In this section, the estimation method for the risk of failure of insulation due to lightning over-voltage in a distribution grid is presented. Due to the random nature of the lightning over-voltage, the probability density function is investigated. We can compute an electromagnetic transient program to obtain the magnitude of the lightning over-voltages by Equations (32) and (33) and the MC method in the grid nodes. In this study, lightning over-voltage in a distribution grid is the Gaussian density function and can be estimated in terms of the mean value and the standard deviation as Equation (42).
where is the probability density function of over-voltage, is over-voltage with probability density equal to 50%, and is the standard deviation. In other words, is a voltage at the first partial discharges in the insulation start and is a voltage where this discharge becomes a maximum value. The discrete probability of lightning discharge is
To estimate the over-voltages induced by lightning, two parameters including the peak value of the current and the rise time are considered. Using these parameters in (42) and (43), the maximum over-voltage set can be found in the PSCAD/4.5 software for a distribution grid node with a set of parameters obtained in the MC method, as shown in Figure 8.
The risk in the event of a direct hit by a lightning conductor is calculated according to the following equation:
where . Similarly, the risk value in the thunder stroke near the overhead line is
where is the probability density of over-voltage due to an indirect lightning stroke.
4.2. Risk of Failure of Arrester
The surge arrester placement is a challenging problem. This is because surge arrester parameters, grid components, the area of the lightning strokes, and lightning characteristics are complex, critical, and probabilistic parameters [32]. To estimate the risk of surge arrester failure, induced over-voltage into the grid components and risk formula (46) can be replaced by (47) and (48). Additionally, the lightning energy has a normal density function as follows:
where is the probability density of an energy occurrence, E50% is the energy for which the probability density of an occurrence is 50%, and is the standard deviation.
The probability of failure of the arrester F() can be approximated by a Weibull cumulative distribution:
where is the rated energy capacity and is the energy withstand capacity for the probability of failure . Since the steep front of the lightning is faster than the tail duration, energy absorption is ignored in consistency with the peak current and tail duration of lightning strokes.
4.3. Risk of the Network
The global risk is obtained as follows:
where is the global risk of the network, Ri is the calculated risk of each node, and n is the number of exciting nodes. For the protection of expensive and critical components in different grid nodes, the accurate estimation of the global risk is obtained, where the weighted risk estimation method is presented in Equation (47). In this method, more costly and more critical components have a greater weight.
where and and n are as defined previously. and are the critical and economic indices showing the weights of connected nodes corresponding to the most important node.
4.4. Global Risk Calculation
For the multi-component protection of proposed feeders, the ratio of their protection must be considered. For this reason, the allowable insulation failure value for each component is determined according to the degree of their importance over all feeders. According to Equations (51) and (52), failure risk of grid components considering the Monte Carlo method for the determination of maximum lightning current is shown in Figure 10. Global risk is written as
where R1 to Rn are risk values in the 1 to proposed area. The probability risk index R(i) determines the importance of all areas concerning probability risk; that is,
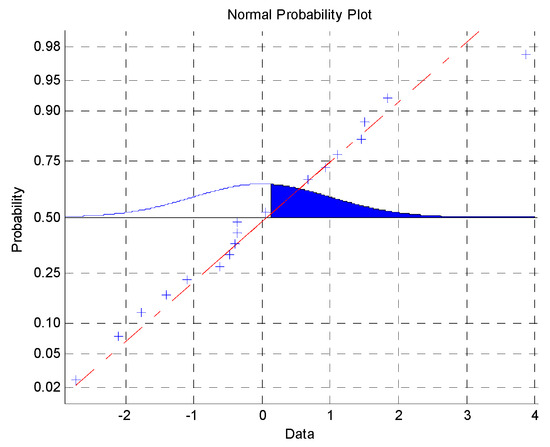
Figure 10.
Failure risk of network component considering Monte Carlo method for determination of maximum lightning current.
5. Proposed Smart Protection
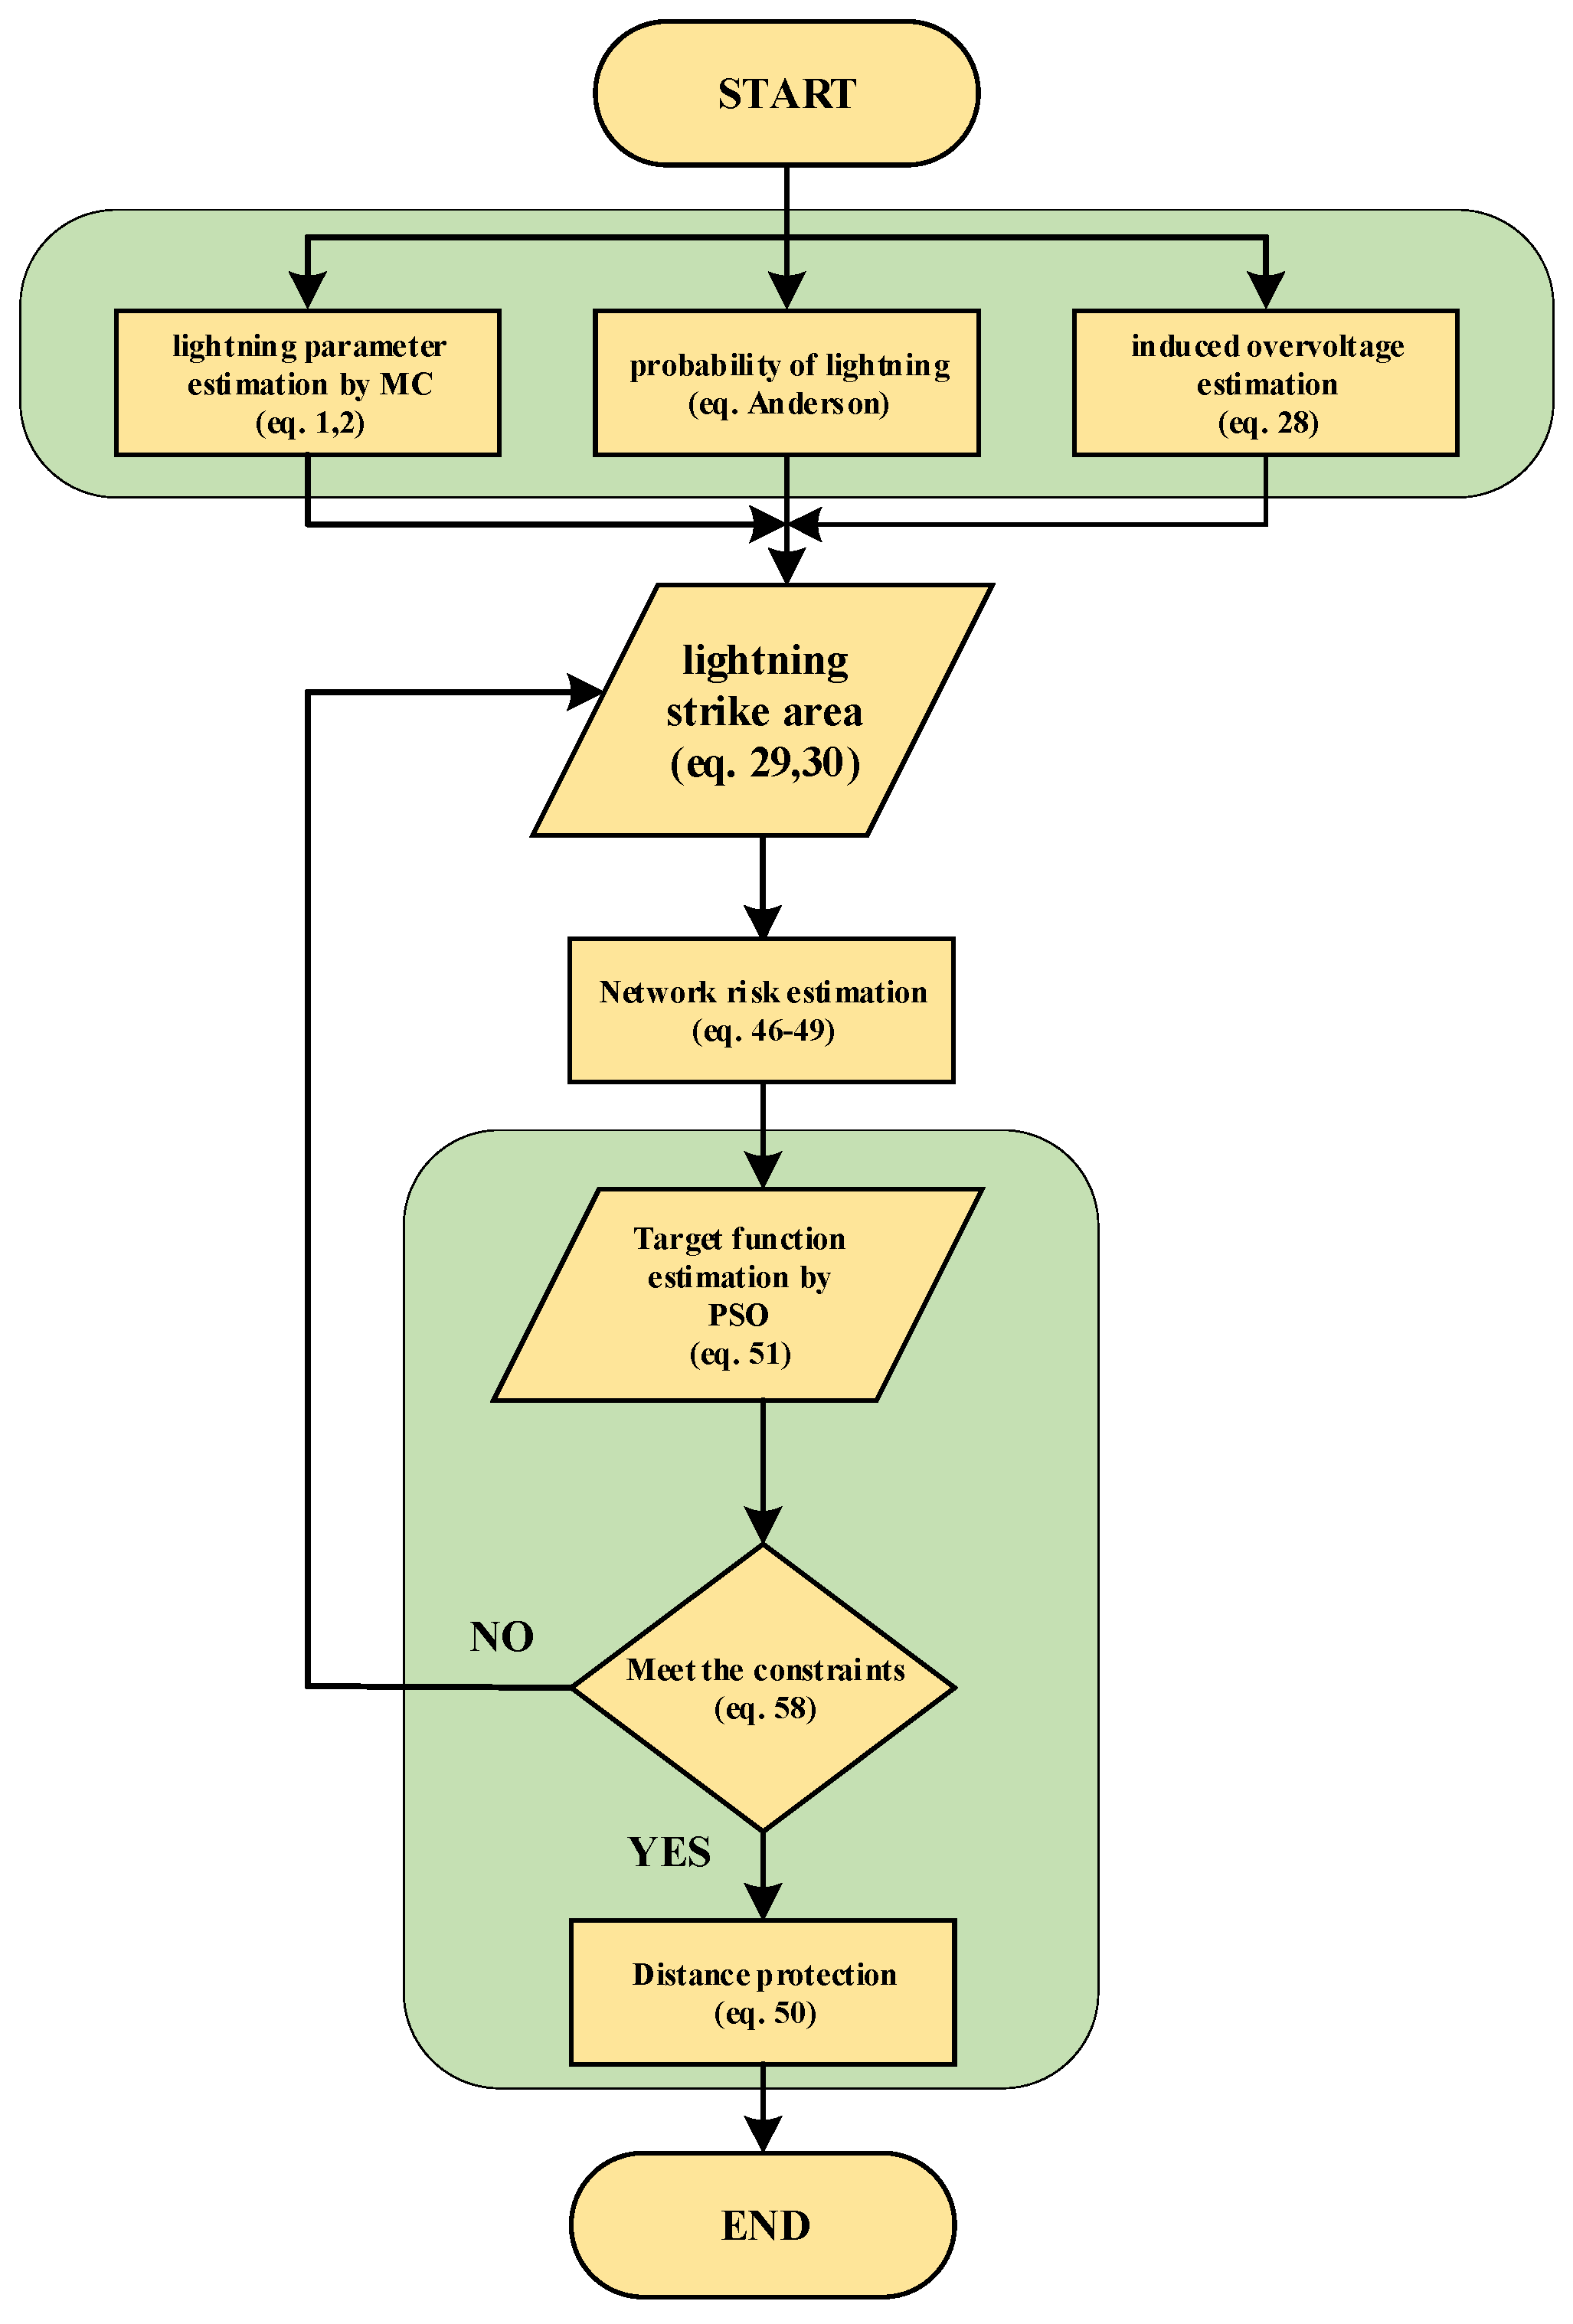
The proposed smart protection procedure is described in Figure 11. The following objective function is considered to minimize the number of arresters in the grid. The optimal arrester placement (and their distances to grid components) is determined by the proposed smart method utilizing the PSO and MC techniques. PSO is a popular heuristic optimization technique used to cope with NP-harness and non-convexity of various engineering problems [33,34,35,36,37]. Also, the MC method is used to estimate the lightning parameters.

Figure 11.
Flowchart of proposed smart protection in distribution networks’ optimal arrester placement (green boxes are the smart method).
5.1. Objective Function
In this proposed smart method, the output results of the MC are considered as inputs of the PSO algorithm for optimizing the objective function :
where denotes the area index, is the global risk in area ; and technical index and economic index are presented in the sequel.
5.2. Technical Index
This index determines the importance of all nodes for substation protection based on other indices, including the above-sea level and the substation compression ratio in the Chopoghloo feeder . This index is normalized based on the total number of substations.
5.3. Economic Index
This economic index determines installation and operating costs including repair and maintenance costs and the annualized cost of the investment .
where
where IR is the interest rate equal to 19%, Y is the term operation equal to 30 years, and CTI is the total costs of component investment in USD dollars; is maintenance cost and is annual investment in USD dollars.
5.4. Constraints
The voltage at the component location: The surge arresters must be located near the grid equipment especially when the facility has no adequate protection, and the substation is at the end of the feeder. In this case, the probability of direct lightning strikes is high, as there is no other line where the traveling wave voltage can be divided between lines. After entering the traveling wave to the substation or grid component, the voltage at the surge arrester location is up to the maximum amplitude of the surge. Also, the surge arrester current and initial input wave growth rate (lightning) will continue in the surge arrester. The initial peak of the input wave (lightning) is twice the amount of the surge voltage.
Over-voltage moves to the transformer or grid component and reaches that point. In other words, an increase in distance from the network component to the surge arrester may lead to the twice as high remaining voltage of the surge in the component location even to the peak of the surge.
If , T is the time of the surge traveling from the arrester to the grid component and is the required time for the arrester to voltage equal to its voltage protection. Then, the voltage at the component location is written as
where is the voltage at the component location, S is the input steep front wave slope, and is arrester voltage protection.
Basic Insulation Level—BIL: In this study, BIL = 125 kV is considered the second constraint.
6. Case Study and Results
6.1. Distribution Network Configuration
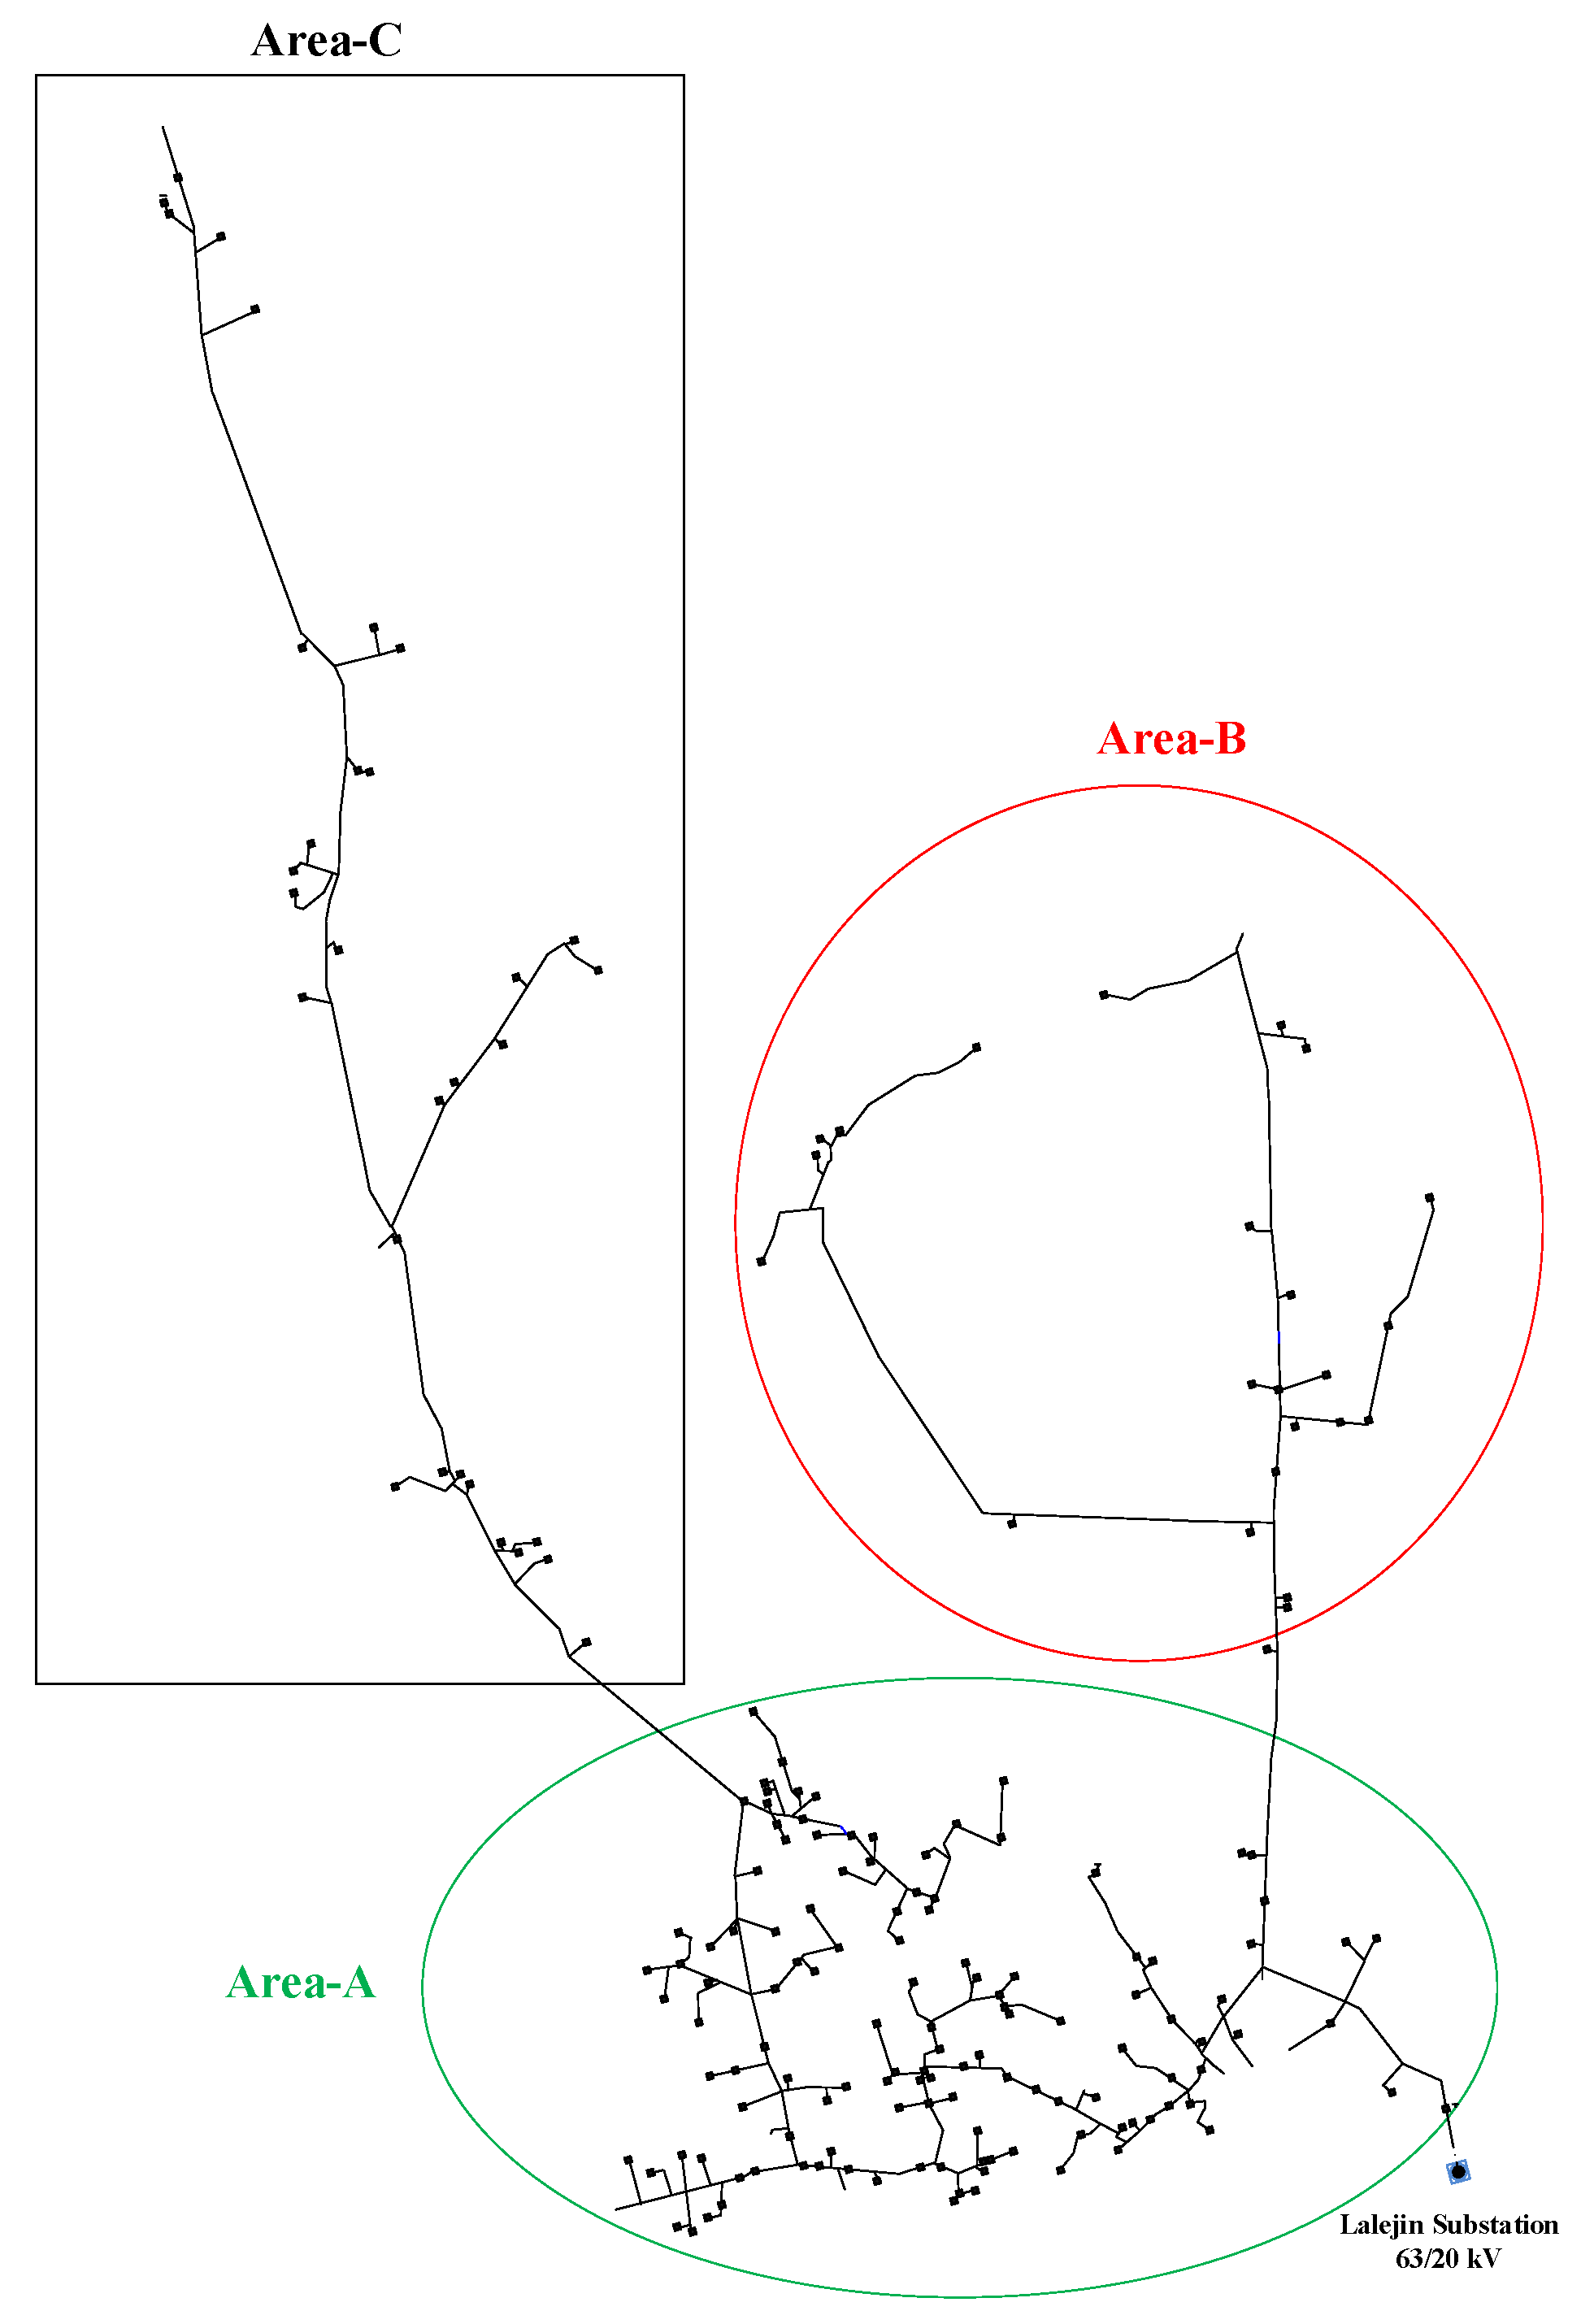
The proposed method has been applied to the 20 kV Bahar, Hamedan, feeder Chopoghloo local grid located in the west of Iran shown in Figure 12. The regional grid includes rural, agricultural plain, and mountain areas, in A, B, and C areas, respectively, and is used as an actual case study with a line length of 120 km. The BIL of insulation is 125 kV. This distribution network supplies rural areas consisting of 175 transformers with an average demand coefficient of 0.85. The presented method in this paper is general and applies to a system with varying demand coefficients in different areas including rural–agricultural plains, plains, and mountainous areas. However, because of the slow variation of the loads in the case study, the load of the system is modeled as an average value. Following Equations (29) and (30), , Ng = 17.502 flashover/km2/year, and A = 1334 km2.
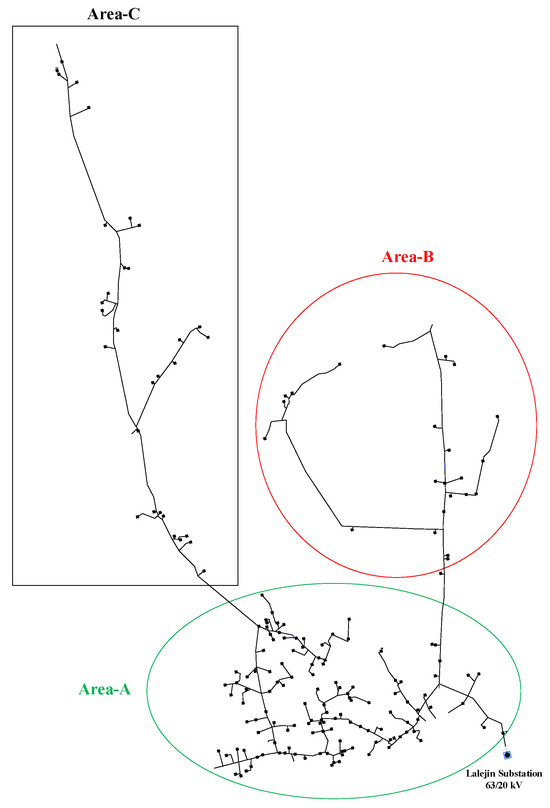
Figure 12.
Actual part of the Iran national grid, i.e., Bahar, Hamedan province-Chopoghloo in A, B, and C area.
Then, flashover/100 km/year.
And assuming that (Anderson equation),
In this paper, the selected case study is located in rural–agricultural and mountainous areas, and the latter has an adverse impact on lightning surges. The properties of these areas are presented in Table 6. Also, in this case study, the substation compression ratio has been considered for the first time for the proper protection of gird components at the distribution level. This is because surge arresters are typically installed for the protection of distribution transformers.
Table 6.
Properties of areas in the Chopoghloo feeder.
Due to the investment costs assigned for protection by the local power utility company, 175 sets of three-phase arresters have been selected to be installed on this network. Characteristics and the number of customers in each section are represented in Table 6. The optimization algorithm, over-voltage calculation, and risk analysis were coded in the MATLAB/2024 environment, whereas arrester modeling was obtained by PSCAD/EMTDC/4.5 simulation.
6.2. Simulation Results
The main novelty of the proposed method is the arrester placement, i.e., optimal determining of the distance between the component and surge arrester on the Chopoghloo feeder by minimizing Equation (50) and determining protective arrester ratios shown in Table 7 and Table 8. This assumes that arrester sets are installed in all the component’s phases.
Table 7.
Simulation results in a, b, and c area.
Table 8.
Determining protective arrester ratios in various manufactories—in meters (m). VP denotes the arrester voltage protection.
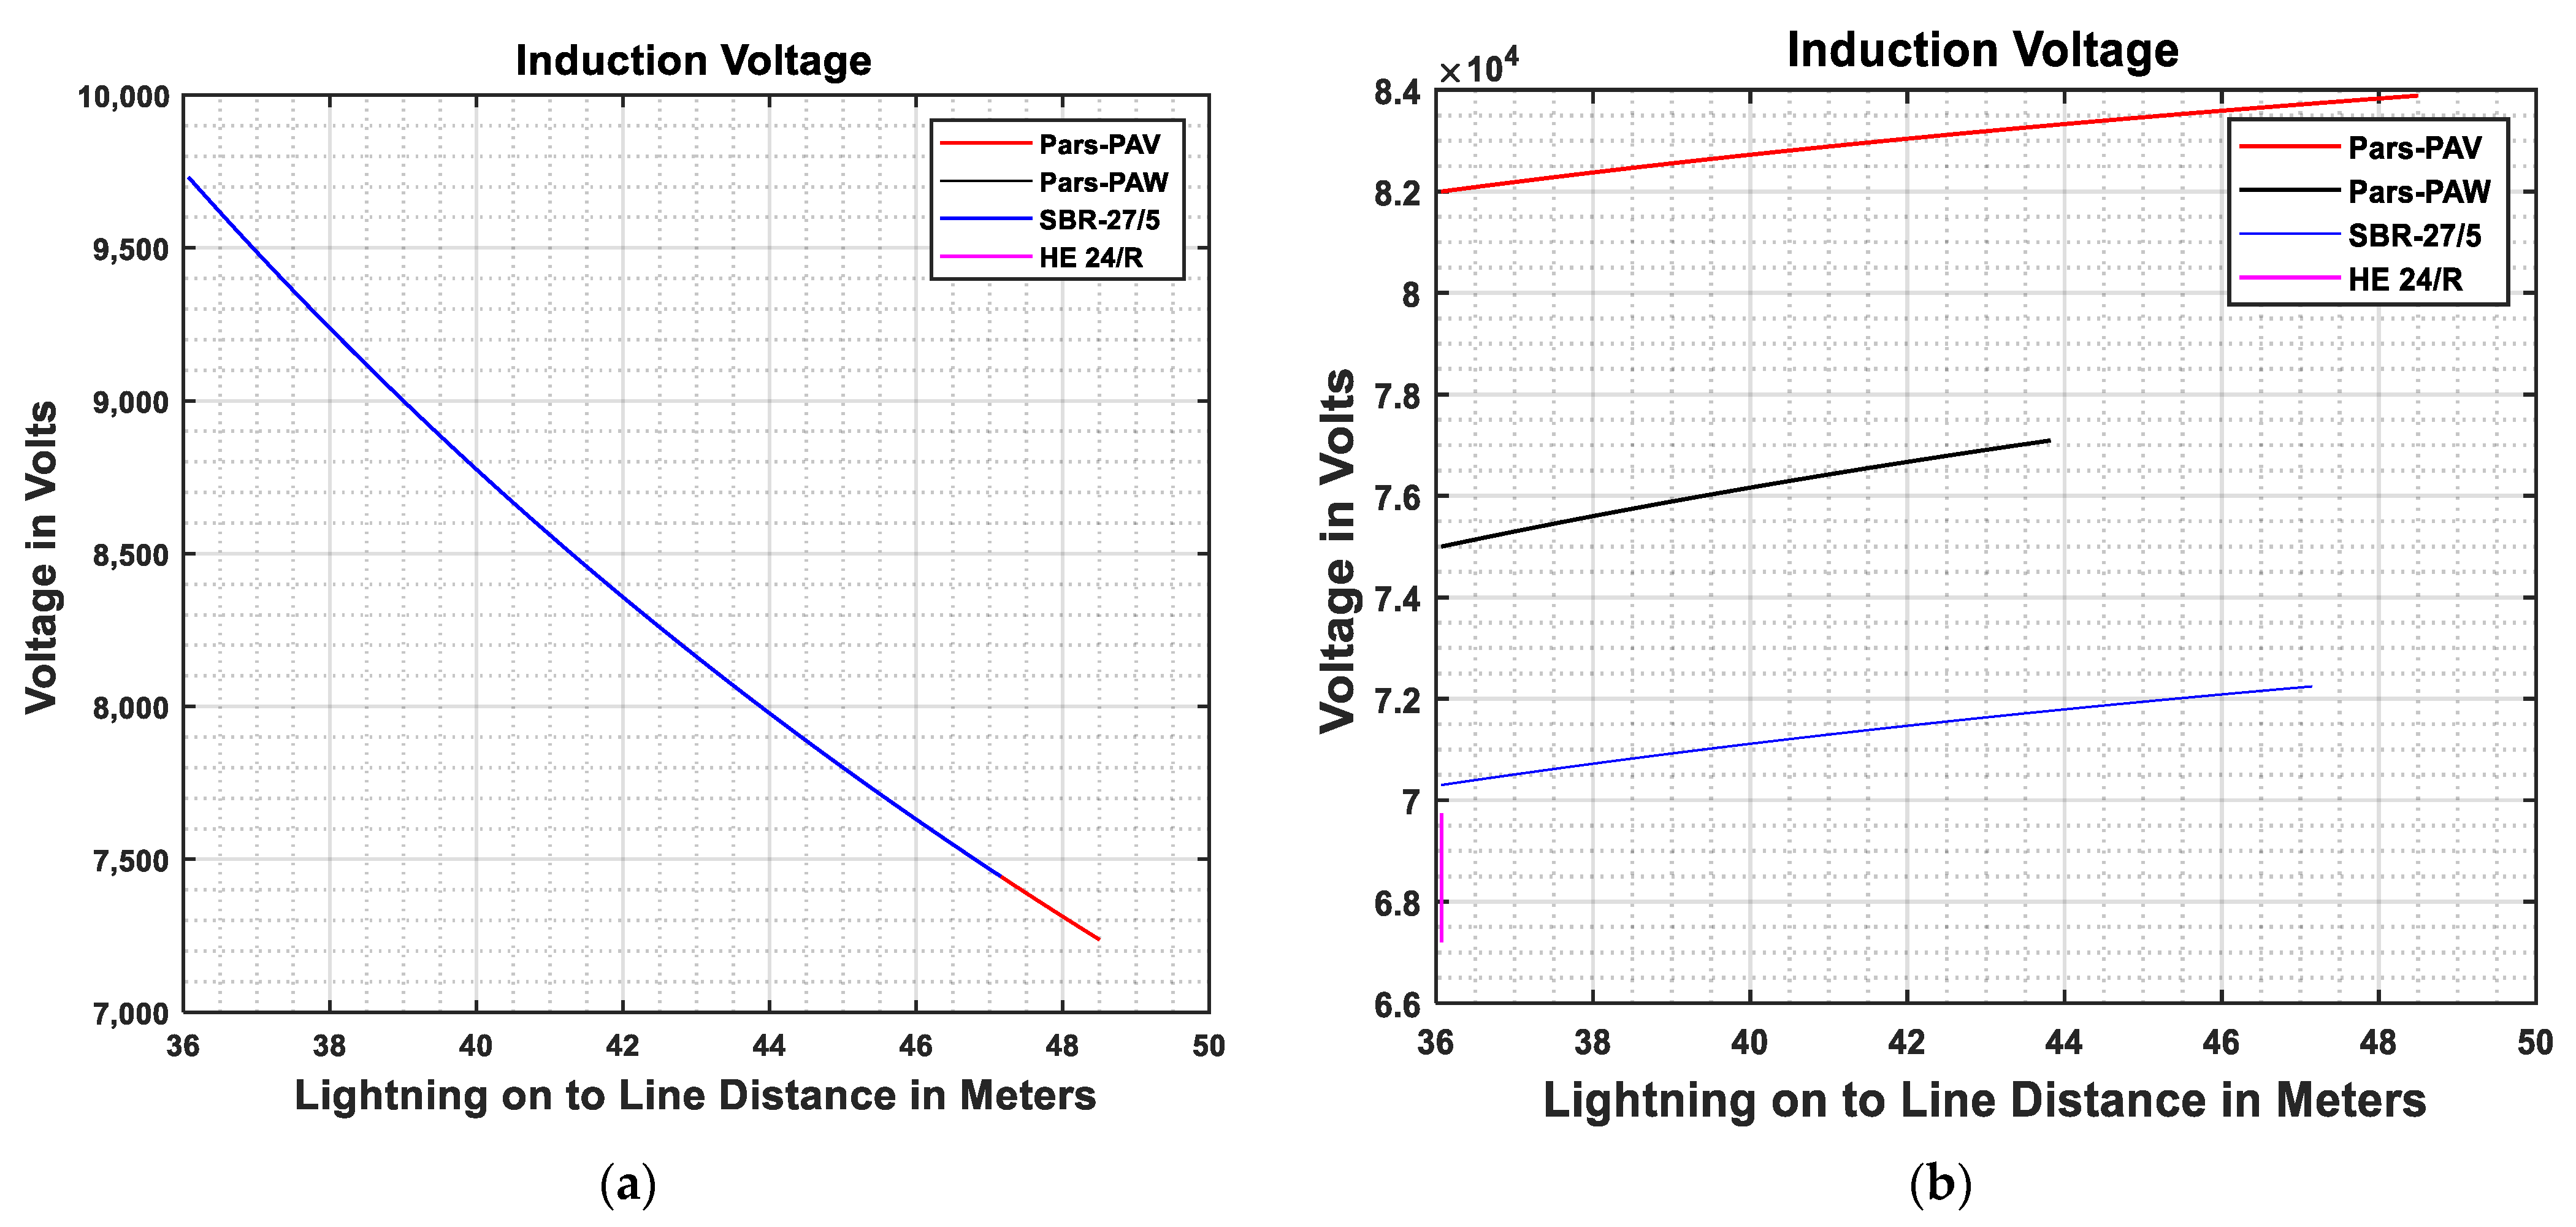
The induced voltage on grid equipment, as the result of lightning strikes to the ground, is calculated in different arresters’ models including PAV, PAW, SBR-27/5, and HE-24/R, according to Equation (39). Also, the results in Table 8 present maximum radius protection in different arrester models calculated by PSO and represented in Figure 13a. On the other hand, for the validation of the results in Table 8, the maximum induced over-voltage (Vm) in Equation (39) in different arresters’ models is calculated and the results are shown in Figure 13b. The maximum induced over-voltage (Vm) and V are due to indirect lightning strikes in the maximum distance for arrester placement; see results in Table 8. Figure 13 and Table 8 show that the maximum induced over-voltage in the overhead lines is less than the distribution network, BIL = 125 kV. The applications of deep learning techniques [38,39] are considered to extend this study.
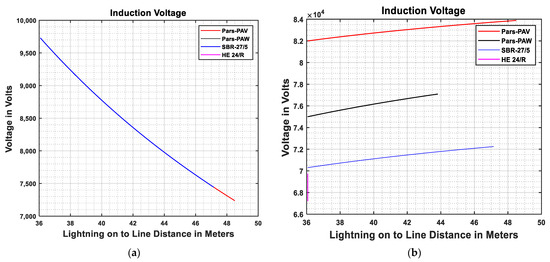
Figure 13.
Induced over-voltage on the overhead line; (a) lightning strikes the ground and (b) network equipment is protected by the arrester in maximum distance in Table 8.
7. Conclusions
In this paper, effective and smart lightning arrester protection in the distribution grid was investigated. The objective was to reduce the destructive effects of lightning and increase the reliability of the grid by providing a smart protection method. Quantitatively, the objective was reducing induced over-voltage due to lightning to less than BIL = 125 kV while satisfying risk constraints and minimizing financial costs. Therefore, a multi-objective function was developed considering accurate technical electrical modeling, as well as risk and economic indices. To handle the nonlinearity and time complexity of the optimization problem, an optimization technique was developed utilizing the MC method and PSO algorithms.
To achieve accurate results, a new surge arrester model was developed and compared with three models including IEEE, Fernandez, and Pinceti in the PSCAD/4.5 software. The results were compared with three arrester manufacturers including Pars, Tridelta, and Siemens. For the validation of the proposed smart protection method used for the protection of the distribution grids, the Chopoghloo feeder in Bahar, Hamedan, in Iran in three areas including rural, agricultural plain, and mountain areas is used as a real case study. Simulations in PSCAD/4.5 and Simulink/MATLAB/2024 prove the validity of the proposed model. Results revealed that the Pars arrester has better performance than other companies for distribution grid protection.
The calculated optimal distance for surge arrester placement is 6.4 m to 46.8 m for Tridelta, 7.91 m to 49.13 m for Siemens, 5.06 m to 49.15 m for Pars/PAV, and 3.15 m to 48.5 m for Pars/PAW. As a consequence, the PAV Pars arrester has better performance than the other surge arresters. Results of the proposed method simulation show that the surge arrester in optimized distance from grid components meets the BIL, in 125 kV.
Author Contributions
Conceptualization, A.H.K.A. and H.D.; methodology, A.H.K.A. and M.E.; software, A.H.K.A.; validation, A.H.K.A. and M.E.; formal analysis, A.H.K.A. and M.E.; investigation, H.D.; resources, H.D.; data curation, A.H.K.A.; writing—original draft preparation, A.H.K.A.; writing—review and editing, M.E.; visualization, A.H.K.A.; supervision, H.D.; project administration, H.D.; funding acquisition, M.E. All authors have read and agreed to the published version of the manuscript.
Funding
This research received no external funding.
Data Availability Statement
The original contributions presented in the study are included in the article, further inquiries can be directed to the corresponding author.
Conflicts of Interest
The authors declare no conflicts of interest.
References
- Shariatinasab, R.; Safar, J.G.; Falaghi, H. Optimisation of arrester location in risk assessment in the distribution network. IET Gener. Transm. Distrib. 2014, 8, 151–159. [Google Scholar] [CrossRef]
- Orille-Fernandez, A.L.; Rodriguez, S.B.; Gotes, M.A.G. Optimization of surge arrester’s location. IEEE Trans. Power Deliv. 2004, 19, 145–150. [Google Scholar] [CrossRef]
- Shariatinasab, R.; Vahidi, B.; Hosseinian, S.H. Statistical evaluation of lightning-related failures for the optimal location of surge arresters on the power networks. IET Gener. Transm. Distrib. 2009, 3, 129–144. [Google Scholar] [CrossRef]
- Keaton, W.; Jayaweera, D. Risk constrained placement of surge arresters in smart power systems. In Proceedings of the 2015 IEEE Power & Energy Society General Meeting, Denver, CO, USA, 26–30 July 2015; pp. 1–5. [Google Scholar] [CrossRef]
- Cao, J.; Du, Y.; Ding, Y.; Lyu, J.; Qi, R.; Chen, M.; Andreotti, A. Lightning Protection with a Differentiated Arrester Configuration for Distribution Networks Using a Multi-objective Optimization Procedure. IEEE Trans. Power Deliv. 2023, 38, 2149–2159. [Google Scholar] [CrossRef]
- Orille, A.L.; Bogarra, S.; Grau, M.A.; Iglesias, J. Fuzzy logic techniques to limit lightning surges in a power transformer. Clin. Nutr. Suppl. 2003, 2, 6. [Google Scholar] [CrossRef]
- Cao, J.; Du, Y.; Ding, Y.; Qi, R.; Chen, M.; Li, Z.; Zhao, X.; Andreotti, A. Lightning Protection With a Differentiated Configuration of Arresters in a Distribution Network. IEEE Trans. Power Deliv. 2023, 38, 409–419. [Google Scholar] [CrossRef]
- Christodoulou, C.A.; Vita, V.; Mladenov, V.; Ekonomou, L. On the Computation of the Voltage Distribution along the Non-Linear Resistor of Gapless Metal Oxide Surge Arresters. Energies 2018, 11, 3046. [Google Scholar] [CrossRef]
- Borghetti, A.; Ishimoto, K.; Napolitano, F.; Nucci, C.A.; Tossani, F. Assessment of the Effects of the Electromagnetic Pulse on the Response of Overhead Distribution Lines to Direct Lightning Strikes. IEEE Open Access J. Power Energy 2021, 8, 522–531. [Google Scholar] [CrossRef]
- De Conti, A.; Silveira, F.H.; Visacro, S. Lightning overvoltages on complex low-voltage distribution networks. Electr. Power Syst. Res. 2012, 85, 7–15. [Google Scholar] [CrossRef]
- Mahmood, F.; Rizk, M.E.M.; Lehtonen, M. Risk-based insulation coordination studies for protection of medium-voltage overhead lines against lightning-induced overvoltages. Electr. Eng. 2019, 101, 311–320. [Google Scholar] [CrossRef]
- Tatematsu, A.; Yamanaka, A. Three-Dimensional FDTD-Based Simulation of Lightning-Induced Surges in Secondary Circuits With Shielded Control Cables Over Grounding Grids in Substations. IEEE Trans. Electromagn. Compat. 2023, 65, 528–538. [Google Scholar] [CrossRef]
- Chen, H.; Du, Y.; Yuan, M.; Liu, Q.H. Lightning-Induced Voltages on a Distribution Line With Surge Arresters Using a Hybrid FDTD–SPICE Method. IEEE Trans. Power Deliv. 2018, 33, 2354–2363. [Google Scholar] [CrossRef]
- Grcev, L. Lightning Surge Efficiency of Grounding Grids. IEEE Trans. Power Deliv. 2011, 26, 1692–1699. [Google Scholar] [CrossRef]
- Borghetti, A.; Morched, A.; Napolitano, F.; Nucci, C.A.; Paolone, M. Lightning-Induced Over voltages Transferred Through Distribution Power Transformers. IEEE Trans. Power Deliv. 2009, 24, 360–372. [Google Scholar] [CrossRef]
- Okabe, S.; Koto, M.; Ueta, G.; Saida, T.; Yamada, S. Development of high frequency circuit model for oil-immersed power transformers and its application for lightning surge analysis. IEEE Trans. Dielectr. Electr. Insul. 2011, 18, 541–552. [Google Scholar] [CrossRef]
- Martinez, J.A.; Mork, B.A. Closure on “Transformer Modeling for Low- and Mid-Frequency Transients—A Review”. IEEE Trans. Power Deliv. 2008, 23, 1697. [Google Scholar] [CrossRef]
- Das, A.K.; Fernandes, B.G. Estimation of the Resonance Frequencies Using an Electrostatic Energy Based Capacitance Model of a Two-Winding Medium/High-Frequency Transformer. IEEE Trans. Ind. Appl. 2022, 58, 5301–5316. [Google Scholar] [CrossRef]
- Dong, N.; Xie, Y.-Z.; Wu, Y.; Li, Z.; Canavero, F.G. An Equation-Based Dynamic Nonlinear Model of Metal-Oxide Arrester and Its SPICE Implementation. IEEE Trans. Circuits Syst. II Express Briefs 2023, 70, 2919–2923. [Google Scholar] [CrossRef]
- Brignone, M.; Delfino, F.; Procopio, R.; Rossi, M.; Rachidi, F. Evaluation of Power System Lightning Performance, Part I: Model and Numerical Solution Using the PSCAD-EMTDC Platform. IEEE Trans. Electromagn. Compat. 2017, 59, 137–145. [Google Scholar] [CrossRef]
- Heidler, F.; Cvetic, J.M.; Stanic, B.V. Calculation of lightning current parameters. IEEE Trans. Power Deliv. 1999, 14, 399–404. [Google Scholar] [CrossRef]
- Chowdhuri, P.; Anderson, J.G.; Chisholm, W.A.; Field, T.E.; Ishii, M.; Martinez, J.A.; Marz, M.B.; McDaniel, J.; McDermott, T.E.; Mousa, A.M.; et al. Parameters of lightning strokes: A review. IEEE Trans. Power Deliv. 2005, 20, 346–358. [Google Scholar] [CrossRef]
- Unahalekhaka, P. Simplified Modeling of Metal Oxide Surge Arresters, 11th Eco-Energy and Materials Science and Engineering (11th EMSES). Energy Procedia 2014, 56, 92–101. [Google Scholar] [CrossRef]
- Pinceti, P.; Giannettoni, M. A simplified model for zinc oxide surge arresters. IEEE Trans. Power Deliv. 1999, 14, 393–398. [Google Scholar] [CrossRef]
- Zeinoddini-Meymand, H.; Vahidi, B.; Naghizadeh, R.A.; Moghimi-Haji, M. Optimal Surge Arrester Parameter Estimation Using a PSO-Based Multiobjective Approach. IEEE Trans. Power Deliv. 2013, 28, 1758–1769. [Google Scholar] [CrossRef]
- Shariatinasab, R.; Safar, J.G.; Gholinezhad, J.; He, J. Analysis of Lightning-Related Stress in Transmission Lines Considering Ionization and Frequency-Dependent Properties of the Soil in Grounding Systems. IEEE Trans. Electromagn. Compat. 2020, 62, 2849–2857. [Google Scholar] [CrossRef]
- de Leon, F. Discussion of “Transformer Modeling for Low- and Mid-Frequency Transients—A Review. IEEE Trans. Power Deliv. 2008, 23, 1696–1697. [Google Scholar] [CrossRef]
- Faria da Silva, F.; Pedersen, K. Lightning surges in hybrid cable-overhead lines: Part I—Voltage estimation for shielding failure. Electr. Eng. 2022, 104, 3281–3294. [Google Scholar] [CrossRef]
- Andreotti, A.; Pierno, A.; Rakov, V.A. A New Tool for Calculation of Lightning-Induced Voltages in Power Systems—Part II: Validation Study. IEEE Trans. Power Deliv. 2015, 30, 334–341. [Google Scholar] [CrossRef]
- Andreotti, A.; Assante, D.; Mottola, F.; Verolino, L. An Exact Closed-Form Solution for Lightning-Induced Overvoltages Calculations. IEEE Trans. Power Deliv. 2009, 24, 1328–1343. [Google Scholar] [CrossRef]
- Du, Y.; Ding, Y. Lightning Surge Propagation on a Single Conductor in Free Space. IEEE Trans. Electromagn. Compat. 2017, 59, 119–127. [Google Scholar] [CrossRef]
- Cao, J.; Du, Y.; Ding, Y.; Li, Z.; Zhang, Y. Novel Evaluation of the Damage Rate of Surge Arresters Due to Lightning Stroke in a Distribution Network. In Proceedings of the 2022 36th International Conference on Lightning Protection (ICLP), Cape Town, South Africa, 2–7 October 2022; pp. 76–81. [Google Scholar] [CrossRef]
- Eskandari, M.; Li, L.; Moradi, M.H.; Siano, P.; Blaabjerg, F. Optimal Voltage Regulator for Inverter Interfaced Distributed Generation Units Part I: Control System. IEEE Trans. Sustain. Energy 2020, 11, 2813–2824. [Google Scholar] [CrossRef]
- Eskandari, M.; Li, L.; Moradi, M.H. Decentralized Optimal Servo Control System for Implementing Instantaneous Reactive Power Sharing in Microgrids. IEEE Trans. Sustain. Energy 2018, 9, 525–537. [Google Scholar] [CrossRef]
- Moradi, M.H.; Eskandari, M.; Hosseinian, S.M. Operational Strategy Optimization in an Optimal Sized Smart Microgrid. IEEE Trans. Smart Grid 2015, 6, 1087–1095. [Google Scholar] [CrossRef]
- Eskandari, M.; Savkin, A.V.; Fletcher, J. A Deep Reinforcement Learning-Based Intelligent Grid-Forming Inverter for Inertia Synthesis by Impedance Emulation. IEEE Trans. Power Syst. 2023, 38, 2978–2981. [Google Scholar] [CrossRef]
- Shariatinasab, R.; Safar, J.G. Probabilistic evaluation of lightning performance of overhead distribution lines using Monte Carlo method. In Proceedings of the 2012 Proceedings of 17th Conference on Electrical Power Distribution, Tehran, Iran, 2–3 May 2012; pp. 1–7. [Google Scholar]
- Sun, Z.; Eskandari, M.; Zheng, C.; Li, M. Handling Computation Hardness and Time Complexity Issue of Battery Energy Storage Scheduling in Microgrids by Deep Reinforcement Learning. Energies 2023, 16, 90. [Google Scholar] [CrossRef]
- Zheng, C.; Eskandari, M.; Li, M.; Sun, Z. GA−Reinforced Deep Neural Network for Net Electric Load Forecasting in Microgrids with Renewable Energy Resources for Scheduling Battery Energy Storage Systems. Algorithms 2022, 15, 338. [Google Scholar] [CrossRef]


Disclaimer/Publisher’s Note: The statements, opinions and data contained in all publications are solely those of the individual author(s) and contributor(s) and not of MDPI and/or the editor(s). MDPI and/or the editor(s) disclaim responsibility for any injury to people or property resulting from any ideas, methods, instructions or products referred to in the content. |
© 2024 by the authors. Licensee MDPI, Basel, Switzerland. This article is an open access article distributed under the terms and conditions of the Creative Commons Attribution (CC BY) license (https://creativecommons.org/licenses/by/4.0/).