Abstract
Automotive industries require constant technological development and the capacity to adapt to market needs. Hence, component suppliers must be able to adapt to persistent trend changes and technical improvements, acting in response to customers’ expectations and developing their manufacturing methods to be as flexible as possible. Concepts such as layout flexibility, management of industrial facilities, and building information modeling (BIM) are becoming ever more addressed within the automotive industry in order to envision and select the necessary information exchanges. Given this question and based on the gap in the literature regarding this subject, this work proposes a solution, developing a novel tool that allows the monitoring and assignment of newer/relocated equipment to the switchboards within a given industrial plant. The solution intends to increase the flexibility of production lines through the assessment, analysis, improvement, and reorganization of the electrical load distribution to develop projects accurately implying layout changes. The tool is validated with an automotive manufacturer. With the implementation of this open-source tool, a detailed electrical flow management system is accomplished, and it has proven successful and essential in raising levels of organizational flexibility. This has guaranteed the company’s competitiveness with effective integrated administration methods and tools, such as a much easier study upon inserting new/relocated equipment without production line breaks.
1. Introduction
This paper will address numerous articles from facility management (FM), building information modeling (BIM), automotive industry appliance of these tools and electrical management tools. There is effectively a literature gap concerning electrical management software applied to the automotive industry and it is intended with the following section to elucidate the reader regarding what has been investigated by other researchers in other scientific fields so it can be extrapolated to this case study.
FM is the strategic discipline of overseeing and maintaining physical spaces and assets to optimize the functionality and efficiency [1]. The International Facility Management Association (IFMA) [2] stated that it encompasses many responsibilities, such as maintenance, security, space planning, and cost management, while ensuring that workplaces, buildings, and infrastructure are safe, well-maintained, and conducive to productivity. Leygonie et al. [3] investigated the correspondences between as-built models and operation and maintenance (O&M) requirements to facilitate quality management activities for FM-BIM. Kang et al. [4] studied a capacitated service facility location problem with customer preference, where two mixed-integer programming (MIP) models were formulated and compared. A heuristic algorithm based on maximum flow estimation was proposed. The ISO 41001:2018 standard [5] defined FM as integrating multiple management fields to influence the effectiveness and productivity of economies, societies, communities and organizations, as well as the individuals interacting with the built environment. With the integration of technology (on behalf of the Internet of Things, IoT) that enables remote management with cloud-based platforms, BIM [6,7] has been addressed as a valuable asset that aids industrial managers in their work. In 2019, Gao and Pishdad-Bozorgi [8] showed that research on BIM for O&M is still in its early stages, and most of the current research has focused on energy management. Identifying interoperability in the BIM-O&M context was challenging, and adopting the National Institute of Standards and Technology (NIST)’s cyber-physical systems (CPS) framework was the starting point for addressing that issue. Three years later, Di Biccari et al. [9] reviewed BIM and building performance simulation (BPS) integration and interoperability, exploring the scripting to automate the information transfer between BIM and BPS environments, the model view definition (MVD) and the industry foundation classes (IFCs) schema extension approach. Xu et al. [10] applied a fuzzy analytic hierarchy process (FAHP), a hybrid genetic algorithm and discrete particle swarm optimization (H-GA-DPSO) based on a multi-level encoding method. Yilmaz et al. [11] developed a BIM capability assessment reference model (BIM-CAREM) and demonstrated its usability through multiple explanatory case studies. The results showed that the BIM capability of design, construction and FM processes varies within and across the companies. Deng et al. [12] presented a BIM-based framework for automating fabrication drawings for facade panels, converting 3D geometric information into 2D by a flattening process for curved panels. Wang et al. [13] aimed to improve the construction efficiency to ensure the infrastructure needs of urban development based on BIM digital twins (DTs) technology and found that the proposed model shows the best performance. In light of the automotive industry’s demand for continuous development and substantial adaptive capacity to meet market demands and uphold its prominent position in global industry, the evaluation of factors such as the best scalability in iterative calculation tests on the Flink platform, achieved through efficient memory management and an incremental iteration mechanism, assumes critical importance for ensuring operational excellence across facilities and their management within the global network. Pan and Stark [14] concluded that the impacts of changes are challenging for all original equipment manufacturers (OEMs) by developing a machine learning-based decision support solution with community detection and stacking algorithms applied to build more robust models. Djordjevic et al. [15] developed a fuzzy aggregate production planning (APP) model to minimize the production and logistics operations time. It was demonstrated that the uncertainty of the production output and customer demand deviation could have various impacts. Andres et al. [16] assessed the problem of information exchange required for collaborative manufacturing and planning processes at supply network levels. The collaborative manufacturing environments (CMData) were validated through their application in the automotive industry. Iaksch and Borsato [17] considered manufacturing process constraints from the beginning of the product development process (PDP) and developed a solution contributing to the digital evaluation, facilitating the decision-making regarding productive systems. The three great pillars of the automotive industry, focusing on organizational flexibility, are among the main reasons for the correct management and planning of manufacturing conveniences throughout the production chain. Einabadi et al. [18] proposed a simultaneous predictive maintenance (PdM) and preventive maintenance (PvM) planning problem of multi-machine and multi-component systems in the automotive industry, developing a new mathematical programming model.
Small and medium-sized companies with constant changes in the fabricated products and high equipment turnover in the production line layout require increased production flexibility [19,20]. Orchestrated cycle times, just-in-time (JIT) production, and logistics were only achieved with synchronous information exchanges within the organization and detailed knowledge of all the equipment and facilities. It is paramount to facilitate the design and redesign of the layouts of the various facilities, thus enhancing greater operational flexibility. Hribernik et al. [21] established a roadmap for the evolution of DTs by providing physical assets in the factory and throughout the product life cycle. Arnarson et al. [22] developed an intelligent layout design system using Industry 4.0 concepts and optimization, recurring to a mathematical model that provides the exact coordinates of reconfigurable manufacturing systems (RMSs). Using artificial intelligence (AI) [23] to search/optimize a layout configuration for the platform-based RMS, a digital model of the autonomous production unit (APU) was automatically generated from the solution optimization.
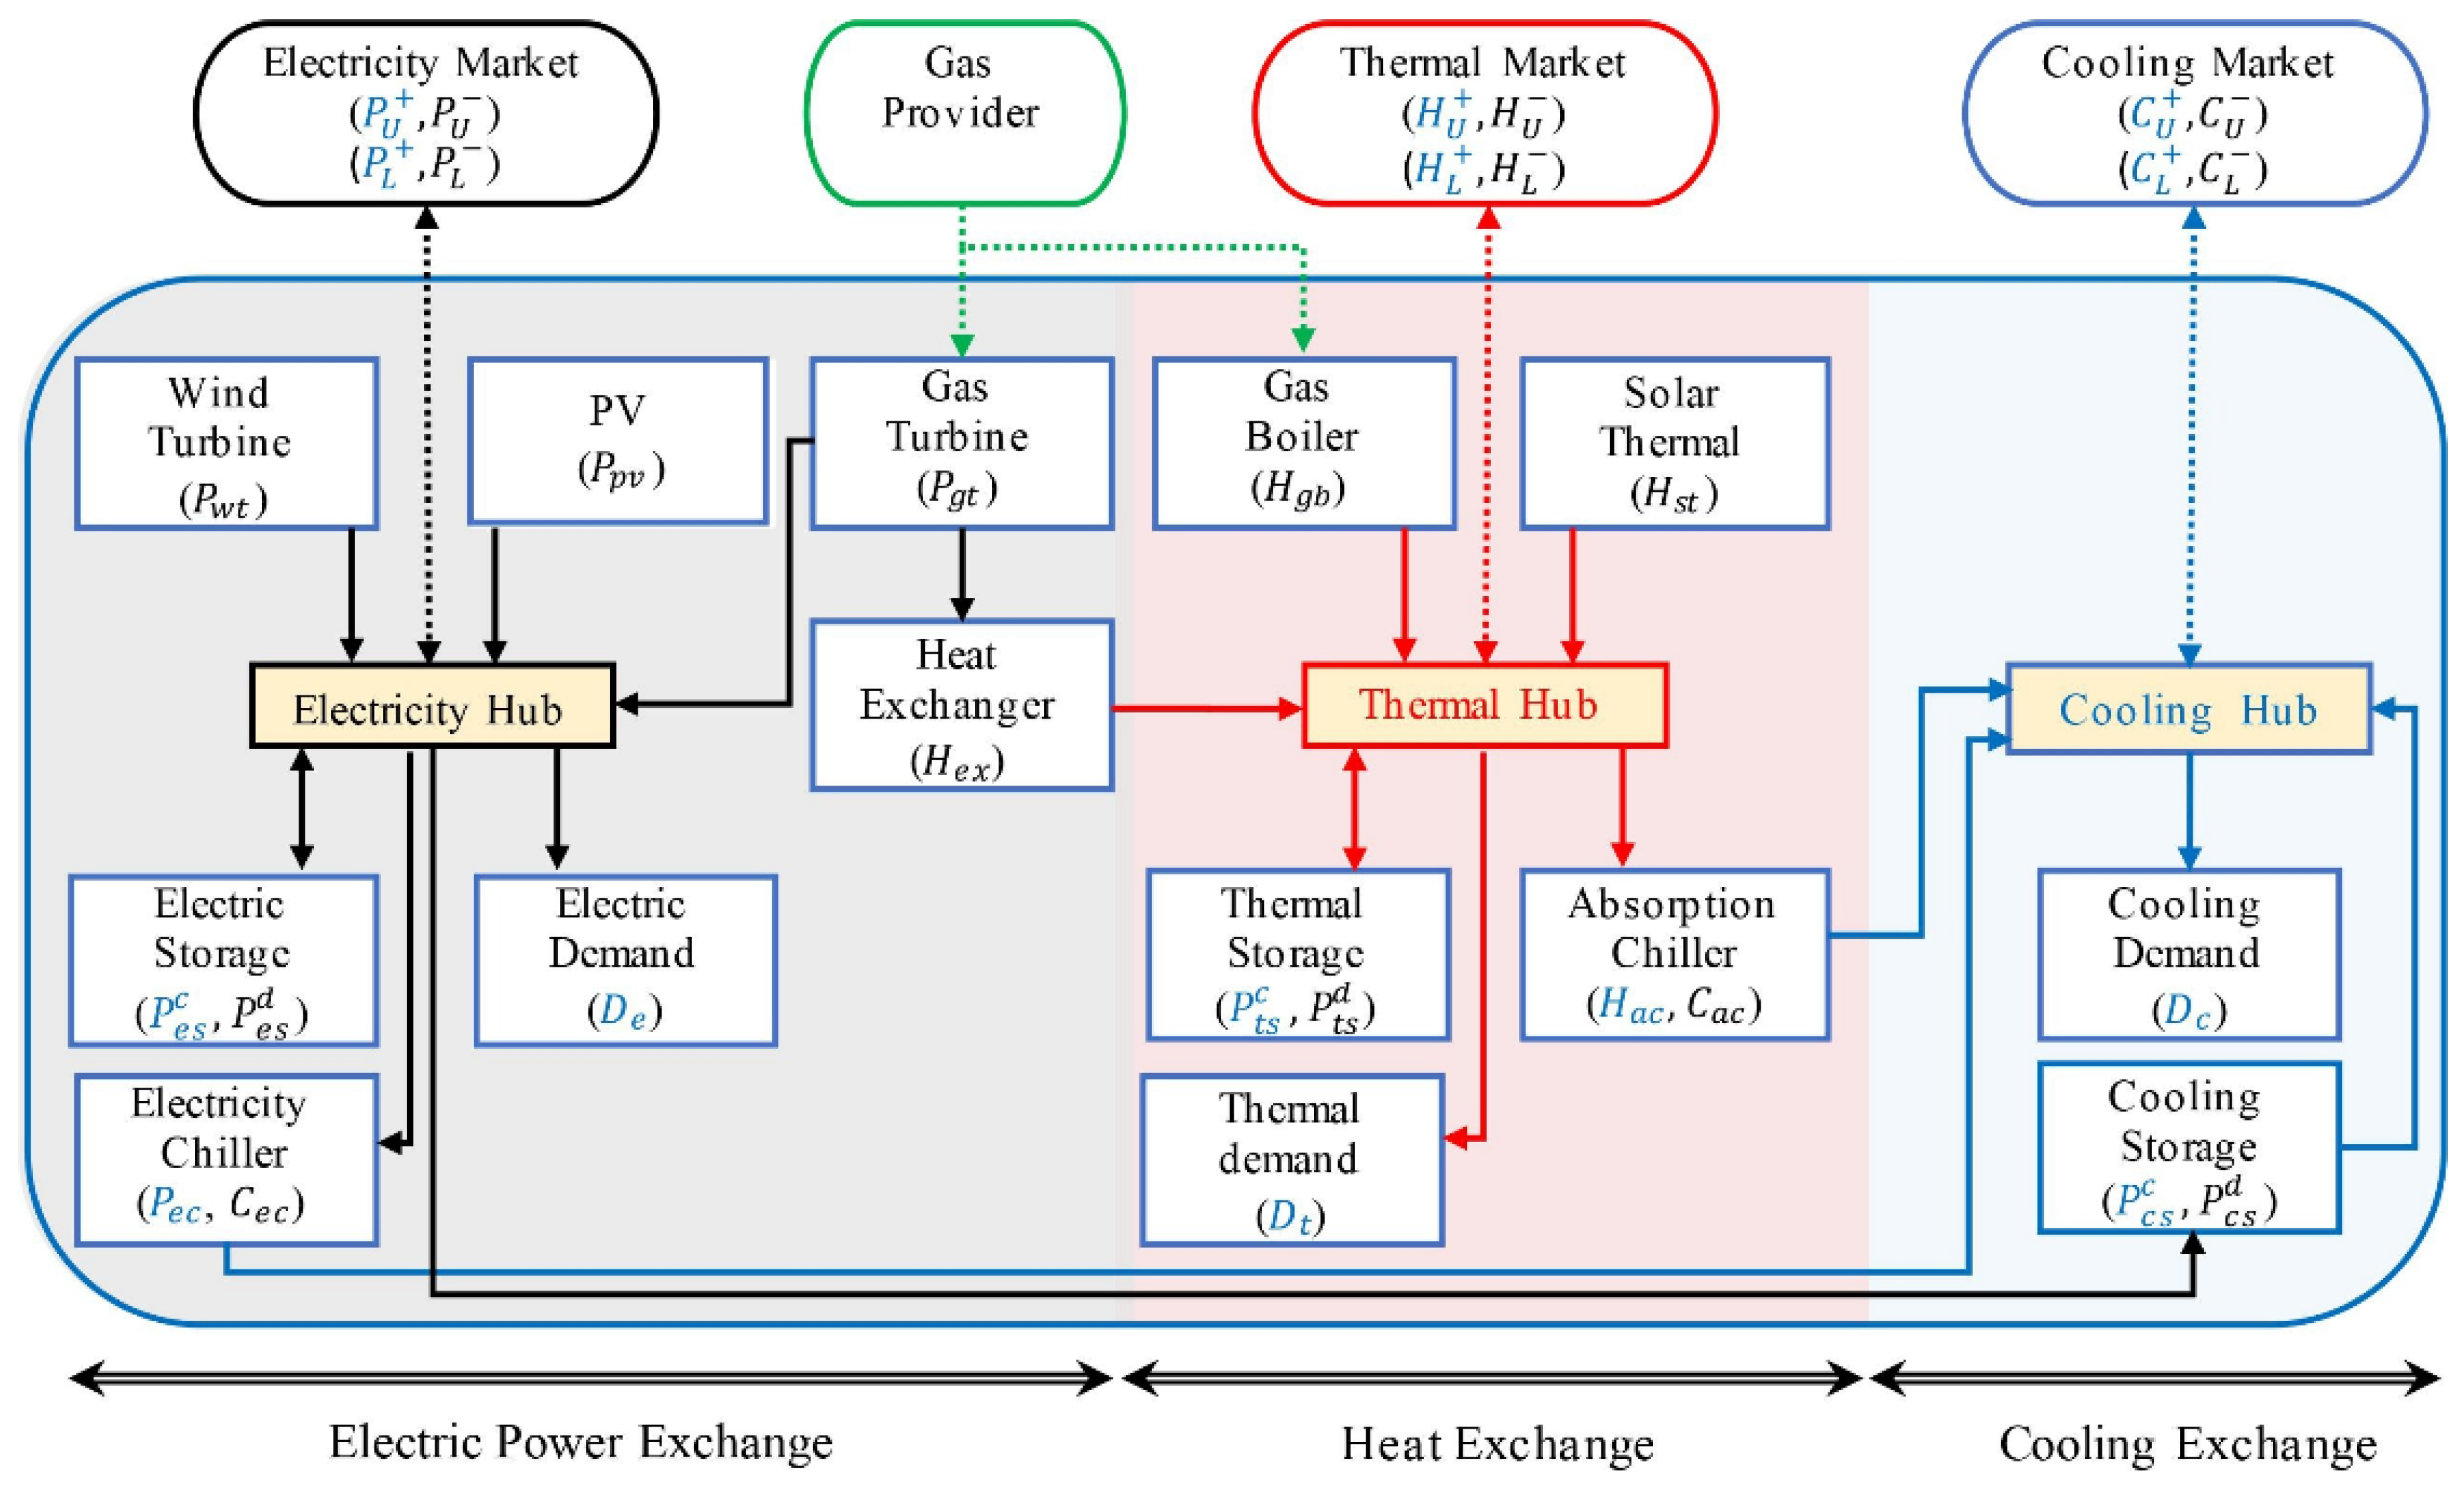
Effective electrical management is crucial for optimizing energy consumption and ensuring system reliability, involving monitoring usage, implementing efficient technologies, and maintaining a proactive maintenance schedule to minimize downtime. Khorasany et al. [24] proposed a framework for energy scheduling and trading of multiple energy hubs (EHs, Figure 1), where the respective local markets for trading different forms of energy between EHs are designed. A stochastic energy scheduling demonstrated that the proposed framework reduces the reliance of EHs on the district markets, reducing energy cost by 22% and emitted CO2 by 13%. The work of Khorasany et al. [24] is far more extensive than the one presented in this paper. It has a larger macroscale magnitude of electric management compared with the one developed for this paper, which enables a particular energy provider to fine-tune the energy needs of society as it can master the deployment of renewable energy and/or fossil energy.
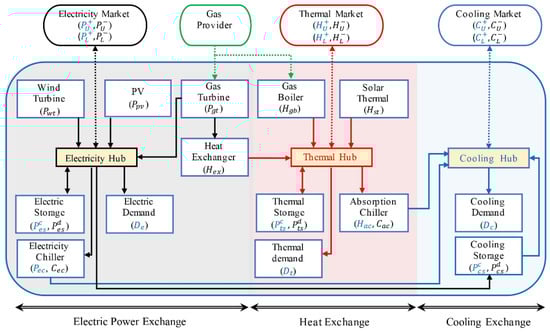
Figure 1.
Energy hub structure for electricity management. The solid lines indicate energy exchange among components of the EH, while the dashed line represents the energy exchange with external resources. For each component, the input/output variables are provided within parentheses, in which text in blue denotes an input variable and text in black denotes an output variable (adapted from [24]).
Elavarasan et al. [25] reviewed thermal management solutions for photovoltaic (PV) applications and presented the technical characteristics, design operational aspects and challenges. For the present work, developing a generic electrical management tool that may be applied to any industrial company with large factory floors will be the focus, allowing the monitoring of low-voltage energy systems. The authors propose the challenge of creating an innovative electrical network management tool to understand and acknowledge the design limitations of the electrical grid and potential redesigns of facility layouts concerning the power supply and the overall state of the electrical network.
Section 1 has presented a theoretical framework concerning automotive industry facilities management, BIM and electric network management solutions. Section 2 delineates the objectives of this study. Subsequently, Section 3 reaches into the development of the electrical management tool and details the different sub-menus. Section 4 deliberates on insights derived from content analysis, providing an overview of the tool’s emerging research themes and challenges. Additionally, this section explores the practical implications and constraints inherent in this study. Finally, Section 5 succinctly summarizes the findings and offers a brief outlook on prospects.
2. Objectives
This project sets out to meticulously examine, restructure, and enhance electrical load distribution systems within industrial settings, aiming to optimize the operational efficiency and resource utilization [26]. At the heart of this initiative lies the development of a sophisticated computational tool capable of conducting a granular analysis of the system’s critical junctures and recommending actionable strategies for improvement.
The key areas of focus within the project’s scope encompass the following:
- Identification and Reorganization of Electrical Switchboards: This entails a comprehensive audit and restructuring of electrical switchboards across various departments within the organizational framework. The project aims to minimize energy wastage and enhance overall system performance by streamlining and optimizing the placement of these switchboards.
- Designing Electrical Systems Layout: The project will delve into the intricate task of designing the layout of electrical systems within the industrial facility. Emphasis will be placed on optimizing the positioning of frames and electrical facilities to ensure seamless integration and efficient operation.
- Certification of Energy Needs: A critical aspect of the project involves certifying the energy requirements of different equipment and determining their associated usage fees. This comprehensive assessment will provide valuable insights into energy consumption patterns and aid in devising cost-effective energy management strategies.
- Development of Energy Analysis Tool: Central to the project’s objectives is the creation of a sophisticated energy analysis tool. This tool will leverage advanced computational algorithms to identify critical energy capacities and pinpoint potential areas for expansion. The tool will enable proactive decision-making and facilitate continuous improvement initiatives by providing real-time insights into energy usage patterns.
Acknowledging that the project represents a departure from traditional approaches to production line reconfiguration is essential. This shift is primarily driven by acquiring new machinery characterized by increased power, production rates, and physical dimensions. Consequently, a comprehensive overhaul of the production line layout and electrical grid is necessary to effectively accommodate these changes.
Section 3 addresses the electrical management tool developed, on a step-by-step basis, while providing a walkthrough of all the sub-menus available.
3. Development Method and Management Tool
Maintaining alignment with modern production requirements in the automotive industry necessitates frequent changes in manufacturing layouts. Technological advancements and evolving consumer preferences significantly influence these adjustments. Adapting swiftly and effectively to these shifts is crucial for sustained success. Employing an action-research methodology proves advantageous in this context. This systematic approach integrates investigation and intervention, offering a comprehensive perspective on the layout challenges. It enables stakeholders to assess alterations in real time and make informed decisions, enhancing the efficiency and competitiveness in the automotive sector. The enterprise under study, which manufactures and supplies automotive equipment to various car brands, boasts annual revenues of at least EUR 50,000,000. In light of the departmental leadership’s predefined needs, all the proposed solutions must effectively address the current state of the electrical network, particularly the electrical panels critical to the electrical grid and the available space for accommodating new equipment. This pertains to both the design and redesign of the layout of production equipment and the integration of equipment with specific energy requirements in designated zones of the manufacturing facility. Therefore, the management tool developed must cater to the user’s needs on three primary fronts: (1) equipment insertion, (2) equipment removal, and (3) grid overview. In collaboration with the enterprise, the preparation of this work followed the method described below:
- Identification and reorganization of all the electrical switchboards in the industrial facility by developing electrical schematics.
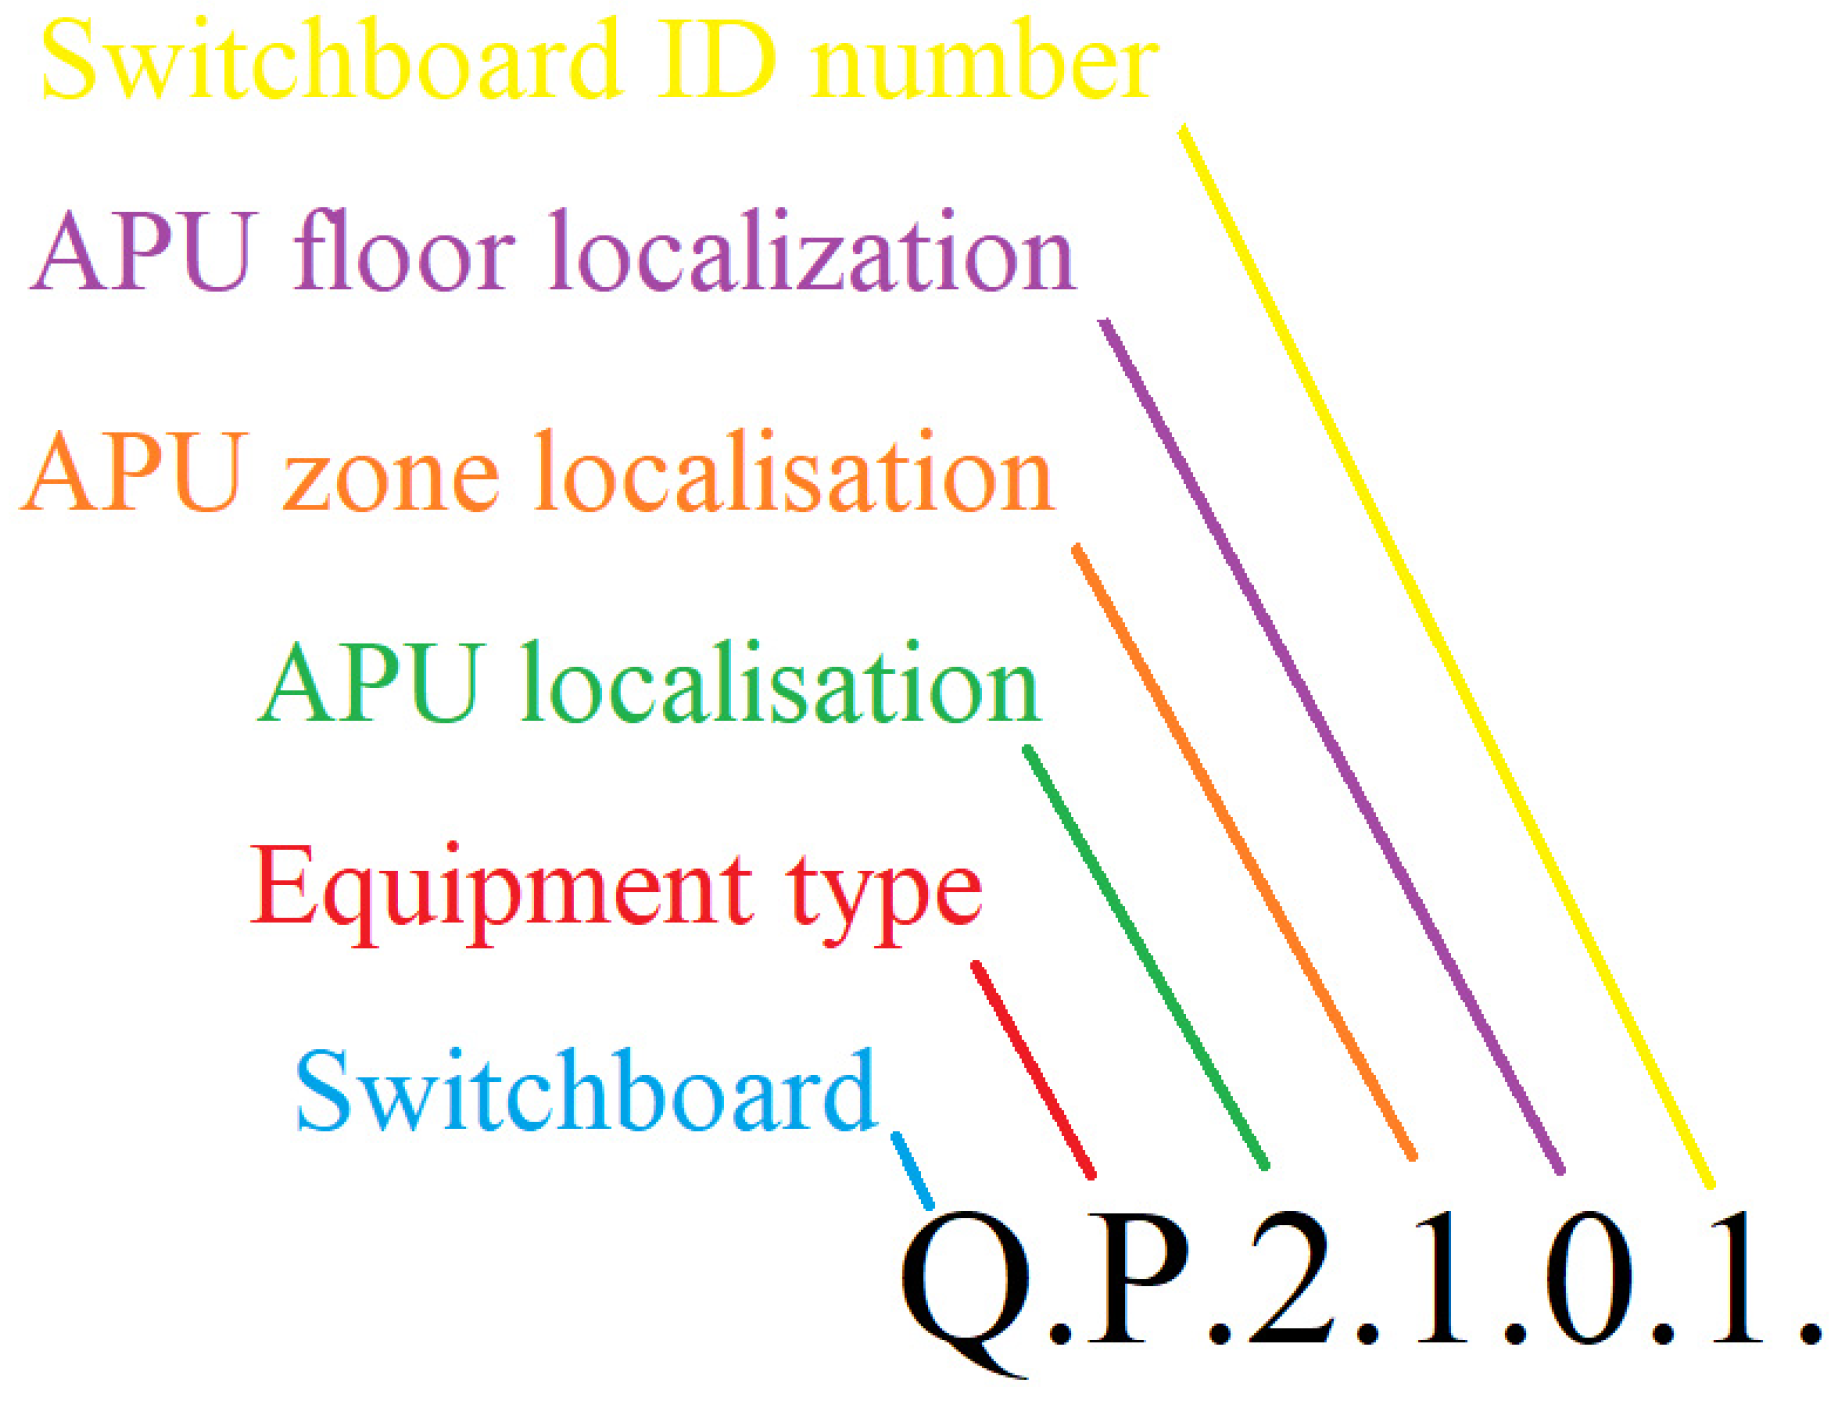
- Electrical switchboard site survey and tagging, jointly with the facilities management team, regarding their location and peer-to-peer linkages within the factory, as exemplified in Figure 2.
 Figure 2. The method for assigning nomenclature to new equipment, whether machines, switchboards, or electric breakers.
 - Electrical switchboard energy supply analysis for factory installation.
- Energy needs checking of all the connected equipment, from production line machines to deriving switchboards and electric breakers, and their variation according to the usage rate.
- Development of a computational analysis tool in Visual Basic (VBA) language, using Microsoft® Visual Studio™, which will provide users with an understanding of the factory energy load at each point so that critical points and possible zones of expansion are quickly identified.
- Compile and validate the obtained improvements, comparing the newer management solution with the previous tagging model.
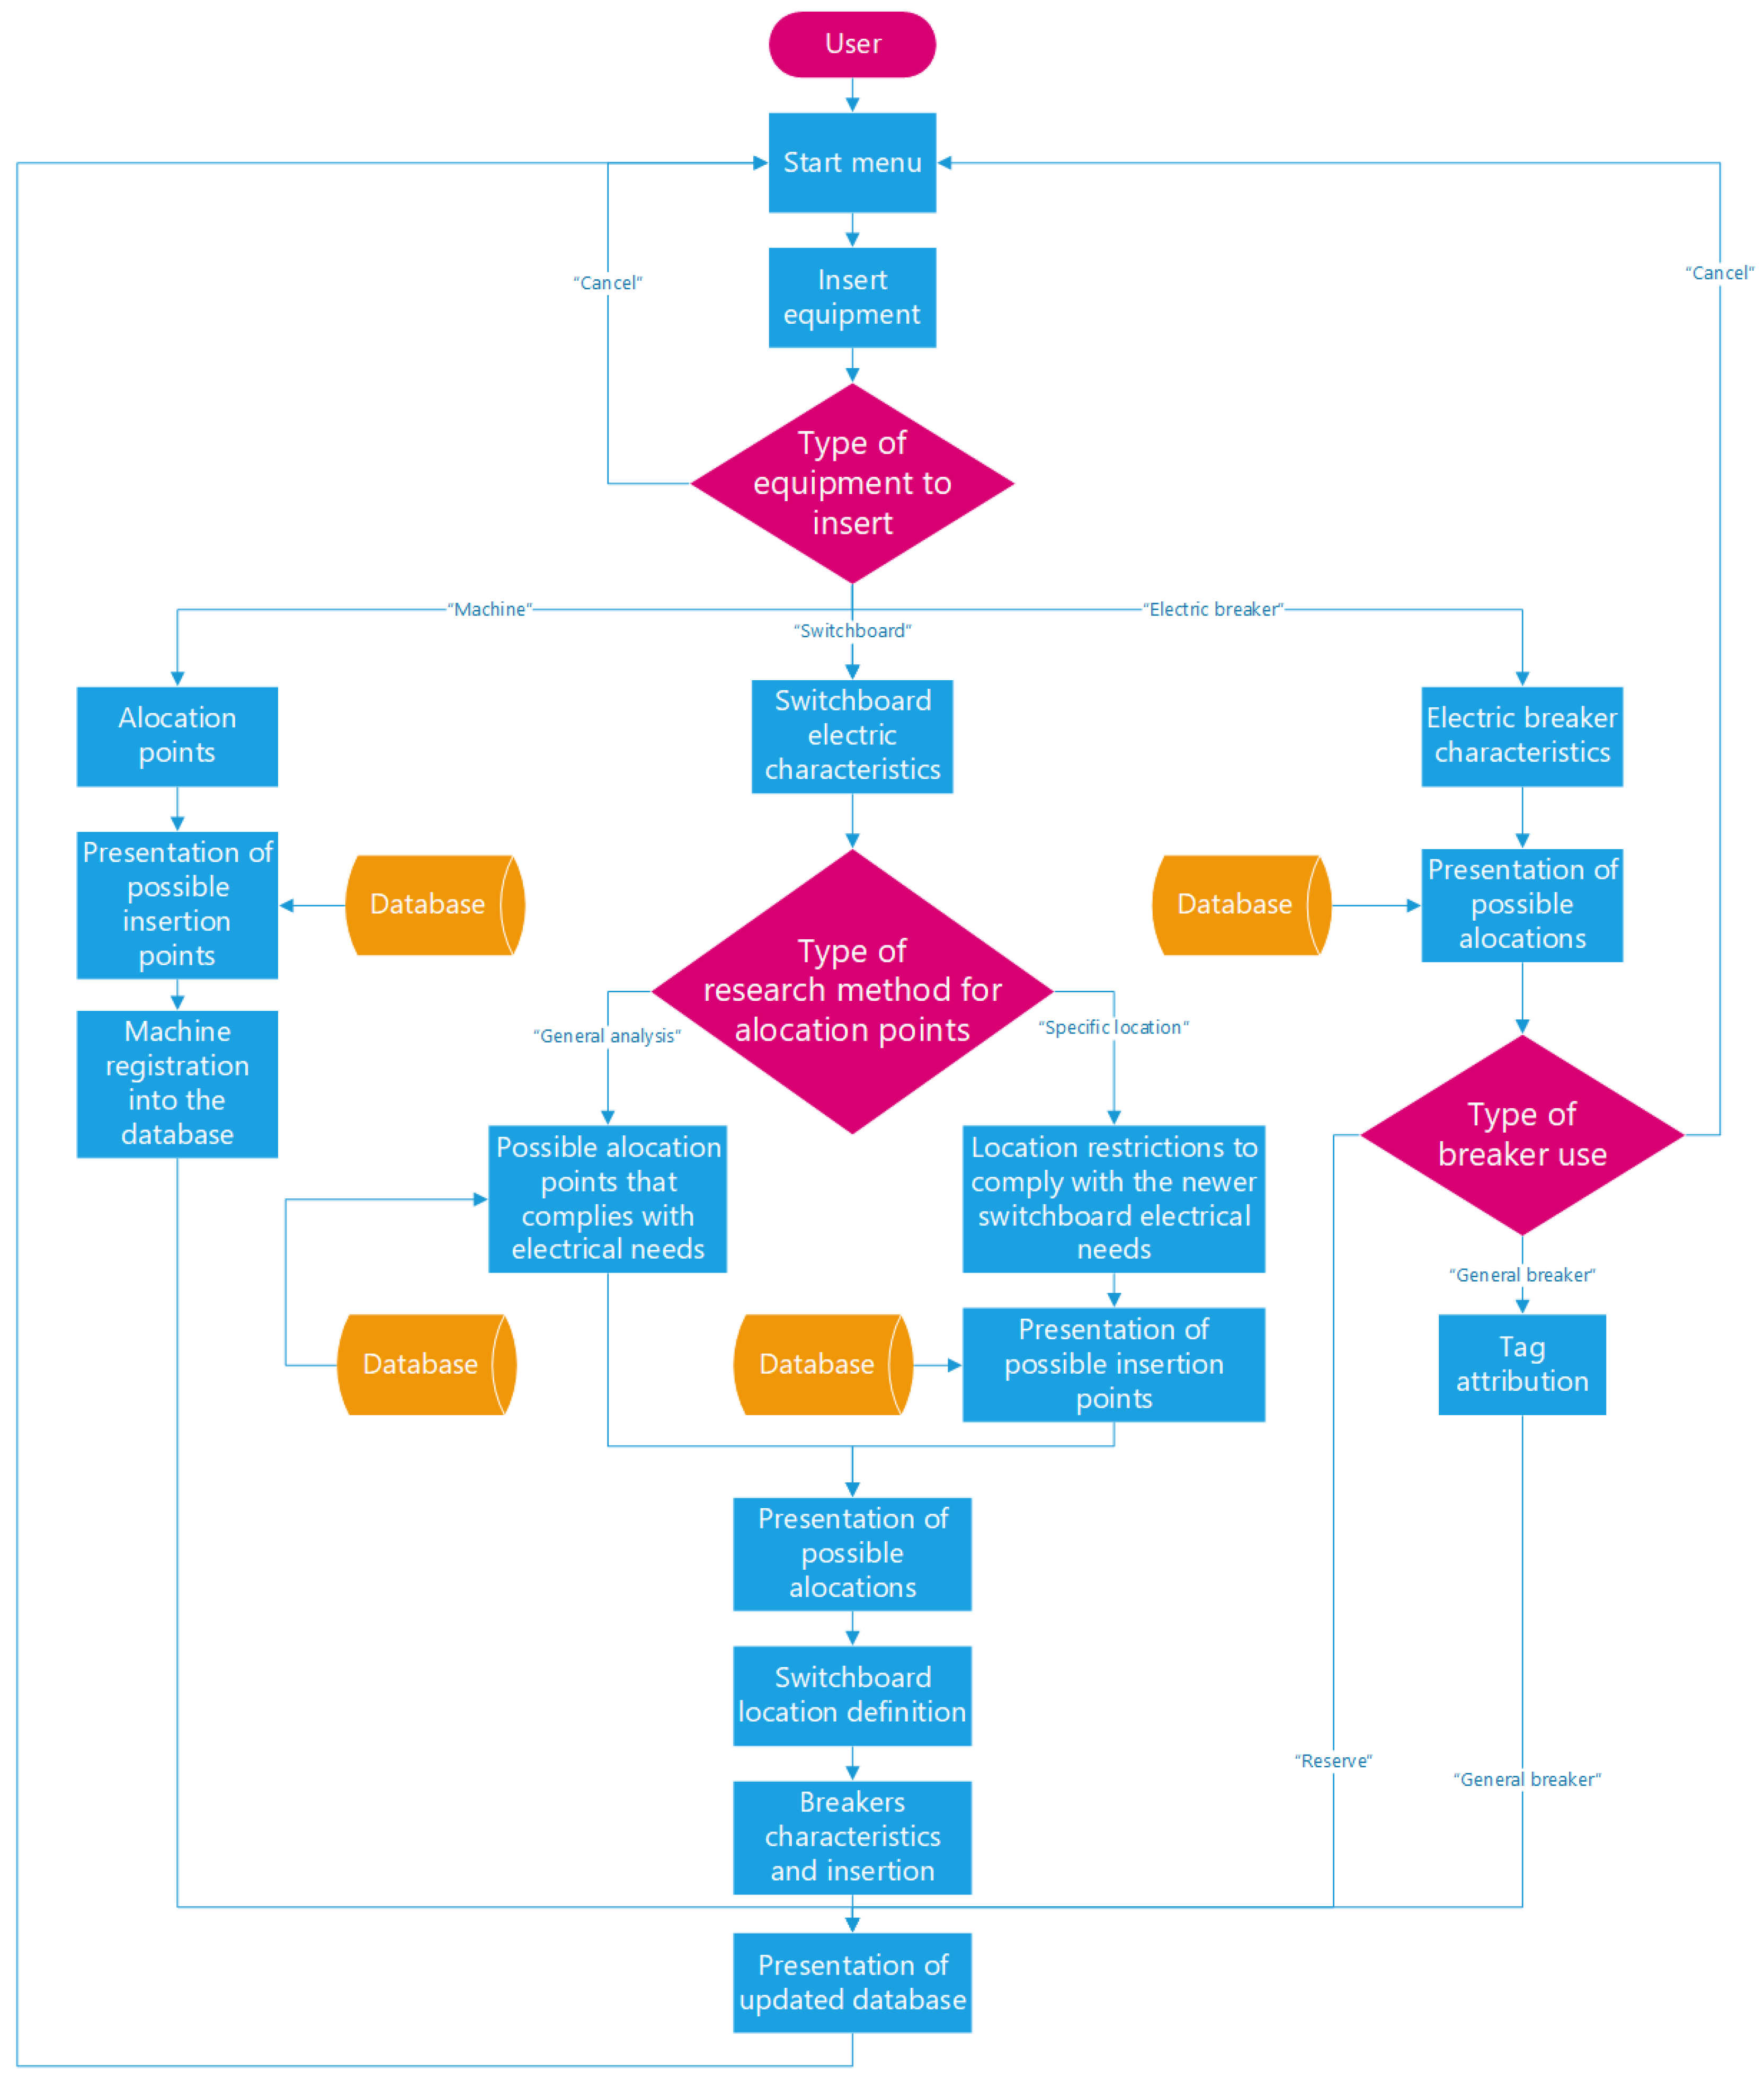
The development of this tool allows the monitoring of low-voltage power systems throughout the automotive case-study company. It facilitates the design and redesign of the company’s various APUs layouts. The implementation of this open-source tool offers a detailed electrical flow management system. Figure 3 depicts the open-source tool in a nutshell, with the three main fronts of the program: (1) equipment insertion, (2) equipment removal, and (3) grid overview, and all the respective sub-menus.
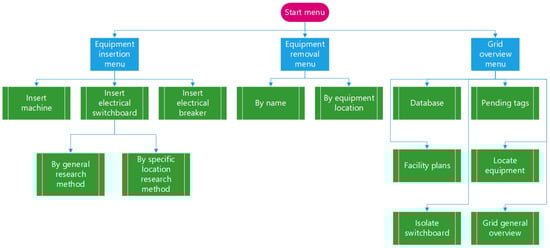
Figure 3.
Computer program structural diagram.
Equipment insertion allows allocating equipment with energy needs to the switchboard’s electric circuit breakers. After that allocation, the system will update its entire database so that the analysis of criticalities continues with a high level of reliability. The module that allows removing equipment is used to reallocate or withdraw equipment in case of inoperability. The system will update its entire database in the Insert Equipment menu. The Grid Overview menu allows the user to quickly access all the surveys regarding the arrangement of the switchboards within the facility and respective criticalities, thus responding to network monitoring needs. The conception of this typology of the diagram guarantees the assertive response to the three primary requirements of the computer program through the definition of the necessary menus and sub-menus and their interdependencies. All the inherent sub-menus in flowchart form, produced in Microsoft® Visio™, will be addressed in more detail. Given that the different types of equipment have different ways of insertion, they will be described separately.
3.1. Equipment Insertion
The Insert Equipment menu has the basic operating assumptions explained in Figure 4. The purpose is to enable the operator to analyze and subsequently implement various equipment groups with their energetic needs, such as machines on the electrical network and equipment groups like switchboards and electrical breakers that distribute the energy. From Figure 4, the main feature of this electrical management tool is the possibility of assessing the electrical load from a smaller scale, the electrical breaker, to a larger scale with the APU itself, allowing a swift change of the machines throughout the layout without calling into question the overload of a switchboard, which could lead to a momentary production breakdown.
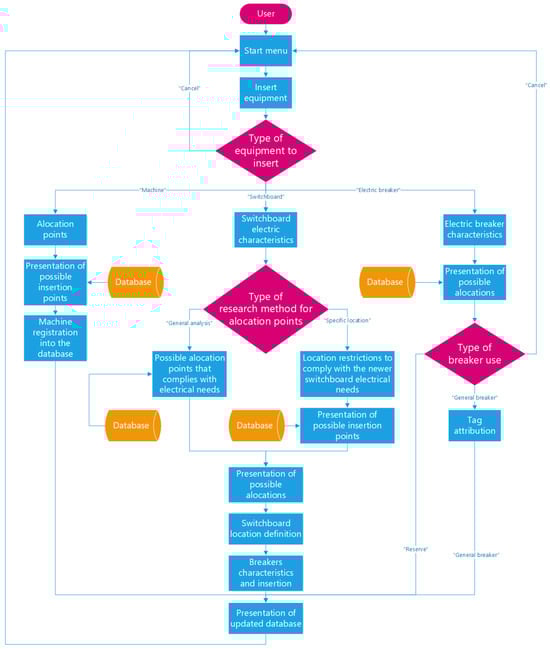
Figure 4.
Simplified flowchart for equipment insertion.
The operator can choose the type of equipment to insert within three hypotheses of selection:
- Machine: The user assigns a piece of equipment that purely consumes electrical energy and, therefore, occupies an available space allocation, increasing the flow of electric current consumed in the frame supplier. This selection strictly applies to groups of one, two and three pieces of equipment.
- Switchboard: This insertion option allows accommodation of possible expansions of the electrical network through the allocation of supplier equipment of energy in the energy network.
- Electric breaker: The user can expand the network by adding dependent energy supply equipment and updating existing equipment. This type of individual expansion can have various fundamentals, such as adapting the electrical panel to allocate specific equipment or decreasing space criticality within the supplier equipment.
Regardless of the selected hypothesis, after filling in all the necessary properties to characterize the equipment, the entire database is updated and accommodates the equipment inserted. A “Cancel” function is present in all the menus and sub-menus, allowing the user to return to the initial menu if there is the need to interrupt the already-started action. It is noteworthy that, despite machines being consuming equipment and switchboards being energy providers, all of them are electrical grid types of equipment, a requisite for the case-study company to include them in the Insert Equipment menu for better industrial functioning.
3.1.1. Machine Insertion
Figure 5 illustrates the inherent processes of the insertion of machine-type equipment discriminately. A choice follows machine insertion. The program can sustain as many APUs as needed (Figure 5), from APU1 to the umpteenth APU (APUn).
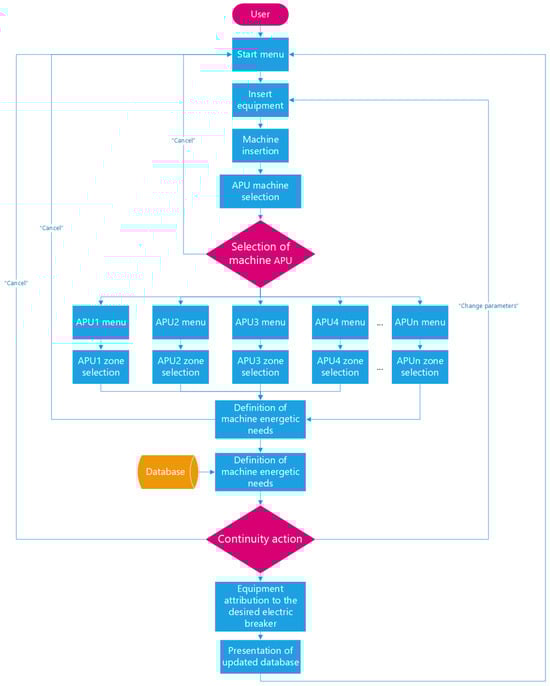
Figure 5.
Insert machine-type equipment flowchart.
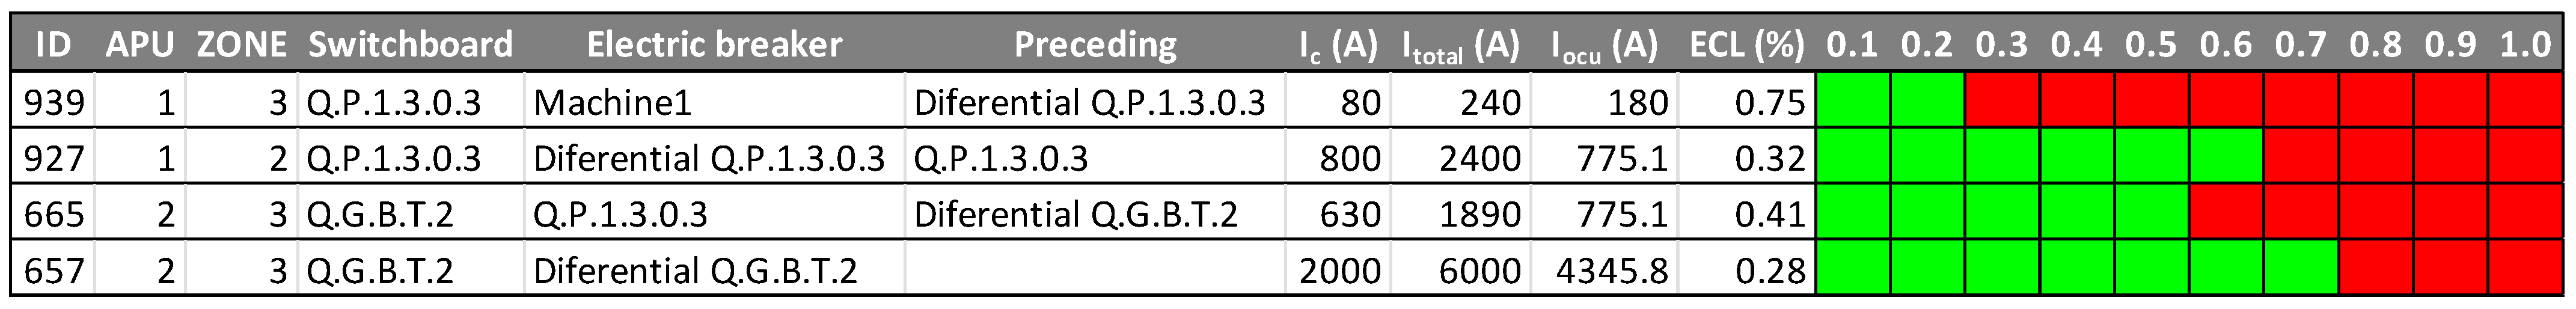
For each one, an analysis of the balance of the electrical load versus the electrical availability is advocated for the chosen APU. Additionally, each APU is divided by zone to be inserted into the machine. At the end of the flowchart, an electrical breaker is attributed to the inserted machine and the database is updated according to the newer electrical load. Figure 6 shows the information the program prints after installing a machine. Once the intended APU and respective zone are filled correctly for the machine insertion analysis, the machine parameter definition related to the equipment, such as the nominal voltage (Un), type of voltage (single or three-phase), electric current consumption (Ic), and nominal power (Pn), will be included. Following this step, the program executes a logical search algorithm and presents the results for possible machine allocation points. The algorithm searches and displays valid circuit breakers for the machine allocation, with the following search limitations imposed:
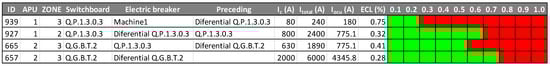
Figure 6.
An example of the Electric Breaker 939 occupancy percentage with Machine1 assigned.
- The electric circuit breaker must be inserted within the chosen APU zone and must not have any equipment previously attached.
- The equipment electric phases (single or three-phased) shall comply with the electric breaker.
- The connection breaker used to add the equipment to the switchboard must be an end connection breaker, i.e., none of the other circuit breakers present in the program’s database can have its nomenclature as precedent identification.
- The circuit breaker must still have an equal or higher admissible electric current than the machine’s electrical consumption.
After filling in the parameters, a table of results is shown, and each line will represent an electrical circuit breaker with parameters that comply with the imposed research restrictions. The machine is allocated by selecting the most suitable electric breaker. Following this process, the program changes the values of the Ic, available electric current (AEC) and percentage breaker occupancy (%Space) of all the breakers that have some connection with the energy flow that feeds the equipment insertion circuit breaker. The database changes related to the electric current are carried out iteratively by the algorithm. Then, the executable will update all the connection paths of the energy flow in the database through the logic described, guaranteeing the electric network’s reliability and updating the electrical management tool whenever a piece of equipment is added.
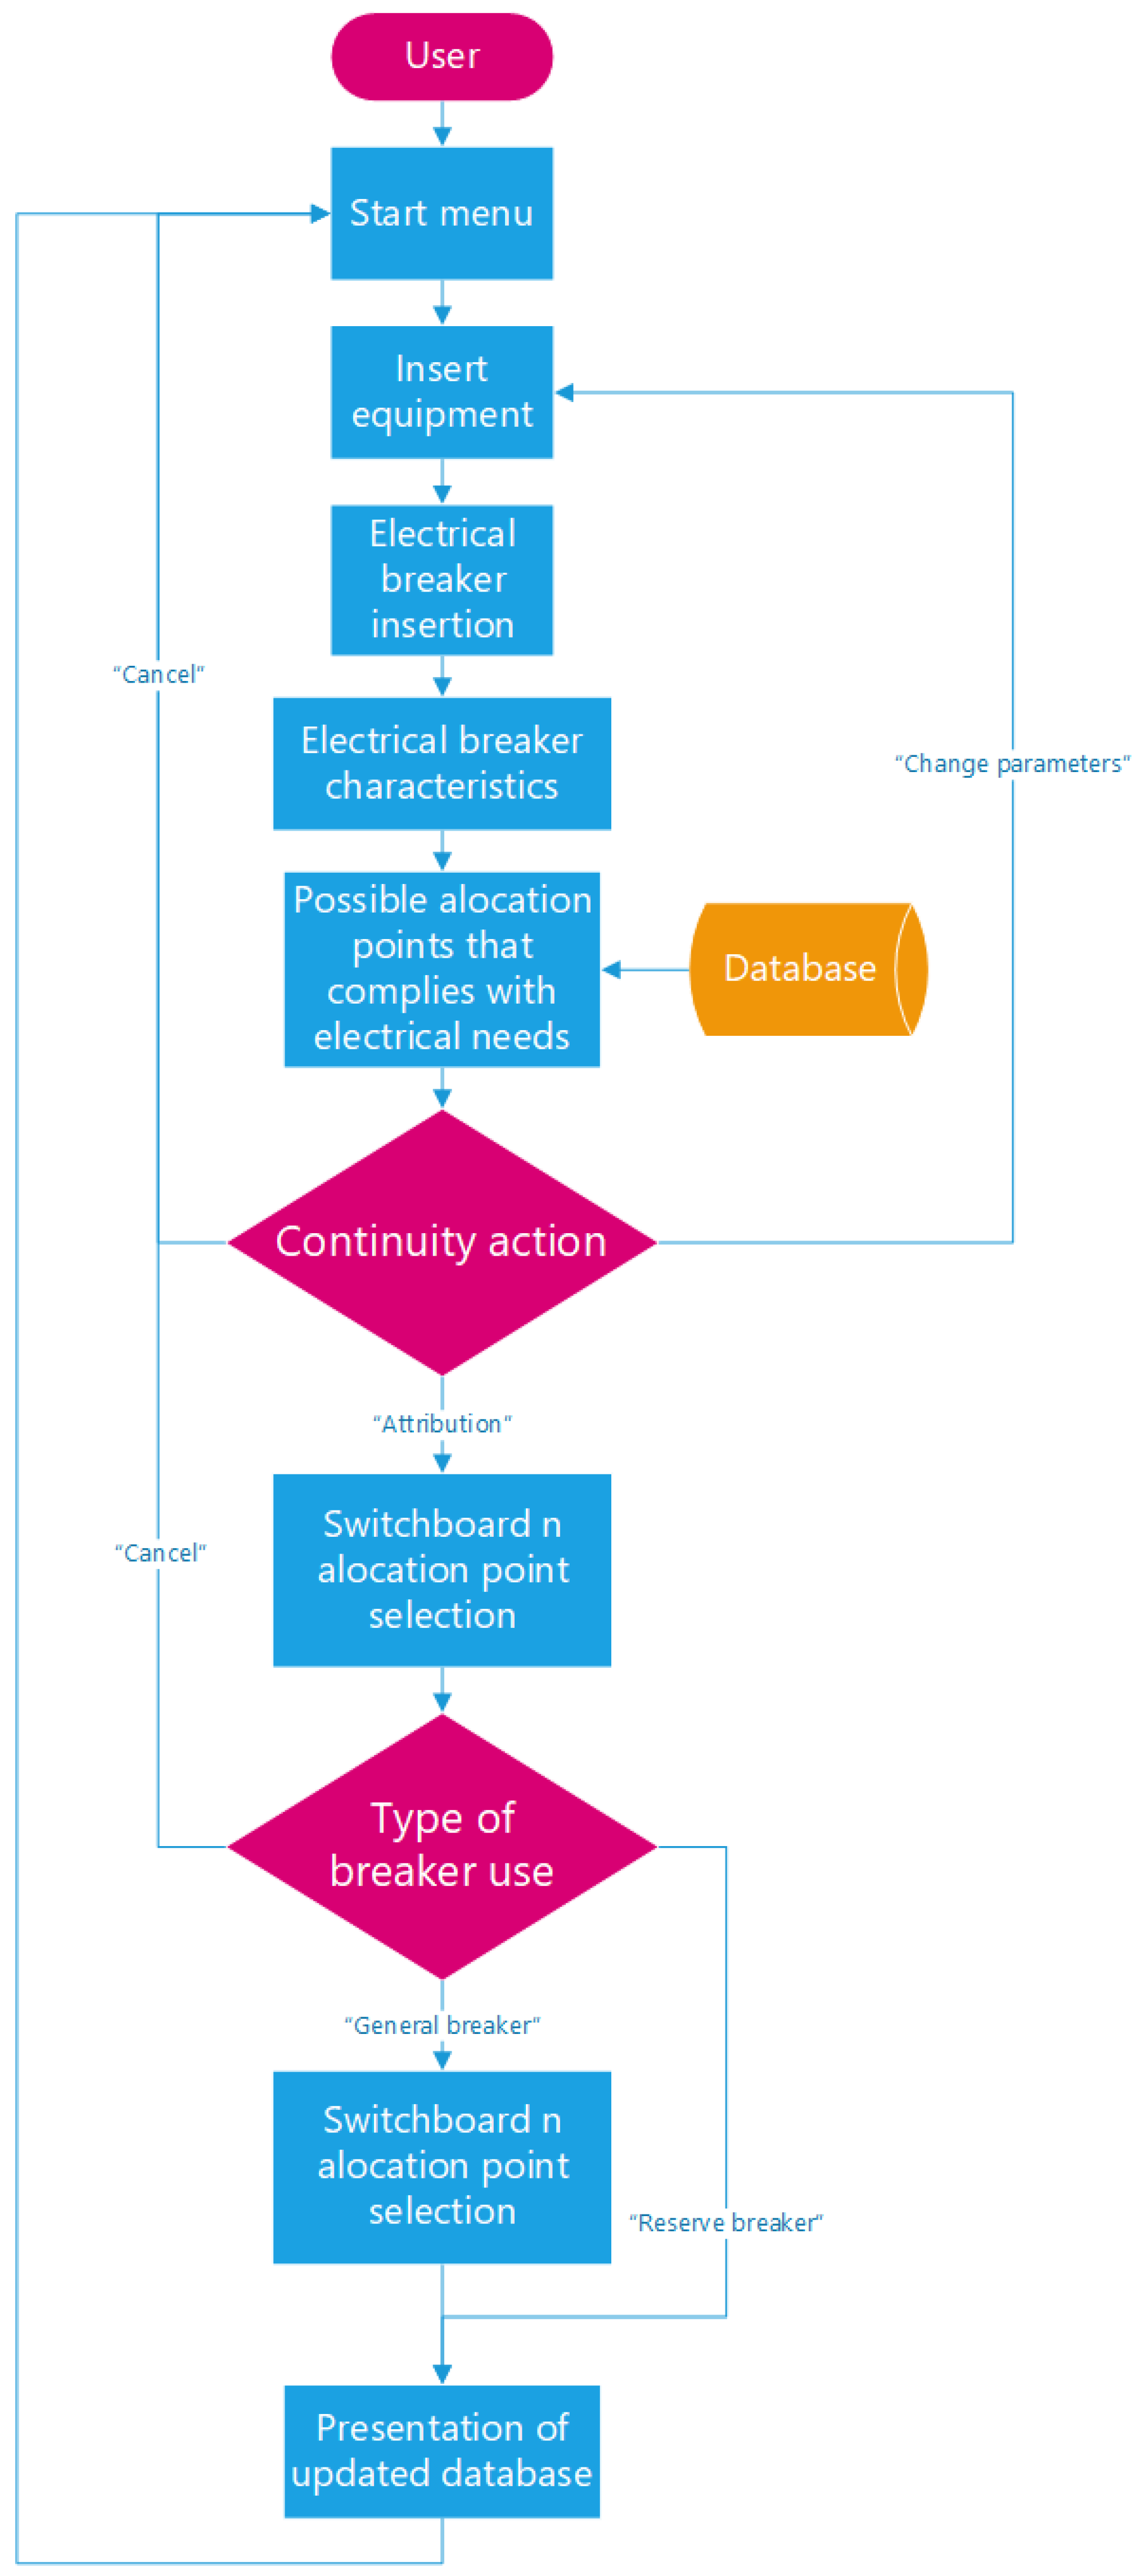
3.1.2. Switchboard Insertion
The switchboard insertion option accommodates possible expansions of the electrical network by allocating energy supplier equipment at a higher level in the energy grid. This insertion type demands switchboard parameters such as the deliverable power (Pout), Un, and information on single- or three-phased voltage. In addition, it offers two research methods: (1) general method research and (2) specific location research to determine possible switchboard anchorage points. Figure 7 presents the flowchart relative to the insertion of switchboard-type equipment by the general analysis research method. This function allows the user to cover all the breakers of the several APUs in the analysis field, which presents conditions for allocating the specified switchboard. This type of analysis is advantageous when considering the entire facility’s responsiveness and predicting possible electrical energy shortages. The attribution process is similar to the machine-type equipment insertion, and the same results analysis process has the same fundamental basis.
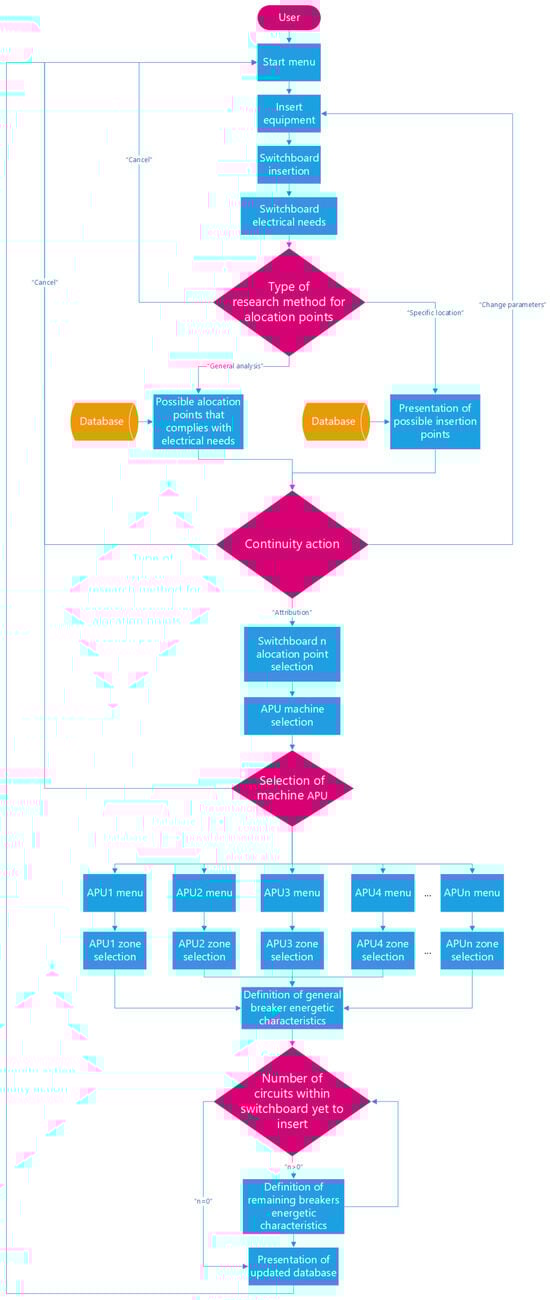
Figure 7.
Insert switchboard-type equipment flowchart using the general analysis research method.
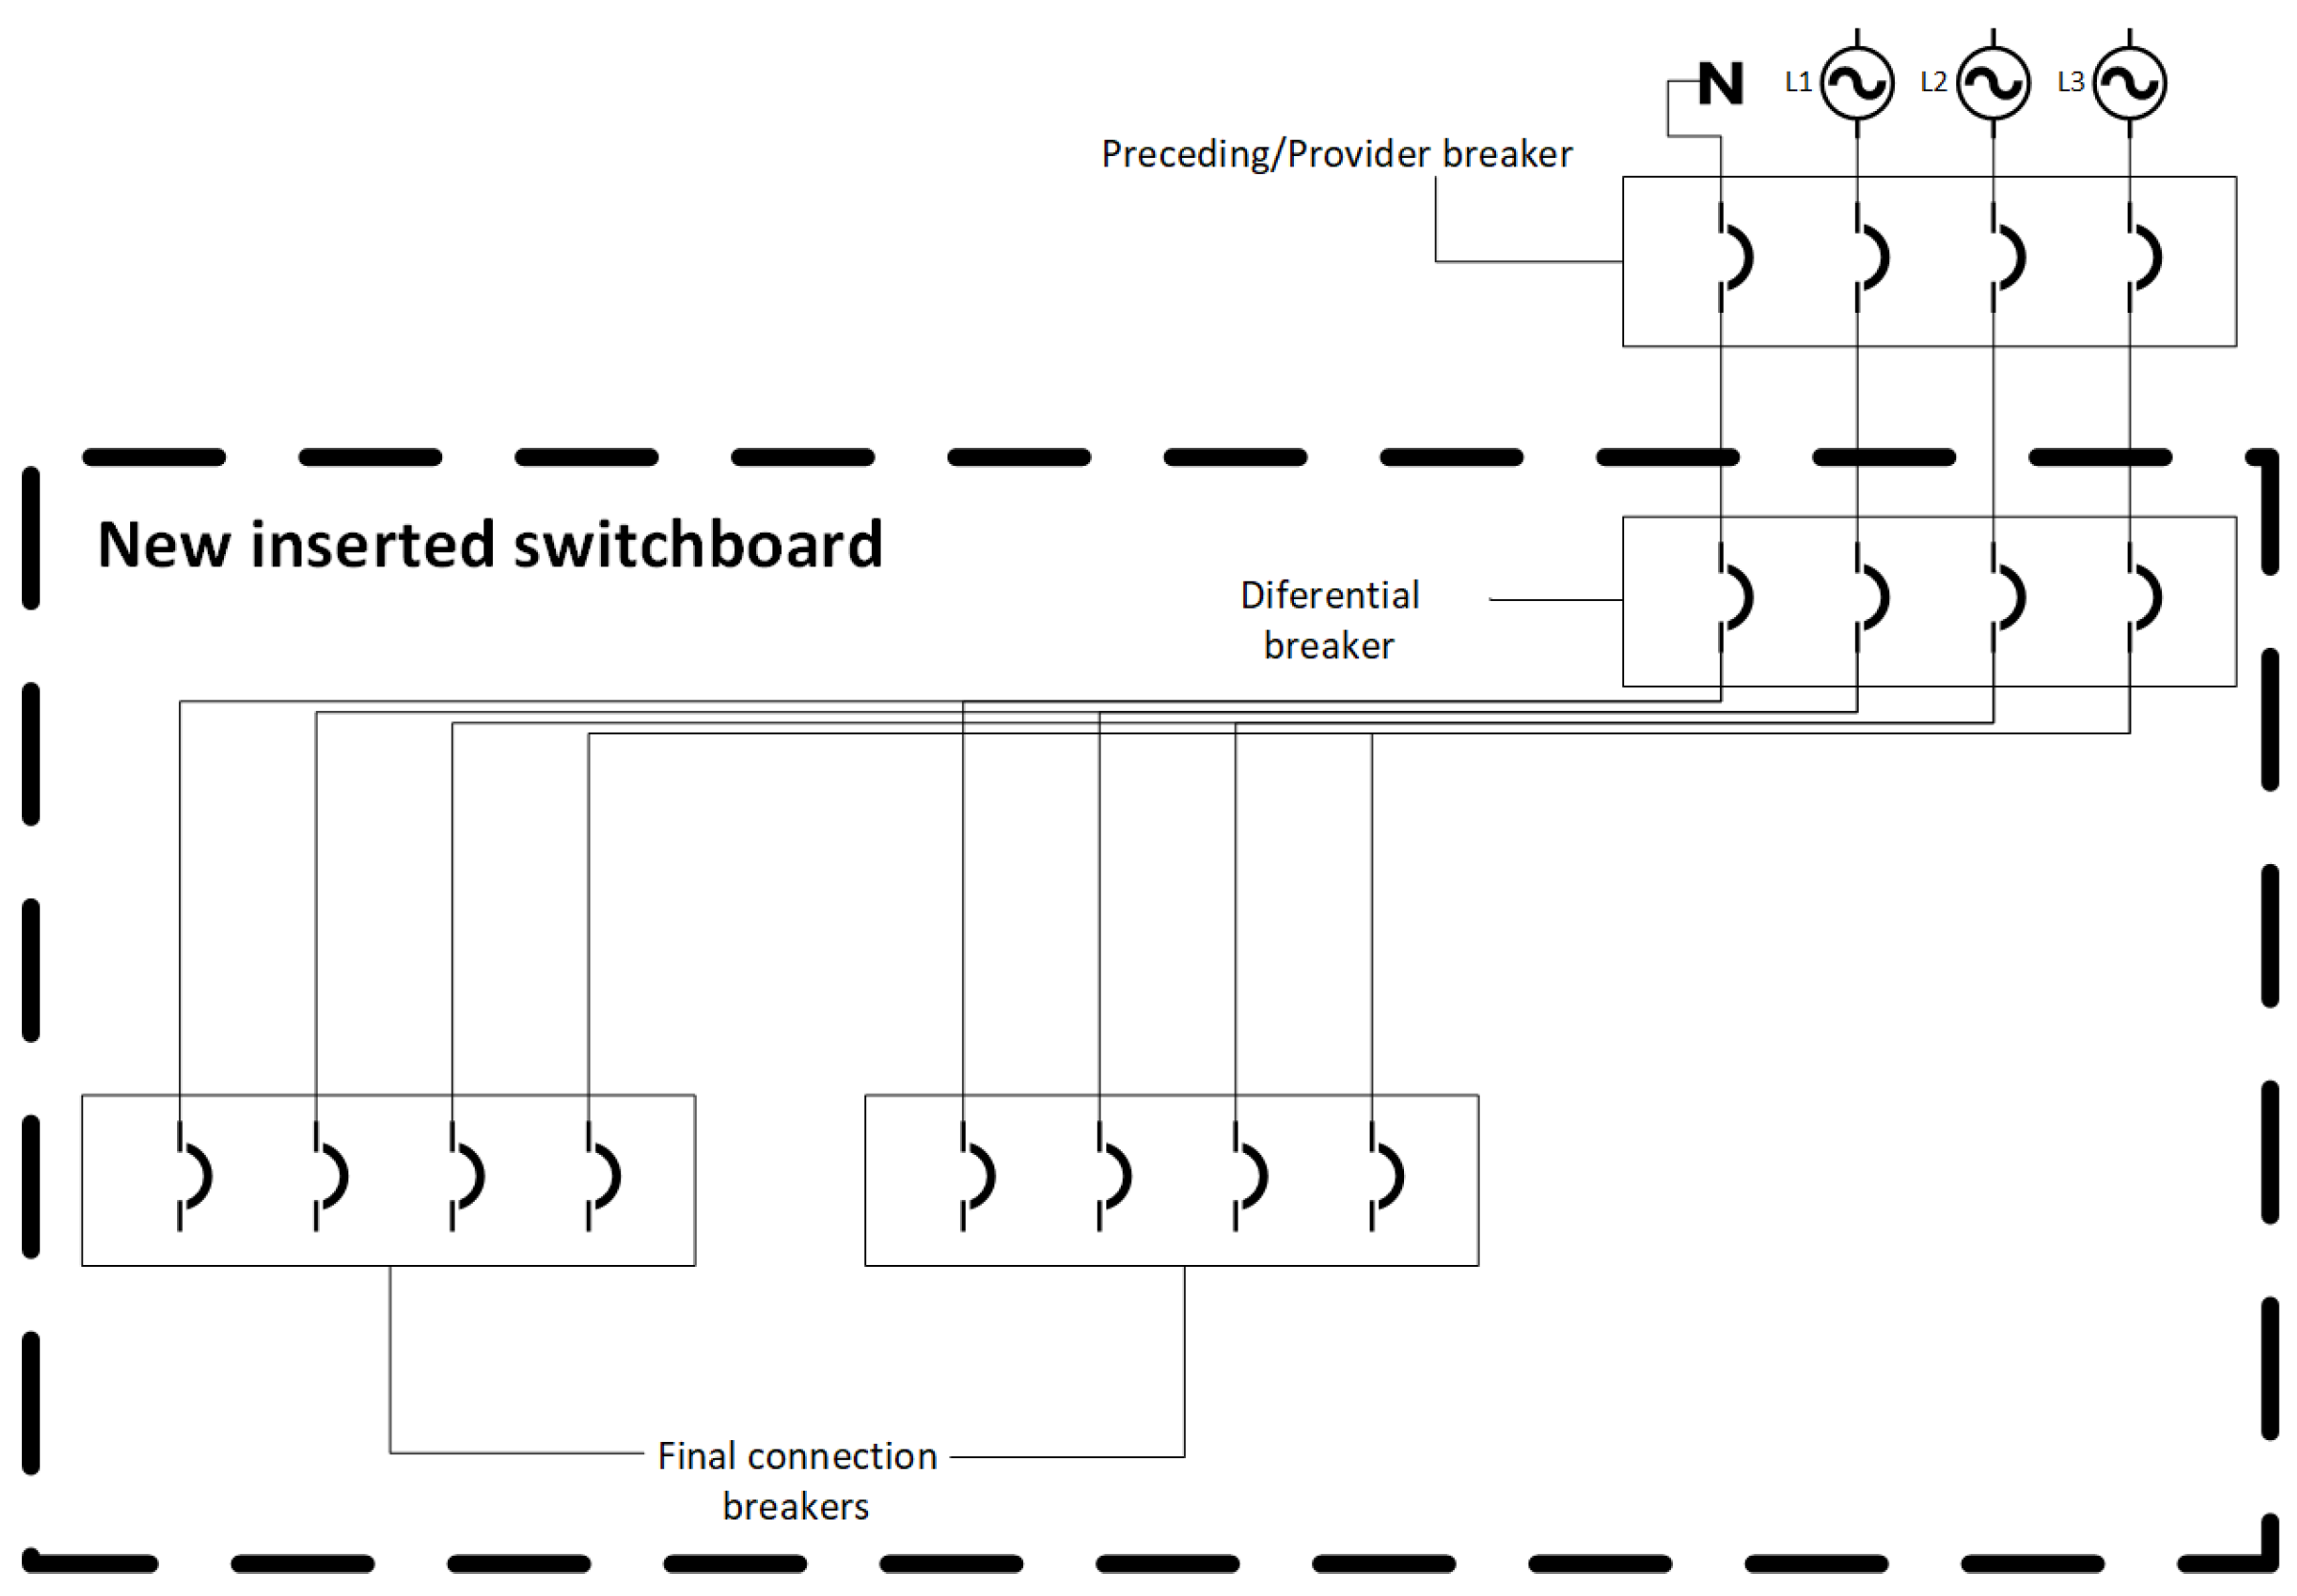
In contrast to the machine-type insertion, the switchboard insertion process is not meant to consume energy; it is only meant to deliver. The program can effectively provide users with an overview of the %Space through Un and Pout. As in the previous analysis, the user should select the electric breaker with the highest occupancy percentage to achieve the highest efficiency. The circuit breakers with the lowest occupancy rate should be selected in only exceptional cases, such as connecting several pieces of equipment with frequent electric current peaks (Ip) or when inoperability would be catastrophic for the organization. Equally to the machine-type insertion, the program must be informed about the preceding electric breaker, which will feed the newer switchboard. Afterwards, the intended APU zone is chosen, and a differential circuit breaker must be ascribed to the switchboard by inputting the admissible voltage, current (Uadm and Iadm, respectively) and phase. Figure 8 illustrates the method of the newer switchboard internal links assignment, where the preceding breaker, the mandatory differential breaker and the two final connection breakers, for example, may connect to a machine-type or even to another switchboard-type equipment.
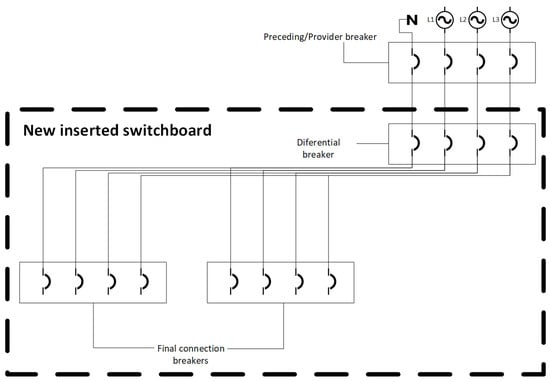
Figure 8.
The primary method for assigning internal links to a new switchboard.
Not only does the program enable the insertion of switchboard-type equipment by the general analysis research method but it also supports the insertion of switchboard-type equipment by the specific location research method, as shown in Figure 9. Although the general analysis research method is essential when studying the entire facility manufacturing response conditions, this option is not the most suitable for analyzing the possible insertion points of switchboards, given its broad characteristics. The user wants to position the switchboard in a particular APU zone; it is more interesting to adopt an electric circuit breaker that may share the exact location of the new switchboard since the installation costs are lowered by bringing the connection points closer. From a cost reduction point of view, the less distance from the electrical connection points, the fewer voltage losses will exist in the connection cable from the electrical breaker and the switchboard.
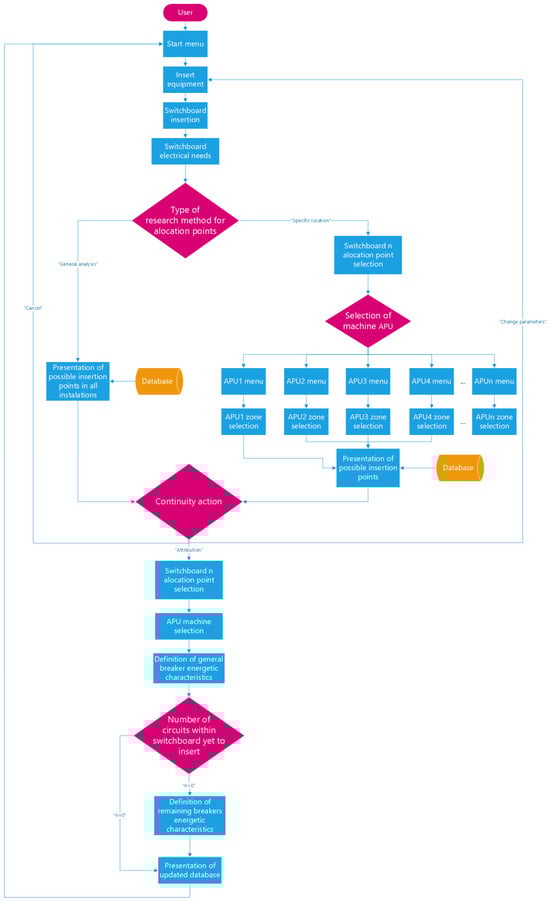
Figure 9.
Insert switchboard-type equipment flowchart using a specific location research method.
3.1.3. Electric Circuit Breaker Insertion
The electric circuit breaker function allows the user to complement or update the branches of the existing energy flow in the supplier equipment by adding internal links. Figure 10 presents the flowchart relative to the electric circuit breaker, which allows the user to supplement or update the branches of the existing energy flow in the supplier equipment by adding internal links.
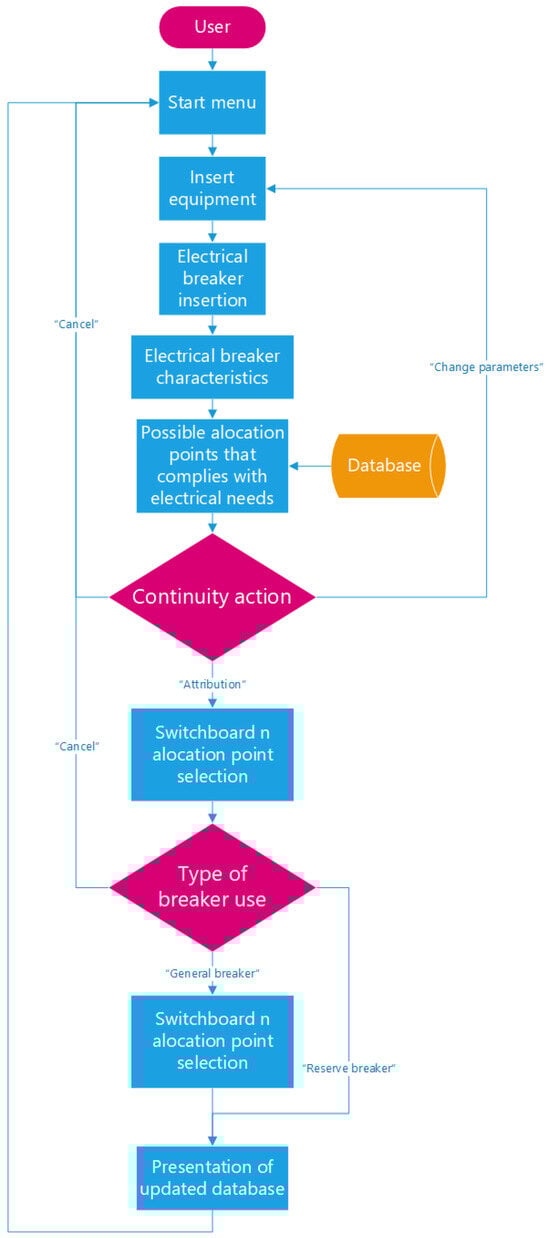
Figure 10.
Insert electric breaker-type equipment flowchart.
The user will be asked about parameters such as the Uadm, single- or three-phased voltage, and Iadm for this equipment. Once the search of the allocation points has been completed, the program opens the breaker assignment, which is identical to that carried out with the frame assignment menus. A conservative point of view must be maintained regarding the operating state of the allocated electric breakers provided by the %Space. The user follows it to define which circuit breaker will be used as a superior element of the energy flow supplying current and establishes if the new circuit breaker is a differential breaker or a reserve generic breaker. The differential breaker allocation is intended when a power supply equipment-type insertion is shared by more than a lower-level circuit breaker in the power flow. If the user chooses this purpose, the only remaining parameter to define will be the name of the differential breaker.
3.2. Equipment Removal
The remove equipment sub-program allows the user to deactivate equipment in the facility, whether it is obsolete, sent to maintenance or moved around the facility. Figure 11 explains the basic operating principles of the remove equipment flowchart.
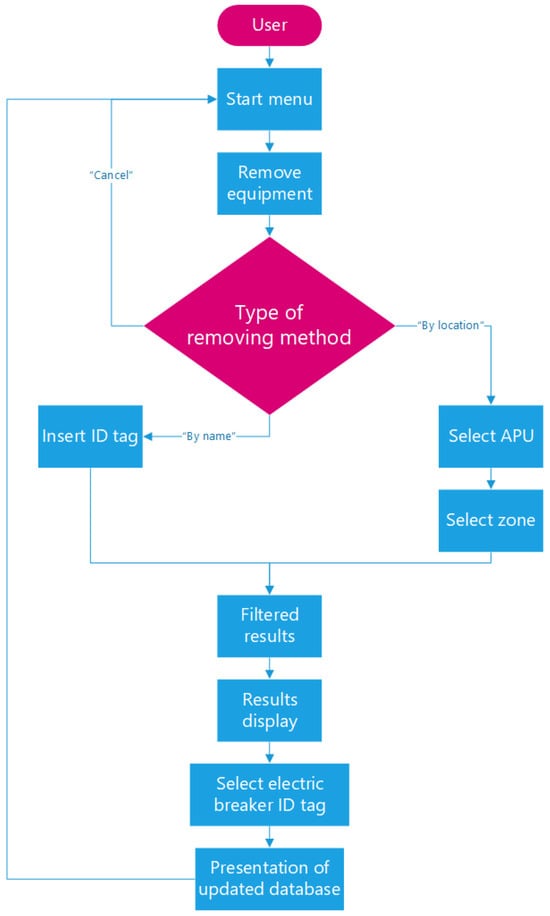
Figure 11.
Remove equipment simplified flowchart.
There are two ways to remove the desired equipment within the electrical network of the facilities, as shown in Figure 11:
- By tag.
The tag research method should be standard when the user has reasonable machine identification knowledge or nomenclature assigned to the breaker from where it is intended to detach the equipment. A further request for the name will be displayed, and the equipment will be withdrawn. There is also the possibility of inserting only one character, and the program will provide a list of all the equipment with that specific character in the name. As for the circuit breaker connected to the deallocated equipment, the program asks the user if the electric breaker stays in the electrical network as a final connection point to accommodate new equipment. This action will transfer the electric equipment to the reserve section. If there is no use in keeping the electric breaker, the program will eliminate this circuit breaker automatically.
- By location.
The search method by location should be used when the analyst knows the specific zone of disposal of the equipment. The method is particularly relevant when dealing with damaged or inaccessible machines. Having chosen the APU zone, the user can now analyze all the equipment arranged in that part of the facility and proceed with the equipment removal. All the sub-processes of the program that select and execute this task are analogous to the tag research method code.
3.3. Grid Overview
3.3.1. Grid Database, Pending Tags and Facility Plan
Following the grid overview menu from Figure 3, three trivial flowcharts are presented in Figure 12: grid database, pending tags, and facility plans (Figure 12a to Figure 12c, respectively).
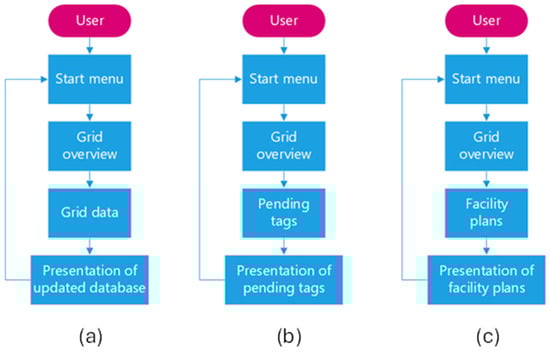
Figure 12.
(a) Grid database, (b) pending tags and (c) facility plan observation option simplified flowcharts.
The user is automatically forwarded to the program’s database by activating the grid database option (Figure 12a). This sub-menu allows a detailed analysis of all the characterization elements that monitor the electrical network. The pending tags observation option (Figure 12b) provides the user with the necessary information about the identification tags of the pendant circuit breakers for insertion in the respective electrical switchboards, resulting from the study and completion of inserting or removing equipment. This menu is essential for the electric network administration program to function adequately and manage the industrial facilities. The facility plans observation option (Figure 12c) enables the user to access the arrangement of energy supply equipment layouts within the facilities. Additionally, if there is a lack of description of the arrangement of equipment supplying electricity prior to a survey of the existing equipment on the premises, this information can be accessed swiftly with this sub-menu.
3.3.2. Locate Equipment
With the option to find equipment, the user might search for a detailed description of the location and respective characteristics of the energy flow path of any equipment from the electrical network. The flowchart in Figure 13 depicts this process.
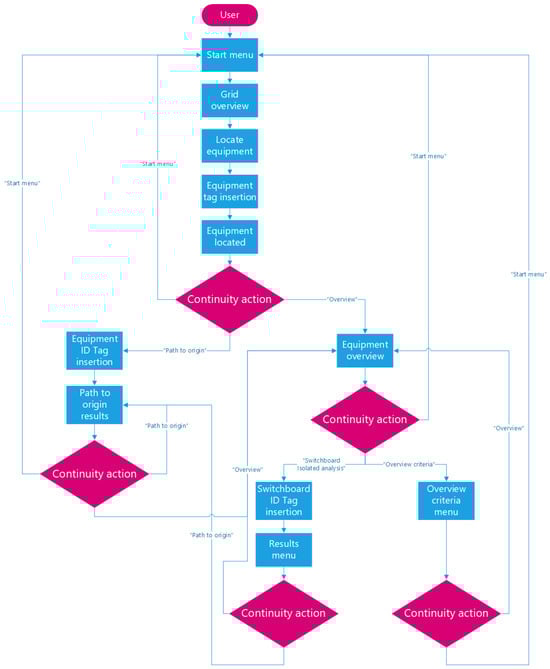
Figure 13.
Locate equipment observation option simplified flowchart.
An increase in flexibility and operational efficiency is attained using the locate equipment function since maintenance technicians and the facility manager share detailed knowledge of the network and its constituents (machines, switchboards, and electrical breakers). This method is highly innovative compared with some industrial strategies established based on trial-and-error criteria to locate the circuit breaker supplier of a particular equipment. Similar to the algorithm logic applicable to the removal equipment program, the locate equipment research method uses equipment identification to locate it. Through a system of nomenclature correspondence, the program displays all the circuit breakers and the equipment identification. The usefulness of this menu becomes more relevant as a complement to the insert and remove equipment programs since it enables an analysis of the location and properties of the located equipment for enhanced maintenance. The function path to origin allows the user to study the location and characteristics of the energy flow path upstream of the located equipment. As its name precedes it, the overview function is a grid observation option that will be addressed in depth later.
3.3.3. Isolate Switchboard
In the isolated switchboard observation mode described in the flowchart in Figure 14, the user gains awareness of the electrical load and available space allocation criticalities.
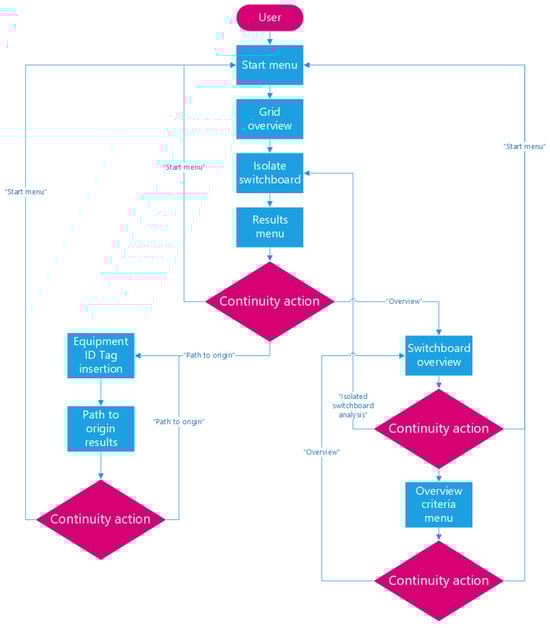
Figure 14.
Isolate switchboard observation option simplified flowchart.
Thanks to analyzing the internal connections established by the system of precedents (recall Figure 8), the energy flow of any equipment present in the electrical network within the facilities can be swiftly traced. The detailed analysis of any energy-supplying equipment for the facility is mobilized by the algorithm, which uses a system of nomenclature correspondence to present all the circuit breakers that contain the identification of the equipment providing energy proposed for analysis in their frame. After executing the matching algorithm, a results table is shown according to the switchboard tag.
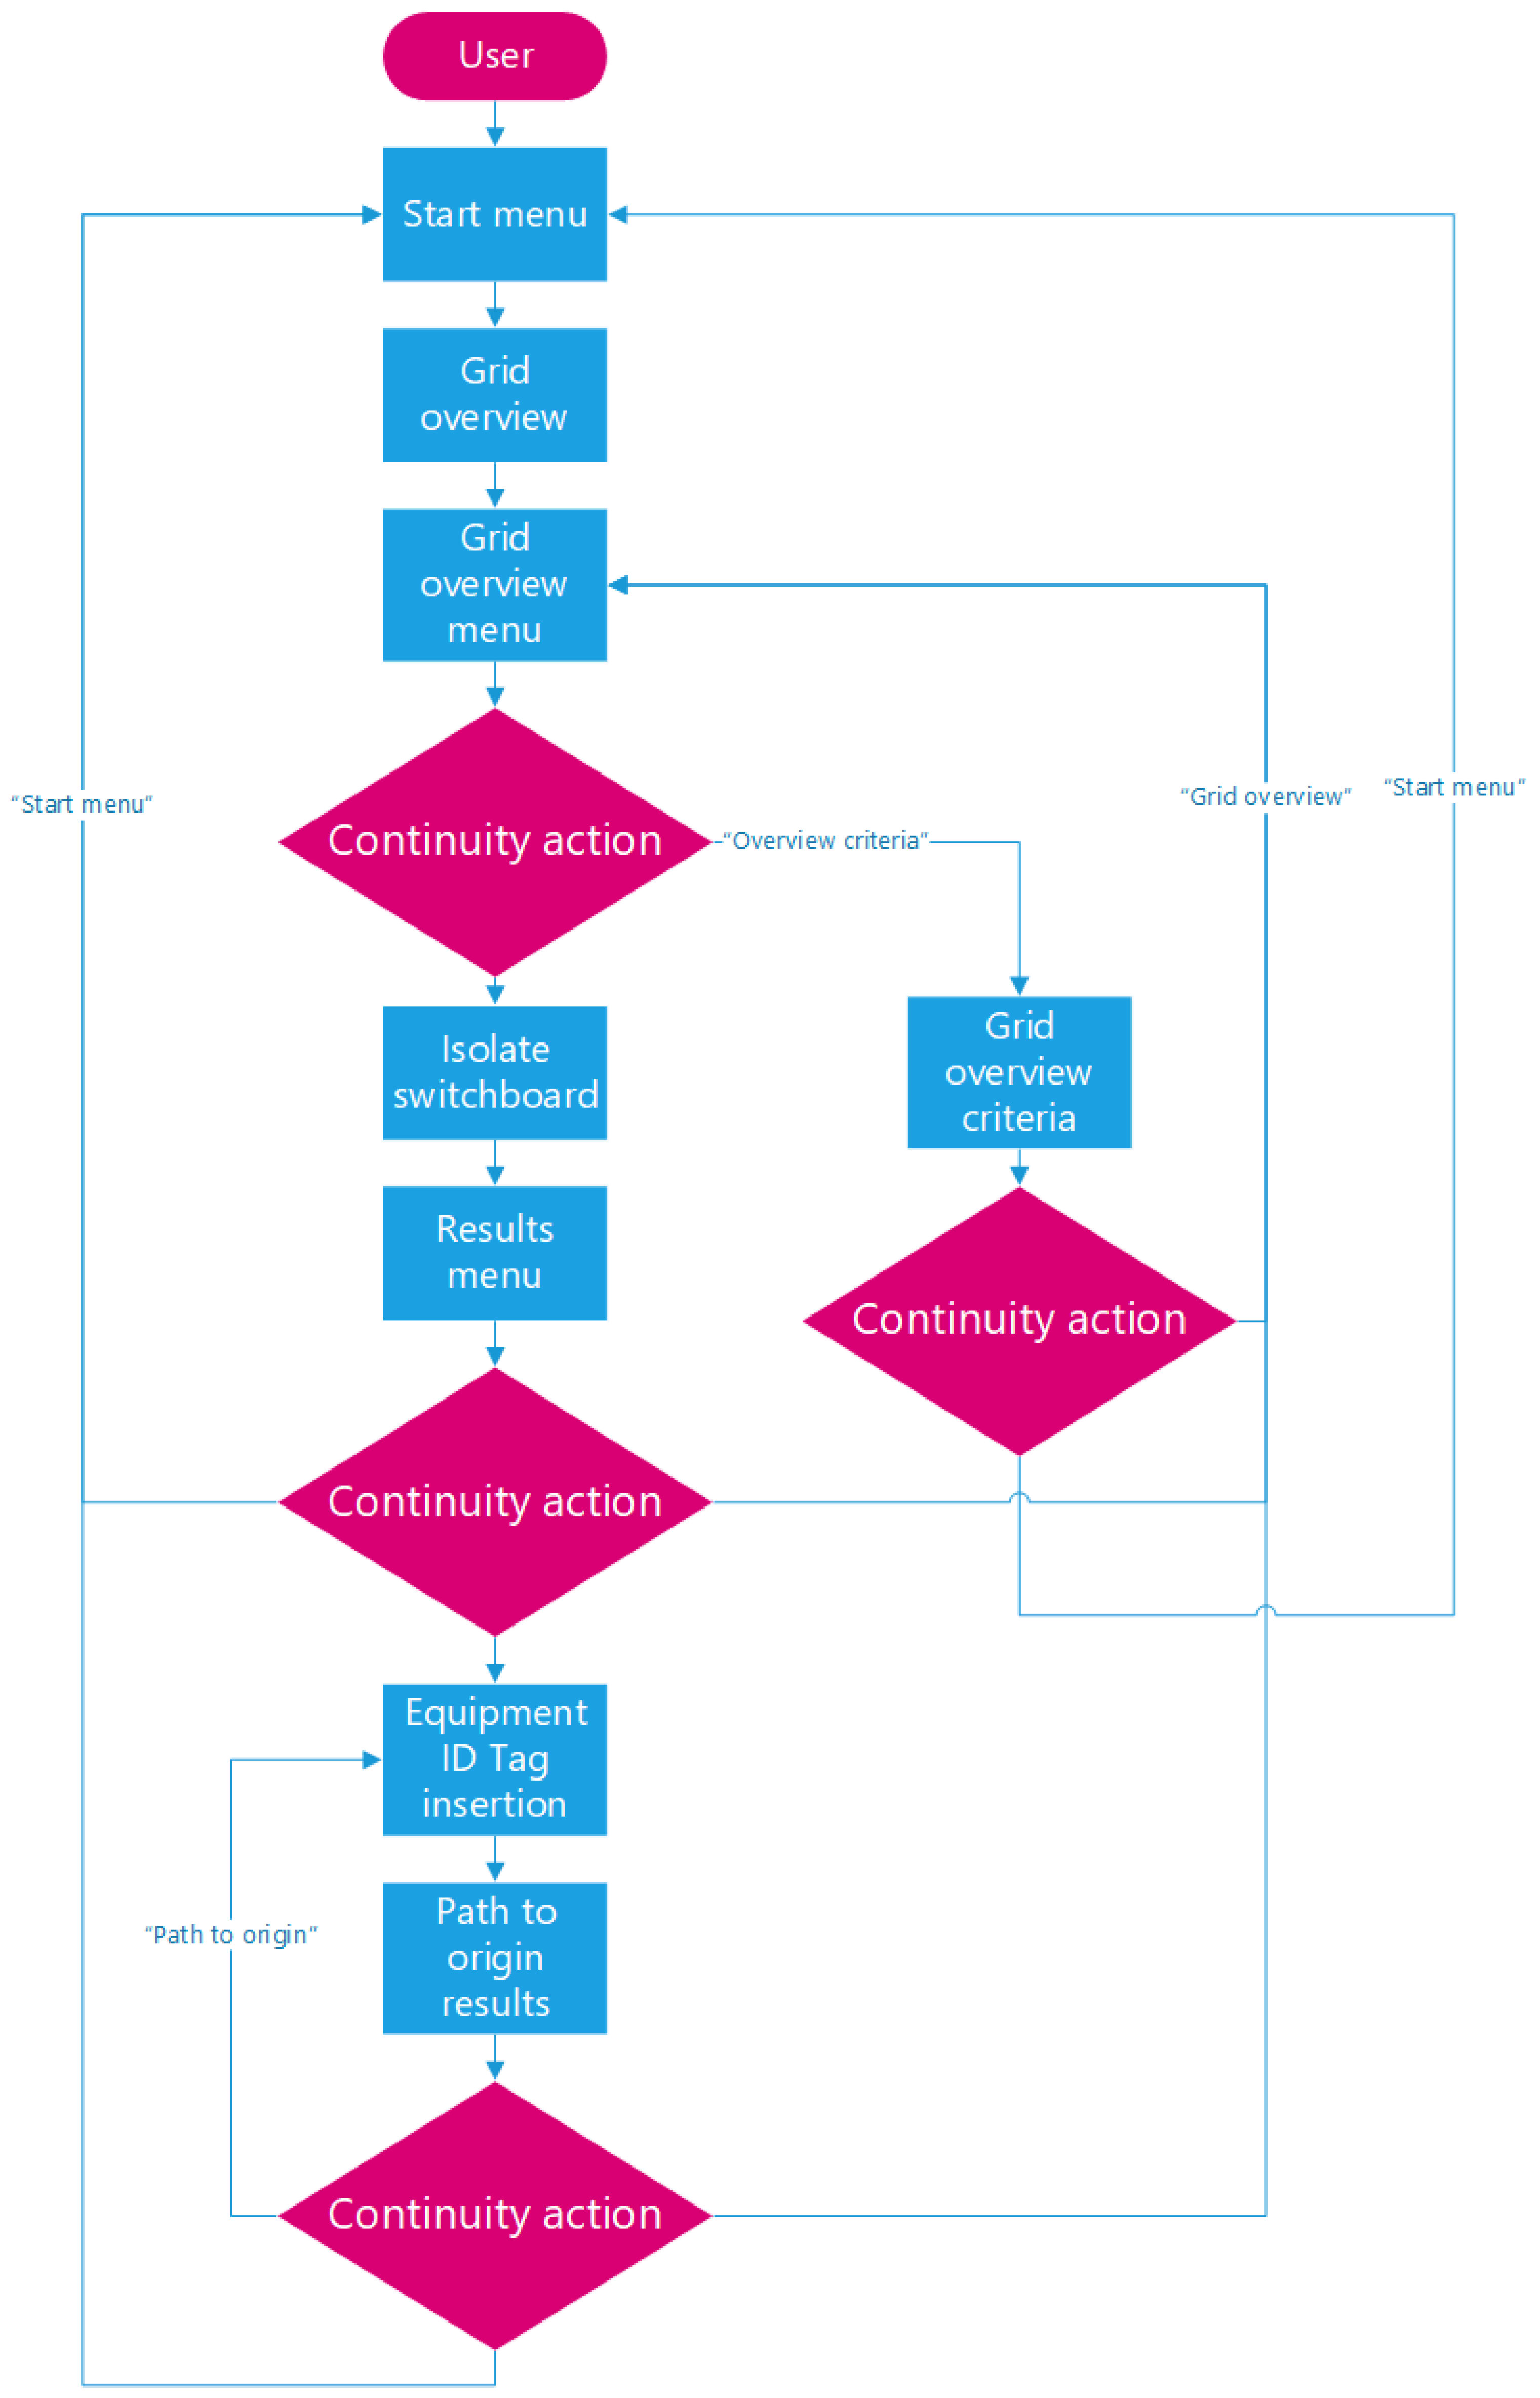
3.3.4. Grid General Overview
The grid overview observation option is strongly related to monitoring the arrangement of the electrical switchboards within the facilities and the respective criticalities. This last function incorporates the three main functions in Figure 15, which are used in grid monitoring.
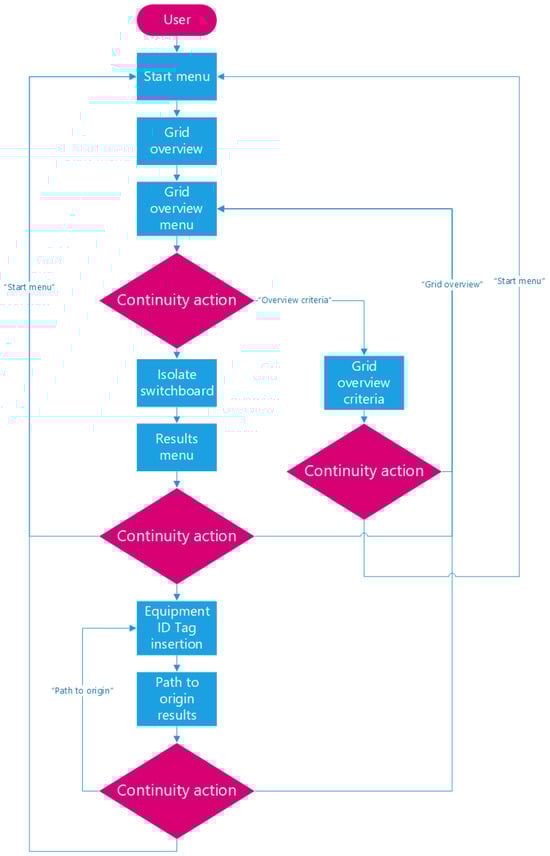
Figure 15.
Grid general overview option simplified flowchart.
The start menu option redirects the user to return to the program’s main menu when the analysis is finished. The grid overview user-established criteria are exhibited in Table 1. Those same criteria must be considered standard for the correct management of the electrical network, subsequently proceeding with their evaluation in the report provided by the grid overview menu.

Table 1.
Grid overview criteria menu.
From Table 1, the free space criterion is interlinked with the available electrical breakers for new equipment inside the analyzed switchboard. The grid overview observation mode displays all the characterizing elements of the electrical network defined throughout the project:
- Occupied electric breakers (OEBs), number of electric circuit breakers inside a switchboard with coupled equipment.
- Available electric breakers (AEBs), number of circuit breakers inside a switchboard.
- %Space, allowing the user to perceive and anticipate the possible space criticalities of switchboards. The ratio between the number of breakers with attached equipment and the total number of breakers in the switchboard establishes the variable given by Equation (1):
- Space representation, one of the three most graphical variables, represents the percentage of space occupation. Each column represented in red equals 10% of the occupied space with attached equipment, while those represented in green correspond to that available for equipment allocation.
- Occupied electric current (OEC) is the electric current consumed, defined as the sum of currents emitted by the switchboard to feed the equipment with energy needs, coupled through connections downstream of the energy flow.
- The AEC is the switchboard electric current available to supply possible incoming equipment.
- The ECL% represents the percentage of OEC effectively used by equipment coupled over the total electric current (TEC). It is a relation described in Equations (2) and (3). The parameter ECL% provides perception and identification of the criticality points in the facility’s energy-supplying equipment. It allows an analysis concerning the compromise between installing newer equipment and the risk of the analyzed switchboard’s rupture and, consequently, determines which points are most suitable for network expansion.
- Electric current representation, likewise, space representation, has the function of representing the ECL%. Each column represented in red equals 10% of the electric current consumed by the equipment attached to the switchboard.
- The percentage of global criticality (%Global) appears as a combination of the %Space and ECL% in a single analysis factor criticality of the power supply equipment.
- The global representation has the function of graphically representing the percentage of global criticality through columns of green or red color.
- Space evaluation (SE) concerns the numerical evaluation of the percentage of the %Space, as addressed in Table 1. With a straightforward color system interpretation, equipment that does not meet the %Space criteria is filled in red. The equipment that respects the %Space but must be kept under observation is painted in yellow, and those that are entirely under control will be in green,
- Electric current evaluation (ECE) refers to the numerical evaluation of the percentage of total available current in use, as addressed in Table 1. The algorithm is analogous to the one used with the SE.
- Global evaluation (GE) is the arithmetic sum of the SE and ECE numeric values, as described in Equation (4). The combination is performed by the sum of the two numerical evaluations on a single property, following criteria established by the user in the Criteria Overview Menu, which are all numerical values attributed to the free space and ECL(%), as described in Table 1. The color scheme is the same for the SE and ECE cases.
Section 4 addresses the results of the electrical management tool by showing the grid overview, which was the primary intended deliverable to the case-study enterprise so that the electrical grid could be supervised.
4. Results
Figure 16 packs all the vital information concerning the industrial facility’s electrical grid work by evaluating the switchboards and electrical breakers coupled to other switchboards or machines. This menu is available by accessing the sub-function grid general overview in Section 3.3.4.
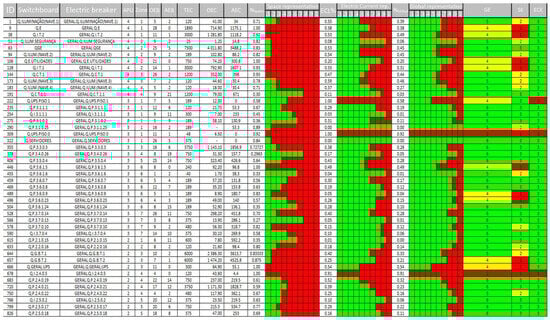
Figure 16.
Grid general overview table (Red: used; Green: available).
Once the electrical management tool is installed, a whole picture of the electrical network can be analyzed, thus preventing some criticalities from shutting down some APUs. For example, for the switchboards with ID309 and ID678 and regarding the %Space and ECL(%), the equipment is critically loaded. With the program’s implementation, facility managers can accurately act on these issues.
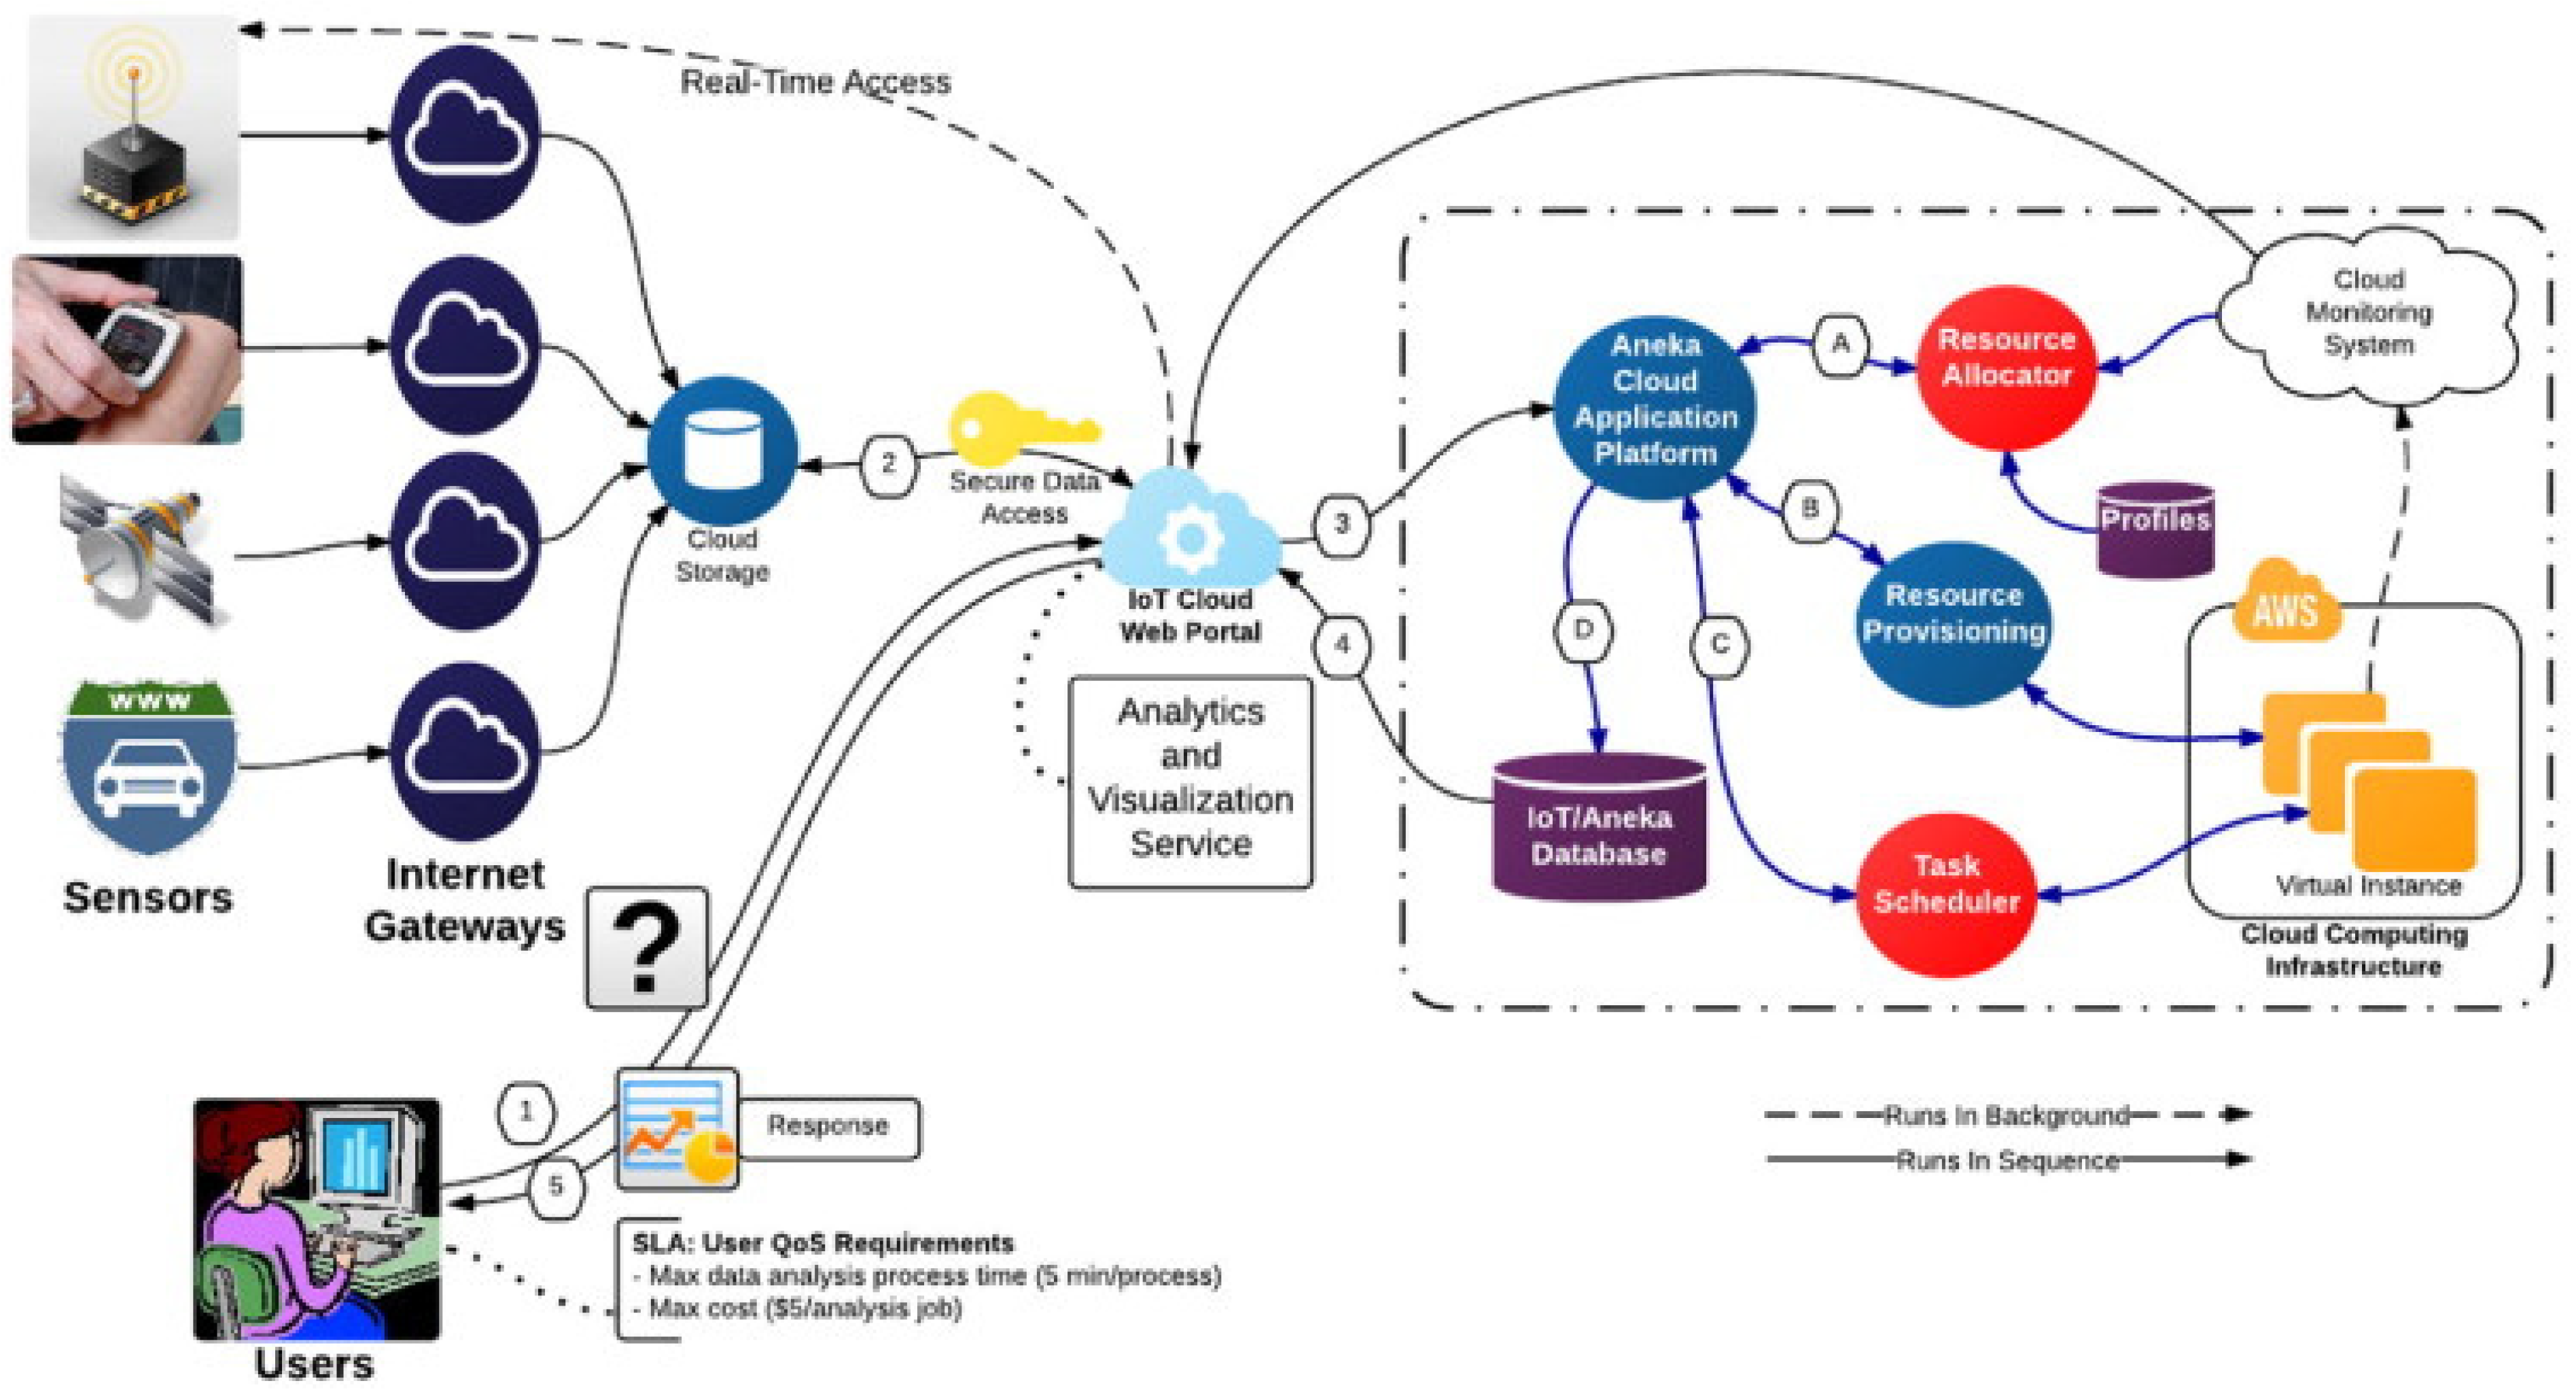
As regulations and restrictions on industrial and global social development become increasingly stringent, the most ambitious companies within these industries will strive to attain advanced knowledge and synchronization of all the processes involved in production. Although the current program demonstrates significant improvements in the electrical monitoring and management system, there remains room for enhancement, particularly in three key areas: (1) the optimization of the applied algorithms and menus to maximize the program’s efficiency; (2) the integration of intelligent sensor devices for actual flow measurement, utilizing IoT technology (Figure 17), which allows the export of data to the program and its treatment in real time, complying with Industry 4.0 and 5.0 (I4.0 and I5.0, respectively); and (3) all future advances in flow management programs must tend toward a single system that aggregates the operational flow. Only then will decision support methods be able to provide entirely assertive decisions within the business environment. Further investigation of these evolving topics and collaboration between professional personnel is needed. As such, this work is a simple contribution to better operational flow management of the shop-floor processes, emphasizing its potential.

Figure 17.
A model of the end-to-end interaction between various stakeholders in a cloud-centric IoT framework [27].
Section 5 will compare the tool with the most similar literature found, as applied to industrial facilities.
5. Discussion
Applying the electrical grid management tool to the automotive case-study enterprise has effectively produced a considerable difference in facilitating the study of the enterprise when redesigning the layout. Comparing it with the literature, Pokojski et al. [28] also proposed a computer support framework for conceptual design grounded in a real-life case study, emphasizing achieving high flexibility. Furthermore, the electrical grid management tool addresses the hardship of enhanced flexibility within production lines by meticulously analyzing, enhancing, and reorganizing electrical load distribution, encompassing all the essential facets of accurate project development.
The knowledge encapsulated and applied throughout this project should be regarded as a roadmap for uniformly integrating an innovative system characterized by simplicity and comprehensiveness in monitoring and managing the electrical grid inside the industry field. As a parallel example, Morariu et al. [29] used an AI-based approach for reality awareness and optimization in cloud manufacturing using big data techniques and machine-learning algorithms to process real-time information streams. Do [30], likewise, applied online analytic processing (OLAP) to a product data management (PDM) database employing a defined set of key performance indicators (KPIs) for ongoing product development performance evaluation. Though the electrical management tool may not be as dynamic as Morariu’s [29] and Do’s [30], it aligns with the company’s specific needs through an extensive database that underpins an effective decision-support methodology according to user-decided KPIs.
Component suppliers’ flexibility in responding to trends and advancements is of the utmost importance due to the ever-evolving landscape of automotive industries, necessitating continuous technological advancements and adaptability to dynamic market demands. Thus, with the application of the management tool, the enterprise enhanced its layout flexibility. Trappey and Hsiao [31] developed an information platform named the APQP hub, aiming for a modular and collaborative approach to product design. The principal achievement was introducing the APQP hub, highlighting a component repository incorporation, a collaborative design environment, a web-based configuration tool for modular automotive components, an online negotiation mechanism, and an improvement in real-time data exchange for participants within the automotive chain. The layout flexibility, industrial facility management, and BIM were the key factors systematically examined throughout this study, guiding the selection of essential information exchanges critical to optimal the tool’s performance.
Section 6 will address the main findings on the tool development and its application to the case-study enterprise.
6. Conclusions
Developing and implementing the electrical management tool in a case-study enterprise with a minimum revenue of EUR 50,000,000 has proven successful. From the proposed objectives, the findings of this research have been listed below:
- Effective integration of open-source algorithms into the electrical management system.
- Enhanced administration methods and tools for integrating new equipment without interrupting production lines.
- Open-source code availability allows for swift extrapolation and application across small and medium-sized organizations requiring high-flexibility layouts.
- The program’s transformative potential significantly adds value to the company, becoming a crucial industrial asset.
- Efficient transformation of vast quantities of dispersed information into accessible, filtered options.
- Improved electrical grid management.
- Recognition of the lack of electrical management in almost 90% of Portuguese small and medium enterprises.
- A comprehensive system for managing electrical flows, enhancing organizational flexibility and competitiveness.
- Applicability of the tool’s principles to solve similar problems in other industries, with adaptations to specific cases.
By implementing this tool, a comprehensive system for managing electrical flows has been apprehended, playing a pivotal role in elevating organizational flexibility and ensuring the company’s sustained competitiveness. Moreover, the principles of developing this tool can be applied to solve similar problems in other industries, adapting some flowcharts to specific cases. Therefore, this work intends to create the necessary knowledge roots that can be used to develop other significant tools within the scientific and academic community, taking advantage of the principles described here.
Author Contributions
Conceptualization: F.J.G.S. and R.R.M.; methodology: F.J.G.S. and R.D.S.G.C.; validation: A.F.V.P., A.G.P. and R.C.M.S.-C.; formal analysis: A.F.V.P., A.G.P. and R.C.M.S.-C.; investigation: R.R.M.; data curation: A.F.V.P., A.G.P. and R.C.M.S.-C.; writing—original draft preparation: A.F.V.P.; writing—review and editing: F.J.G.S., R.D.S.G.C. and R.C.M.S.-C.; visualization: A.F.V.P., A.G.P. and R.C.M.S.-C.; supervision: F.J.G.S. and R.D.S.G.C.; project administration: F.J.G.S.; funding acquisition: F.J.G.S. All authors have read and agreed to the published version of the manuscript.
Funding
This research received no external funding.
Institutional Review Board Statement
Not applicable.
Informed Consent Statement
Not applicable.
Data Availability Statement
No new data were created.
Acknowledgments
The authors thank Mário Cardoso from Fico Cables-Fábrica de Acessórios e Equipamentos Industriais, Lda, for his support and ISEP, CIDEM, for their institutional support.
Conflicts of Interest
The authors declare no conflicts of interest.
References
- Majumdar, S. Chapter 17—Cloud-Based Smart-Facilities Management. In Internet of Things; Buyya, R., Vahid Dastjerdi, A., Eds.; Morgan Kaufmann: Burlington, MA, USA, 2016; pp. 319–339. [Google Scholar]
- Awang, M.; Mohammed, A.H.; Rahman, M.S.A.; Abdullah, S.; Mod, M.Z.C.; Sani, S.I.A.; Hamadan, N. Facility Management Competencies in Technical Institutions. Procedia Soc. Behav. Sci. 2012, 65, 755–760. [Google Scholar] [CrossRef]
- Leygonie, R.; Motamedi, A.; Iordanova, I. Development of quality improvement procedures and tools for facility management BIM. Dev. Built Environ. 2022, 11, 100075. [Google Scholar] [CrossRef]
- Kang, C.-N.; Kung, L.-C.; Chiang, P.-H.; Yu, J.-Y. A service facility location problem considering customer preference and facility capacity. Comput. Ind. Eng. 2023, 177, 109070. [Google Scholar] [CrossRef]
- ISO 41001:2018(E); Facility Management—Management Systems—Requirements with Guidance for Use. International Organization for Standardization: Geneva, Switzerland, 2018; p. 56.
- Burova, A.; Mäkelä, J.; Heinonen, H.; Palma, P.B.; Hakulinen, J.; Opas, V.; Siltanen, S.; Raisamo, R.; Turunen, M. Asynchronous industrial collaboration: How virtual reality and virtual tools aid the process of maintenance method development and documentation creation. Comput. Ind. 2022, 140, 103663. [Google Scholar] [CrossRef]
- Zhao, Y.; Taib, N. Cloud-based Building Information Modelling (Cloud-BIM): Systematic literature review and Bibliometric-qualitative Analysis. Autom. Constr. 2022, 142, 104468. [Google Scholar] [CrossRef]
- Gao, X.; Pishdad-Bozorgi, P. BIM-enabled facilities operation and maintenance: A review. Adv. Eng. Inform. 2019, 39, 227–247. [Google Scholar] [CrossRef]
- Di Biccari, C.; Calcerano, F.; D’Uffizi, F.; Esposito, A.; Campari, M.; Gigliarelli, E. Building information modeling and building performance simulation interoperability: State-of-the-art and trends in current literature. Adv. Eng. Inform. 2022, 54, 101753. [Google Scholar] [CrossRef]
- Xu, W.; Wu, R.; Wang, L.; Zhao, X.; Li, X. Solving a multi-objective distributed scheduling problem for building material equipment group enterprises by measuring quality indicator with a product gene evaluation approach. Comput. Ind. Eng. 2022, 168, 108142. [Google Scholar] [CrossRef]
- Yilmaz, G.; Akcamete, A.; Demirors, O. BIM-CAREM: Assessing the BIM capabilities of design, construction and facilities management processes in the construction industry. Comput. Ind. 2023, 147, 103861. [Google Scholar] [CrossRef]
- Deng, M.; Tan, Y.; Singh, J.; Joneja, A.; Cheng, J.C.P. A BIM-based framework for automated generation of fabrication drawings for façade panels. Comput. Ind. 2021, 126, 103395. [Google Scholar] [CrossRef]
- Wang, W.; Guo, H.; Li, X.; Tang, S.; Li, Y.; Xie, L.; Lv, Z. BIM Information Integration Based VR Modeling in Digital Twins in Industry 5.0. J. Ind. Inf. Integr. 2022, 28, 100351. [Google Scholar] [CrossRef]
- Pan, Y.; Stark, R. An interpretable machine learning approach for engineering change management decision support in automotive industry. Comput. Ind. 2022, 138, 103633. [Google Scholar] [CrossRef]
- Djordjevic, I.; Petrovic, D.; Stojic, G. A fuzzy linear programming model for aggregated production planning (APP) in the automotive industry. Comput. Ind. 2019, 110, 48–63. [Google Scholar] [CrossRef]
- Andres, B.; Poler, R.; Sanchis, R. A data model for collaborative manufacturing environments. Comput. Ind. 2021, 126, 103398. [Google Scholar] [CrossRef]
- Iaksch, J.S.; Borsato, M. Method for digital evaluation of existing production systems adequacy to changes in product engineering in the context of the automotive industry. Adv. Eng. Inform. 2019, 42, 100942. [Google Scholar] [CrossRef]
- Einabadi, B.; Mahmoodjanloo, M.; Baboli, A.; Rother, E. Dynamic predictive and preventive maintenance planning with failure risk and opportunistic grouping considerations: A case study in the automotive industry. J. Manuf. Syst. 2023, 69, 292–310. [Google Scholar] [CrossRef]
- Dias, P.; Silva, F.J.G.; Campilho, R.D.S.G.; Ferreira, L.P.; Santos, T. Analysis and Improvement of an Assembly Line in the Automotive Industry. Procedia Manuf. 2019, 38, 1444–1452. [Google Scholar] [CrossRef]
- Moreira, B.M.D.N.; Gouveia, R.M.; Silva, F.J.G.; Campilho, R.D.S.G. A Novel Concept of Production and Assembly Processes Integration. Procedia Manuf. 2017, 11, 1385–1395. [Google Scholar] [CrossRef]
- Hribernik, K.; Cabri, G.; Mandreoli, F.; Mentzas, G. Autonomous, context-aware, adaptive Digital Twins—State of the art and roadmap. Comput. Ind. 2021, 133, 103508. [Google Scholar] [CrossRef]
- Arnarson, H.; Yu, H.; Olavsbråten, M.M.; Bremdal, B.A.; Solvang, B. Towards smart layout design for a reconfigurable manufacturing system. J. Manuf. Syst. 2023, 68, 354–367. [Google Scholar] [CrossRef]
- Habibi, S. Chapter 2—The disciplines of architectural design and construction technology. In Building Automation and Digital Technologies, Habibi, S., Ed.; Woodhead Publishing: Cambridge, UK, 2022; pp. 39–88. [Google Scholar]
- Khorasany, M.; Najafi-Ghalelou, A.; Razzaghi, R.; Mohammadi-Ivatloo, B. Transactive energy framework for optimal energy management of multi-carrier energy hubs under local electrical, thermal, and cooling market constraints. Int. J. Electr. Power Energy Syst. 2021, 129, 106803. [Google Scholar] [CrossRef]
- Elavarasan, R.M.; Mudgal, V.; Selvamanohar, L.; Wang, K.; Huang, G.; Shafiullah, G.M.; Markides, C.N.; Reddy, K.S.; Nadarajah, M. Pathways toward high-efficiency solar photovoltaic thermal management for electrical, thermal and combined generation applications: A critical review. Energy Convers. Manag. 2022, 255, 115278. [Google Scholar] [CrossRef]
- Habibi, S. Chapter 4—The role of environmental studies in driving automation and digital transformation. In Building Automation and Digital Technologies, Habibi, S., Ed.; Woodhead Publishing: Cambridge, UK, 2022; pp. 121–160. [Google Scholar]
- Gubbi, J.; Buyya, R.; Marusic, S.; Palaniswami, M. Internet of Things (IoT): A vision, architectural elements, and future directions. Future Gener. Comput. Syst. 2013, 29, 1645–1660. [Google Scholar] [CrossRef]
- Pokojski, J.; Oleksiński, K.; Pruszyński, J. knowledge based processes in the context of conceptual design. J. Ind. Inf. Integr. 2019, 15, 219–238. [Google Scholar] [CrossRef]
- Morariu, C.; Morariu, O.; Răileanu, S.; Borangiu, T. Machine learning for predictive scheduling and resource allocation in large scale manufacturing systems. Comput. Ind. 2020, 120, 103244. [Google Scholar] [CrossRef]
- Do, N. Application of OLAP to a PDM database for interactive performance evaluation of in-progress product development. Comput. Ind. 2014, 65, 636–645. [Google Scholar] [CrossRef]
- Trappey, A.J.C.; Hsiao, D.W. Applying collaborative design and modularized assembly for automotive ODM supply chain integration. Comput. Ind. 2008, 59, 277–287. [Google Scholar] [CrossRef]


Disclaimer/Publisher’s Note: The statements, opinions and data contained in all publications are solely those of the individual author(s) and contributor(s) and not of MDPI and/or the editor(s). MDPI and/or the editor(s) disclaim responsibility for any injury to people or property resulting from any ideas, methods, instructions or products referred to in the content. |
© 2024 by the authors. Licensee MDPI, Basel, Switzerland. This article is an open access article distributed under the terms and conditions of the Creative Commons Attribution (CC BY) license (https://creativecommons.org/licenses/by/4.0/).