Abstract
Fatigue refers to the progressive and localized structural damage that occurs when a material is subjected to repeated loading and unloading, typically at levels below its ultimate strength. Several failure mechanisms have been observed in practical scenarios, encompassing high-cycle, low-cycle, thermal, surface, corrosion, and fretting fatigue. Fatigue, connected to the failure of numerous engineered products, stands out as a prevalent cause of structural failure in service. Conducting research on the advancement and application of fatigue analysis technologies is crucial because fatigue analysis plays a critical role in determining the service life of components and mitigating the risk of failure. This study compiles data from a wide range of sources and offers a thorough summary of the state of fatigue analysis. It focuses on the effects of different parameters, including hardness, temperature, residual stresses, and hardfacing, on the fatigue life of different materials and their alloys. The fatigue life of alloys is typically high at low temperatures, but it is significantly reduced at high temperatures or under high-stress conditions. One of the main causes of lower fatigue life is residual stress. High-temperature conditions and hardfacing processes cause the development of tensile residual stresses, which in turn decreases fatigue life. But, if the hardness of the material significantly increases due to hardfacing, then the fatigue life also increases. This manuscript focuses on reviewing the research on fatigue-life prediction methods, shortcomings, and recommendations.
1. Introduction
Fatigue is defined as a type of failure caused by a repeated load that does not exceed the point of failure in a single occurrence [1]. The way materials react and break down when subjected to repetitive stresses, such as mechanical or thermal loads, is communicated using engineering language. Fatigue damage is identified by the nucleation, coalescence, and stable propagation of cracks that can result in the material either yielding or fracturing in a brittle manner. Fatigue also refers to the development and propagation of cracks in a material caused by cyclic loading. With each cycle of loading, an expanding fatigue crack frequently leaves striations on particular areas of the fracture surface [2]. Fatigue damage holds a dominant status as a life-limiting issue for most structural components subjected to varying stress in service situations [3]. Defects arise in structural components during the manufacturing, fabrication, assembly, repair, and maintenance stages. Fatigue is predicted to account for at least half of all mechanical failures [2]. A bolt fatigue failure caused by repeated unidirectional bending is illustrated in Figure 1. The failure began at the thread root at A, spread throughout the cross-section as indicated by beach markings at B, and ended in the final fracture part as shown by C [4].
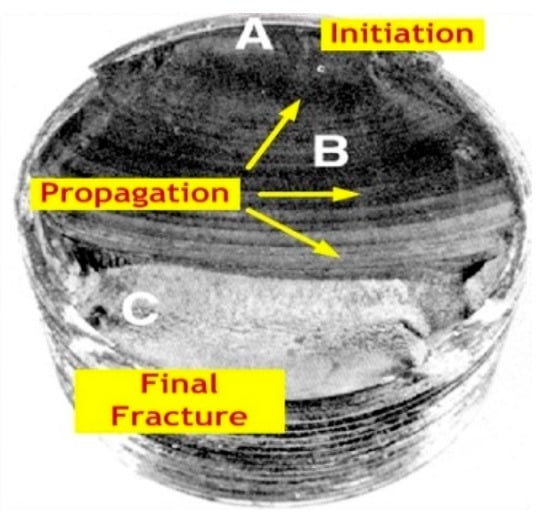
Figure 1.
Fatigue failure of a bolt [4].
Crack spreading with a constant-amplitude load occurs very rarely in real applications for cyclic structures. To describe the rate of fracture propagation under conditions of constant-amplitude loading, a number of crack propagation models have been created, including the Paris law and the Forman/Mettu crack growth equation [5]. Variable-amplitude loading frequently results in load sequence effects compared to constant-amplitude loading, which may accelerate, retard, or stop crack propagation [6]. Small fatigue cracking is also a cause of crack growth [7]. In addition to the fact that the propagation of small fatigue fractures consumes a significant percentage of the overall fatigue life, the behavior of small fatigue cracks is crucial because it determines which fatigue regimes are safe and which are potentially dangerous. The probability of small cracks being elastic-plastic, as opposed to linear elastic, is greater due to the significantly high ratio of fatigue strength to yield strength. Thus, the ratio between the length of the plastic zone and the fracture length increases [8].
A fullyreversed cyclic axial loading condition is used to primarily examine the fatigue life utilizing cylindrical specimens [9]. A considerable amount of research has been devoted to predicting the onset and propagation of fatigue cracks to estimate the approximate number of cycles until specimen failure. Fatigue life has two stages: the initiation phase when a minor fracture first appears, and the propagation phase when the crack expands to a critical size and causes specimen failure. The growth prediction method establishes a correlation between fatigue damage and the number of cycles with respect to fatigue life [10]. Figure 2 depicts the progress of damage from the beginning of a crack to eventual failure. The length of each of these stages is affected by a variety of parameters, including the load, surroundings, and stress concentration [11].

Figure 2.
Stages of failure in terms of crack length versus time/cycles of service [11].
Structural failure caused by fatigue is a prevalent reason for malfunction in various mechanical parts. Understanding the factors that affect the fatigue life of a component is essential to designing reliable and safe structures. This paper discusses some of the key factors that affect the fatigue life of a component [12].
Comprehensive Overview of Fatigue Analysis
In the realm of engineering, fatigue analysis emerges as an essential discipline for ensuring the reliability and safety of numerous structures and components exposed to cyclic loading. The consequences of fatigue failure are severe, encompassing financial setbacks, infrastructure deterioration, and potential harm to individuals or loss of life. Hence, fatigue analysis assumes paramount importance in safeguarding the longevity and structural integrity of diverse engineering components and structures. Fundamental ideas regulating the behavior of materials under cyclic loading are at the core of fatigue analysis. The S–N curve, fatigue life, fatigue crack initiation and propagation, and stress concentration constitute major roles in fatigue analysis. Differences in microstructure, composition, loading conditions, and environmental factors all influence the fatigue characteristics of materials. The metals mainly link to the microstructural features, including grain boundaries, defects, and metallurgical phases. In the present scenario, fatigue analysis is characterized by analytical and experimental methods like finite element analysis, strain life and stress life tests, rotary bending tests, non-destructive testing such as ultrasonic testing, and magnetic particle inspection that monitors fatigue damage. Fatigue analysis is crucial for enhancing engineering systems’ safety, reliability, and longevity amidst challenges posed by cyclic loading. It achieves this by advancing our comprehension of fatigue mechanisms, developing predictive models, and implementing effective mitigation strategies.
In this paper, an extensive review of fatigue life analysis of mechanical and structural components has been presented. Particular emphasis will be given to the effects of temperature, residual stress, hardness, hardfacing, and different mechanical properties. This paper also discusses crack initiation and propagation that lead to the failure of components. The subsequent sections of the article are organized as follows. In Section 1, an introduction to fatigue life and a comprehensive overview of fatigue analysis are presented. Section 2 concerns problems related to fatigue. Section 3 emphasizes the effect of different parameters on fatigue life. Section 4 presents the effect of mechanical properties on the fatigue life of structural components. Section 5 presents the evaluation and development of fatigue life from the early 1990s to 2024. Section 6 delves into recent research focal points and prospective future development in fatigue analysis, while Section 7 provides a summary of conclusions.
2. Problems Related to Fatigue
Failures caused by fatigue can lead to significant consequences, ranging from minor malfunctions to devastating accidents [2]. According to certain authors, two distinct types of materials are identified: the first type is fatigue cracks that initiate from the surface due to slip bands across the entire fatigue range and lack inclusions or internal imperfections, while the second type demonstrates fatigue behavior in the very high-cycle fatigue regime characterized by internal crack initiations induced by any form of volume imperfections [13]. Metallurgical flaws are introduced during manufacturing operations such as forging, machining, cladding, and heat treatment. Micro cracks are mainly induced and propagated via cyclic loading, which leads to failure. Material flaws such as inclusions, voids, and porosities act as starting points for fatigue cracks to develop. In aluminum alloys, it is widely recognized that fatigue cracks predominantly originate from inclusions [4,6]. High and variable temperatures are also a reason for material flaws. At high temperatures, AA6061 is not preferable for automobile components. Wear loss is high at low temperatures due to low contact stresses [14]. The surface condition significantly influences the fatigue life of parts. Elevated surface roughness results in the formation of intermittent small gaps, leading to stress concentration and consequently shortening fatigue life [15,16]. High-stress concentrations such as notches, fillets, and sharp corners are also prone to fatigue failure. Residual stresses created during manufacturing processes accelerate the beginning and propagation of fatigue cracks. Residual stresses introduce complex stress states in materials, which can lead to unpredictable fatigue behavior. Stress corrosion cracking and hydrogen embrittlement exemplify environmentally assisted cracking mechanisms that can be exacerbated by residual tensile stresses. These mechanisms can lead to diminished fatigue life and accelerate fatigue crack propagation, particularly in severe environments [17,18,19,20]. The interaction between applied stresses and residual stresses can result in stress concentrations, multiaxial loading conditions, and non-uniform stress distributions, making fatigue life prediction challenging. Hardfacing has both positive and negative effects on fatigue life [15,21]. Significant residual stresses are often imparted onto the component during the application of hardfacing materials, such as through thermal spraying or welding [22]. These residual stresses can act as potential sites for the initiation and propagation of cracks, thereby reducing the fatigue life of the component. Stress concentration sites can emerge at the interface between the hardfacing layer and the underlying material. These localized areas of elevated stress, stemming from the stress concentration, heighten the component’s vulnerability to the initiation and propagation of fatigue cracks [23,24,25,26]. An uneven distribution of carbon in the parent structure during the carburization of steel can result in the hardening of its surface and the development of small cracks [7,27]. Failures in shafts almost always start on the surface, usually at locations where mechanical or metallurgical stress concentrations increase local strains [28,29]. The aforementioned factors are primary contributors, but there are numerous others that can also diminish the fatigue life and lead to component failure.
3. Effects of Different Parameters on Fatigue Life of the Components
3.1. Effect of Temperature
In general, when temperature rises, a material’s fatigue life is reduced [23]. Various metallic components in the shape of cylinders, such as pressure vessels and pipes, which are utilized in the construction of aircraft, are exposed to temperatures ranging from −60 °C (213 °K) to 250 °C (523 °K). Due to these temperatures, it is essential to examine the impact of fatigue on surface cracks under diverse climatic conditions, particularly in specific technical applications.
The impact of temperature on the fatigue life behavior of the aluminum alloy AA 6061 was investigated using an analytical technique [30]. Temperature had a substantial influence on the number of cycles until failure in fatigue life research at high temperatures. The aluminum alloy AA6061 is beneficial in circumstances with high ambient temperatures due to its lower weight, excellent mechanical properties, and improved corrosion resistance. When fatigue life was compared at 300 °C to that at ambient temperature, the number of cycles until failure decreased by up to 99%. The reduction was primarily caused by the acceleration of oxidation at high temperatures and the deterioration of the mechanical properties with increasing temperatures. As a result, the aluminum alloy AA6061 cannot be utilized for high-temperature applications because of the significant reduction in cycles until failure rendering it unsuitable for use in engine parts in automobiles. Therefore, this research confirms that the use of AA6061 in high-temperature conditions should be avoided [14].
The influence of temperature on the fatigue life of materials in nuclear reactor main bolts was investigated. The Ni-Cr-Mo-V alloy is used as an experimental material for the main bolt of the pressure vessel in a pressurized water reactor. The range of stress during high temperatures had a significant impact on the bolt’s fatigue life. There was a clear temperature effect, and it was evident that the fatigue life of the bolt material rapidly decreased with a constant temperature rise. When a fatigue specimen’s temperature is elevated from room temperature to 200 °C, the material’s fatigue life decreases significantly. However, the decrease in the material’s fatigue life is only marginal when the temperature is raised from 200 °C to 360 °C. At an ambient temperature, the fatigue limit of the smooth specimen is 845.0 MPa, which decreases to 790.0 MPa and 770.0 MPa when the temperature is raised to 200 °C and 360 °C, respectively [24]. When the samples of Alloy 617 were evaluated at 25 °C, 800 °C, and 850 °C, distinct cyclic hardness, saturation, and softening were seen. The samples underwent up to 100 cycles of hardening before continuously softening at a temperature of 25 °C. Due to decreased strain, consistent cyclic hardening was seen for the majority of cycles at 800 °C. In a few initial cycles at 850 °C, there was significant cyclic hardening. From the first cycle at 900 °C, the specimens become softer. At 950 °C, there was a similar cyclic softening behavior, with the exception of an abrupt decrease in the magnitudes of the maximum and minimum stresses observed during the initial cycles. At high temperatures, the material became more brittle, which is why the material showed softening between 800 and 950 °C. The specimens that were tested at 25 °C, 800 °C, and 850 °C underwent cyclic hardening, whereas those that were examined above 900 °C underwent cyclic softening from the first cycle, meaning that their fatigue life was shortened at high temperatures as a result of a loss of strength. The fatigue life is much longer at 25 °C than it is between 800 and 950 °C. This occurs due to a loss of strength at high temperatures. It is interesting to note that in the 800–950 °C temperature range, the fatigue life is not significantly impacted by temperature [25]. An analytical approach was employed to investigate how temperature influences the fatigue behavior of the aluminum alloy AA6061. The fatigue life analysis conducted at elevated temperatures revealed a significant impact of temperature on the number of cycles until failure. Due to its lighter weight, superior mechanical properties, and enhanced corrosion resistance, aluminum alloy AA6061 proves to be a valuable material in applications with ambient temperature conditions [31]. When comparing the fatigue life at 300 °C to that at an ambient temperature, a substantial 99% decrease in the number of cycles until failure was observed. Consequently, the use of aluminum alloy AA6061 in high-temperature environments is not advisable due to this notable reduction in the number of cycles until failure. In high-temperature conditions, most moving components within an automobile engine are susceptible to fatigue. Therefore, the findings of this study underscore the inadvisability of using aluminum alloy AA6061 for automotive engine parts exposed to high temperatures [26,31].
Fatigue tests were carried out on specimens composed of two different types of aluminum wrought alloy, namely AA6061-T6 and AA7075-T6 [30]. The ASTM E466-07 guidelines were followed to determine the dimensions of the dumbbell-shaped specimens, which were machined from solid wrought bars. In total, 38 specimens were subjected to fatigue testing, as shown in Figure 3. For both aluminum alloys, the loading sequence from hightolow and the constant-amplitude loading (CAL) resulted in the lowest number of cycles until failure [32], whereas the low-to-high loading sequence yielded the highest number of cycles. Under the low-to-high loading sequence, the number of cycles for AA6061 was 56% greater than that for CAL, while the difference between these loading sequences was 84% for AA7075. This observed difference can be attributed to the distinct properties of the two alloys, suggesting that AA7075 experienced loading sequences with greater intensity compared to AA6061. Figure 4a,b depicts the influence of elevated temperatures on the fatigue life for each type of loading sequence. It is worth noting that, as temperature increased, the number of cycles until failure for both alloys decreased exponentially [33]. Previous authors investigated the stress-life methodology to predict the fatigue life of aluminum alloy wheels utilizing simulation techniques. Their investigations revealed that at a temperature of 250 °C, the AA6110 aluminum alloy experiences a significant 96% decrease in fatigue life [30]. Similarly, the AA6061 aluminum alloy has been found to show an 80% reduction in fatigue life under the same elevated-temperature conditions [33,34]. When fatigue occurs at higher temperatures, it results in substantial strain deformation, facilitates the initiation of cracks, and accelerates the rate at which cracks propagate. At elevated temperatures, crack initiation occurs at an earlier stage, and the rates of crack growth are markedly higher when compared to what is observed at standard ambient temperatures [26,30].
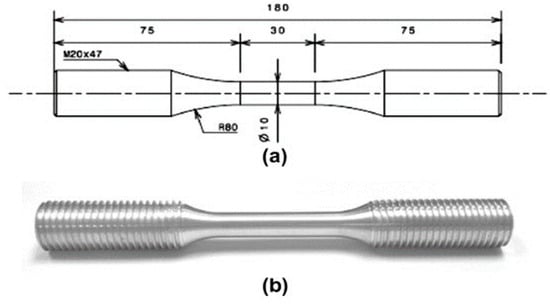
Figure 3.
Specimen design: (a) specimen geometry in millimeters, and (b) image of the actual machined specimen [30].
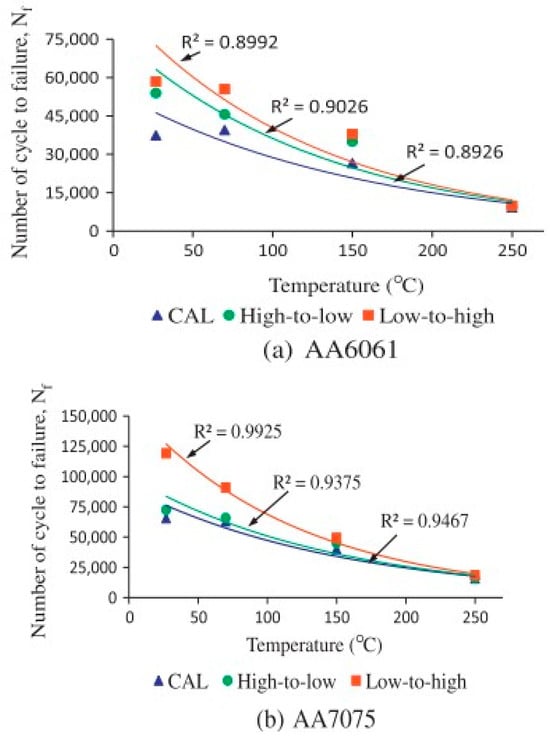
Figure 4.
(a) Comparison of the number of cycles until failure under the different loading sequences for AA6061, (b) Comparison of the number of cycles until failure under the different loading sequences for AA7075 [30].
The deformation characteristics and dislocation behaviors of metal alloys are simultaneously influenced by temperature and strain rate. Investigations into the effect of temperature on cyclic stress–strain rates were conducted on copper and 304 stainless steel. These studies found that tests at high strain rates remained unaffected by temperature. However, the mechanism of the time-dependent fracture was predominantly observed at high temperatures and low strain rates. In this experiment, strain rates ranged from 2 × 10⁻² to 4 × 10⁻¹ per second, while temperatures varied from −75 °C to 760 °C. The stress responses of both stainless-steel and copper specimens decreased with increases in temperature, as illustrated in Figure 5. Moreover, the material exhibited increased strain rate sensitivity with rising temperatures. In the testing environment, the monotonic flow stress and strain hardening exponent decreased with the elevation of the ambient temperature. Consequently, at high temperatures, this led to a narrow stress–strain curve with a minimal slope. Notably, there exists a negative linear relationship between the strain hardening exponent and temperature in face-centered cubic (FCC) metals [17].
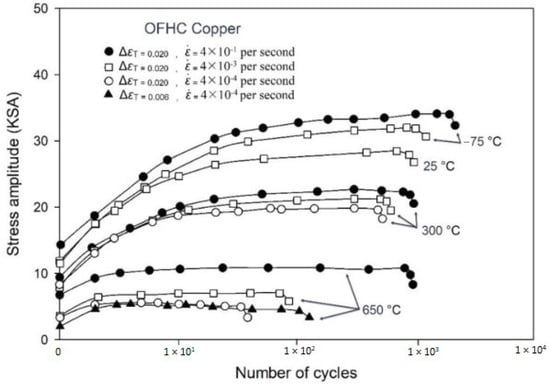
Figure 5.
Stress amplitude for copper in temperature range [17].
K. Tahmasbi et al. created fatigue specimens using rotary friction welding (RFW) at various rotational speeds. The temperature dynamics were investigated using RFW experiments on dissimilar polymer rods, and the outcomes were compared to simulations conducted using ANSYS Workbench 2023 software. The experimental setup for fatigue testing is depicted in Figure 6, where a rotating-beam fatigue test was employed to conduct numerous tests on welded components. The results revealed three key phenomena: (a) The simulation results closely mirrored the experimental outcomes of rotary friction welding across six different rotational speeds. (b) Discrepancies between the software-predicted weld interface heating rates and experimental results ranged from approximately 3.7% to 9.3%, averaging around 4.48%. (c) Similarly, discrepancies in the simulation results for the highest temperature at the weld interface compared to experimental data ranged from roughly 0.77% to 6.5%, averaging approximately 3.16%. The fatigue life exhibited an improvement of nearly 1.4 times. In conclusion, it is suggested that domain knowledge is utilized for dissimilar polymer rods fused using a computer numerical control turning machine with variable speed rotation [18].

Figure 6.
Experimental setup of the fatigue testing [18].
The present work may be limited to a specific temperature range, and extrapolating the findings to other temperatures could be challenging. Table 1 shows the limitations of the present work and recommendations for future work.

Table 1.
Influence of temperature on fatigue life and limitations and recommendations of present work.
3.2. Effect of Residual Stresses
Residual stresses are internal stresses that remain in a material even after the external loads are removed. These stresses can arise from a variety of sources, such as manufacturing processes, welding, or thermal treatment. Residual stresses can have a significant effect on the fatigue life of components, as they can either increase or decrease the component’s resistance to cyclic loading [19].
Residual stresses are present in nearly all mechanical parts. Several aspects that lead to fatigue failure should be included in an effective fatigue forecast. One of the elements that should be taken into account in the forecasting of fatigue is residual stress. However, one of the main factors contributing to residual stresses being introduced into the structural componentsis the manufacturing process [20]. Investigations have been performed regarding the effects of the manufacturing process on Al 7075. An analysis of the induced residual stress from three different machining cases and one un-machined case has been performed using the layer-removal milling method. Residual stresses were affected by the different parameters of machining such as the feed rate and cutting speed. In all three cases, there was a significant surface compressive stress that occurred within 0.05 mm of the surface. Case 1 had the largest residual stress, whereas the unmachined case had the lowest. A reduction in the compressive residual surface stress was found in cases 1 to 3. The residual stress for cases 1, 2, and 3 were 46 MPa, 16 MPa, and 8 MPa, respectively. The reason for this is that while the cutting speed increases from 251 to 375 to 500 m/min, the feed rate is reduced from 0.3 to 0.25 to 0.2 mm/rev. A material’s surface residual stress is reduced by increasing the cutting speed, while it is enhanced by increasing the feed per tooth. The low-cycle-regime fatigue life is improved by machining-induced residual stresses [15].
The impact of residual stress on the fatigue life of AISI 52100 (60–62 HRC) hard-turned steel has been investigated. There were five distinct types of fatigue specimens developed, including ground surfaces with and without super finishes, hard-turned surfaces with and without white layers, and hard-turned surfaces with super finishes. The compressive residual stress of ground specimens has its maximum at the surface and then slopes sharply downwards as it becomes less compressive. Conversely, it was observed that all surfaces that underwent hard turning showed peak compressive residual stresses at a depth of 10 to 20 µm from the surface, which was subsequently followed by a gradual decrease in the magnitude of the compressive stresses. In both cases, super finishing serves to maintain the original profile beyond a depth of 20 µm, while also improving the compressive nature of the residual stress within the top 10–20 µm of the surface. The researcher asserted that the hard-turned specimen had a fatigue life of more than 56,000 cycles, compared to 27,360 cycles for the ground surface. The distribution of individual stress had the biggest impact on fatigue life. It was found that the maximum compressive residual stress and the surface compressive residual stress had a direct correlation with the specimen’s fatigue life. The hard-turned specimens’ fatigue life was consistently at least as good as that of the baseline ground specimens [21].
To gain a better understanding of how laser shock peening (LSP) impacts the distribution of residual stress and variations in surface roughness, researchers examined the high-cycle fatigue properties of a nickel aluminum bronze (NAB) alloy. Upon application of the laser shock wave, the residual stress on the NAB surface changed from tensile to compressive. Moreover, with an increase in laser pulse energy, both the depth of the residual compressive stress and its dispersion increased, which could be attributed to the work hardening of the material. The LSP process resulted in surface hardening of the material and reduced the attenuation rate of subsequent pressure pulses.
Optimizing the laser pulse energy parameters can enhance the distribution of residual compressive stress on the surface of marine equipment components, thereby lowering the potential for stress concentration failure and increasing fatigue life [35].
The progression of residual stress under fatigue loading at room temperature was investigated. The beneficial effects of compressive residual stress diminished due to the relaxation of these stresses during fatigue loading [36]. The extent of cyclic residual stress relaxation mainly depended on the number of cycles and the stress levels [37,38]. In the investigation of the LSP ATI 718Plus alloy, the author identified three distinct levels of relaxation in compressive residual stress [39]. It is worth noting that the initial compressive residual stresses experienced significant relaxation during the initial cycles [38,40], as observed at various points in the study. Figure 7 demonstrates a slight decrease in residual stress after 10 to 10,000 cycles, primarily attributed to microplastic deformation. Interestingly, when the number of cycles nears the material’s failure point, more substantial stress relaxation occurs [41].
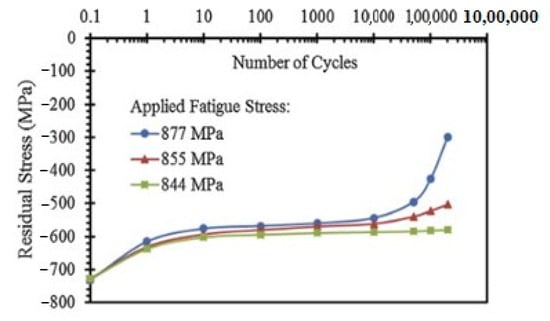
Figure 7.
Residual stress relaxation with number of cycles for LSP ATI 718Plus alloy samples tested [41].
Luan s. et al. measured residual stress (RS) along with fatigue crack growth (FCG) on heat-treated and welded specimens. Two types of specimens were selected for RS distribution with FCG, with gradually decreasing distances between the notch tip and the weld centerline. The parent material was 10 mm thick Q345B steel with ER50-G as the weld material. Welding was performed using a tungsten inert gas process on two plates. To eliminate RS from the weld joint, a box-type resistance furnace (SX-4–10) was used for heat treatment, ranging from room temperature to 600 °C. The distribution of RS primarily depends on geometric constraints during FCG, with the RS distribution calculated based on the distance of the weld from the centerline. During fatigue, compressive strain remains consistent away from the weld material as long as the tensile RS is constant. Fatigue-induced redistribution of RS leads to an increase in compressive RS near the fracture tip. At the onset of FCG, there is no fatigue retardation or crack closure when the crack length is zero. As FCG progresses, the length of the contacted crack wake length (Wp) increases, leading to a reduction in the FCG rate due to the presence of compressive RS. For a long crack, this implies that as the crack enlarges due to rising RS, crack wake length increases while the rate of FCG decreases accordingly, and conversely [42]. This study investigated how different laser shock peening (LSP) patterns affect the fatigue life of TC4 specimens containing notches. The research demonstrated that LSP induces a compressive residual stress field in components, effectively halting the initiation and propagation of fatigue cracks. The effectiveness of LSP in enhancing fatigue properties depends on factors such as laser impact properties and treatment patterns [43].
The research explored how laser peening-induced compressive residual stress affects the fatigue strength of AA7075 specimens. The study employed rotary bending fatigue tests and sequential polishing to analyze residual stress in shot-peened (SP), laser-peened (LP), and untreated samples. Notched fatigue specimens, as shown in Figure 2, were used for testing. At a stress level of 204 MPa, untreated specimens failed after 2.3 × 10⁴ cycles, whereas SP and LP specimens endured for 9.9 × 10⁴ and 4.4 × 10⁵ cycles, respectively. LP-treated specimens showed a fatigue life 19 times longer than untreated ones, while SP-treated specimens demonstrated a 4.3-fold improvement. LP consistently surpassed SP in enhancing fatigue life, attributed to its ability to induce compressive residual stress in deeper regions. Particularly, specimens with low-stress concentrations (~1.4) and deep high-load stress areas benefited more from LP treatment due to its effectiveness in penetrating deeper layers. This suggests LP treatment’s potential to enhance fatigue strength, particularly in thicker materials, by establishing compressive residual stress in deeper regions compared to SP treatment [44].
The stress concentration in corroded fillet and butt-welded specimens was analyzed numerically using real 3D solid models. Corrosion in steel constructions diminishes the fatigue strength in affected areas, exacerbating the stress concentration and inducing material embrittlement. The presence of residual stresses in the fatigue region of welded connections could be mitigated to some extent by employing surface preparation techniques such as clean blasting, as addressed in this study. For both butt and fillet welds, the real geometry was accurately represented through reverse engineering of 3D solid models. During fatigue testing, digital measurements were used to identify crack initiation locations, which closely corresponded to those predicted numerically in most cases. Furthermore, the study demonstrates that employing local approaches can significantly reduce scatter in SN curves by accounting for real geometry and residual stresses, highlighting the method’s high reliability [45].
Mikihito H et al. mitigated the residual stresses and improved the fatigue life of steel structure elements. A series of experiments utilized local induction heating to achieve these objectives. Induction heating was applied to improve the fatigue life and mitigate tensile residual stresses around box-welded joints. The efficacy of stress reduction through local heating was verified via residual stress measurements, supported by numerical simulations elucidating the stress mitigation mechanism. Base plates were fabricated using SM400A material, while gusset plates employed G3106 material. Three heating sequences were utilized, targeting a maximum heating temperature of 350 °C for 40 s. Experiments were conducted with and without local heating specimens to evaluate its impact on residual stress. The results demonstrated that local heating substantially reduced residual stresses under both tensile and compressive loading conditions at the weld toe. This stress reduction contributed to the enhanced fatigue performance of the welded joints, primarily influenced by the loading conditions [46].
Table 2 shows the quantitative analysis of the fatigue life cycle at different stress amplitudes. High values of residual stress decreased the fatigue life compared to lower stress values.
Table 2.
Influence of residual stress on fatigue life.
Residual stresses can have both beneficial and detrimental effects on fatigue life, depending on their magnitude, distribution, and orientation relative to the applied cyclic loading. Some key points regarding the effect of residual stresses on fatigue life, along with the limitations of the present work, are shown in Table 3.
Table 3.
Influence of residual stresses on fatigue life and limitations and recommendations of present work.
3.3. Effect of Hardness
Hardness, the capacity of a substance to resist deformation, is measured using a common test that measures the surface resistance to indentation. The most popular hardness tests can be categorized based on the size, shape, and force required to generate the indent. The hardness of the material and resistance to plastic deformation are the two elements that influence fatigue life. Due to a natural drop in material strength, as material hardness declines, fatigue life is also reduced. However, contact stress and resistance to plastic deformation also decrease at the same time [47].
Axles for trains have frequently been made using EA4T steel [48]. In addition to other methods of problem-solving, the author took into account the failure behavior of railway axles. In order to repair train wheels, laser cladding remanufacturing was employed. The micro-hardness of EA4T steel subsequent to laser cladding was assessed using an HVS-1000 Vickers Hardness Tester, which applied a force of 1.96 N for a duration of 20 s. The microhardness test was performed in three locations: the cladding layer, the transition zone, and the substrate. Cladding layers have higher microhardness than the substrate and the heat-affected zone [49]. Elastic tension emerges in the cladding layers as a result of the short-range internal stress caused by the disparity in the elastic moduli of the solute atoms and the unequal distribution of solute atoms caused by non-equilibrium solidification during the laser cladding process. Atoms in solvents slow down boundary and dislocation motion. The cladding layers have microhardness values ranging from 360 to 380 HV, whereas the substrate has an average microhardness of 260 HV. The process of laser cladding causes thermal cycling between the bone zone and the heat-affected zone, which results in a microstructure that is super-heated and produces a microhardness value between 275 HV and 360 HV [47,50].
The microhardness of API 5L X65 was measured using Berkovich indentation for both annealed and as-received specimens, and it was found to change during the duration of fatigue life. The findings demonstrated that although specimens in their as-received state would first soften and then harden, annealed specimens would do the opposite. The importance of the initial material state, as in the dislocation structure, was brought to light by this. The results also show that the change is undeniably more noticeable on the surface. Indentation depths of 2, 4, and 6 µm were evaluated, and the data from the 2 µm test revealed the most significant decrease in hardness [51].
Other authors also investigated the impact of adding different alloy elements on the hardness of a nickel-based hardfacing alloy [52] and their effect on the deposited layer’s wear resistance. The five varieties of nickel hardfacing alloys include carbide, boron, silicide, intermetallic, and solid solution, with silicide and boron being the most commonly utilized types. The addition of niobium, chromium, and molybdenum to the flux can increase both the microstructure and hardness of the deposited layer. Initially, the deposited layer’s hardness shows an increase, but it subsequently decreases upon the addition of alloying elements and carbon content [53]. Although there are other factors that affect a material’s ability to withstand wear, hardness unquestionably has an impact. Carbon can be added to materials to increase hardness, which is greatly desired. Although carbon increases brittleness, it can also be combined with another alloy to generate a high-hardness carbide that protects against abrasive wear. Yet, it can also produce strong solution strength. The addition of carbon is, therefore, a very effective strategy in conditions of consistent wear with little influence. The carbon, silicon, and boron levels will decrease as the niobium percentage rises, lowering the hardness of the deposited layers in the process. When the aforementioned alloy elements are simultaneously added to carbon, the hardness of the deposited layer has a tendency to first rise and then fall as the alloy element is increased. Higher hardness will reduce wear loss and increase the fatigue life of the hardfacing alloy [54].
In order to examine the microhardness of AISI 4340 steel, a micro-hardness tester (LECOLM700AT) was used, and AerMet 100 steel powder was clad onto a grind-out portion with a 2.5 kW ND:YAG laser. Hardness was tested in various zones, including the laser-clad zone, heat-added zone (HAZ), and substrate zone. The clad zone exhibited a hardness of approximately 650 Hv (Vickers hardness), which is 30–40% greater than the substrate material (580 Hv), owing to the formation of hard and brittle martensite during rapid cooling [55,56,57]. Similarly, the hardness of the heat-affected zone (HAZ) increased from 600 Hv to 720 Hv due to rapid self-quenching. The substrate zone was found to have a lower hardness than the clad and HAZ zones, and the over-tempered zone, the region around the substrate in welding operations, had a lower hardness due to softening caused by carbon atom diffusion from martensite in the substrate [58]. The hardness of the over-tempered zone was slightly lower than that of the substrate zone due to overheating. The as-clad hardness of AerMet 100 (560–580 Hv) was softer than the as-clad hardness of AISI 4340 (20% difference) due to compositional differences, particularly the decreased carbon content. When compared to AISI 4340, AerMet 100 exhibited a substantial increase in fatigue life. However, the overly hard and brittle nature of the clad and HAZ sections decreased the fatigue life of AISI 4340. To avoid overheating, it is recommended to reduce the heat input and increase substrate thickness [59].
Ye et al. conducted research on hardness that evolves in response to fatigue damage [60,61]. They employed Vickers indentation to assess microhardness levels and noted that the average microhardness values for both ferrite and pearlite exhibited variations throughout the fatigue life. Specifically, both phases displayed an initial increase in hardness, followed by a period of stabilization, and ultimately a decrease leading to failure, as illustrated in Figure 8 [54], which encompasses the entire range of data points. Furthermore, in their research, Ye and Wang [62] asserted that hardness measurements inherently possess stochastic characteristics, implying that the damage variable should be regarded as a probabilistic function. Consequently, they put forth the idea of representing the damage variable as a probabilistic function and modified the normal distribution function to depict the probabilistic accumulation of damage over the course of fatigue life. Berkovich indentation was employed to investigate the microhardness evolution in API 5L X65 specimens, both in their as-received and annealed states, throughout the fatigue life [63,64]. The findings revealed that the annealed specimens initially experienced a hardening effect followed by subsequent softening in the early stages of the fatigue life, whereas the as-received specimens exhibited an initial softening before transitioning to hardening [65]. These results underscore the importance of the initial material condition, particularly in terms of the dislocation structure. Furthermore, the tests were conducted at indentation depths of 2, 4, and 6 µm, with the results indicating that the observed changes in hardness were most pronounced at the surface, with the 2 µm measurements displaying the most significant variations [23].
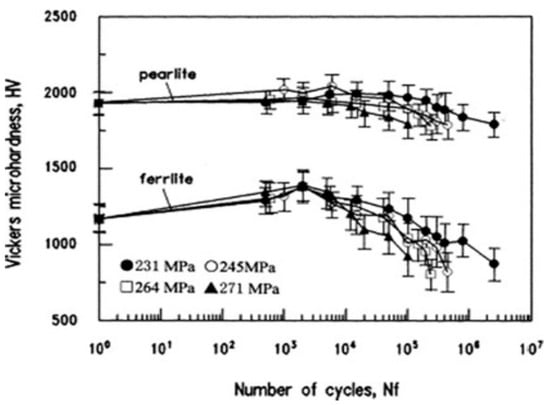
Figure 8.
Change and error bars with the total range of microhardness in ferrite and pearlite during fatigue loading [54].
High-strength steel S690 was utilized to test the hardness of two distinct types of butt-welded connection. These connections consist of CR690 joints, which are formed by joining rolled steel S690 with cast steel G10MnMoV6-3, and VR690 junctions, which were created by connecting rolled steel S690 [28]. The material properties for S690 include uniform elongation of 15%, yield strength of 790 MPa, and ultimate strength of 847 MPa. In contrast, G10MnMoV6-3 exhibits consistent elongation of 18.6% and possesses yield and maximum strengths of 743 MPa and 799 MPa, respectively. Hardness measurements were carried out on the cross-section of the weld at three specific locations: the root of the weld (RW), the middle of the weld, and the weld cap, with an applied stress of 9.807 N, following ISO-6507 standards [66]. Figure 9 illustrates the positions where hardness measurements were taken, while Figure 10 and Figure 11 show the VR690 and CR690 joints, respectively. Notably, in the case of the weld cap and the middle of the weld, the hardness is highest at the heat-affected zone and lowest at the base materials, although this trend is not observed at the weld root. These findings reveal that, typically, the hardness at the weld root tends to be lower compared to that at the top and center of the weld [67,68].
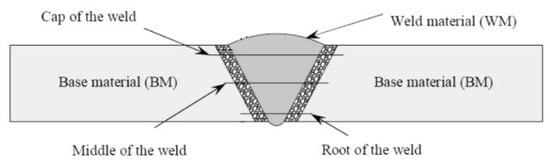
Figure 9.
Hardness measurement locations on a weld cross-section [68].
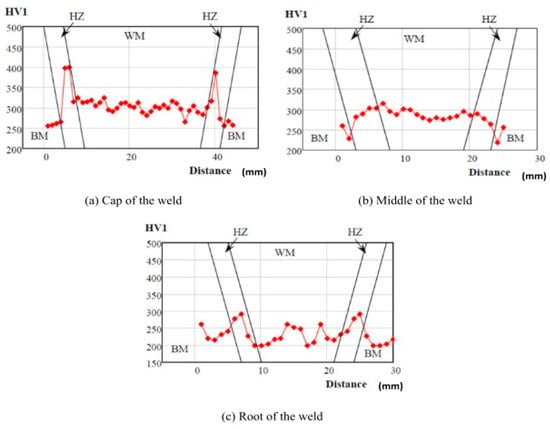
Figure 10.
Hardness distribution of VR690 joints [68].
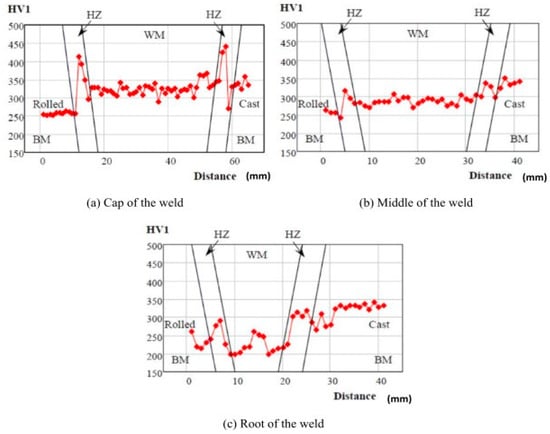
Figure 11.
Hardness distribution of CR690 joints [68].
P. Mendes et al. analyzed hardness properties using Vickers hardness testing. The primary objective of their work was to examine the impact of heat input during the final stages on the preceding steps in the tempering heat treatment process. Temper treatment typically induces a reduction in hardness values, underscoring the necessity of microhardness tests in comprehending the evolution of this mechanical property. This phase plays a crucial role in ensuring stringent process quality control, as variations in heat input can significantly influence both microstructural and mechanical properties, potentially rendering the weld unsuitable for industrial applications. To evaluate the microhardness of the welded joint, two distinct stages of the welding process were employed: focusing solely on the root steps and encompassing all welding steps. This methodology facilitated the identification of the point at which the mechanical properties of the heat-affected zone (HAZ) are significantly altered by the heat treatment from tempering. For this study, the EMCO M4U hardness tester was utilized, employing the HV10 Vickers test with a 15 s pressing period and an applied force of 10 kgf (98.07 N). The findings revealed that the HAZ displayed the largest data disparity and the most notable fluctuations in hardness levels, indicative of an inconsistent cooling rate within this region. The slower cooling rate inherent in thicker materials contributed to lower HAZ hardness ratings in thicker joints. Thick materials, owing to their superior heat dissipation capabilities, tend to cool more slowly than their thinner counterparts, potentially resulting in larger grain sizes and lower hardness ratings. Conversely, thinner materials cool more rapidly, yielding higher hardness values and finer grain structures. Consistently, hardness data demonstrated that the weld material zone exhibited higher hardness values than the base material, underscoring the weld’s superior quality and reliability [69].
The relationship between hardness and fatigue is complex and depends on various factors. In Table 4, an overview of the effect of hardness on fatigue life is presented, along with limitations and future recommendations for the present work.
Table 4.
Influence of hardness on fatigue life and limitations and recommendations of present work.
3.4. Effect of Hardfacing
In the metalworking process of hardfacing, a base metal is coated with a tougher or harder substance. In order to reduce wear, a component’s surface may be hardfaced via welding [70], thermal spraying [71], or a similar procedure. In order to restore damaged components as well as the original equipment, hardfacing is used.
The production of structures on an AISI 4130 steel substrate using laser cladding involved the use of two different hardfacing alloys: Stellite 6 (Co-based) and Deloro 40G (Ni-based). These structures underwent rotating bending fatigue tests, which revealed that the fatigue life of specimens coated with Stellite 6 and Deloro 40G was negatively correlated with the coating thickness, as tensile residual stress was present in the coating area of the laser-coated specimen. This means that an increase in coating thickness would lead to a decrease in fatigue life. Moreover, the fatigue life of laser-clad AISI 4130 steel specimens of Stellite 6 and Deloro 40G with the same size was lower than that of unclad specimens [72,73]. The thermal fatigue behavior of coatings made from Stellite-6 powder and WC particles, produced by laser cladding Co-coated WC (WC-12Co) particles and Stellite-6 powder on AISI H13 hot work tool steel, was studied and compared. Surface cracks were observed in these coatings before the thermal fatigue test [73]. This is mostly related to the residual stress imposed by the thermal expansion coefficient mismatch between the Stellite matrix and the WC, as well as the coating cooling quickly during laser cladding. After thermal fatigue tests, the coating’s surface showed significantly more cracks as the WC concentration increased. In contrast, less surface cracking was visible with the coatings of WC-12Co particles than with WC. This behavior was particularly found when the WC level was greater than 20 weight percent. The uses of WC-12Co particles increase the lifespan of Stellite-6/WC coatings [74].
Under cyclic 4-point bending loads, the fatigue life of clad Stellite 21 alloy powder [] on X5CrNi18-10 and 42CrMo4 cylindrical substrates was investigated. After grinding, the cladding, which was performed in the center parallel section, still has a thickness of around 1.28 mm. The fatigue strength of both types of clad specimens was found to have decreased, but the 42CrMo4 clad specimens exhibited a more significant reduction in fatigue performance due to the presence of hardness and tensile residual stresses [16]. In contrast to steel 42CrMo4, the hardness of the clad X5CrNi18-10 steel decreased in the HAZ. The crack initiation locations of the 42CrMo4 specimens were below the surface, whereas the steel X5CrNi18-10 specimens cracked above the surface, which is also a region of lowerfatigue life [75].
To enhance wear resistance and prevent self-welding in sodium-cooled fast reactors, a Ni-Cr-B-Si alloy (SFRs) was applied as a hardfacing material onto 316LN stainless-steel components [29,76]. Three hardfacing techniques were used in this investigation: laser cladding, PTA, and GTA, for high-temperature applications. The shear strengths offered by the laser hardfacing process were 62% and 24.3% higher than that of the GTA and PTA hardfacing methods, respectively. The laser hardfacing technique prevents deposit debonding by combining strong microhardness, little dilution, and high bonding shear strength. The laser hardfacing method is recommended for 316LN SS nuclear components to ensure their function as intended throughout a long 20-year lifespan [77,78].
S. Kanga et al. investigated the application of ultrasonic fatigue testing as an innovative, efficient, and reproducible method for understanding and predicting the behavior of welded surface coatings [79]. The study compared two flux-cored wires with identical nominal chemical compositions from different manufacturing sources under identical welding conditions [80]. The base material was a steel bar of AISI 4145H Mod. 42CrMo4 type and exhibited a hardness of 32–34 HRC. Flux-cored wires known as TeroMatec OA 4923 were used for welding. The process of preparing the samples is depicted in Figure 10. As shown schematically in Figure 12c, the authors extracted two sets of fatigue samples, named the C-series and the E-series, from the welded steel plates [81]. An ultrasonic resonance testing system with a power supply was used to conduct the fatigue tests. The stress amplitude versus loading cycles until failure, as displayed in Figure 13a, revealed the results of the ultrasonic fatigue tests conducted on these two sample series. Each sample series underwent high-cycle fatigue tests, encompassing up to 1 × 10⁸ loading cycles under continuous tension. Using the step test technique, the author determined that the selected stress amplitudes for the E-series and C-series samples were 460 MPa and 600 MPa, respectively. It is evident that weld overlays produced with C-wires exhibited significantly greater resistance to high-cycle fatigue compared to those made with E-type materials. Figure 13b–e illustrates the typical fracture surfaces of the failed samples, highlighting the final overload area, the crack propagation zone, and the sites where cracks initiated near or at the surface. It was identified that the presence of larger carbide particles near or at the surface was responsible for reduced cycles until failure at the given stress amplitude. As expected, fatigue cracks consistently originated in the areas of stress concentration at the root of the notch. The final rupture areas in both cases exhibited the morphology and characteristics of ductile-type fractures, featuring dimples. The improved fatigue properties of the C-series samples were likely attributed to their microstructure [82], which contained a higher proportion of austenite. Interestingly, the hardness and wear characteristics of the two weld overlays did not show significant differences. Conversely, the E-series material demonstrated reduced resistance to fatigue crack propagation due to the presence of larger carbide particles and a higher proportion of hard and brittle martensitic phases [83]. The presence of retained austenite was known to have a positive impact on the fatigue resistance of high-strength steel weldments near the fatigue threshold [84].

Figure 12.
Sample preparation technique for welded joints: (a) steel base material with a U-groove, (b) steel disc, (c) schematic drawing showing the sample preparation concept [81].
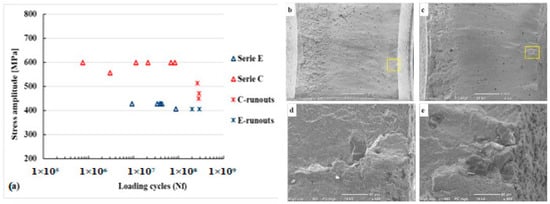
Figure 13.
Comparison of the fatigue data (stress amplitude against loading cycles until failure for E and C welded samples series (a). Typical overview images and details of the fatigue fracture surfaces of (b,d) E- and (c,e) C-weld samples series [82].
Previous studies have highlighted the importance of residual stress within the substrate beneath contact on the substrate’s fatigue life. One author observed a significant influence of metal subsurface layers on fatigue failure. They found that residual stress in the metal subsurface layers notably affected the fatigue life of samples coated with MAO (Microarc Oxidation). Fatigue fracture initiation occurred within the substrate beneath the interface, as shown in Figure 14, They observed that as the thickness of coatings increased from 14 to 65 mm, the fatigue strength of the aluminum alloy substrate decreased by 30 to 58%. These results suggest that the residual compressive stress (RCS) present in MAO coatings hampers the initiation and propagation phases of the fatigue process [85].
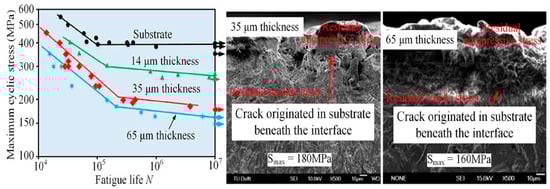
Figure 14.
Fatigue life and fracture of the 7475-T6 Al alloy coated with different thicknesses [85].
The effect of hardfacing on fatigue life can be influenced by various factors and limitations in the present work. Table 5 shows an overview of the topic, along with limitations and recommendations.
Table 5.
Influence of hardfacing on fatigue life and limitations and recommendations of present work.
4. Effect of Mechanical Properties on Fatigue Life of the Structural Components
Nguyen et al. [86] investigated the impact of tensile and bending loads on the fatigue life of welded structures. An arithmetic model was employed to investigate several weld geometry characteristics, such as the flank angle, weld toe undercut, weld toe radius, plate thickness, and misalignment. The linear elastic fracture approach was used to forecast the fatigue crack growth rates of the weld shapes. The study focused on ASTM A36 structural steel due to its numerous applications in welded structures. Static and fatigue tests were conducted to examine various parameters such as load, displacement, strain, frequency, and number of cycles. The fatigue life of butt-welded joints can be significantly improved by minimizing or eliminating the undercut tip radius at the weld toes [87]. Although welding results in tensile residual stresses that can decrease fatigue life and weaken structures, the fatigue life and strength of welded joints can be increased by surface treatment processes such as surface peening or tensile pre-loading. The mathematical model used in this research can accurately calculate the combined effects of the butt weld geometry parameters and residual stresses [88]. The study concluded that reducing the tip radius from 0.35 to 0.05 increased the fatigue life by 12%. The fatigue life of the welded joint was reduced by 58.3% and 75%, respectively, when compared to an undercut-free union and a flush ground-welded plate. Butt joint fatigue occurred regardless of the degree of misalignment, and strength was reduced from 10% to 60% when subjected to mixed loading.
Knez et al. [89] performed the rotary bending test for the prediction of the low fatigue life cycle of S1100Q steel. The rotary bending test was performed on a new machine, as shown in Figure 15, which consisted of three main parts, namely the driving unit, loading, unit, and driving unit, which enables it to set the rotation frequency in the range of 0.3 to 60 Hz. A low-cycle fatigue test was conducted on twelve samples with different strain rates. The Coffin–Manson method was employed to determine the fatigue life periods, and the Ramberg–Osgood law was utilized to calculate the stress distribution. Based on the experiment [90], it was observed that the stress generated on rotating bending was 18.18% lower than that of axial tension and 30.76% lower than that of static tension. The fatigue life cycle observed with the rotating bending test was 20,000 at 0.004εa. The estimated rotating bending fatigue life cycle was 20,000 at 0.002εa, which is equal to the estimated axial tension fatigue life. The axial fatigue life of S1100Q was approximately 4000 at 0.004εa, which was 80% less than that of the estimated axial fatigue life and rotating bending fatigue life; due to specimen buckling, overall strain is usually restricted to 1%.

Figure 15.
New rotating bending machine [89].
Lee et al. [91] calculated the low cycle fatigue and thermo mechanical fatigue life of Ni-base super alloy for high-speed rotating parts in aerospace and automobile applications [92]. Cylindrical types of specimens were made up of Ni-based super alloy GTD-111 for testing. A tensile test for LCF was performed at room temperature and 850 °C on hydraulic machines. IP-TMF (in-phase thermo mechanical testing) and OP-TMF (out-phase thermo mechanical testing) tensile tests were performed using a furnace, cooling, and control system.
The TMF test was conducted over a temperature range of 400 °C to 800 °C, with a 20 min break between cycles. The IP-TMF test showed temperature-dependent strain, while the OP-TMF test exhibited a decrease in strain as temperature increased. During the tensile experiment, the specimen exhibited a tensile strength of 1140 MPa at ambient temperatures and 1120 MPa at 850 °C. The yield strength at room temperature was 1020 MPa, whereas at 850 °C, it was reduced to 830 MPa. At higher temperatures, the yield strength of GTD-111 decreased by 20% while the strain increased by 33%, leading to the material’s ductility. Figure 16 shows that at high temperatures, the IP and OP-TMF tests had shorter fatigue lives than the LCF test. Because of the high temperature in the tensile zone, the IP-TMF test had a shorter life cycle than the OP-TMF test.

Figure 16.
Variations in life for LCF and IP-OP TMF [91].
Li et al. [93] developed a cladding alloy to repair the deep pits in nodular cast iron. Previously, nodular cast iron had a low tensile strength in the interface region and shrunk at a lower temperature. The higher residual stress values were also a big problem, which was a cause of the initiation of cracks. Fe-36Ni alloy and NiCu alloy were used as cladding powder in this experiment because of their low expansion coefficient. A scanning electron microscope and optical microscope were used to characterize the microstructure. It predicted that there is no crack visible in the interface region of the cladded alloy. The value of thermal expansion of the substrate region was 17.40% less than that of the cladding region at low temperatures (100–200 °C) and high temperatures (1000 °C). The average microhardness was 30.43% lower than that of the Ni-Cu layer of the substrate material and the same as the Fe-36Ni layer. Minimizing the thermal expansion coefficient effectively reduced the occurrence of cracks during the repair of deep pits in nodular cast iron.
Masaki et al. [94] conducted a fatigue test to determine thefatigue crack point and static strength of extruded Mg-Al-Z composites. The fatigue tests were performed on three different Mg-Al-Zn alloys. Commercially, three different types of extruded magnesium alloys, namely AZ31, AZ61, and AZ80, were utilized. The 6 mm-width specimen was used to test fatigue strength, while the 5 mm-width specimen was used to study the fatigue life. The fatigue strength of AZ31 was 90 MPa at 108 cycles, which was the same as the 0.2% compressive proof stress of the material. AZ61 had a fatigue strength of 150 MPa at 108 cycles. The fatigue crack occurred after 8 × 10⁸ cycles with a stress amplitude of 130 MPa, equivalent to the material’s compressive stress. AZ80 had a fatigue strength of 140 MPa at 108 cycles. It was also observed that the tensile and compressive properties of AZ80 were higher than those of AZ61. Based on the stress amplitude, the maximum fatigue life cycles of AZ31, AZ61, and AZ80 were 1.18 × 10⁸, 0.89 × 10⁸, and 1.04 × 10⁸ at 90 MPa, 150 MPa, and 140 MPa, respectively.
Zhang et al. [95] performed a fatigue test on Cr-coated SS316 and investigated the failure mechanism. The mechanism of fatigue crack initiation consisted of surface extrusion and intrusion. A flat dogbone-shape specimen was prepared using an SS316 sheet [96]. The fatigue test was conducted on two groups of stainless steel; the uncoated specimen was considered in the first group, while a thin layer of polycrystalline Chromium coating specimen was considered inthe second group. The bending rotating test was performed on an LFE-150 fatigue testing machine [97] with a variable motor speed at a 20 Hz frequency. The fatigue life cycle of the chromium-coated specimen at a lower stress amplitude (260 MPa) was 2 × 10⁶ cycles more than the uncoated specimen. However, at a high-stress amplitude (460 MPa), the fatigue life of the uncoated specimen was longer than that of the Cr-coated specimen. The density of the polycrystalline chromium coating and the height of the surface extrusion increased as the stress amplitude increased. It was reported that the fatigue life initially improved due to the coating.
Ding et al. [98] conducted a fatigue test on TC17 specimens, both with and without scratches, and also analyzed the wear and tear damage parameters using Murakami’s hypothesis. They found that the presence of micromechanical scratches reduced the fatigue life of TC17 in the high-cyclefatigue zone. A new approach was proposed by the study, which defines fatigue damage from microscopic scratches as the square root of the triangle area of the scratch section. The proposed model demonstrated a good correlation between experimental and predicted data.
Hu et al. [99] evaluated the effect of selective laser melting technology on Ti-6Al-4V. The selective laser melting technology leads to lower fatigue life. The lower fatigue life is mainly due to manufacturing defects and the lack of fusion defects. It was also found that the low porosity, random distribution of defect size, and position also lead to lower fatigue life. The resistance to fatigue life was found using numerical modeling, in which the stress intensity factor was considered. The account of stress intensity factor also considered defect size and location, which were responsible for the lower fatigue life. In contrast, the nominal stress amplitude could not show resistance to fatigue life.
Kim et al. [100] provided recommendations on the design of a 78 kW agricultural tractor gearbox and calculated the fatigue life of the spiral bevel gear. The fatigue life was estimated for the three bevel gear specimens at five different sites, and an accelerated life test was conducted under static load conditions for sites 1 and 2. Ploughing and rotary tilling were performed at site 3 with an area of 4000 m2, while ballet work was completed atsite 4 with an area of 14,400 m2, and loader work was completed at site 5 with an area of 4000 m2. The outcomes demonstrated that the fatigue life of the spiral bevel gear was 214 times longer under integrated equivalent loads and 9400 times longer under plough-equivalent loads when compared to the rated load. These findings may be useful in optimizing the design of tractor gearbox spiral bevel gears, taking into account the field-equivalent load.
Abdullah et al. [101] compared the fatigue life of leaf springs for various road load strain conditions (highway, campus, and rural) using reliability and hazard assessment parameters. The leaf springs were broken due to the high speed of the speed breakers. The failure mode of leaf springs was calculated using the Coffin–Manson, Morrow, and Smith–Watson–Topper (SWT) methods. The Coffin–Manson model’s fatigue life was longer than the other two models. According to the SWT approach, the fatigue life of a highway road is 99.70% and 99.62% higher than that of a campus road and rural road, respectively. The reliability cycle-until-failure danger rate’s 3D distribution contour was found to increase the leaf spring’s durability.
Berry et al. [15] investigated the effect of residual stresses on the fatigue life of aluminum alloys. A specimen of an aluminum 7075 bar was made for the testing of the fatigue life cycle using a three-point bending test, as shown in Figure 17. The three-point bending test was carried out three times on machined and un-machined surfaces. After the experiment, it was noted that the fatigue life had increased due to an increase in residual surface stresses. The fatigue life of the specimen depends on the crack initiation. The machined surface depicted the crack initiation at the corner of the surface, whereas the unmachined surface showed it at the center. As shown in Figure 18, an increase in the residual stress surface led to a longer fatigue life in the machined surface specimen than in the unmachined surfaces.
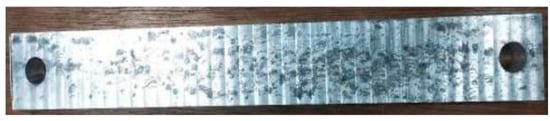
Figure 17.
Fatigue life specimen for Al 7075 alloys [15].
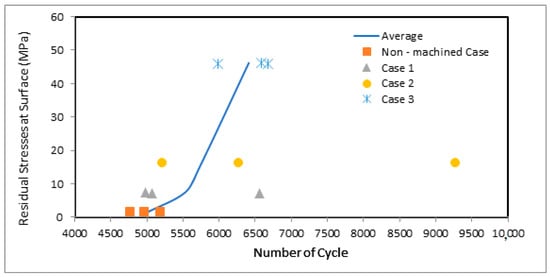
Figure 18.
Effect of residual stresses on fatigue life cycle [15].
Simunek et al. [6] conducted a fatigue test on flat mild steel S355 specimens with V-shaped and semi-elliptical notches subjected to continuous and varying amplitude loading. The study shows that the presence of beach markings inside the fractured area can speed up, slow down, or even stop crack propagation depending on the load sequence. Single-edge notch tension (SENT) specimens were used, with the V-notch wire eroded into one of the specimen’s edges, as shown in Figure 19. Two crack gauges were installed on either side of the specimen’s surface, and the crack length offset was assumed to represent the observed value after pre-cutting for the numerical and analytical investigation [98,99]. The study performed two tests under constant-amplitude loading (CAL) at stress levels of 150 MPa and 100 MPa, respectively. Additionally, a synthetic test with variable-amplitude loading (VAL) was designed for both stress amplitudes, using block lengths of 20,000 load cycles for each alternating stress level, starting with the highest stress level. The residual service life obtained from the CAL test at 100 MPa was almost four times longer than that obtained from the test at 150 MPa. The VAL specimen had a higher start crack propagation rate than the equivalent CAL specimen at 150 MPa, which can be attributed to the slightly longer crack initiation in the CAL test specimen.

Figure 19.
SENT specimen with V-notch [6].
Wang et al. [102] investigated the effect of lanthanum oxide on contact fatigue damage to ferrous alloy-coated wheel and rail specimens under oil lubrication conditions. Laser cladding was used to cover the Fe-based alloy, which makes the rails more resistant to wear. The utilization of lanthanum oxide offers ease of application and the ability to enhance the microstructure and grain boundary of cladding materials, making it advantageous. Untreated specimens of wheels and rails have numerous visible fatigue cracks, whereas specimens with no lanthanum oxide coating are identified by their fatigue cracks. On the other hand, specimens coated with lanthanum oxide do not have any visible fatigue cracks. When lubricated with oil, the addition of 1.2% lanthanum oxide in Fe-based alloys results in the wheel and rail samples having the most favorable fatigue resistance properties.
Tanaka and Mura [103] investigated fatigue fracture initiation in ductile materials using slip plastic flow concepts. The dislocation dipole layers become free surfaces when the surface energy and the stored energy equalize, which happens when the fracture begins to form [104,105].
Yao et al. [106] examined how damage caused by heat affected the dynamic fracture toughness. The experiment was conducted in a split Hopkinson pressure bar using mortar from notch specimens that had undergone heat treatment. X-ray computer tomography was used to assess chemically and thermally induced microcracks. The fracture hardness appeared to decline. This is because of the heat treatment and fracture damage, which together had the effects of microcracking, chemical alterations, and a decline in the binding property.
A. Zanichelli et al.’s [107] research work involved the production and endurance testing of four types of specimens: plain specimens, sharp-notch specimens (with a root radius of 0.07 mm), circular-notch specimens (with a root radius of 2 mm), and blunt-notch specimens (with a root radius of 5 mm). The root mean square error method (TRMS) was utilized for accurate assessment. Overall TRMS values for plain and blunt-notched specimens were less than 2, while circular-notched specimens showed slightly higher values, and specimens with a sharp notch had values lower than 3, indicating satisfactory outcomes. Furthermore, it appears that the accuracy level remained largely unaffected by the load design. This observation underscores the robustness of the methodology, as it consistently delivered satisfactory results irrespective of specimen type, loading conditions, degree of multiaxiality, or non-proportionality.
S. Abazari et al. [108] investigated the impact of the short-fiber concentration of Al2O3 on the high-cycle fatigue properties of AZ91D alloy. Their findings indicated that adding reinforcement improved the matrix’s fatigue strength. Moreover, they observed that composite crack initiation typically occurred at the sites of agglomerated reinforcing fibers. The fatigue crack was predominantly initiated along the highest shear stress and then propagated outward from the original cracked grain. It was noted that grain boundaries played a crucial role in impeding the spread of these microcracks. Furthermore, the particle size was found to influence microstructural fatigue parameters, and grain refinement was identified as a potential method to enhance fatigue performance.
Different methods can have varying effects on the fatigue life of components. Table 6 shows some common methods and their advantages and disadvantages.
Table 6.
Advantages and disadvantages of different methods in present work.
5. Chronological Evaluation and Development
The chronological evaluation and development of fatigue analysis based on fatigue problems and the adoption of new technology are shown in Table 7.
Table 7.
Chronological evaluation and development.
6. Future Trends and Development
Across diverse industries such as aerospace, automotive, and infrastructure, where sustainability and durability are increasingly prioritized, researchers and engineers are proactively investigating innovative strategies to prolong the fatigue life of structural components and systems. Several researchers have examined the fatigue characteristics of advanced high-strength steels, aluminum alloys, titanium alloys, and many more each with tailored microstructures and mechanical properties. However, enhancing fatigue life may involve exploring the fatigue resistance of composite materials reinforced with nanoparticles or carbon fibers to achieve superior strength and durability. Si-based alloys can also be used instead of Al alloys. The hardfacing of Ni and Co base alloys can reduce crack growth and strengthen the components. If future researchers do not want to perform heat treatment, they can work on SS alloys for higher fatigue life, but for other alloys like Ni, Cr, and Al, heat treatment reduces the effect of residual stresses. Advanced non-destructive evaluation techniques, including neutron diffraction and digital image correlation, offer the precise quantification of residual stresses in manufactured components. Applications such as shot peening and laser peening can be used to create advantageous compressive stresses and enhance fatigue resistance. Nickel-aluminum-bronze alloys can be used for laser shock peening applications. Currently, the additive manufacturing process is widely used in the production area. To mitigate the defects and improve the fatigue life, in situ monitoring methods should be used. Non-destructive testing can be used for accurate fatigue assessment and cost-effective evaluations. The composition of corrosive mediums in natural environments is intricate, with numerous elements impacting corrosion processes. The locations and forms of corrosion remain highly uncertain. Future research demands a probabilistic prediction model that incorporates spatial variability. Nevertheless, more complex fatigue models that make use of probabilistic techniques are necessary to provide accurate estimates of usable lifespans.
7. Conclusions
The fatigue life of components is affected by several factors, including residual stresses, hardness, temperature, and hardfacing. Designers and engineers must take these factors into account when designing components for high-cycle fatigue applications. Residual stresses can occur during the manufacturing process. During manufacturing, these internal stresses may result in a combination of both compressive and tensile stresses. Residual stresses have both positive and negative effects on the fatigue life of components. The presence of compressive residual stresses increases the fatigue life of components via the retardation of the formation of microcracks.
High temperatures significantly reduce the fatigue life of components, particularly in materials with low thermal conductivity. This is because elevated temperatures increase the rate of crack growth and lead to premature failure. In addition, thermal expansion and contraction generate residual stresses, which further reduce the fatigue life of components.
The hardness of materials has a significant effect on the fatigue life of structural components. Hard materials are more susceptible to fatigue failure because they have less ductility and are less able to absorb energy when they undergo cyclic loading. This is the cause of more rapid crack initiation and propagation, leading to a shorter fatigue life. On the other hand, materials that are too soft also have a shorter fatigue life because they are more prone to plastic deformation and experience more rapid crack growth.
The application of hardfacing generates residual stresses, which reduces the fatigue life of the component. The effectiveness of hardfacing depends on the specific application and loading conditions, particularly in high-stress applications. The type of hardfacing material also affects fatigue life. Some hardfacing materials such as chromium carbide provide excellent wear resistance but are prone to cracks under high-stress conditions, which reduce the fatigue life. Other materials such as nickel-based alloys have a better fatigue resistance but are more expensive to apply.
Future work should concentrate on developing new models and new technologies to predict the fatigue life and strength of various materials. This will be beneficial to broadening the fields of failure mode and fatigue analysis to further encompass different materials.
Author Contributions
Conceptualization, A.K. and B.S.; methodology, A.K. and B.S.; formal analysis, A.K. and B.S.; investigation, A.K. and B.S. and M.G.; resources, A.K. and B.S.; data curation, A.K.; writing—original draft preparation, A.K.; writing—review and editing, A.K. and B.S. and M.G.; visualization, A.K. and B.S.; supervision B.S. and M.G. All authors have read and agreed to the published version of the manuscript.
Funding
This research received no external funding.
Institutional Review Board Statement
Not applicable.
Informed Consent Statement
Not applicable.
Data Availability Statement
Data is contained within the article.
Acknowledgments
Not applicable.
Conflicts of Interest
The authors declare that they have no known competing financial interests or personal relationships that could have appeared to influence the work reported in this paper.
References
- Kumar, P. Elements of Fracture Mechanics, 7th ed.; McGraw Hill Education (India) Private Limited: New Delhi, India, 2014. [Google Scholar]
- Kamal, M.; Rahman, M.M. Advances in fatigue life modeling: A review. Renew. Sustain. Energy Rev. 2018, 82, 940–949. [Google Scholar] [CrossRef]
- Menghani, J.; Vyas, A.; Patel, P.; Natu, H.; More, S. Wear, erosion and corrosion behavior of laser cladded high entropy alloy coatings—A review. Mater. Today Proc. 2020, 8, 2824–2829. [Google Scholar] [CrossRef]
- Budynas, R.G.; Nisbett, J.K. Shigley’s Mechanical Engineering Design, 9th ed.; McGraw Hill: New York, NY, USA, 2011; ISBN 978-0-07-352928-8. [Google Scholar]
- Forman, R.G.; Mettu, S.R. Behavior of surface and corner cracks subjected to tensile and bending loads in a Ti-6Al-4V alloy. Fract. Mech. Twenty-Second. Symp. 1992, 1, 519–546. [Google Scholar]
- Simunek, D.; Leitner, M.; Maierhofer, J.; Gänser, H.P. Fatigue Crack Growth under Constant and Variable Amplitude Loading at Semi-elliptical and V-notched Steel Specimens. Procedia Eng. 2015, 133, 348–361. [Google Scholar] [CrossRef]
- Adamos, L.; Loutas, T. Challenges in the fatigue crack growth characterization of metal/composite joints: A compliance-based investigation of a Ti/CFRP joint. Int. J. Fatigue 2021, 148, 106233. [Google Scholar] [CrossRef]
- Endo, M.; McEvily, A.J. Prediction of the behavior of small fatigue cracks. Mater. Sci. Eng. A 2007, 468–470, 51–58. [Google Scholar] [CrossRef]
- Chen, L.J.; Yao, G.; Tian, J.F.; Wang, Z.G.; Zhao, H.Y. Fatigue and creep-fatigue behavior of a nickel-base superalloy at 850 °C. Int. J. Fatigue 1998, 20, 543–548. [Google Scholar] [CrossRef]
- Kamaya, M. Low-cycle fatigue crack growth prediction by strain intensity factor. Int. J. Fatigue 2015, 72, 80–89. [Google Scholar] [CrossRef]
- Vasudevan, A.K.; Sadananda, K.; Iyyer, N. Fatigue damage analysis: Issues and challenges. Int. J. Fatigue 2016, 82, 120–133. [Google Scholar] [CrossRef]
- Meng, L.; Zhu, B.; Hu, Q.; Zeng, X.; Wang, D. Laser-induction hybrid cladding of different coatings on rail surface: Microstructure, wear properties and contact fatigue behaviors. Appl. Surf. Sci. 2021, 566, 150678. [Google Scholar] [CrossRef]
- Murakami, Y.; Takagi, T.; Wada, K.; Matsunaga, H. Essential structure of S-N curve: Prediction of fatigue life and fatigue limit of defective materials and nature of scatter. Int. J. Fatigue 2021, 146, 106138. [Google Scholar] [CrossRef]
- Hussain, F.; Abdullah, S.; Nuawi, M.Z. Effect of temperature on fatigue life behaviour of aluminium alloy AA6061 using analytical approach. J. Mech. Eng. Sci. 2016, 10, 2324–2335. [Google Scholar] [CrossRef]
- Berry, L.; Wheatley, G.; Ma, W.; Nejad, R.M.; Berto, F. The influence of milling induced residual stress on fatigue life of aluminum alloys. Forces Mech. 2022, 7, 100096. [Google Scholar] [CrossRef]
- Ganesh, P.; Moitra, A.; Tiwari, P.; Sathyanarayanan, S.; Kumar, H.; Rai, S.; Kaul, R.; Paul, C.; Prasad, R.; Kukreja, L. Fracture behavior of laser-clad joint of Stellite 21 on AISI 316L stainless steel. Mater. Sci. Eng. A 2010, 527, 3748–3756. [Google Scholar] [CrossRef]
- Tahmasbi, K.; Alharthi, F.; Webster, G.; Haghshenas, M. Forces in Mechanics Dynamic frequency-dependent fatigue damage in metals: A state-of-the-art review. Forces Mech. 2023, 10, 100167. [Google Scholar] [CrossRef]
- Kuo, C.; Gurumurthy, N.; Chen, H.; Huang, S. Analysis of temperature history, fatigue behavior and surface hardness in rotary friction welded dissimilar polymer rods with variable rotational speeds. J. Adv. Join. Process. 2024, 9, 100211. [Google Scholar] [CrossRef]
- Kang, C.; Wenner, M.; Marx, S. Experimental investigation on the rail residual stress distribution and its influence on the bending fatigue resistance of rails. Constr. Build. Mater. 2021, 284, 122856. [Google Scholar] [CrossRef]
- Ramakokovhu, U.; Desai, D.; Snedden, G.; Jamiru, T. Significance of residual stresses in fatigue life prediction of micro gas turbine blades. Eng. Fail. Anal. 2021, 120, 105092. [Google Scholar] [CrossRef]
- Smith, S.; Melkote, S.N.; Lara-Curzio, E.; Watkins, T.R.; Allard, L.; Riester, L. Effect of surface integrity of hard turned AISI 52100 steel on fatigue performance. Mater. Sci. Eng. A 2007, 459, 337–346. [Google Scholar] [CrossRef]
- Miroslav, Š.; Vladimír, C.; Kepka, M. Possibility of fatigue damage detection by non-destructive measurement of the surface hardness. Procedia Struct. Integr. 2017, 7, 262–267. [Google Scholar] [CrossRef]
- Yarullin, R.; Ishtyryakov, I. Fatigue Surface Crack Growth in Aluminum Alloys under Different Temperatures. Procedia Eng. 2016, 160, 199–206. [Google Scholar] [CrossRef]
- Li, Z.H.; Han, K.; Chen, T.; Yang, H.S.; Liu, P.; Lu, Y.H. Fatigue life prediction of nuclear reactor main bolt based on temperature effect and size effect. Int. J. Fatigue 2021, 152, 106443. [Google Scholar] [CrossRef]
- Sah, I.; Park, J.; Kim, E.S. Fatigue life curves of alloy 617 in the temperature range of 800–950 °C. Nucl. Eng. Technol. 2022, 55, 546–554. [Google Scholar] [CrossRef]
- Bahaideen, F.B.; Saleem, A.M.; Ripin, Z.M.; Samad, Z.; Badarulzman, N.A. Fatigue Behaviour of Aluminum Alloy at Elevated Temperature. Mod. Appl. Sci. 2009, 3, 52. [Google Scholar] [CrossRef]
- Gagg, C.R.; Lewis, P.R. In-service fatigue failure of engineered products and structures—Case study review. Eng. Fail. Anal. 2009, 16, 1775–1793. [Google Scholar] [CrossRef]
- Akyel, A. Fatigue Strength of Repaired Cracks in Welded Connections Made of Very High Strength Steels. Ph.D. Thesis, Delft University of Technology, Delft, The Netherlands, 2017. [Google Scholar]
- Balaguru, S.; Murali, V.; Chellapandi, P.; Gupta, M. Effect of dilution on micro hardness of Ni–Cr–B–Si alloy hardfaced on austenitic stainless steel plate for sodium-cooled fast reactor applications. Nucl. Eng. Technol. 2020, 52, 589–596. [Google Scholar] [CrossRef]
- Zakaria, K.A.; Abdullah, S.; Ghazali, M.J. Comparative study of fatigue life behaviour of AA6061 and AA7075 alloys under spectrum loadings. Mater. Des. 2013, 49, 48–57. [Google Scholar] [CrossRef]
- Wong, W.A. Monotonic and Cyclic Fatigue Properties of Automotive Aluminum Alloys; SAE Technical Paper; SAE: Warrendale, PA, USA, 1984. [Google Scholar]
- Zhu, X.; Shyam, A.; Jones, J.W.; Mayer, H.; Lasecki, J.V.; Allison, J.E. Effects of microstructure and temperature on fatigue behaviour of E319-T7 cast aluminium alloy in very long life cycles. Int. J. Fatigue 2006, 28, 1566–1571. [Google Scholar] [CrossRef]
- Uematsu, Y.; Akita, M.; Nakajima, M.; Tokaji, K. Effect of temperature on high cycle fatigue behaviour in 18Cr–2Mo ferritic stainless steel. Int. J. Fatigue 2008, 30, 642–648. [Google Scholar] [CrossRef]
- Juijerm, P.; Altenberger, I. Effect of temperature on cyclic deformation behaviour and residual stress relaxation of deep rolled under-aged aluminium alloy AA6110. Mater. Sci. Eng. A 2007, 452–453, 475–482. [Google Scholar] [CrossRef]
- Gao, Y.; Yang, W.; Huang, Z.; Lu, Z. Effects of residual stress and surface roughness on the fatigue life of nickel aluminium bronze alloy under laser shock peening. Eng. Fract. Mech. 2021, 244, 107524. [Google Scholar] [CrossRef]
- Zhuang, W.Z.; Halford, G.R. Investigation of residual stress relaxation under cyclic load. Int. J. Fatigue 2001, 23, 31–37. [Google Scholar] [CrossRef]
- Zaroog, O.S.; Ali, A.; Sahari, B.B.; Zahari, R. Modeling of residual stress relaxation of fatigue in 2024–T351 aluminium alloy. Int. J. Fatigue 2011, 33, 279–28534. [Google Scholar] [CrossRef]
- Kattoura, M.; Mannava, S.R.; Qian, D.; Vasudevan, V.K. Effect of laser shock peening on residual stress, microstructure and fatigue behavior of ATI 718Plus alloy. Int. J. Fatigue 2017, 102, 121–134. [Google Scholar] [CrossRef]
- Zaroog, O.S.; Ali, A.; Sahari, B.; Zahari, R. Modelling of Residual Stress Relaxation: A Review. Pertanika J. Sci. Technol. 2009, 17, 325–336. [Google Scholar]
- James, M.R. The relaxation of residual stresses during fatigue. In Proceedings of the 28th Sagamore Army Materials Research Conference, Essex County, NY, USA, 13–17 July 1981; Kula, E.V.W., Ed.; Plenum Press: New York, NY, USA, 1982; pp. 297–314. [Google Scholar]
- Zabeen, S.; Preuss, M.; Withers, P.J. Evolution of a laser shock peened residual stress field locally with foreign object damage and subsequent fatigue crack growth. Acta Mater. 2015, 83, 216–226. [Google Scholar] [CrossRef]
- Luan, S.; Zhang, C.; Zhang, X. Materials & Design Effect of residual stress redistribution on fatigue crack growth pertinent to crack closure and applied load. Mater. Des. 2023, 233, 112282. [Google Scholar] [CrossRef]
- Iziumova, A.; Zhelnin, M.; Kostina, A.; Vshivkov, A.; Gachegova, E.; Plekhov, O. Effect of laser shock peening patterns on fatigue life of notched TC4 specimens. Sci. Talks 2024, 9, 100290. [Google Scholar] [CrossRef]
- Watari, T.; Kine, Y.; Mitsubayashi, M.; Kabeya, Y.; Kurita, T.; Yoshimura, R.; Hirano, K.; Kawashima, T. Analysis of the effect of deep-profile compressive residual stress induced by laser peening on fatigue strength of 7075 aluminum alloy. Results Opt. 2024, 15, 100658. [Google Scholar] [CrossRef]
- Shojai, S.; Brömer, T.; Ghafoori, E.; Schaumann, P. Application of local fatigue approaches on corroded welded joints with consideration of weld geometry and residual stresses. Theor. Appl. Fract. Mech. 2024, 129, 104215. [Google Scholar] [CrossRef]
- Hirohata, M.; Chang, K.-H.; Suzuki, T.; Konishi, H. Local heating for reducing residual stress and fatigue-performance improvement of welded joints. J. Constr. Steel Res. 2024, 215, 108544. [Google Scholar] [CrossRef]
- Zaretsky, E.V.; Parker, R.J.; Anderson, W.J. NASA Technical Note CM Reproduced from Besi Available Copy I NASA TN D-2640 Effect of Component Differential Hardnesses on Rolling-Contact Fatigue and Load Capacity; Nasa Tn D-2640; National Aeronautics and Space Administration: Washington, DC, USA, 1965. [Google Scholar]
- Chen, W.J.; Chen, H.; Li, C.C.; Wang, X.; Cai, Q. Microstructure and fatigue crack growth of EA4T steel in laser cladding remanufacturing. Eng. Fail. Anal. 2017, 79, 120–129. [Google Scholar] [CrossRef]
- Linhart, V.; Černý, I. An effect of strength of railway axle steels on fatigue resistance under press fit. Eng. Fract. Mech. 2011, 78, 731–741. [Google Scholar] [CrossRef]
- Zerbst, U.; Klinger, C.; Klingbeil, D. Structure assessment of railway axles-a critical review. Eng. Fail. Anal. 2013, 35, 54–65. [Google Scholar] [CrossRef]
- Jørheim, F.; Siriwardane, S.C.; Pavlou, D. A review of fatigue damage detection and measurement techniques. Int. J. Fatigue 2022, 154, 106556. [Google Scholar] [CrossRef]
- Rigecy, D.A. The roles of hardness in she sUiding behavior of material. Wear 1994, 175, 63–69. [Google Scholar]
- Wu, B.C.; Redman, E. Hardfacing with cobalt and nickel alloys. Weld. J. 1994, 73, 63–68. [Google Scholar]
- Su, Y.L.; Chen, K.C. The influence of niobium, chromium, molybdenum and carbon on the sliding wear behavior of nickel-base hardfacing alloys. Wear 1997, 209, 160–170. [Google Scholar] [CrossRef]
- Fastow, M.; Bamberger, M.; Nir, N.; Landkof, M. Laser surface melting of AISI 4340 steel. Mater. Sci. Technol. 1990, 6, 900–904. [Google Scholar] [CrossRef]
- McDaniels, R.L.; White, S.A.; Liaw, K.; Chen, L.; McCay, M.H.; Liaw, P.K. Effects of a laser surface processing induced heat-affected zone on the fatigue behavior of AISI 4340 steel. Mater. Sci. Eng. A 2008, 485, 500–507. [Google Scholar] [CrossRef]
- Bhadeshia, H.K.D.H.; Honeycombe, R.W.K. Steels Microstructure and Properties, 3rd ed.; Butterworth-Heinemann: London, UK, 2005. [Google Scholar]
- Shiue, R.K.; Chen, C. Laser transformation hardening of tempered 4340 steel. Metall. Trans. A 1992, 23, 163–170. [Google Scholar] [CrossRef]
- Sun, S.D.; Liu, Q.; Brandt, M.; Luzin, V.; Cottam, R.; Janardhana, M.; Clark, G. Effect of laser clad repair on the fatigue behaviour of ultra-high strength AISI 4340 steel. Mater. Sci. Eng. A 2014, 606, 46–57. [Google Scholar] [CrossRef]
- Ye, D.Y.; Wang, D.J.; An, P. Characteristics of the change in the surface microhardness during high cycle fatigue damage. Mater. Chem. Phys. 1996, 44, 179–181. [Google Scholar] [CrossRef]
- Ye, D.; Tong, X.; Yao, L.; Yin, X. Fatigue hardening/softening behaviour investigated through Vickers microhardness measurement during high-cycle fatigue. Mater. Chem. Phys. 1998, 56, 199–204. [Google Scholar] [CrossRef]
- Ye, D.; Wang, Z. Approach to investigate pre-nucleation fatigue damage of cyclically loaded metals using Vickers microhardness tests. Int. J. Fatigue 2001, 23, 85–91. [Google Scholar] [CrossRef]
- Drumond, G.; Pinheiro, B.; Pasqualino, I.; Roudet, F.; Chicot, D.; Decoopman, X. High Cycle Fatigue Damage Evaluation of Steel Pipelines Based on Microhardness Changes During Cyclic Loads. In Proceedings of the ASME 2017 36th International Conference on Ocean, Offshore and Arctic Engineering, Trondheim, Norway, 25–30 June 2017. [Google Scholar]
- Drumond, G.; Pinheiro, B.; Pasqualino, I.; Roudet, F.; Chicot, D. High Cycle Fatigue Damage Evaluation of Steel Pipelines Based on Microhardness Changes During Cyclic Loads: Part II. In Proceedings of the ASME 2018 37th International Conference on Ocean, Offshore and Arctic Engineering, Madrid, Spain, 17–22 June 2018. [Google Scholar]
- Drumond, G.; Roudet, F.; Chicot, D.; Pinheiro, B.; Pasqualino, I. A damage criterion to predict the fatigue life of steel pipelines based on indentation measurements. J. Offshore Mech. Arct. Eng. 2021, 143, 011701. [Google Scholar] [CrossRef]
- ISO 6507-1:2007; Metallic Materials. Vickers Hardness Test. Test Method n.d. ISO: Geneva, Switzerland, 2007.
- Xin, H.; Correia, J.A.F.O.; Veljkovic, M.; Berto, F.; Manuel, L. Residual stress effects on fatigue life prediction using hardness measurements for butt-welded joints made of high strength steels. Int. J. Fatigue 2021, 147, 106175. [Google Scholar] [CrossRef]
- Lee, J.-M.; Seo, J.-K.; Kim, M.-H.; Shin, S.-B.; Han, M.-S.; Park, J.-S.; Mahendran, M. Comparison of hot spot stress evaluation methods for welded structures. Int. J. Nav. Arch. Ocean Eng. 2010, 2, 200–210. [Google Scholar] [CrossRef]
- Mendes, P.; Monteiro, M.; Silva, R.P.; Correia, J.A.; de Jesus, A.M.; Vieira, M.; Pereira, T.; Reis, A. Microstructure and Hardness Properties of a S690QL Steel Welded Joint. Procedia Struct. Integr. 2024, 54, 340–353. [Google Scholar] [CrossRef]
- Kumar, N.P.; Shanmugam, N.S. Some studies on nickel based Inconel 625 hard overlays on AISI 316L plate by gas metal arc welding based hardfacing process. Wear 2020, 456–457, 203394. [Google Scholar] [CrossRef]
- Ghasemi, M.A.; Falahatgar, S.R. Damage evolution in brittle coating/substrate structures under three-point bending using discrete element method. Surf. Coat. Technol. 2019, 358, 567–576. [Google Scholar] [CrossRef]
- Tan, L.G.; Li, G.L.; Tao, C.; Feng, P.F. Study on fatigue life prediction of thermal barrier coatings for high-power engine pistons. Eng. Fail. Anal. 2022, 138, 106335. [Google Scholar] [CrossRef]
- Chew, Y.; Pang, J.H.L.; Bi, G.; Song, B. Effects of laser cladding on fatigue performance of AISI 4340 steel in the as-clad and machine treated conditions. J. Mater. Process. Technol. 2017, 243, 246–257. [Google Scholar] [CrossRef]
- Wang, G.; Zhang, J.; Shu, R.; Yang, S. High temperature wear resistance and thermal fatigue behavior of Stellite-6/WC coatings produced by laser cladding with Co-coated WC powder. Int. J. Refract. Met. Hard Mater. 2019, 81, 63–70. [Google Scholar] [CrossRef]
- Koehler, H.; Schumacher, J.; Schuischel, K.; Partes, K.; Bomas, H.; Jablonski, F.; Vollertsen, F.; Kienzler, R. An approach to calculate fatigue properties of laser cladded components. Prod. Eng. 2012, 6, 137–148. [Google Scholar] [CrossRef]
- Pasarkar, A.; Balaguru, S. Development on Fatigue Testing of Hardfaced Components in Sodium Cooled Fast Reactors. Eng. Fail. Anal. 2022, 137, 106161. [Google Scholar] [CrossRef]
- Balaguru, S.; Abid, M.; Gupta, M. Investigations on different hardfacing processes for High temperature applications of Ni-Cr-B-Si alloy hardfaced on austenitic stainless steel components. J. Mater. Res. Technol. 2020, 9, 10062–10072. [Google Scholar] [CrossRef]
- Balaguru, S.; Gupta, M. Hardfacing studies of Ni alloys: A Critical Review. J. Mater. Res. Technol. 2021, 10, 1210–1242. [Google Scholar] [CrossRef]
- Kanga, S.; Cheemaa, G.S.; Singla, S. Wear behavior of hardfacings on rotary tiller blades. In Proceedings of the 12th Global Congress on Manufacturing and Management, GCMM 2014, Vellore, India, 8–10 December 2014; Procedia Engineering. Volume 97, pp. 1442–1451. [Google Scholar]
- Huther, I. The Influence of Improvement Techniques on Welded Joint Fatigue Strength, International Institute of Welding XIII-1562. Available online: https://books.google.co.in/books?id=x5fVzwEACAAJ (accessed on 4 April 2024).
- Dasgupta, R.; Prasad, B.K.; Jha, A.K.; Modi, O.P.; Das, S.; Yegneswaran, A.H. Low stress abrasive wear behavior of a hardfaced steel. J. Mater. Eng. Perform. 1998, 7, 221–226. [Google Scholar] [CrossRef]
- Kumar, S.; Mondal, D.P.; Jha, A.K. Effect of Microstructure and Chemical Composition of Hardfacing Alloy on Abrasive Wear Behavior. J. Mater. Eng. Perform. 2000, 9, 649–655. [Google Scholar] [CrossRef]
- Kumar, S.; Mondal, D.P.; Khaira, H.K.; Jha, A.K. Improvement in High Stress Abrasive Wear Property of Steel by Hardfacing. J. Mater. Eng. Perform. 1999, 8, 711–715. [Google Scholar] [CrossRef]
- Ritchie, R.O. Near-threshold fatigue-crack propagation in steels. Int. Met. Rev. 1979, 5–6, 205–230. [Google Scholar]
- Dai, W.; Zhang, C.; Yue, H.; Li, Q.; Guo, C.; Zhang, J.; Zhao, G.; Yang, X. A review on the fatigue performance of micro-arc oxidation coated Al alloys with micro-defects and residual stress. J. Mater. Res. Technol. 2023, 25, 4554–4581. [Google Scholar] [CrossRef]
- Nguyen, T.N.; Wahab, M.A. The effect of weld geometry and residual stresses on the fatigue of welded joints under combined loading. J. Mater. Process. Technol. 1998, 300, 201–208. [Google Scholar] [CrossRef]
- Nguyen, T.N.; Wahab, M.A. The effect of residual stresses and weld geometry on the improvement of fatigue life. J. Mater. Process. Technol. 1995, 48, 581–588. [Google Scholar]
- Nguyen, T.N.; Wahab, M.A. Theoretical analysis of the effect of residual stresses in welded structures on the improvement of fatigue strength. In Proceedings of the 5th Australian Aeronautical Conference, Work-shop on Fracture and Fatigue Life Enhancement, Melbourne, Australia, 13–15 September 1993; pp. 463–469. [Google Scholar]
- Knez, M.; Glode, S.; Ruika, M.; Kramberger, J. A rotating bending approach for determination of low-cycle fatigue parameters. Int. J. Fatigue 2010, 32, 1724–1730. [Google Scholar] [CrossRef]
- Design with Weldox and Hardox; SSAB: Oxelösund, Sweden, 1991.
- Lee, D.; Shin, I.; Kim, Y.; Koo, J.M.; Seok, C.S. A study on fatigue life prediction of Ni-base superalloy. Procedia Eng. 2013, 55, 631–635. [Google Scholar] [CrossRef]
- Brooks, J.W.; Bridges, P.J. Metallurgical Stability of Inconel Alloy 718, no. January, pp. 33–42, 2012. Available online: https://www.tms.org/Superalloys/10.7449/1988/Superalloys_1988_33_42.pdf (accessed on 4 April 2024).
- Li, Y.; Dong, S.; Yan, S.; Li, E.; Liu, X.; He, P.; Xu, B. Deep pit repairing of nodular cast iron by laser cladding NiCu/Fe-36Ni low-expansion composite alloy. Mater. Charact. 2019, 151, 273–279. [Google Scholar] [CrossRef]
- Masaki, K. Correlation between rotating bending fatigue limit and static strength of Mg-Al-Zn alloys. Procedia Struct. Integr. 2019, 19, 168–174. [Google Scholar] [CrossRef]
- Zhang, B.; Haghshenas, A.; Zhang, X.; Zhao, J.; Shao, S.; Khonsari, M.; Guo, S.; Meng, W. On the failure mechanisms of Cr-coated 316 stainless steel in bending fatigue tests. Int. J. Fatigue 2020, 139, 105733. [Google Scholar] [CrossRef]
- Swanson, S.R. Handbook of Fatigue Testing; ASTM: West Conshohocken, PA, USA, 1974. [Google Scholar]
- Gupta, S.; Barrios, A.; England, N.; Pierron, O.N. Improved very high cycle bending fa- tigue behavior of Ni microbeams with Au coatings. Acta Mater. 2018, 161, 444–455. [Google Scholar] [CrossRef]
- Ding, M.C.; Zhang, Y.L.; Lu, H.T. Fatigue life prediction of TC17 titanium alloy based on micro scratch. Int. J. Fatigue 2020, 139, 105793. [Google Scholar] [CrossRef]
- Hu, Y.; Wu, S.; Withers, P.; Zhang, J.; Bao, H.; Fu, Y.; Kang, G. The effect of manufacturing defects on the fatigue life of selective laser melted Ti-6Al-4V structures. Mater. Des. 2020, 192, 108708. [Google Scholar] [CrossRef]
- WKim, W.-S.; Kim, Y.-J.; Kim, Y.-S.; Park, S.-U.; Lee, K.-H.; Hong, D.-H.; Choi, C.-H. Evaluation of the fatigue life of a tractor’s transmission spiral bevel gear. J. Terramechanics 2021, 94, 13–22. [Google Scholar] [CrossRef]
- Abdullah, L.; Singh, S.S.K.; Abdullah, S.; Azman, A.H.; Ariffin, A.K. Fatigue reliability and hazard assessment of road load strain data for determining the fatigue life characteristics. Eng. Fail. Anal. 2021, 123, 105314. [Google Scholar] [CrossRef]
- Wang, W.J.; Fu, Z.K.; Cao, X.; Guo, J.; Liu, Q.Y.; Zhu, M.H. The role of lanthanum oxide on wear and contact fatigue damage resistance of laser cladding Fe-based alloy coating under oil lubrication condition. Tribol. Int. 2016, 94, 470–478. [Google Scholar] [CrossRef]
- Santecchia, E.; Hamouda, A.M.S.; Musharavati, F.; Zalnezhad, E.; Cabibbo, M.; El Mehtedi, M.; Spigarelli, S. A Review on Fatigue Life Prediction Methods for Metals. Adv. Mater. Sci. Eng. 2016, 2016, 9573524. [Google Scholar] [CrossRef]
- Tanaka, K.; Mura, T. A dislocation model for fatigue crack initiation. J. Appl. Mech. 1981, 48, 97–103. [Google Scholar] [CrossRef]
- Kapoor, R.; Baumann, J.A.; Grant, G. Probabilistic fatigue life prediction model for alloys with defects: Applied to A206. Acta Mater. 2011, 59, 3447–3462. [Google Scholar] [CrossRef]
- Yao, W.; Xu, Y.; Liu, H.-W.; Xia, K. Quantification of thermally induced damage and its effect on dynamic fracture toughness of two mortars. Eng. Fract. Mech. 2017, 169, 74–88. [Google Scholar] [CrossRef]
- Zanichelli, A.; Carpinteri, A.; Ronchei, C.; Scorza, D.; Vantadori, S. ScienceDirect ScienceDirect Fatigue life estimation of additively manufactured AISI 316L stainless steel. Procedia Struct. Integr. 2024, 53, 3–11. [Google Scholar] [CrossRef]
- Abazari, S.; Shamsipur, A.; Bakhsheshi-rad, H.R.; Drelich, J.W.; Goldman, J.; Sharif, S. Magnesium-based nanocomposites: A review from mechanical, creep and fatigue properties. J. Magnes. Alloy. 2023, 11, 2655–2687. [Google Scholar] [CrossRef]
- Cui, D.F.; Hu, H.Y. Thermal buckling and natural vibration of the beam with an axial stick–slip–stop boundary. J. Sound Vib. 2014, 333, 2271–2282. [Google Scholar] [CrossRef]
- Wanhill, R.J.H. Fatigue Requirements for Aircraft Structures; Elsevier Ltd.: Amsterdam, The Netherlands, 2018. [Google Scholar]
- Kirkhope, K.J.; Bell, R.; Caron, L.; Basu, R.I.; Ma, K.T. Weld detail fatigue life improvement techniques. Part 1: Review. Mar. Struct. 1999, 12, 447–474. [Google Scholar] [CrossRef]
- Klotz, T.; Delbergue, D.; Bocher, P.; Lévesque, M.; Brochu, M. Surface characteristics and fatigue behavior of shot peened Inconel 718. Int. J. Fatigue 2018, 110, 10–21. [Google Scholar] [CrossRef]
- Čular, I.; Vučković, K.; Žeželj, D.; Glodež, S. Analytical approach for low and high cycle bending fatigue life prediction of carburized gear steel specimens. Eng. Fail. Anal. 2020, 108, 104328. [Google Scholar] [CrossRef]
- Dantas, R.; Gouveia, M.; Silva, F.G.A.; Fiorentin, F.; Correia, J.A.F.O.; Lesiuk, G.; de Jesus, A. Notch effect in very high-cycle fatigue behaviour of a structural steel. Int. J. Fatigue 2023, 177, 107925. [Google Scholar] [CrossRef]

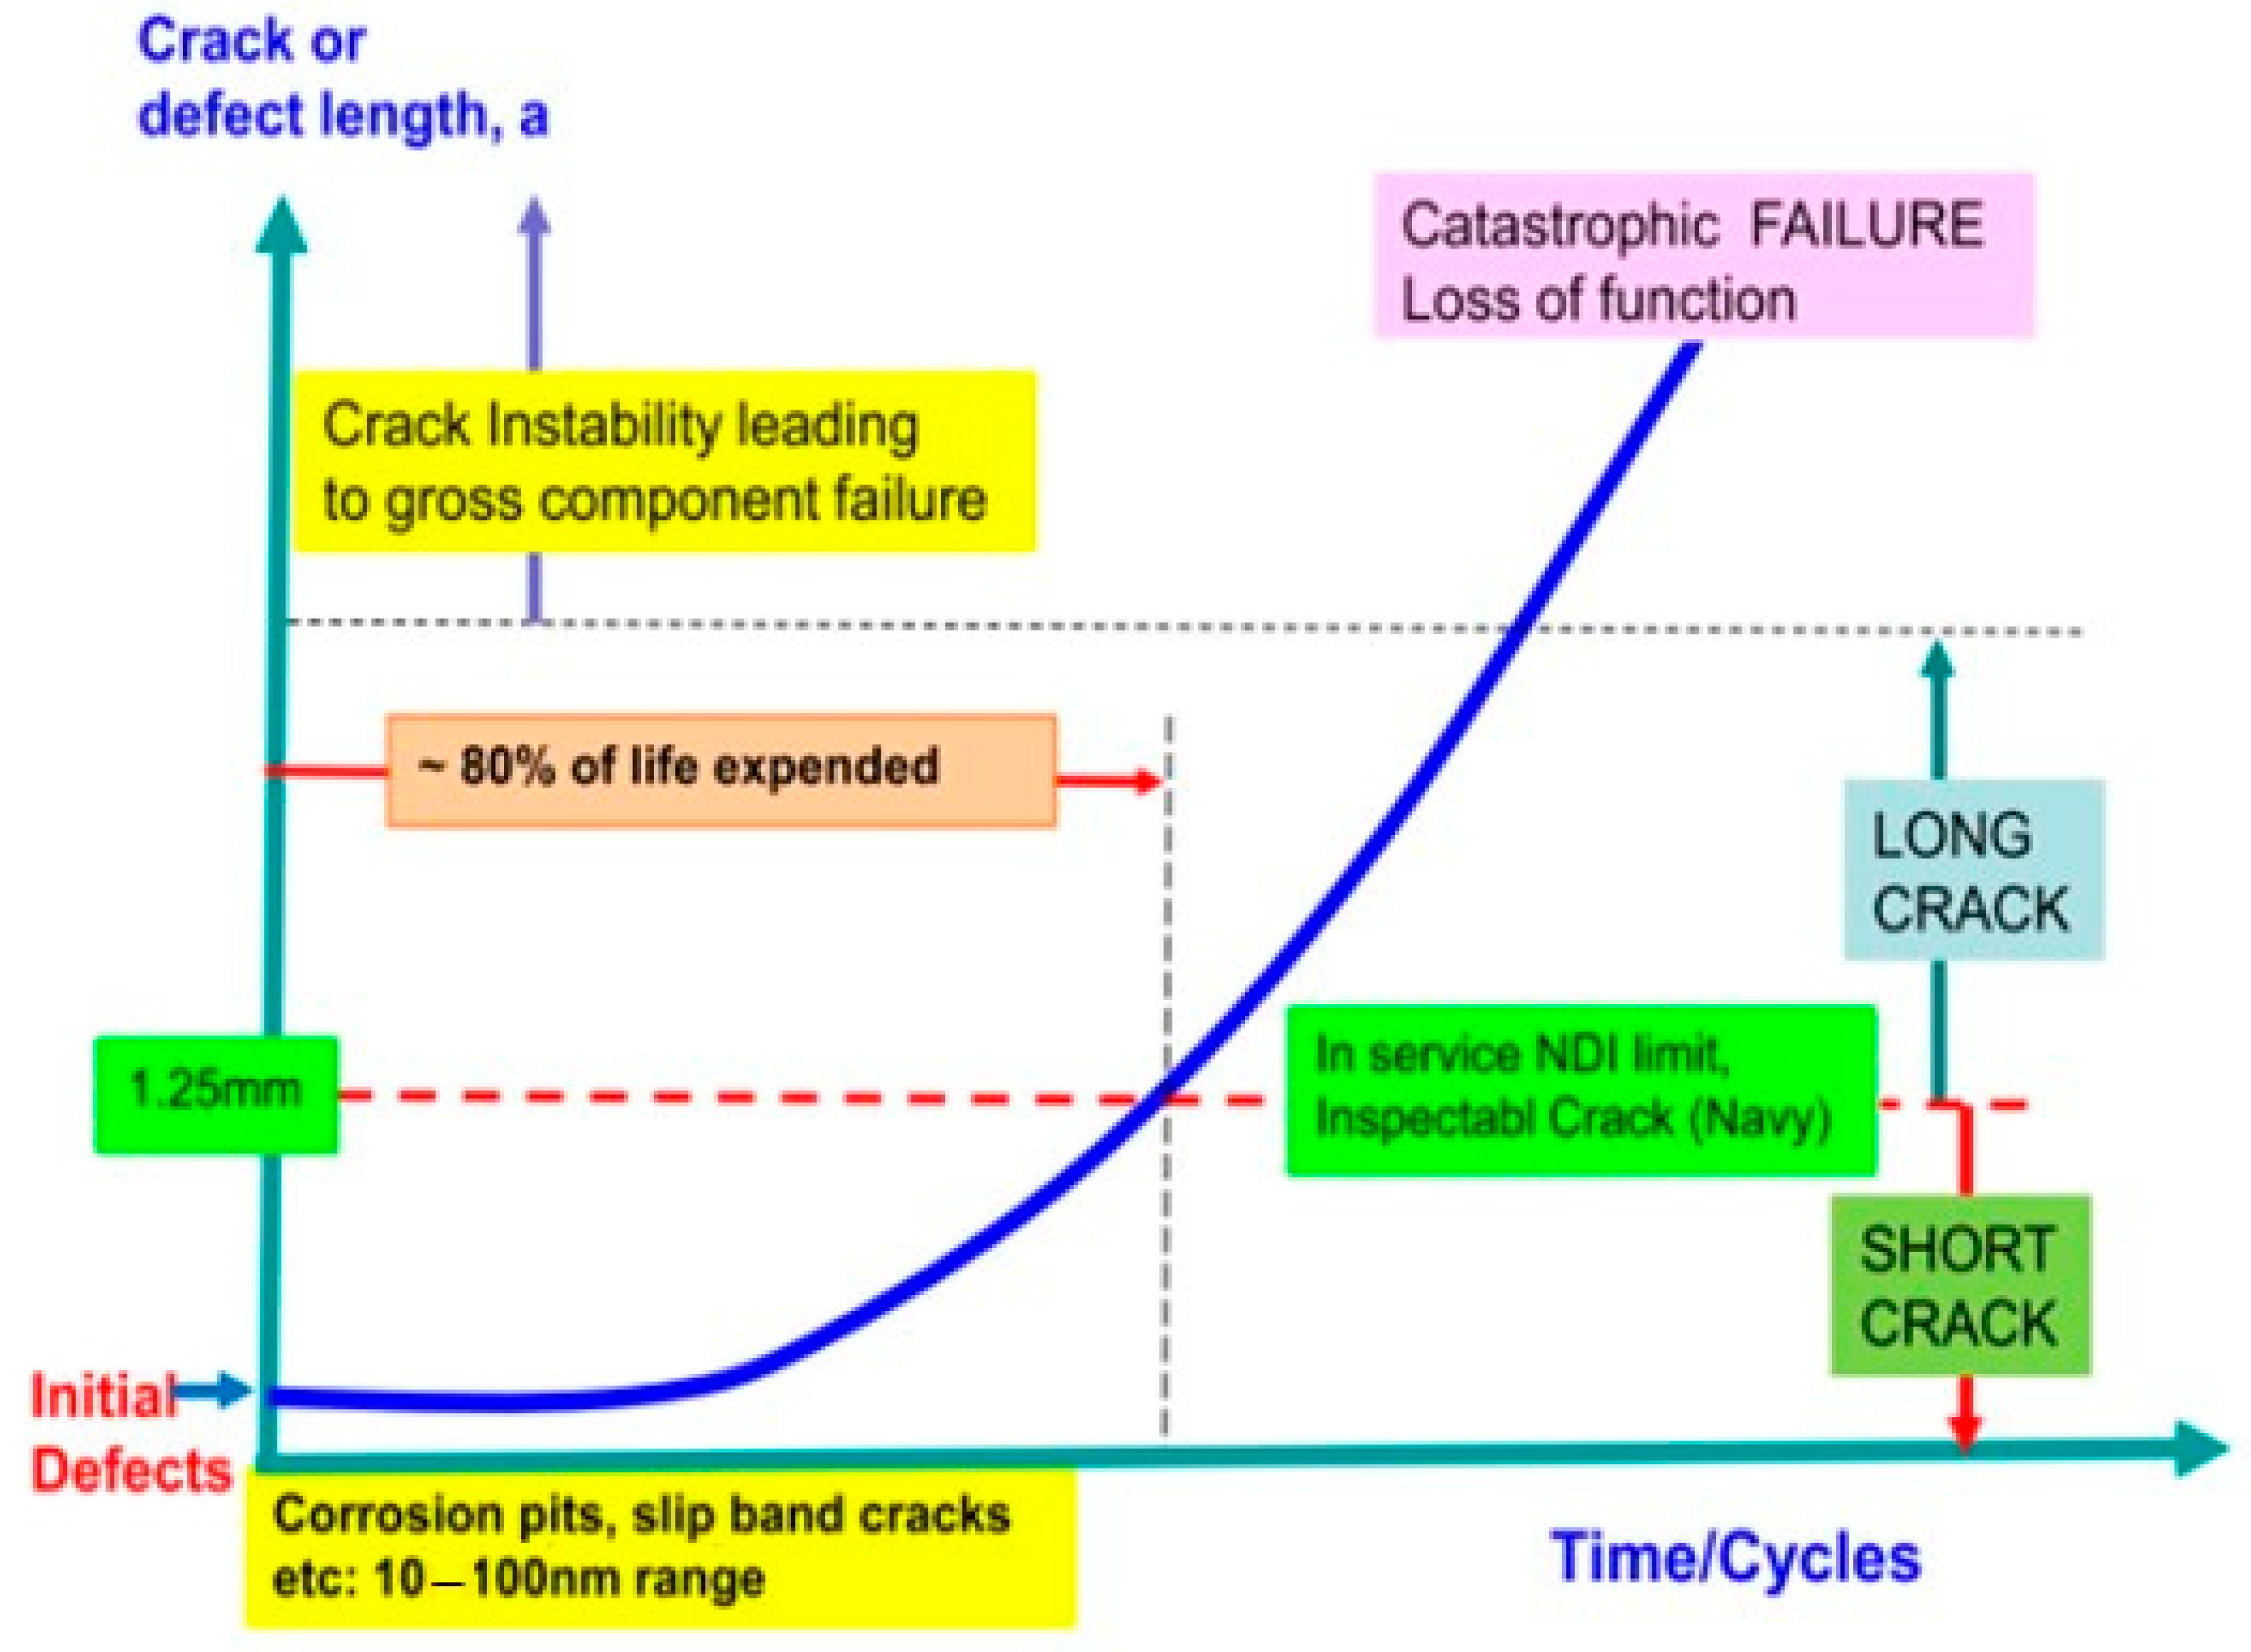
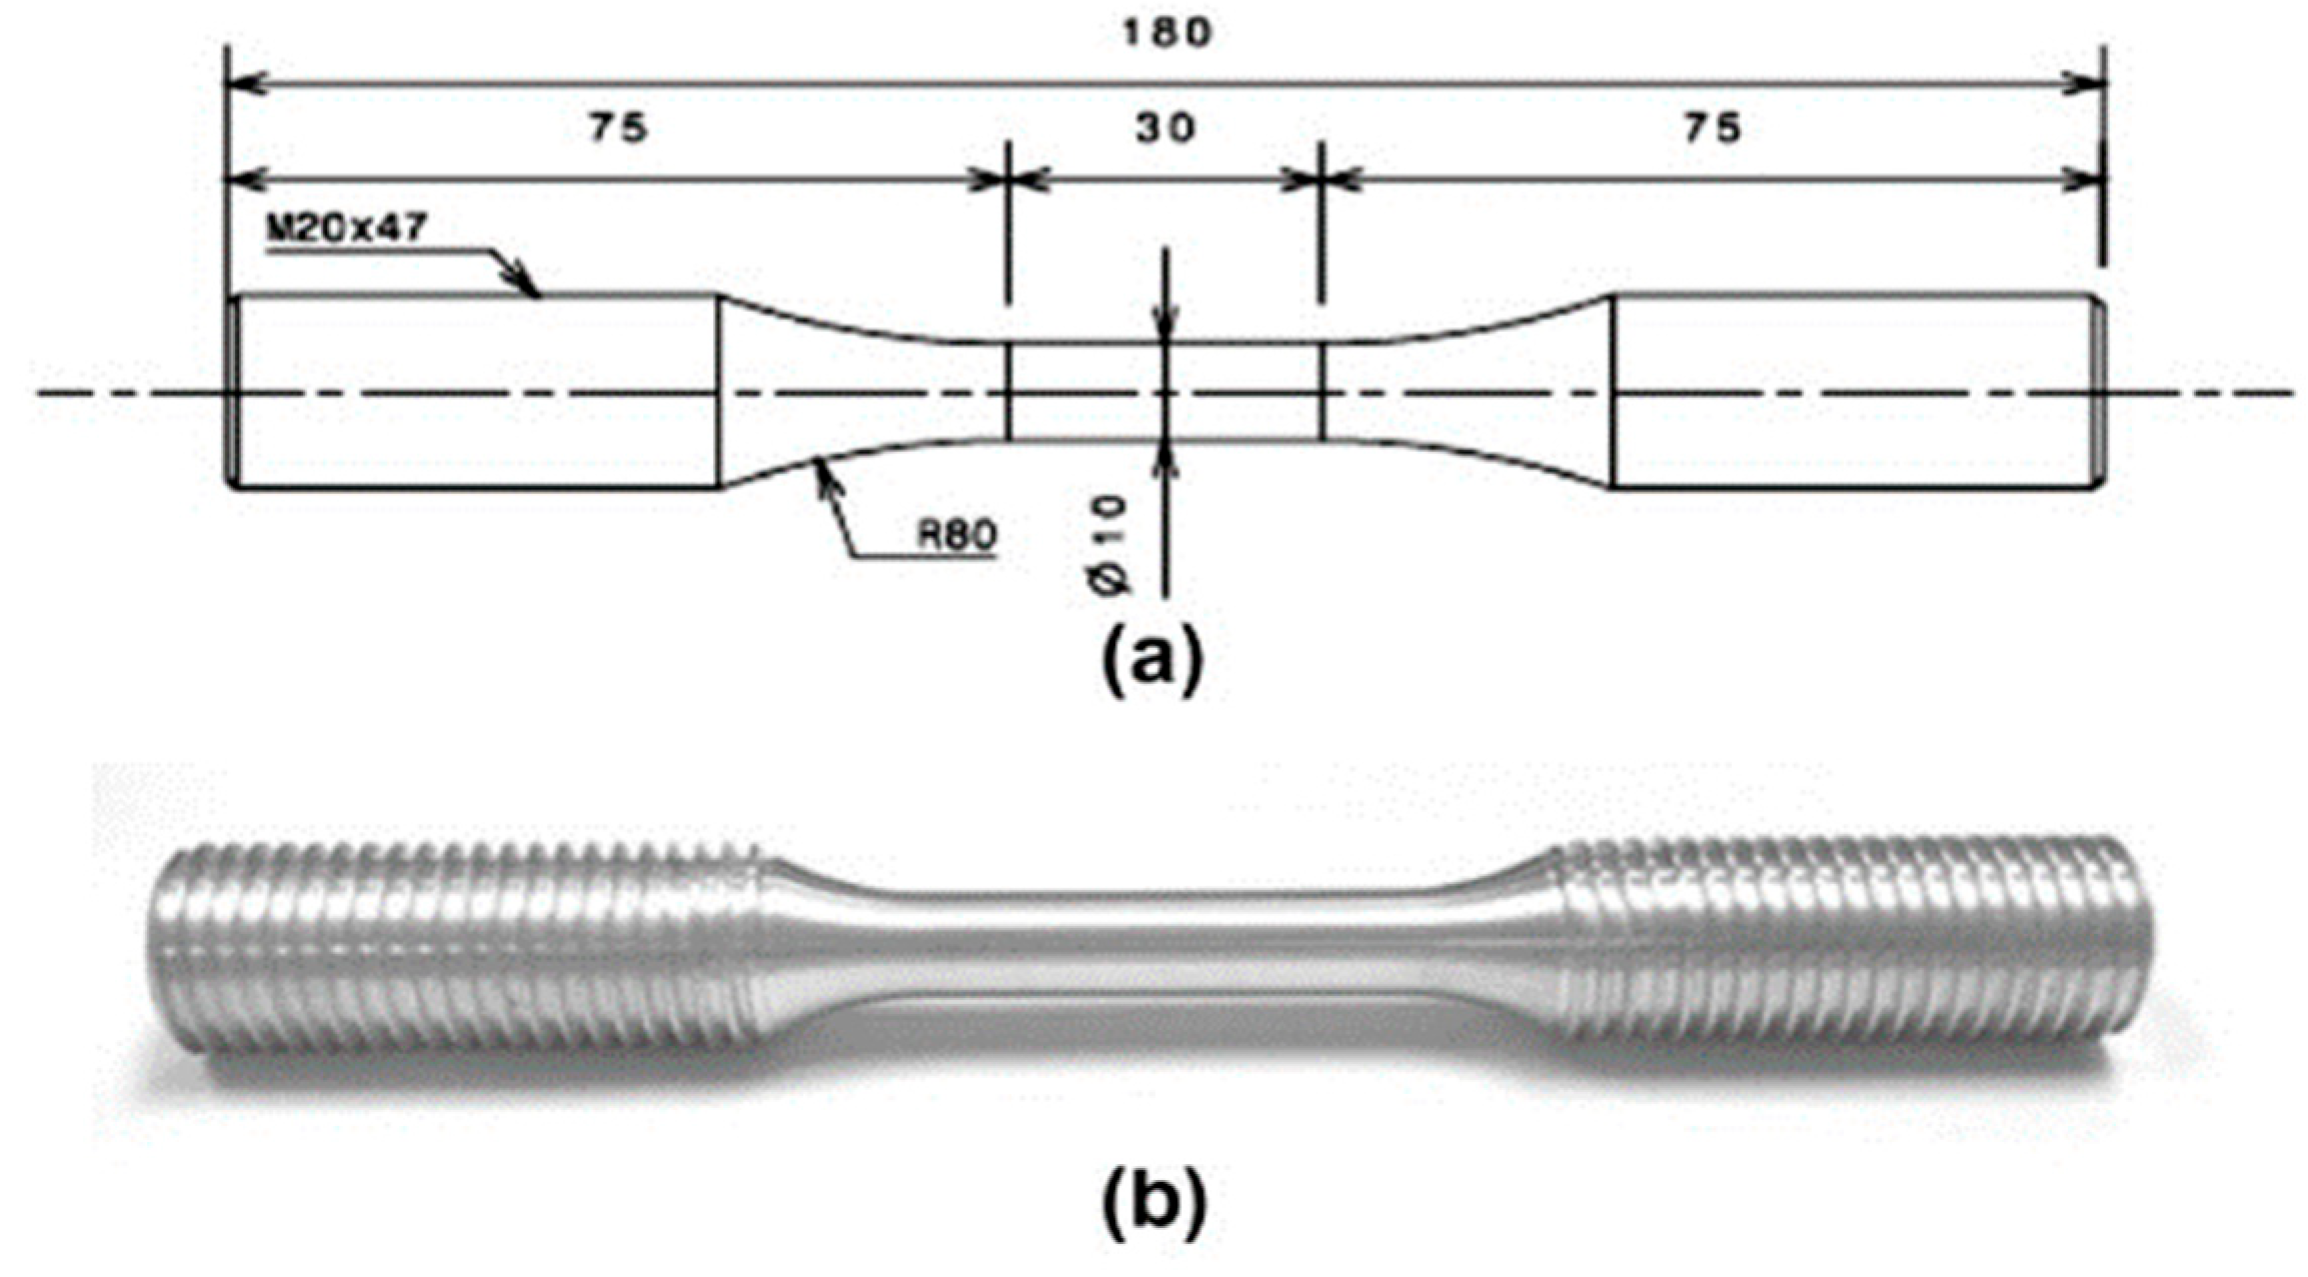
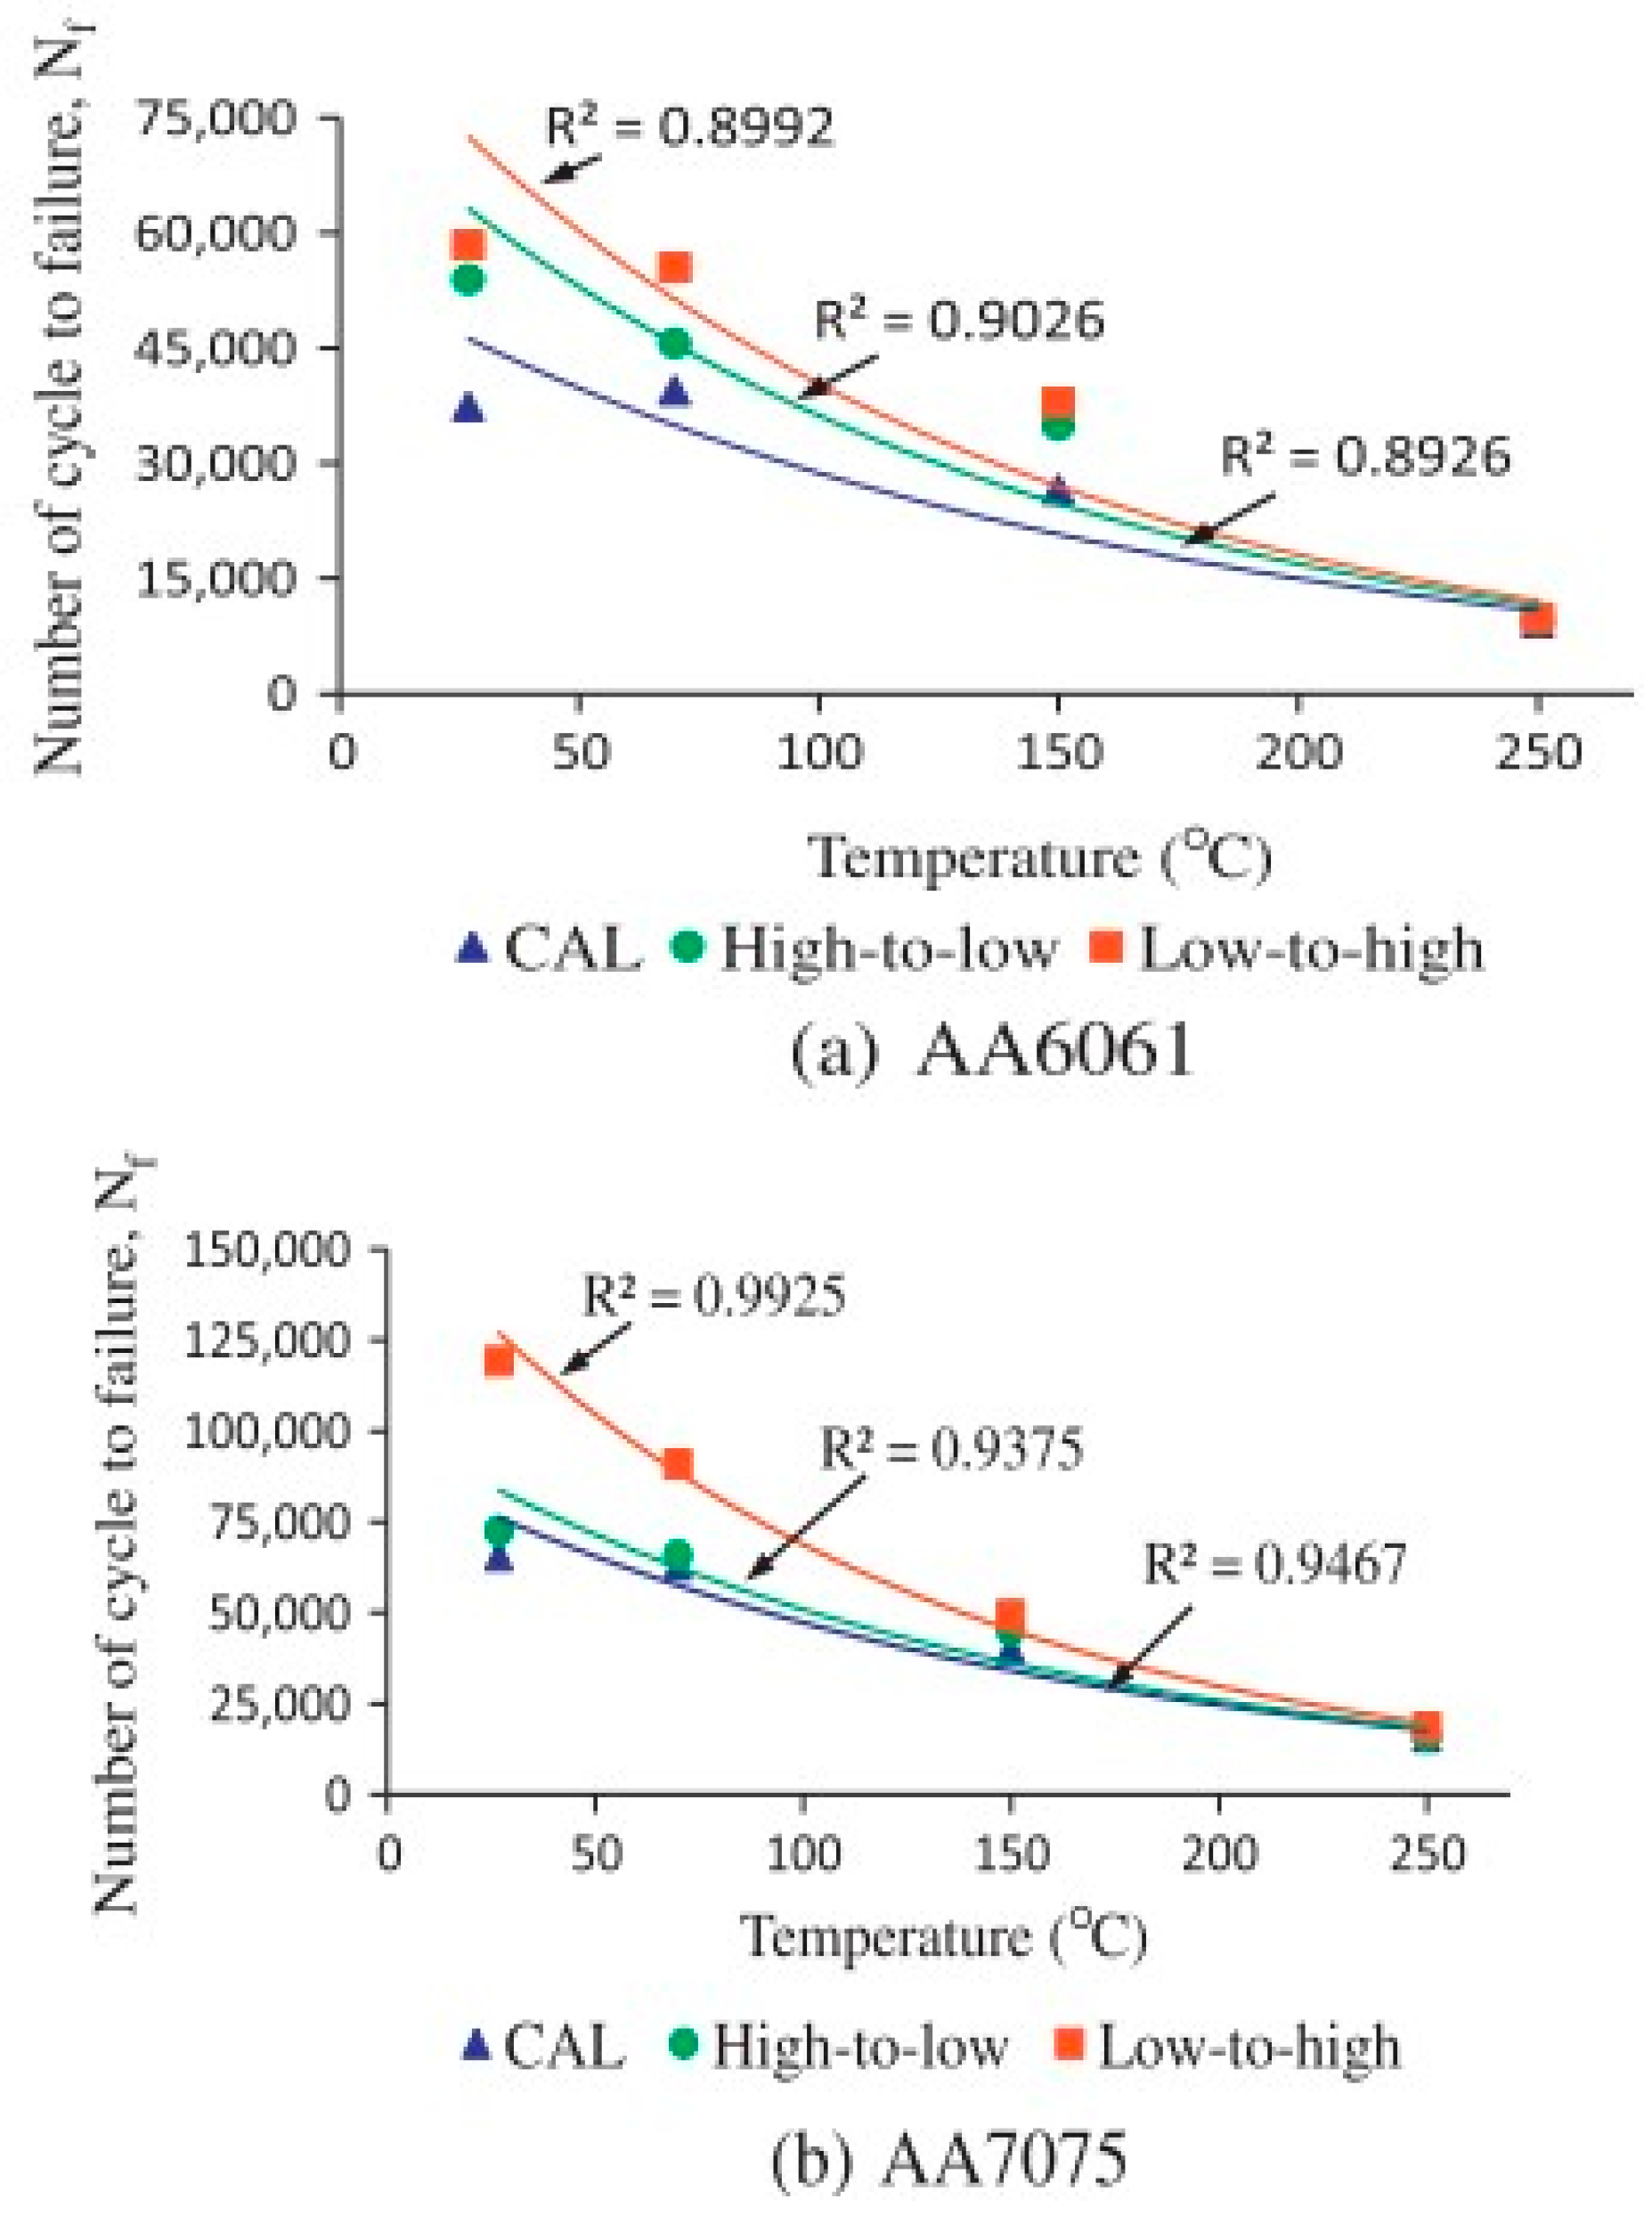
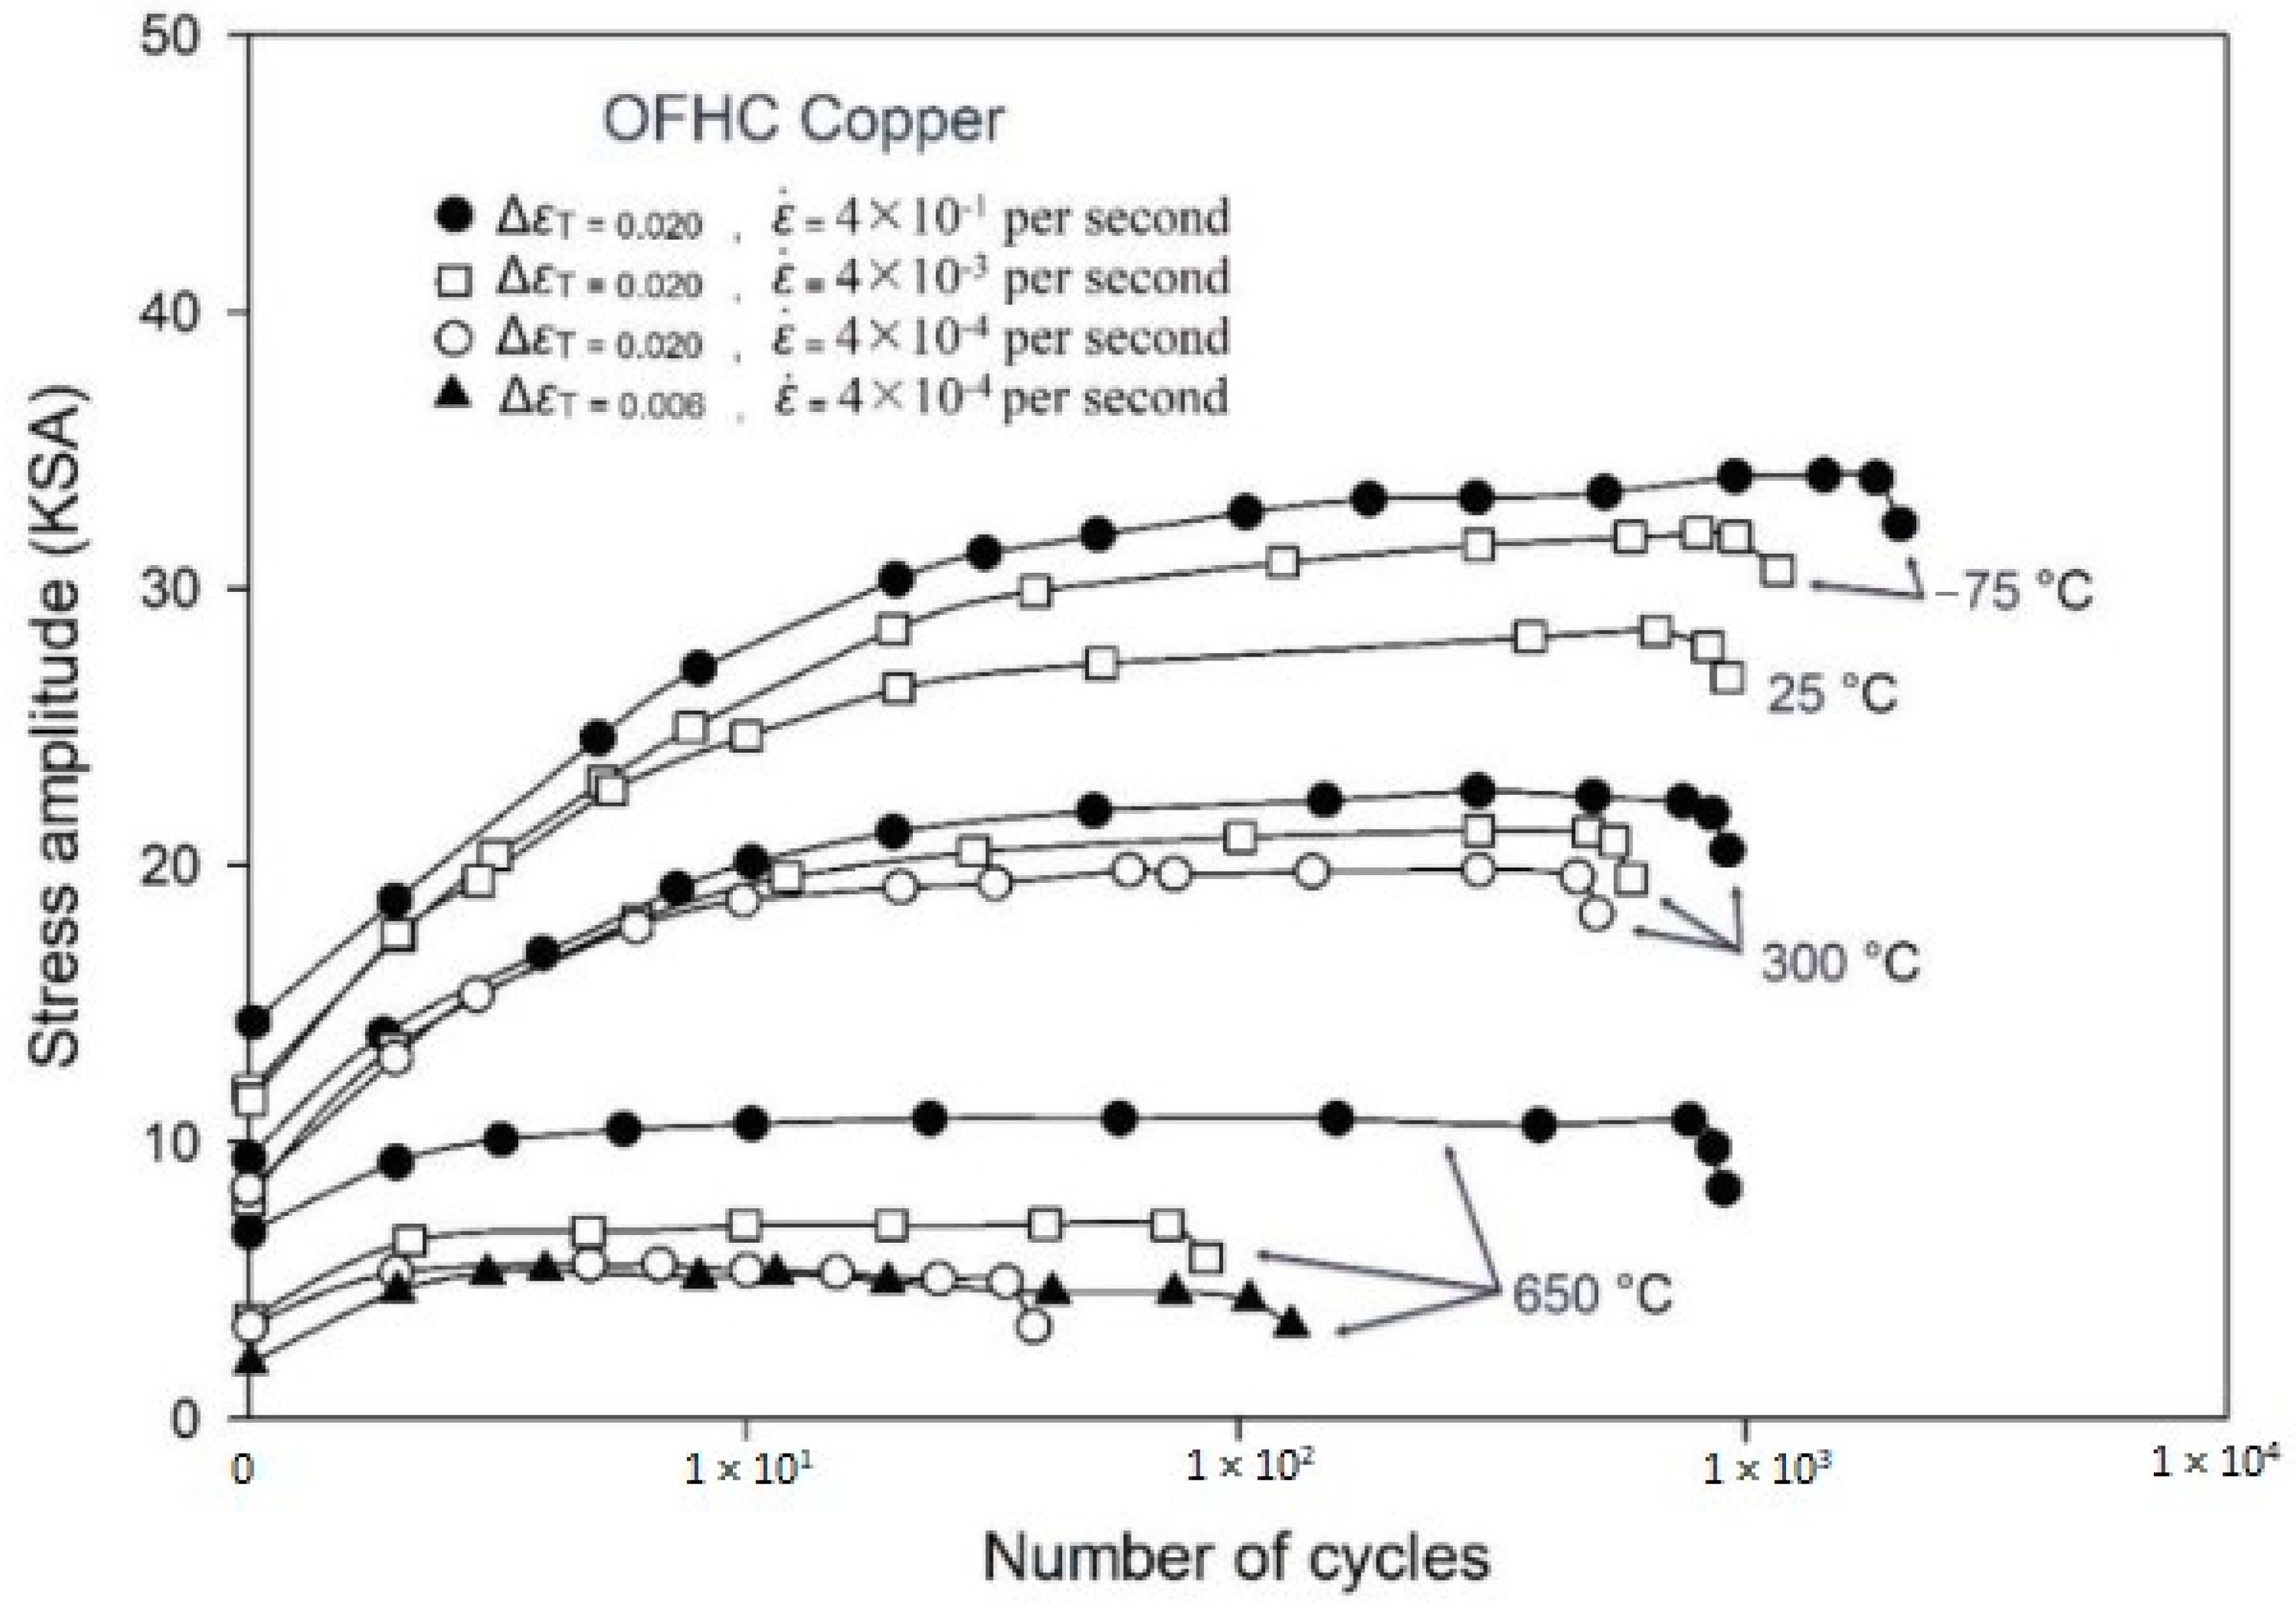
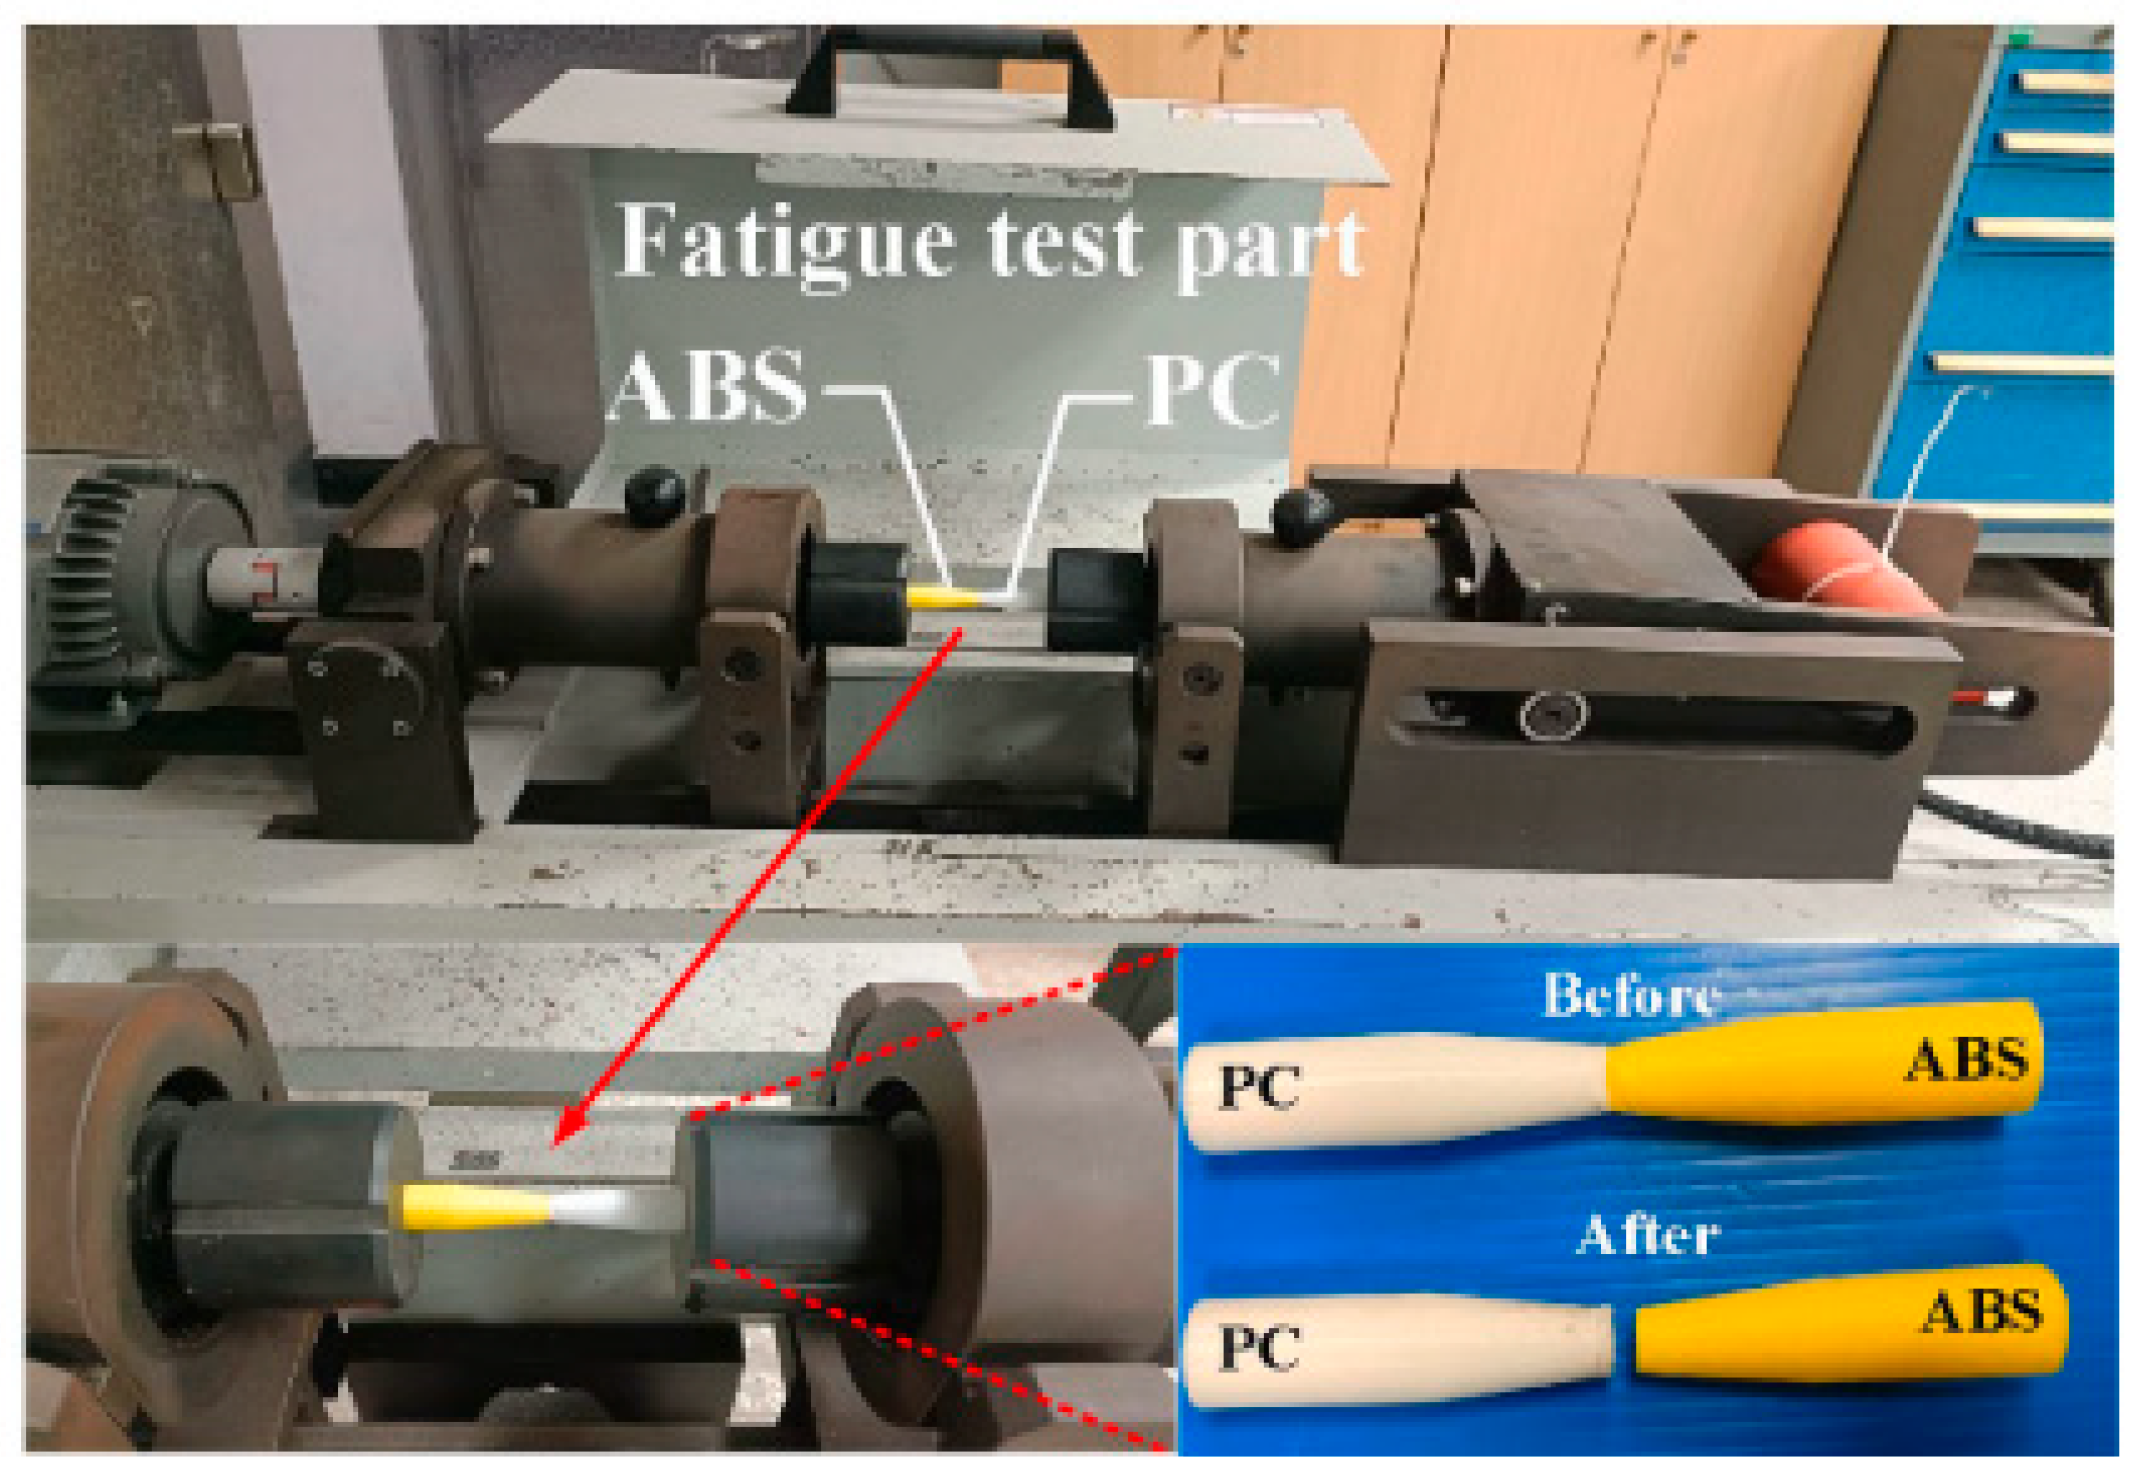
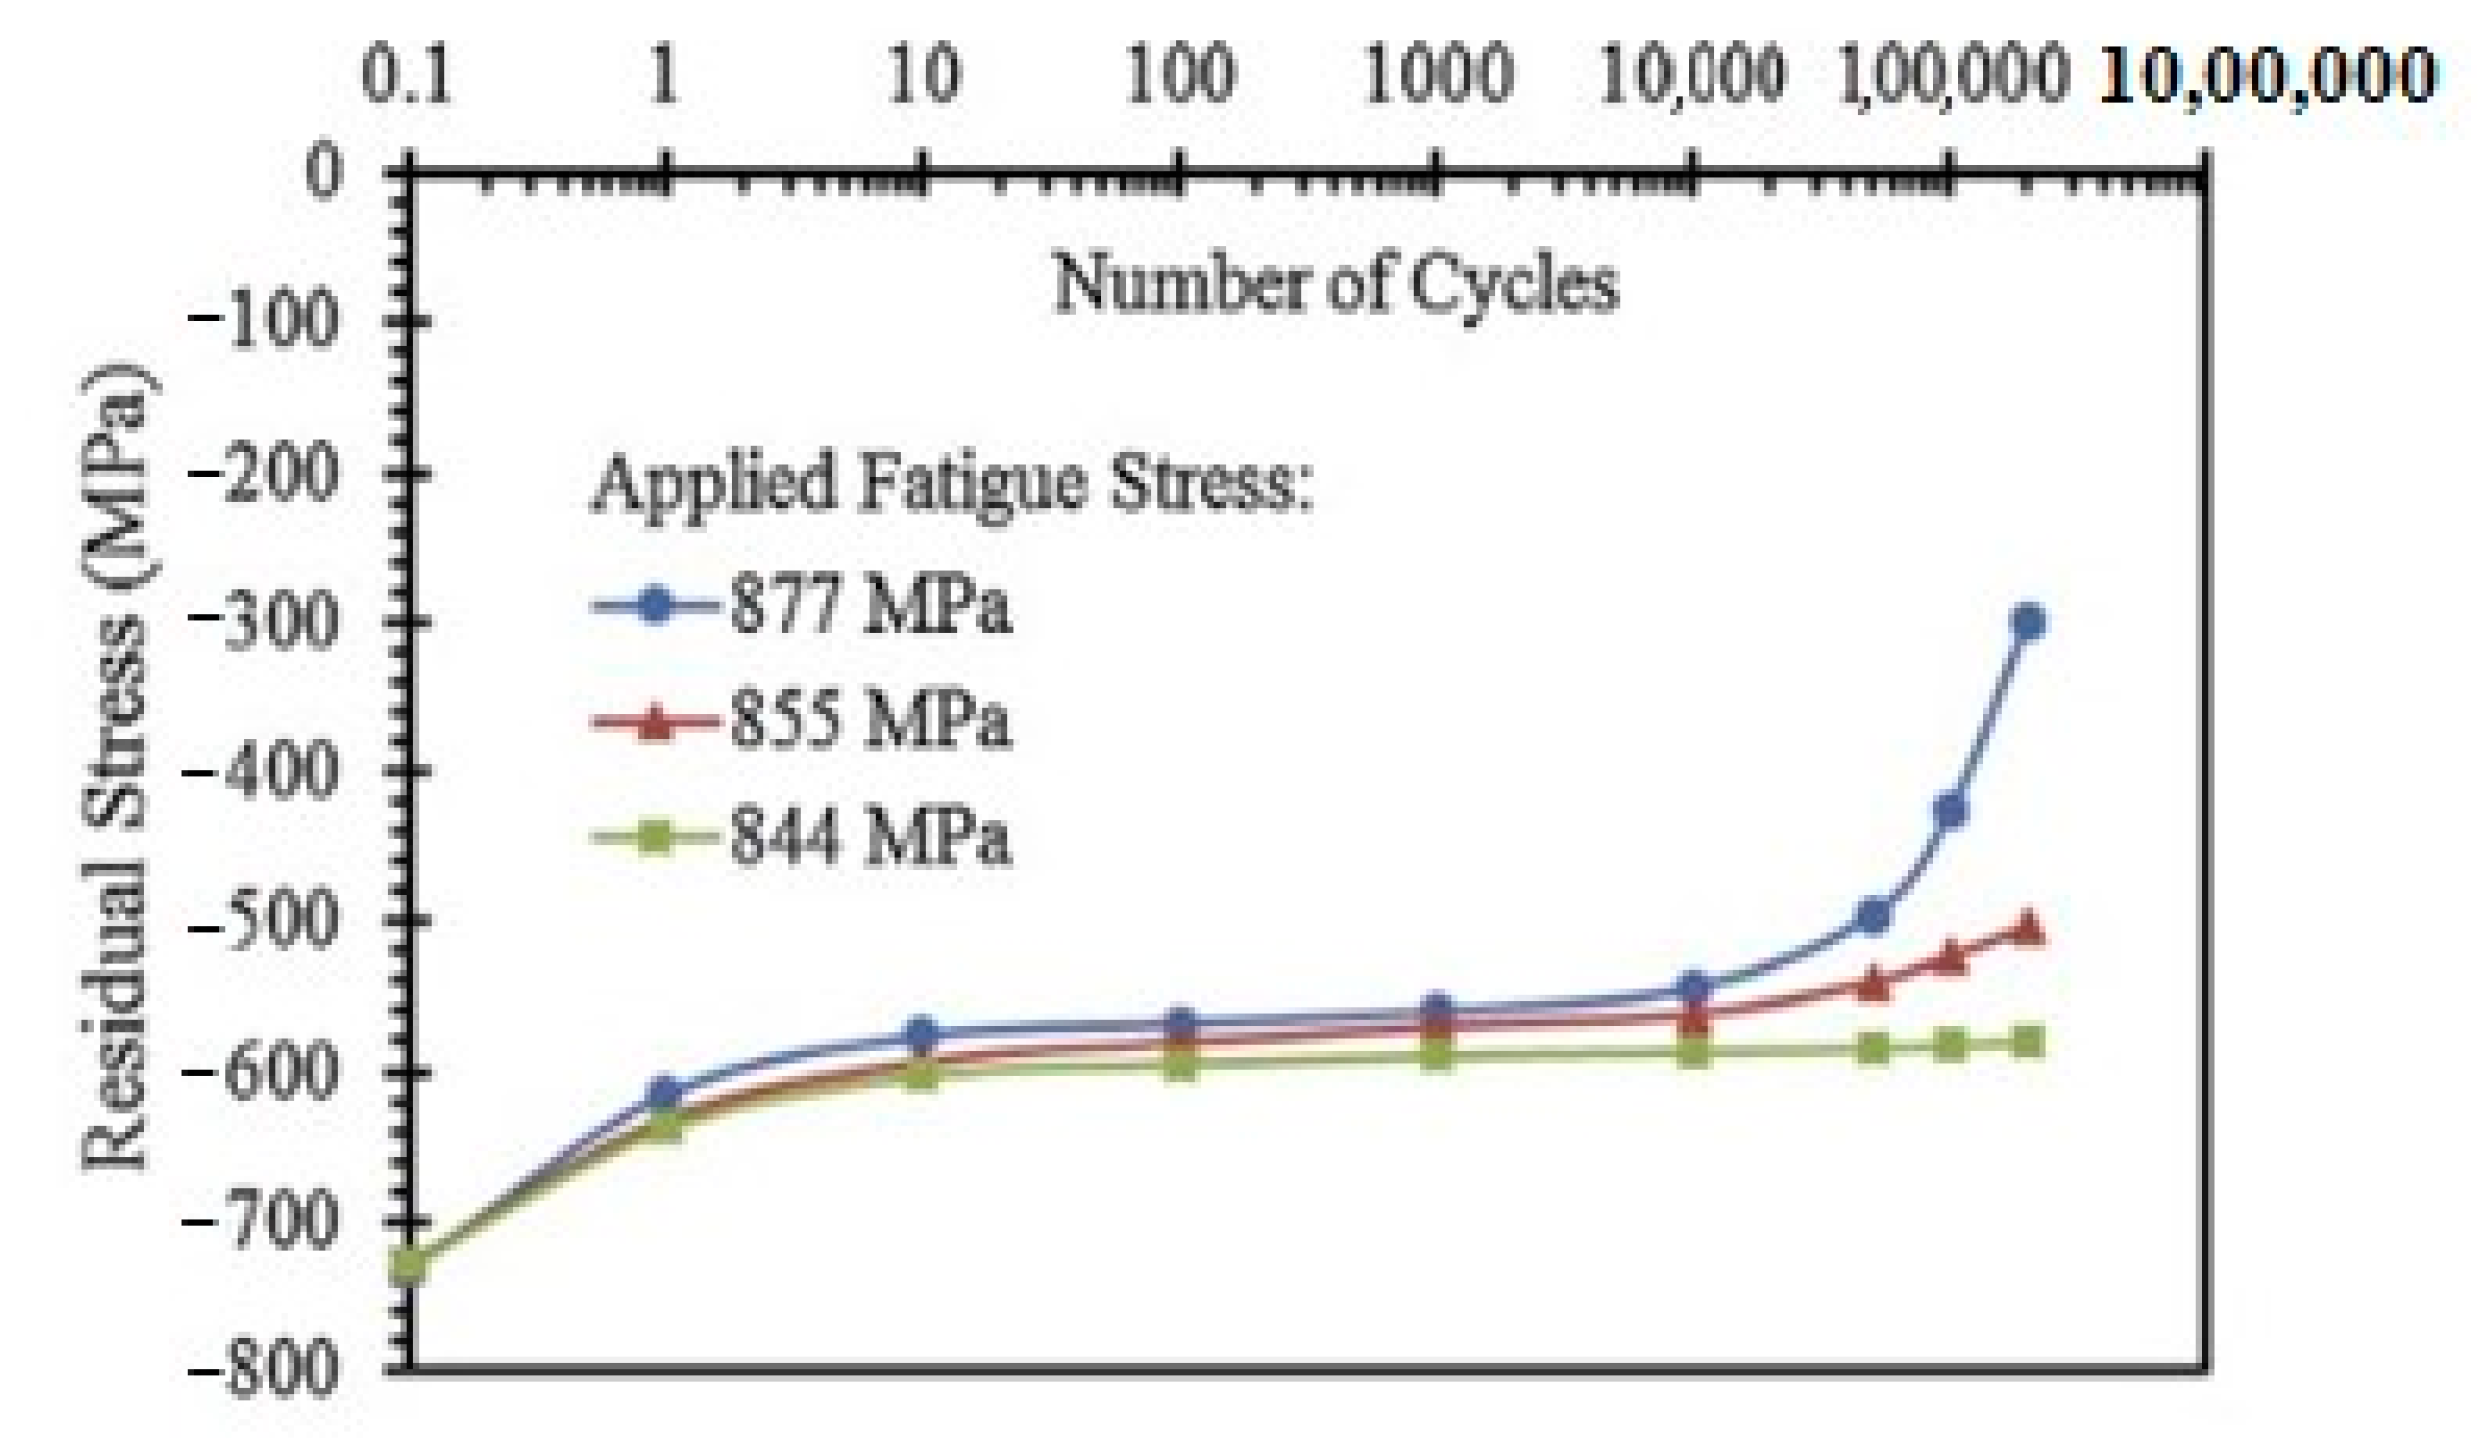

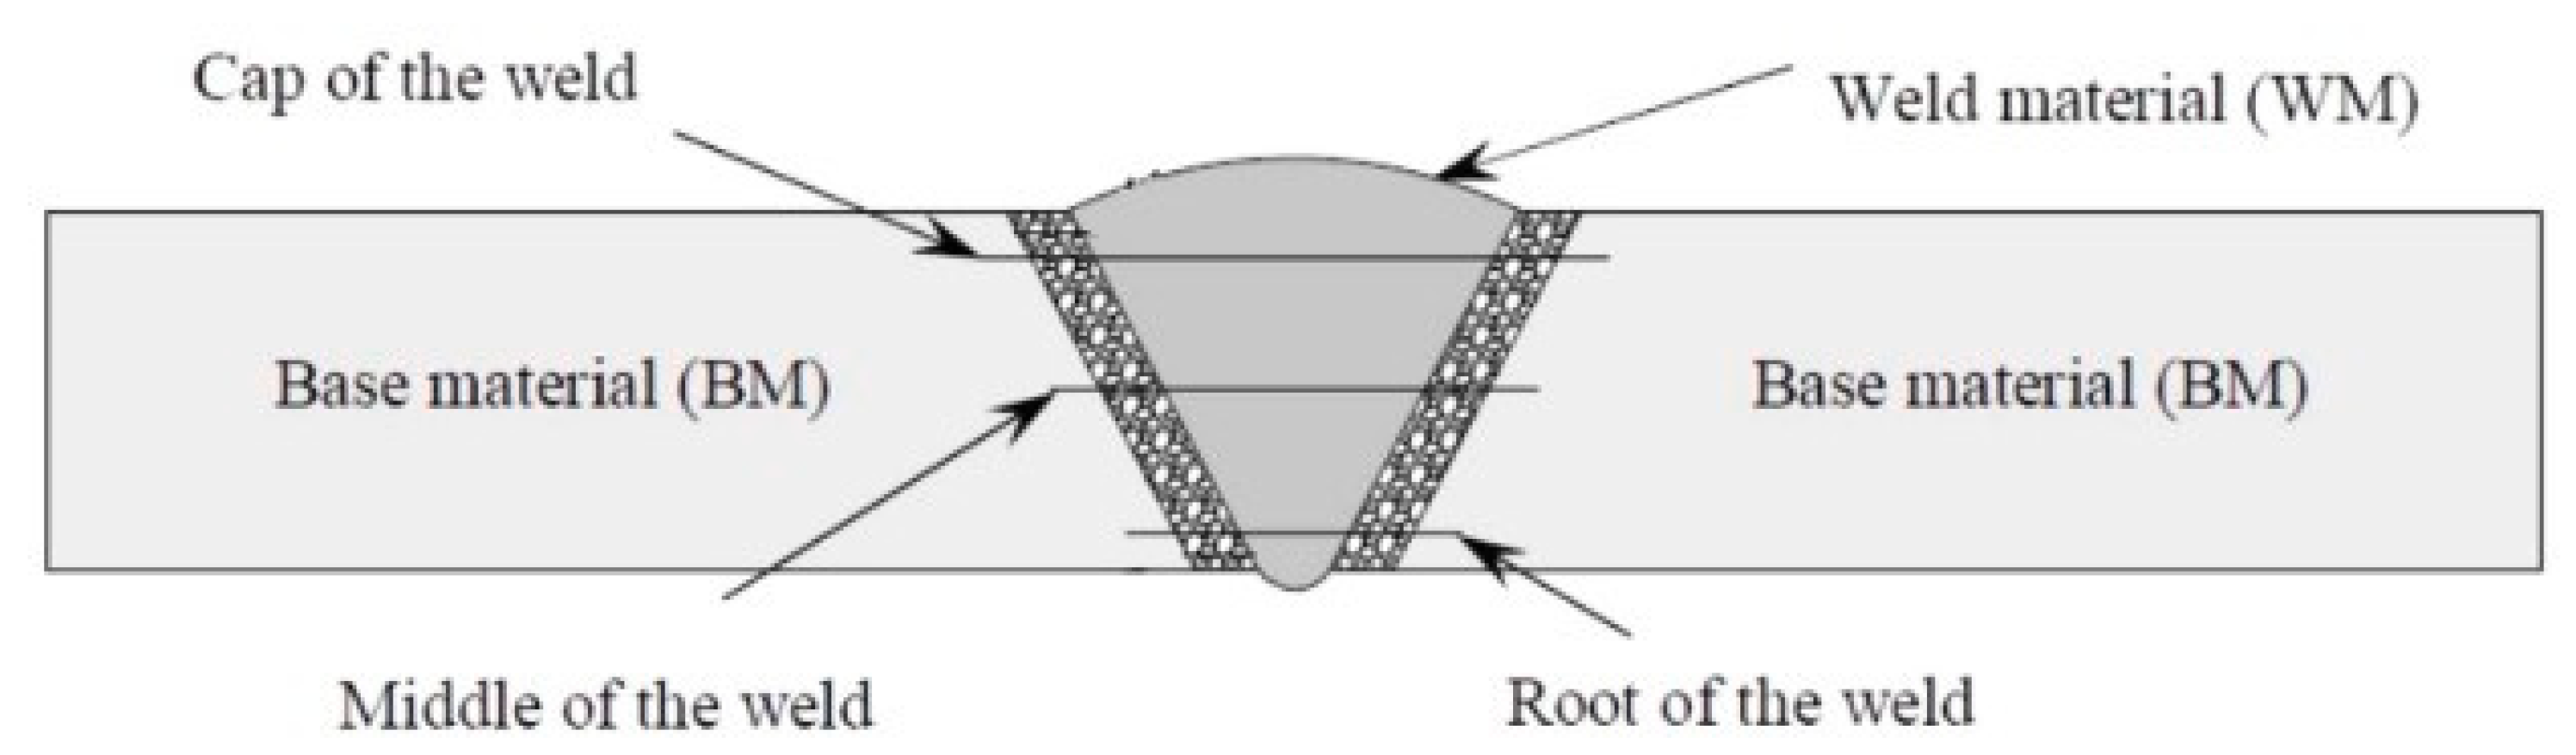
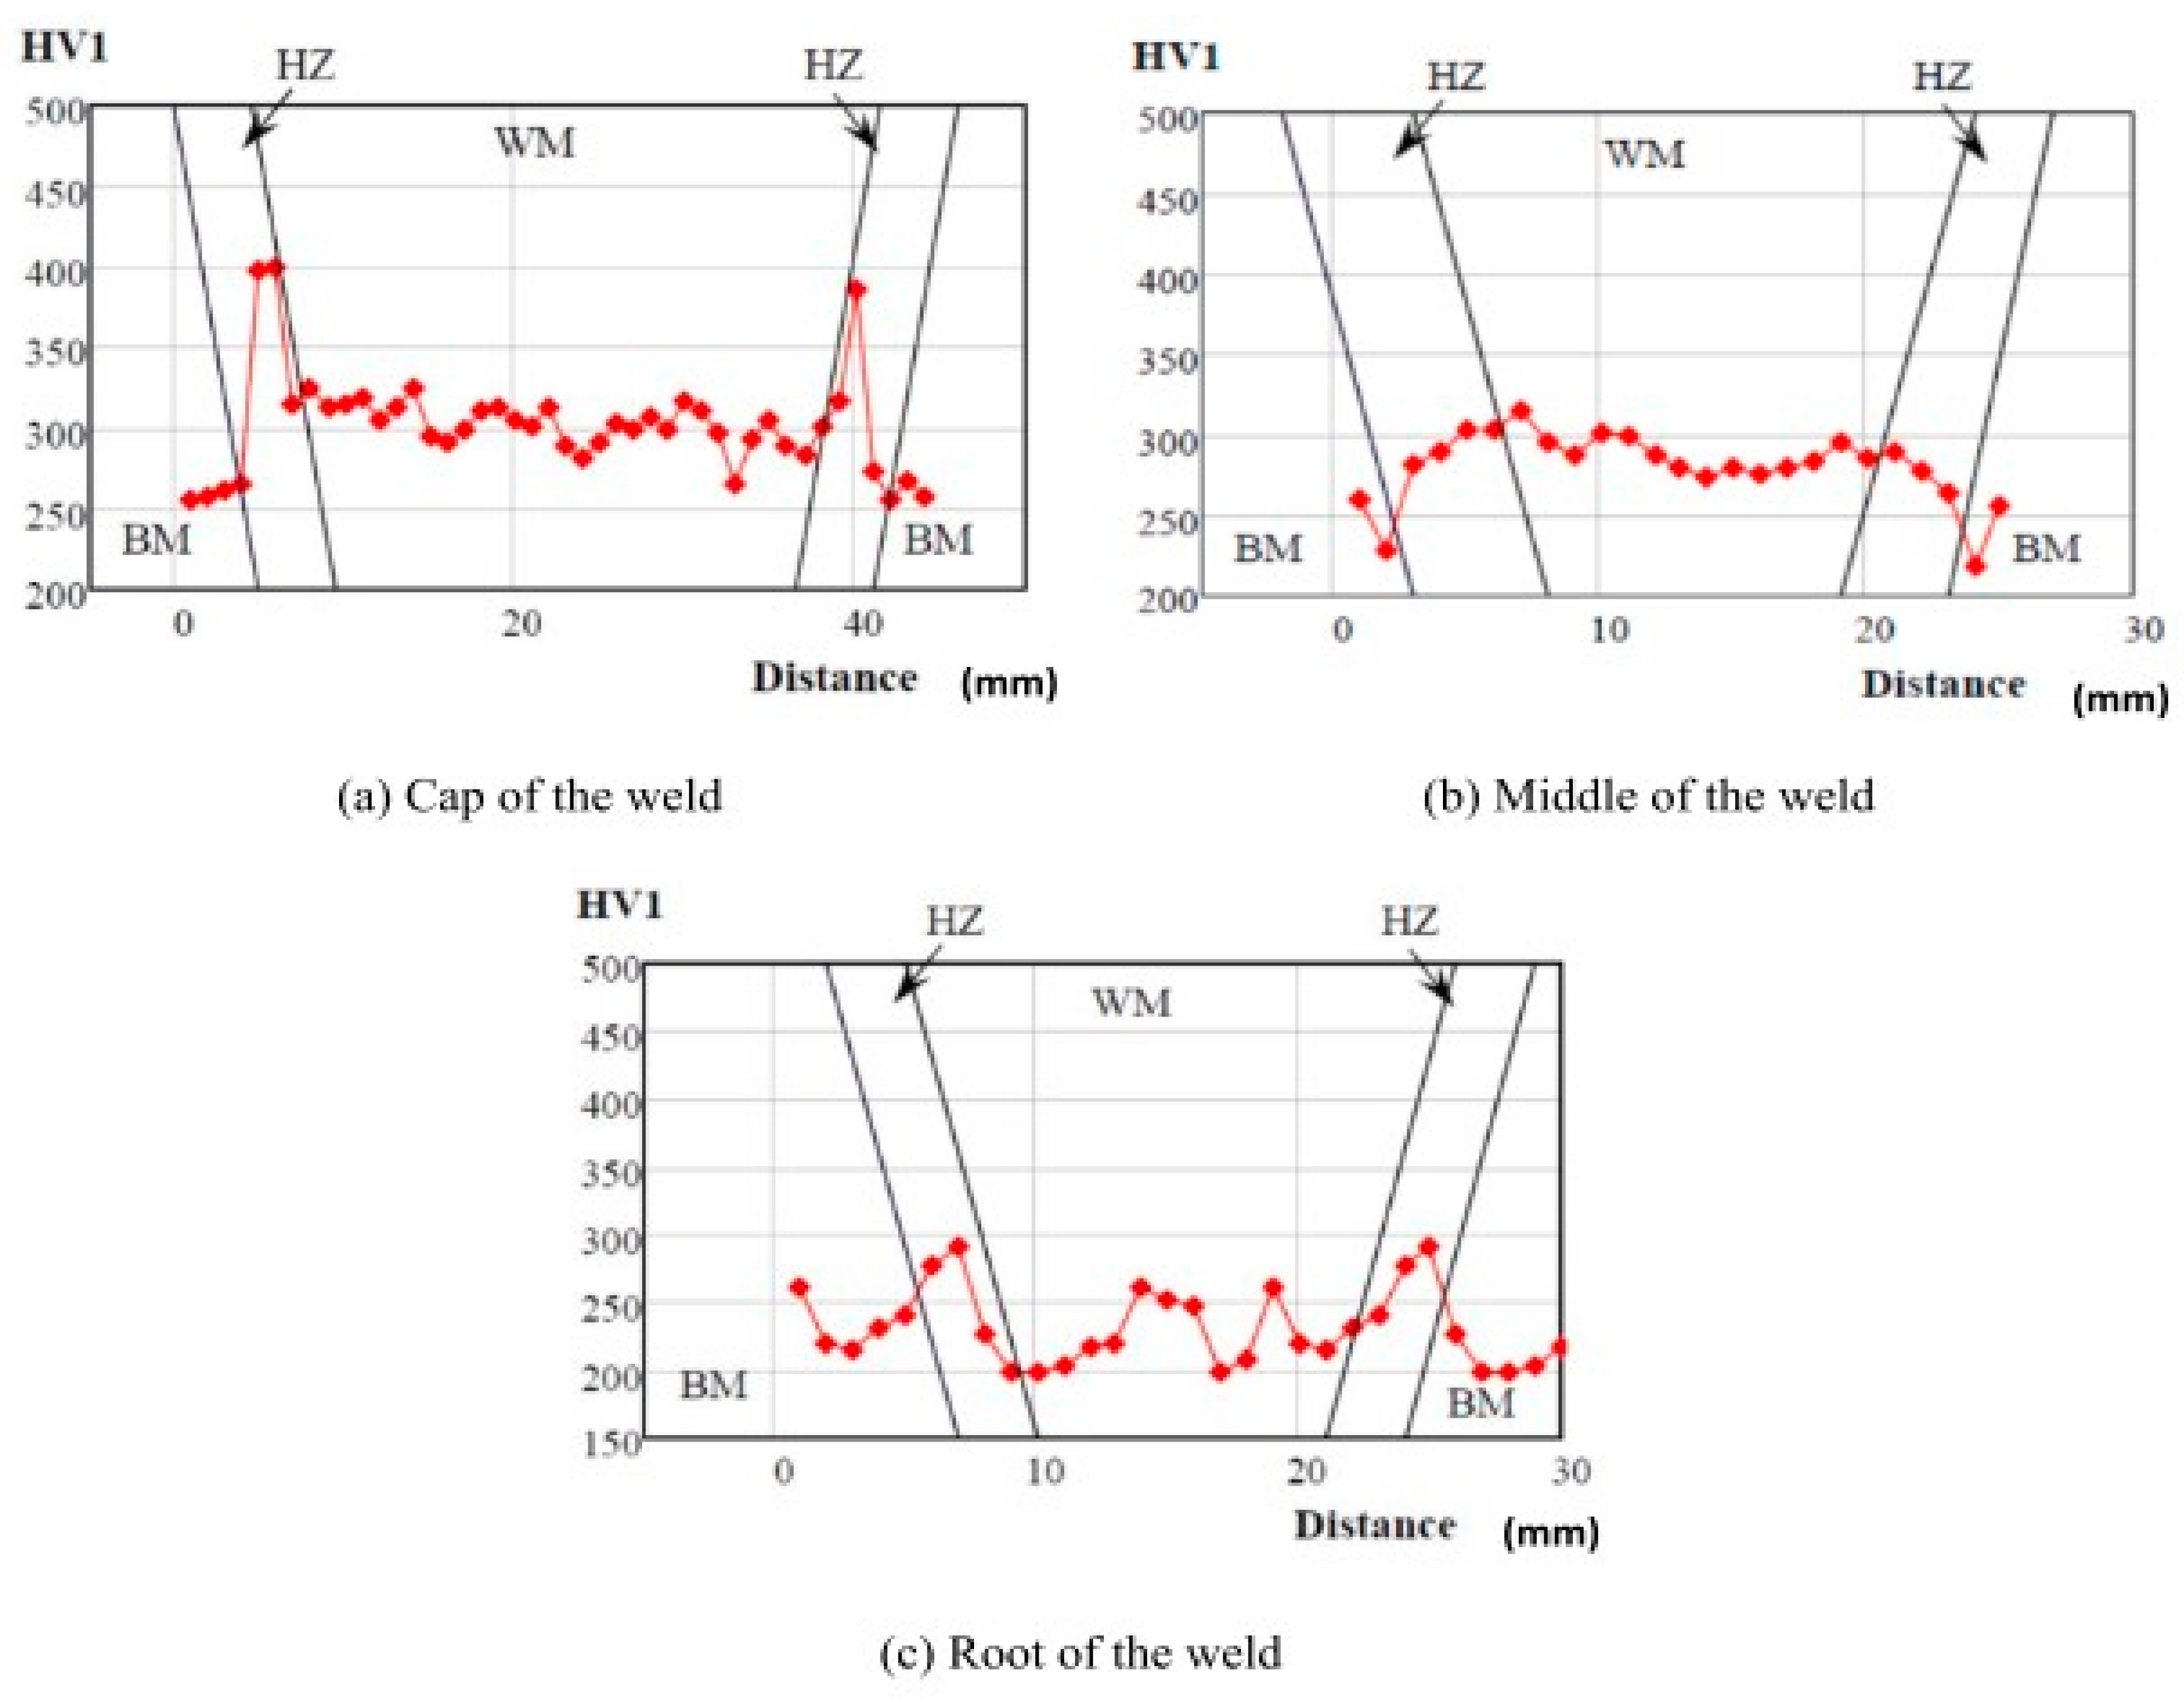
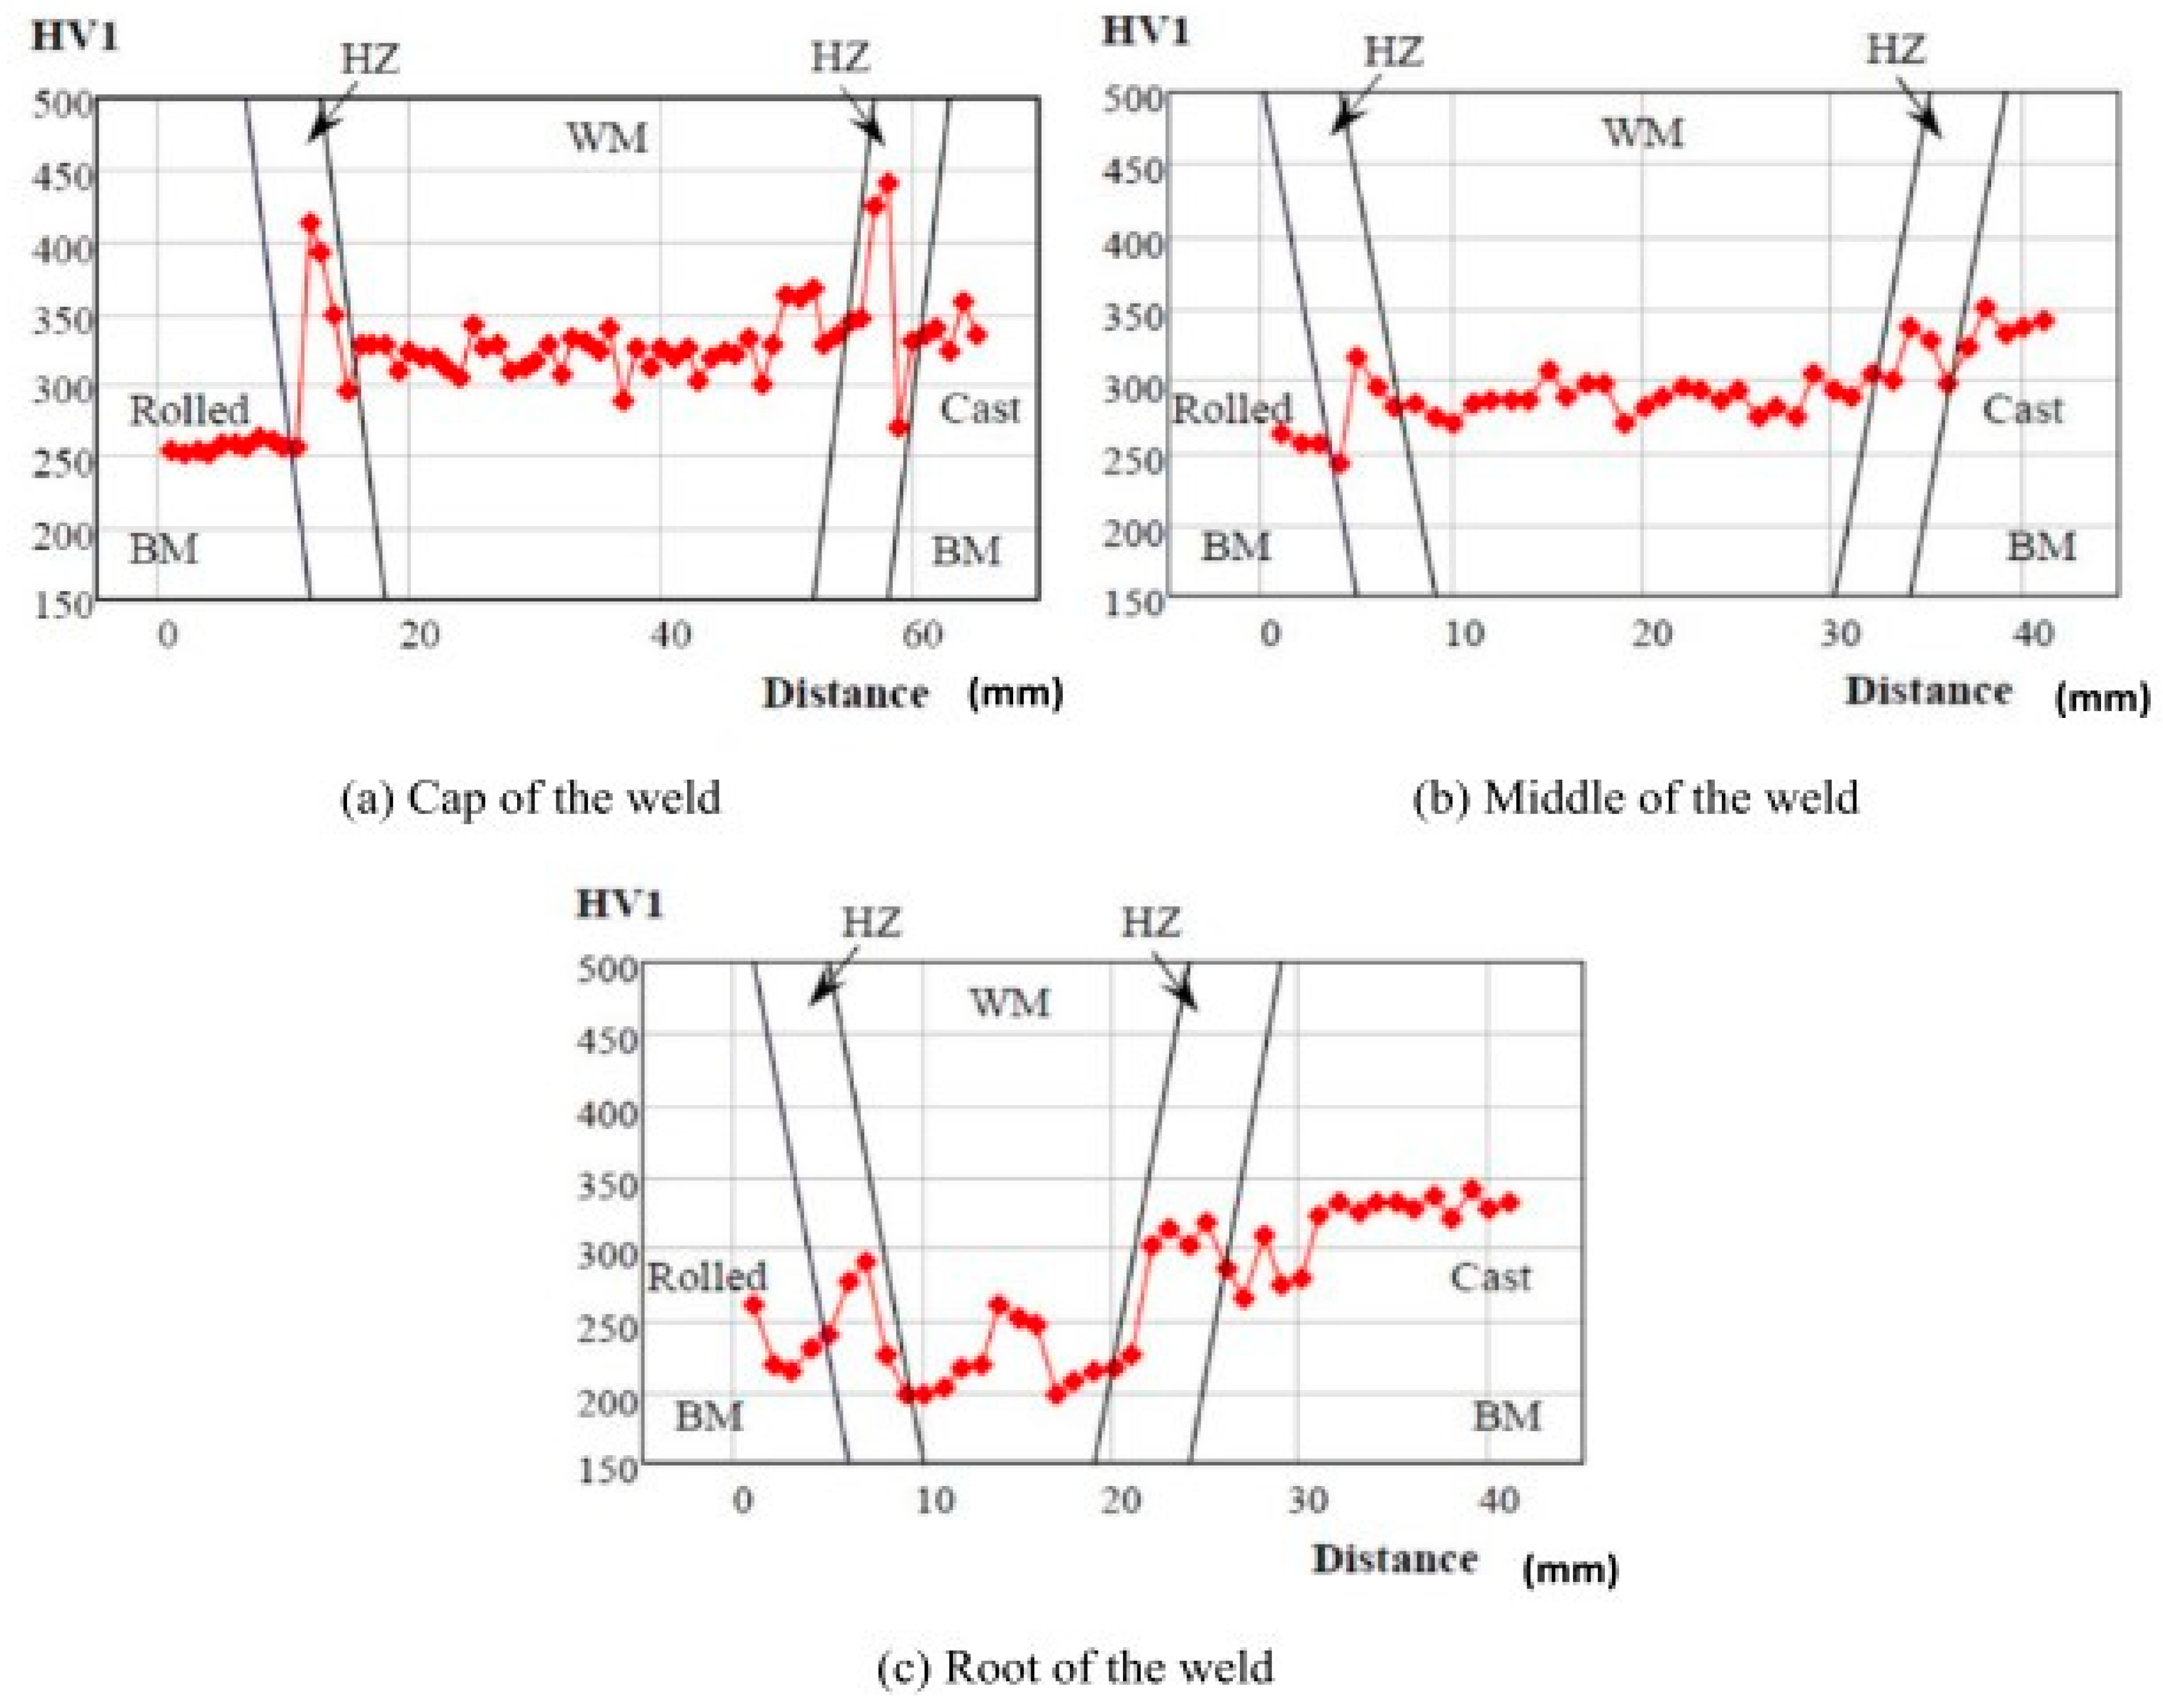
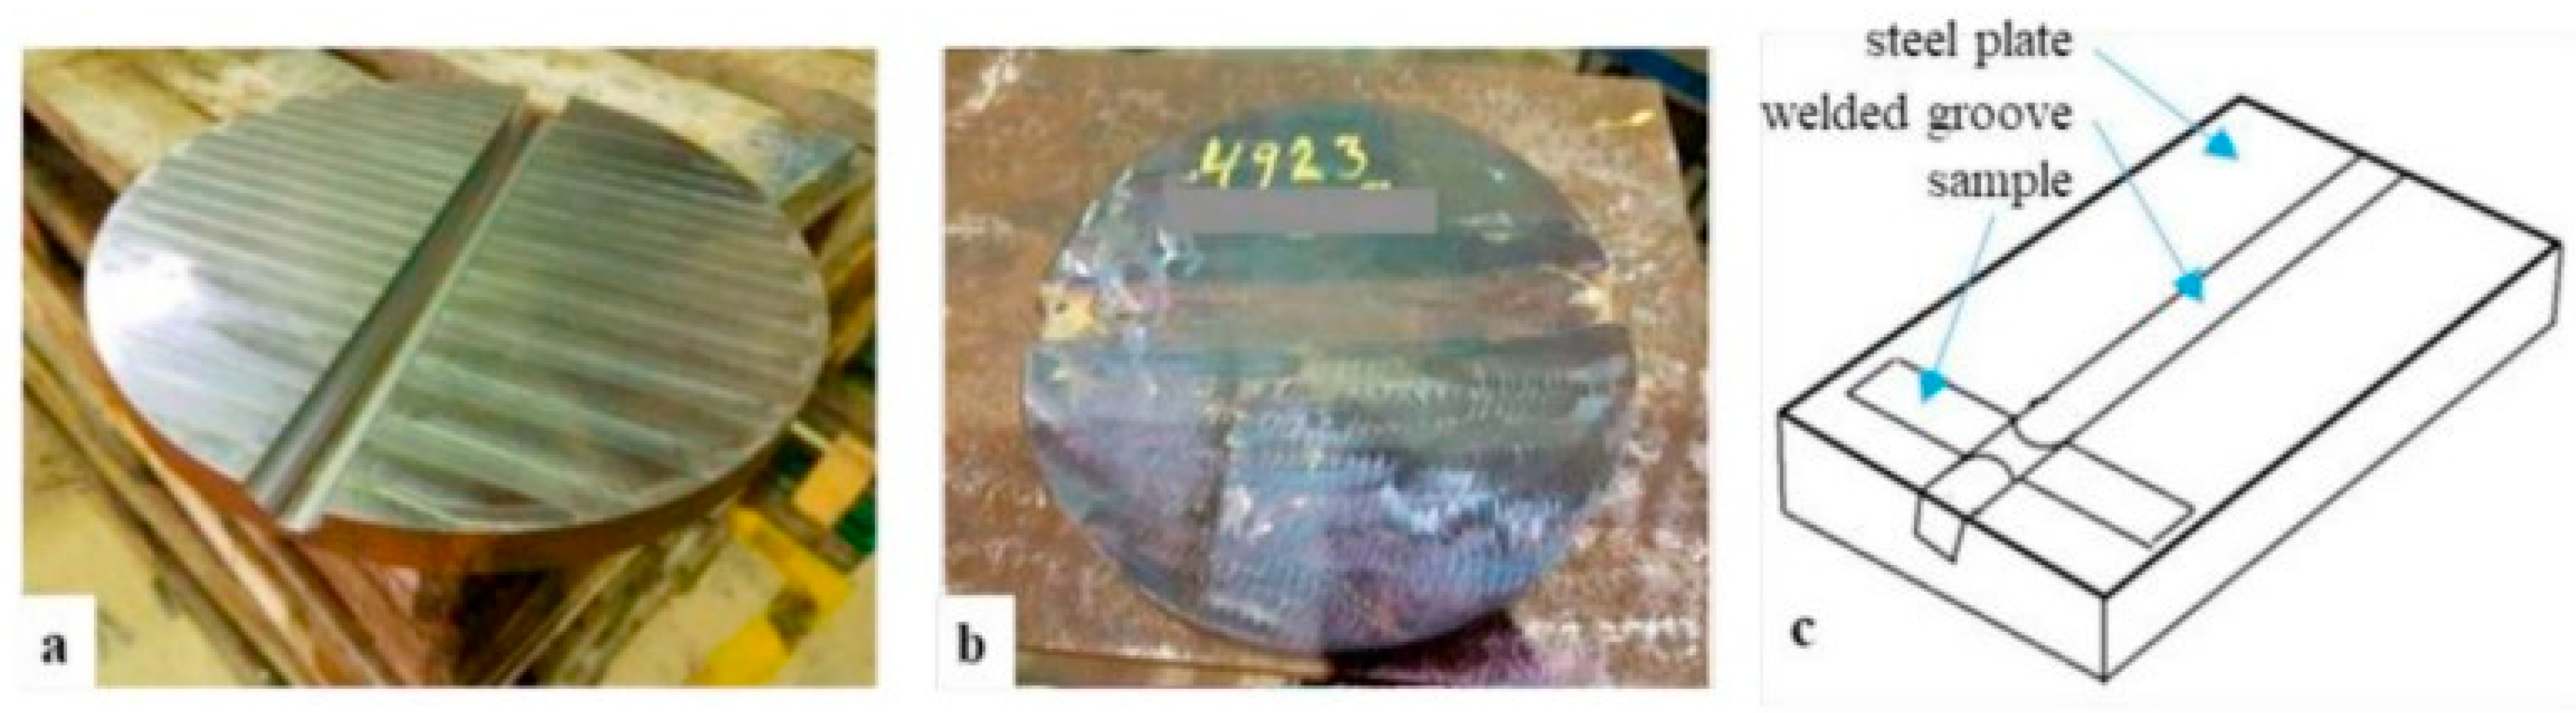

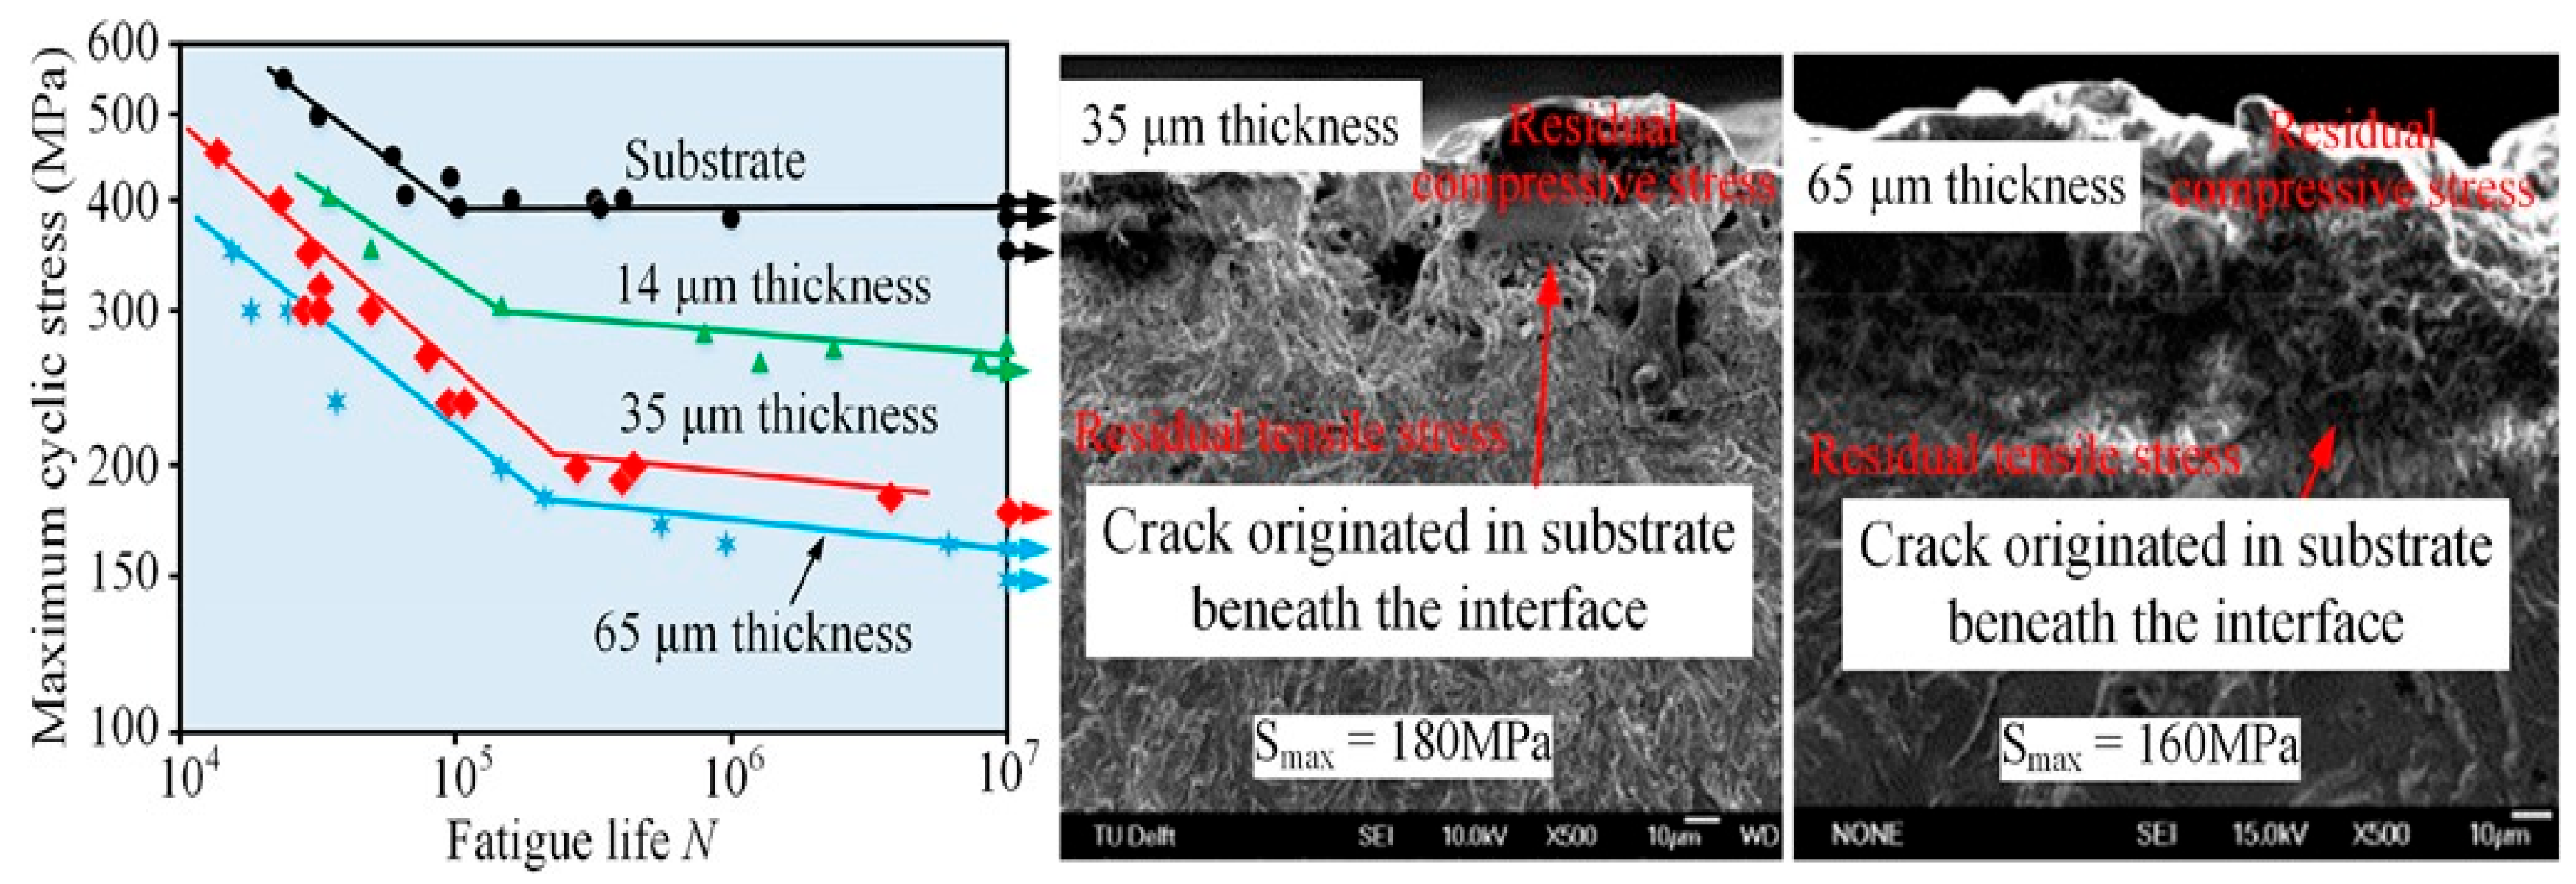
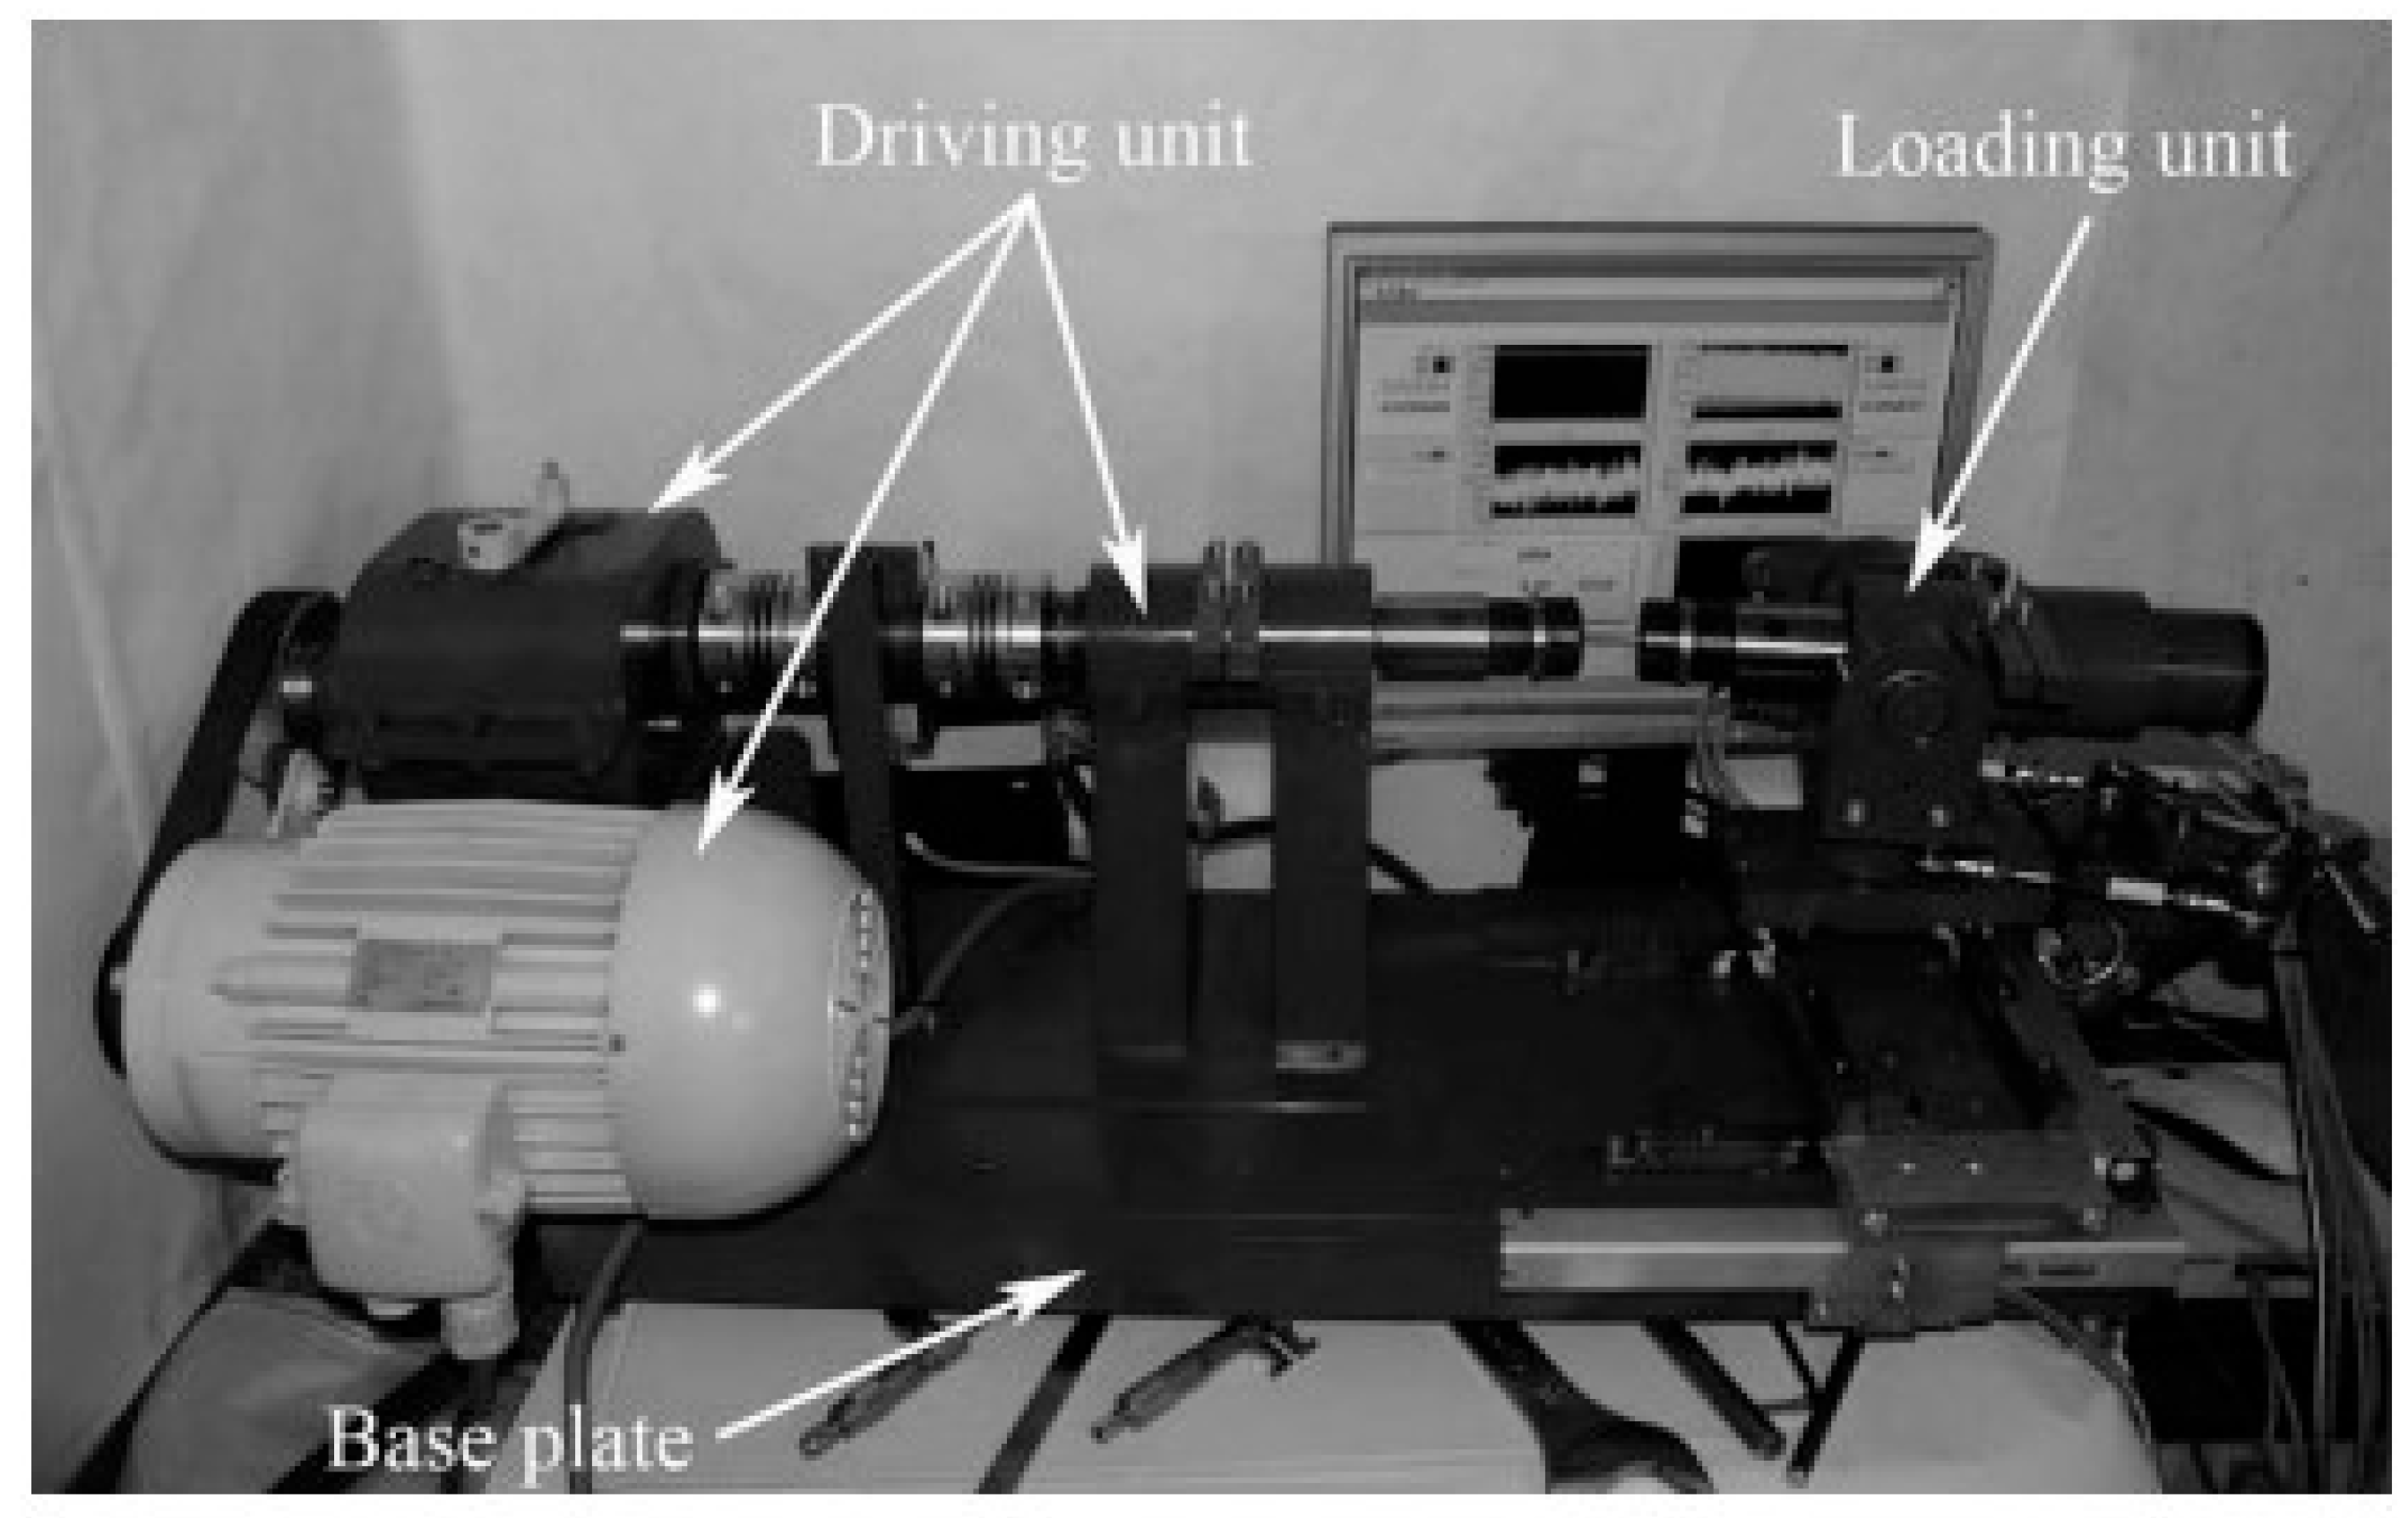
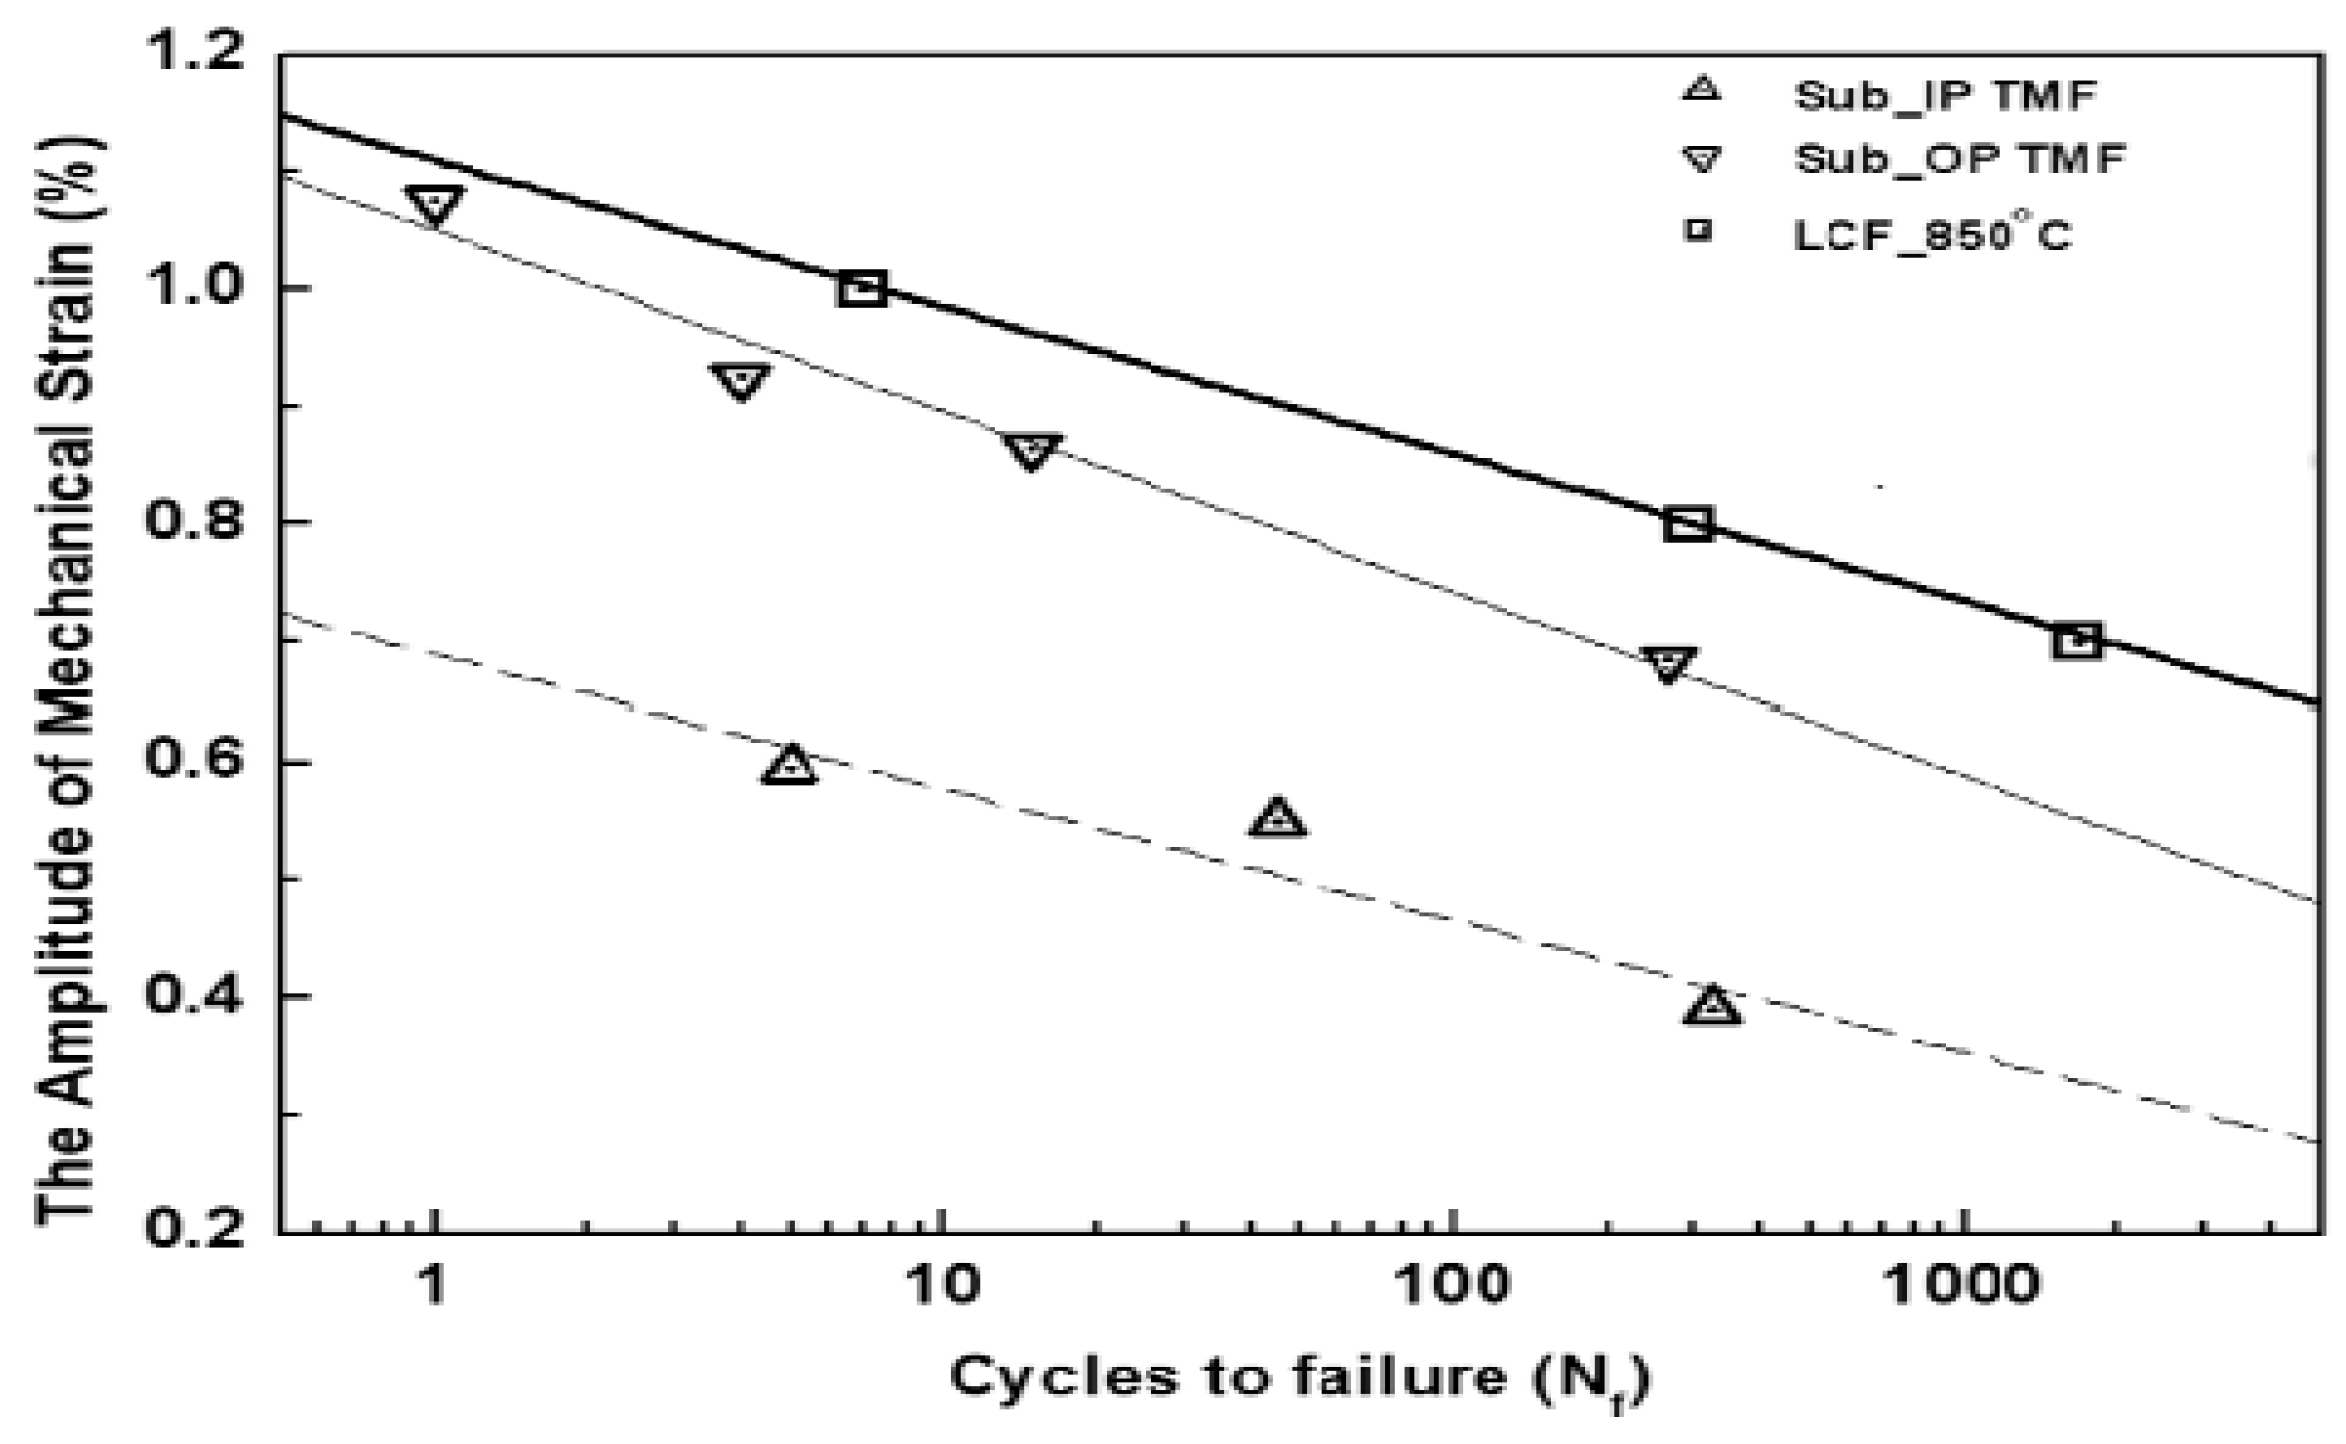
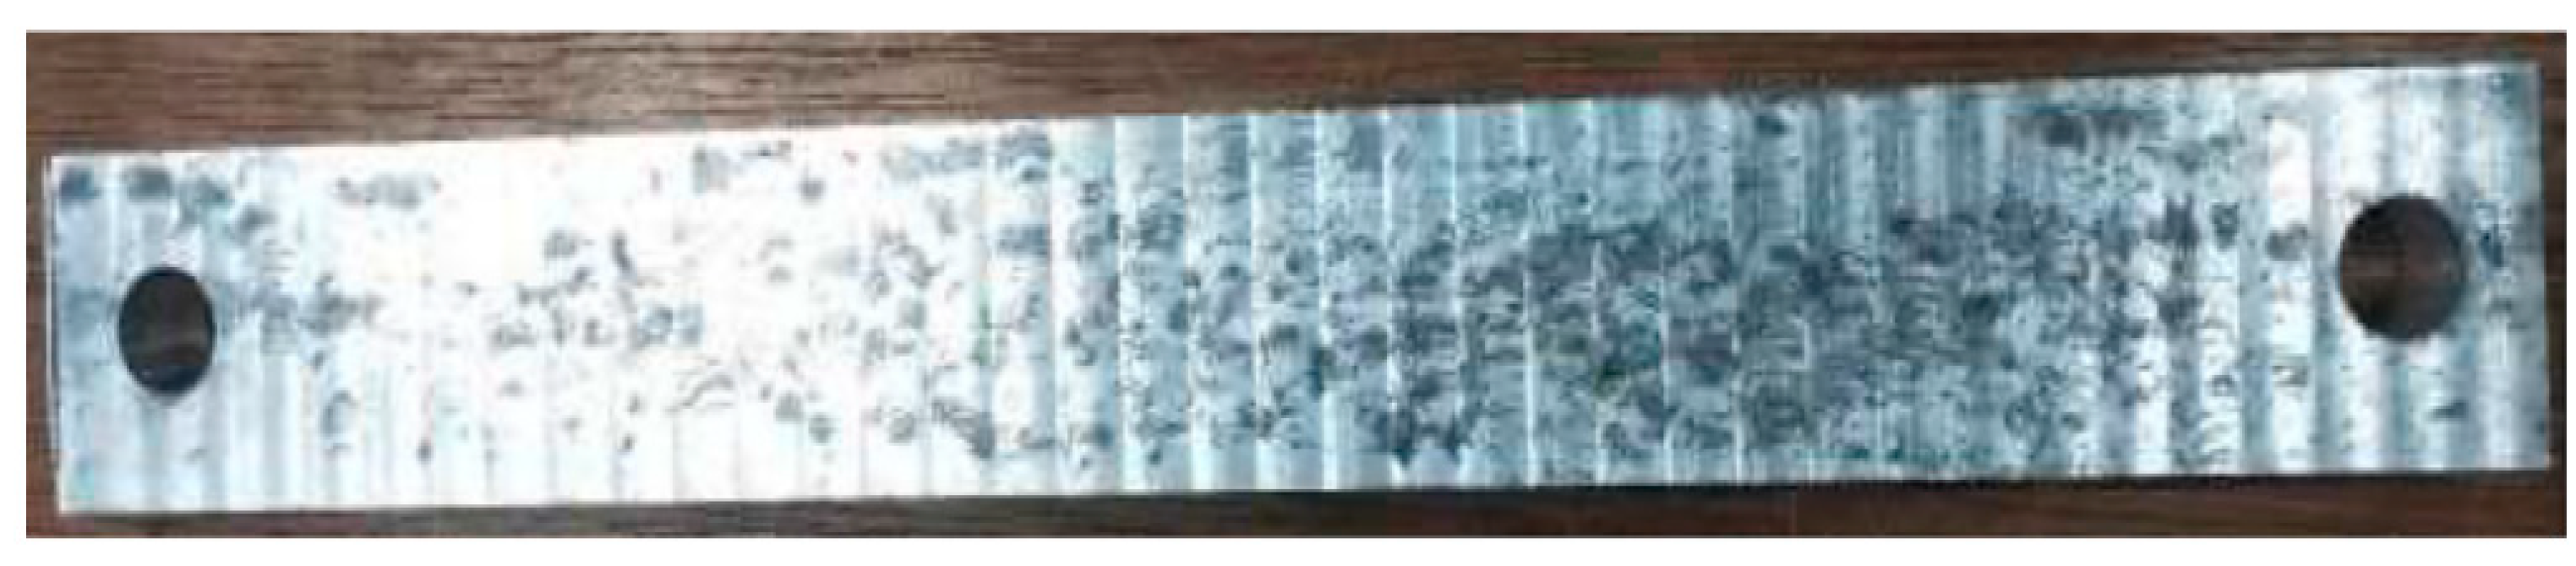
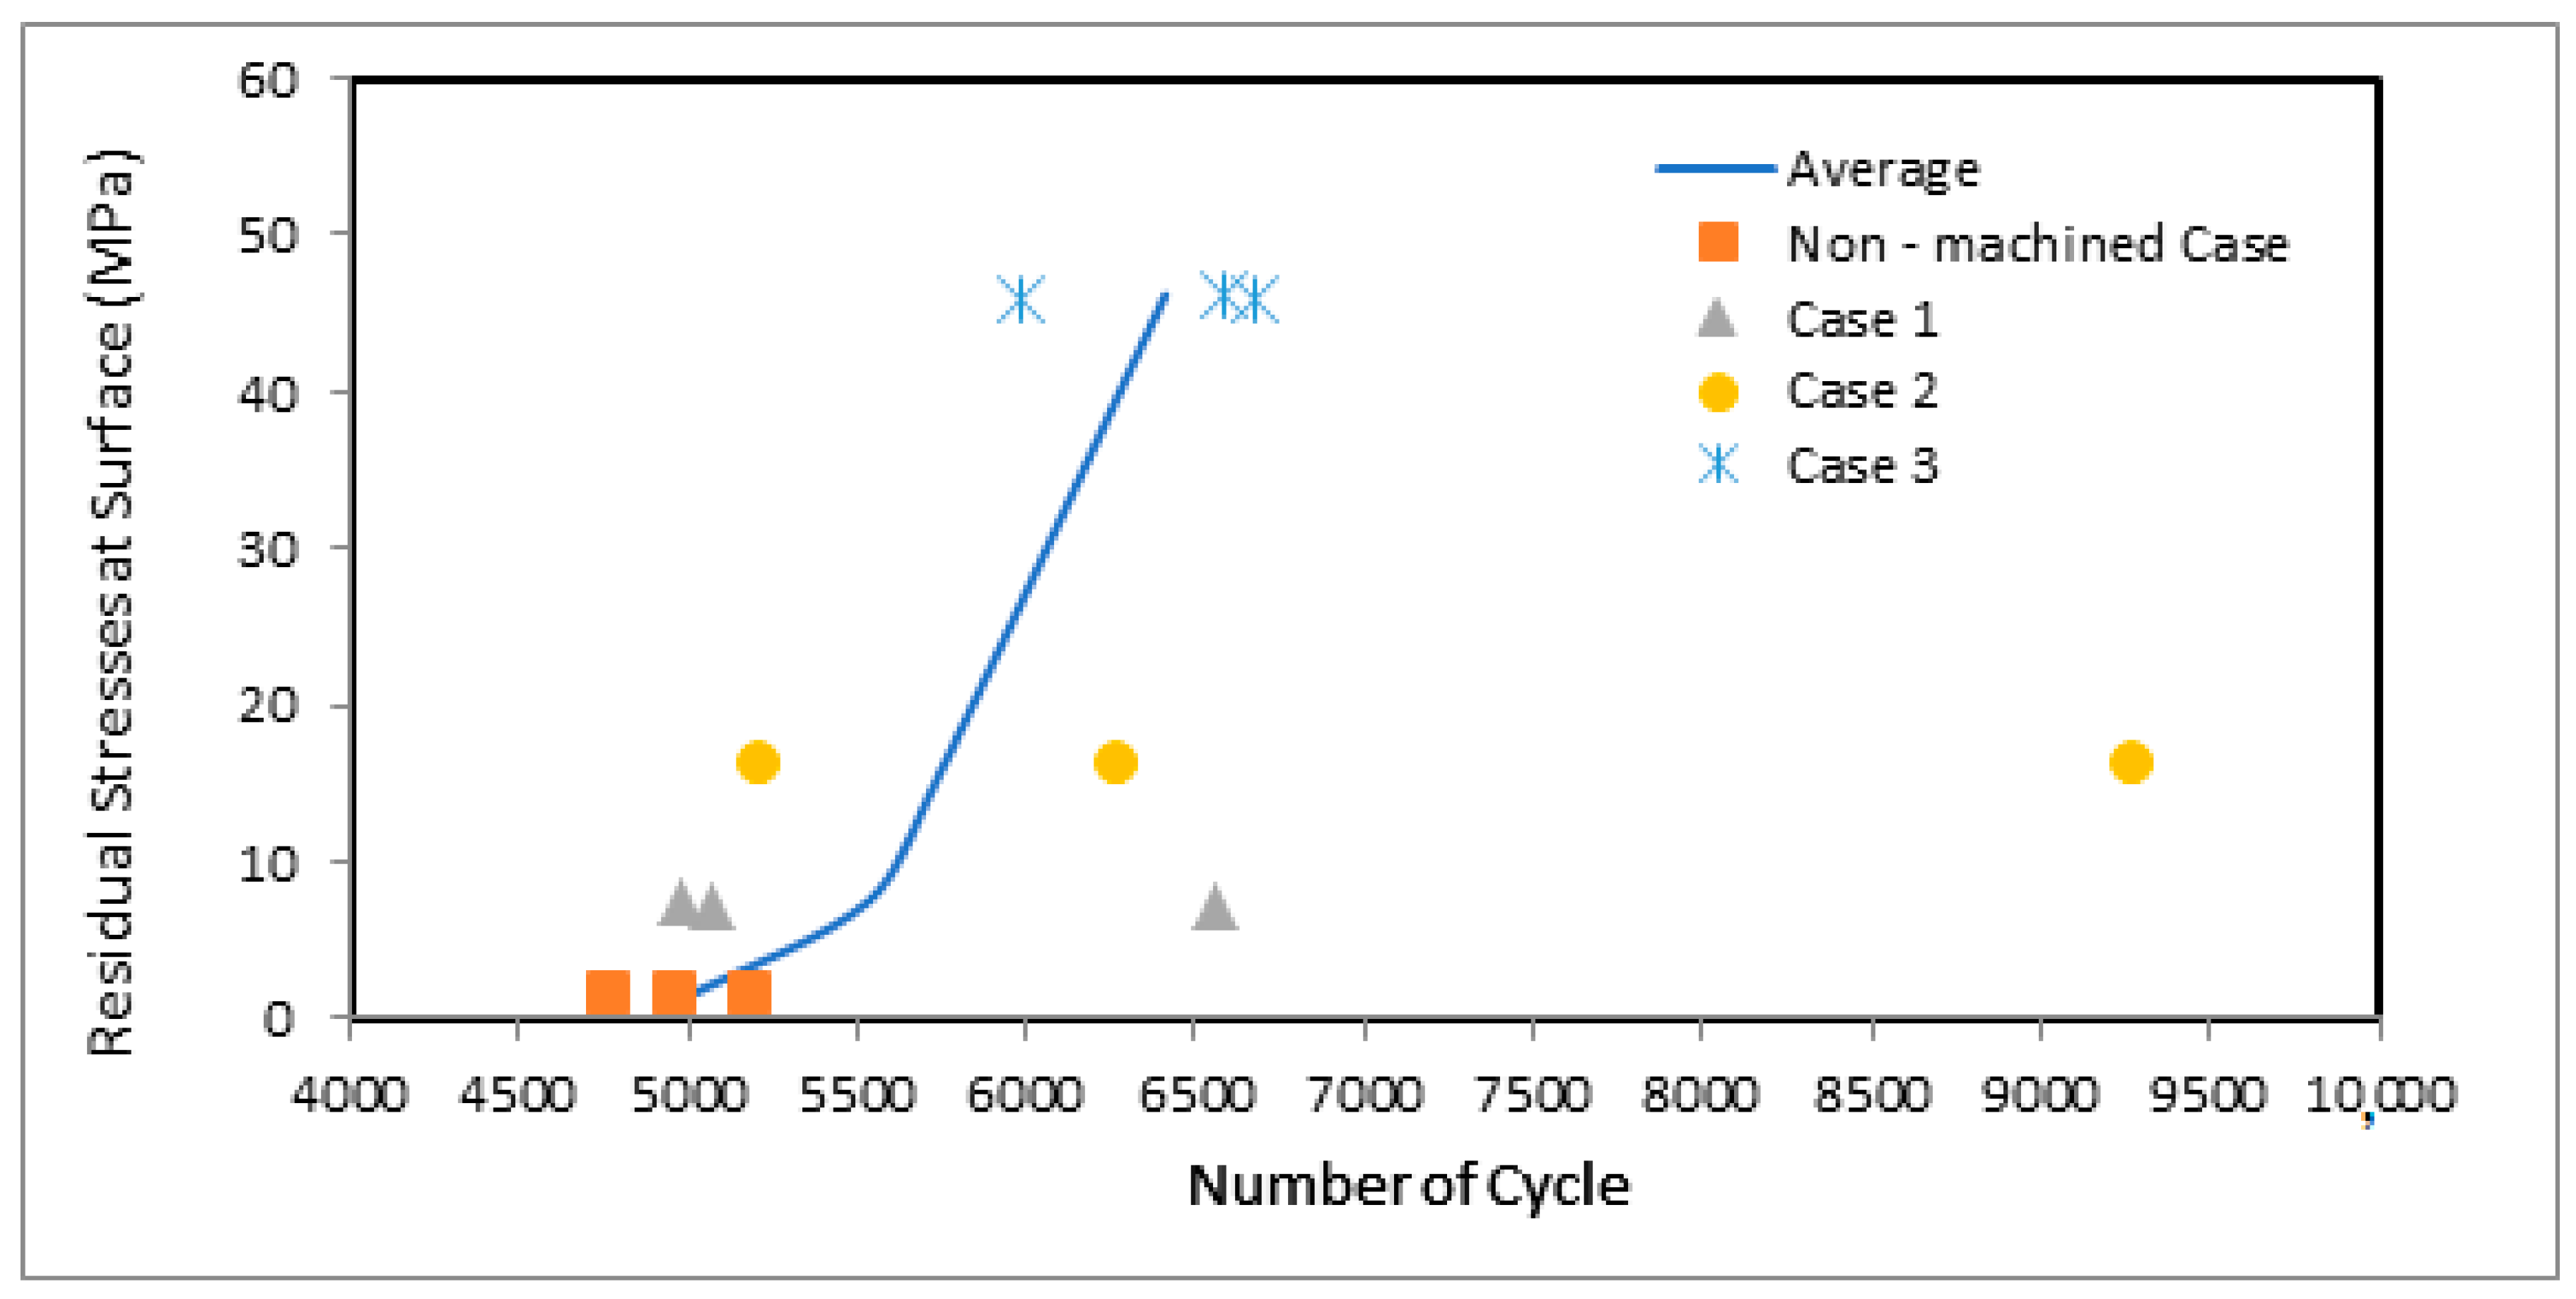
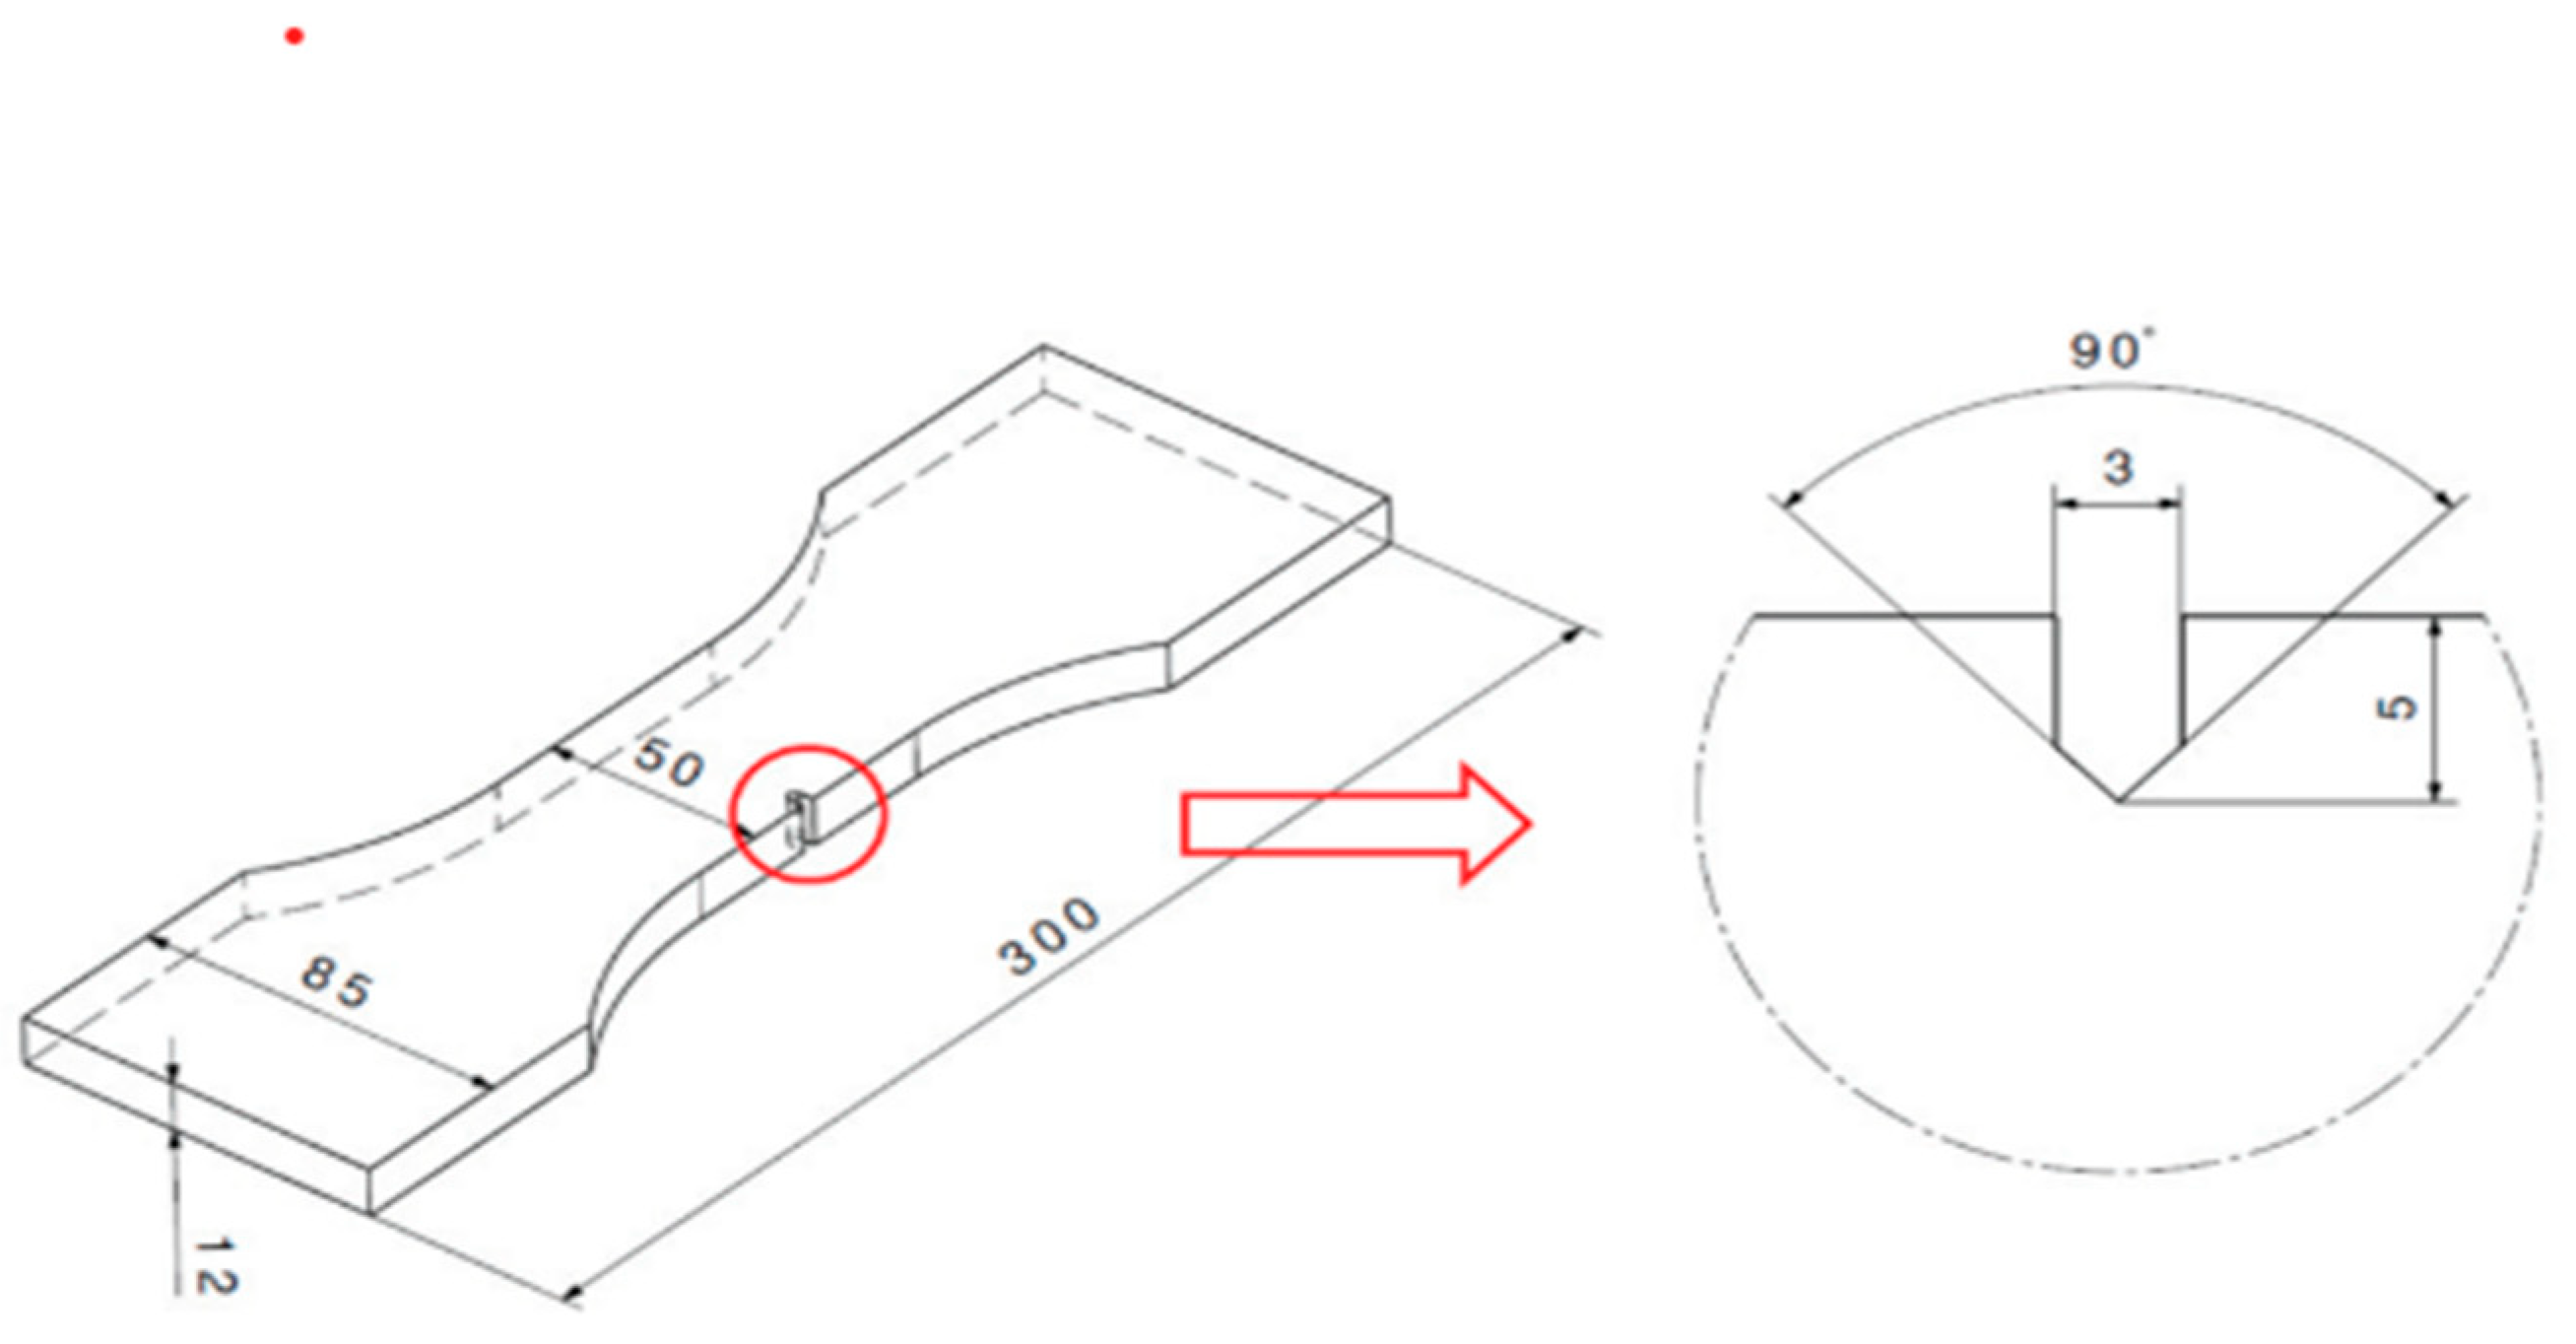
Disclaimer/Publisher’s Note: The statements, opinions and data contained in all publications are solely those of the individual author(s) and contributor(s) and not of MDPI and/or the editor(s). MDPI and/or the editor(s) disclaim responsibility for any injury to people or property resulting from any ideas, methods, instructions or products referred to in the content. |
© 2024 by the authors. Licensee MDPI, Basel, Switzerland. This article is an open access article distributed under the terms and conditions of the Creative Commons Attribution (CC BY) license (https://creativecommons.org/licenses/by/4.0/).