Abstract
This article illustrates the development of SolarFertigation (SF), an IoT (Internet of Things) solution for precision agriculture. Contrary to similar systems on the market, SolarFertigation can monitor and optimize fertigation autonomously, based on the analysis of data collected through the cloud. The system is made up of two main components: the central unit, which enables the precise deployment and distribution of water and fertilizers in different areas of the agricultural field, and the sensor node, which oversees collecting environmental and soil data. This article delves into the evolution of the system, focusing on structural and architectural changes to develop an infrastructure suitable for implementing a predictive model based on artificial intelligence and big data. Aspects concerning both the sensor node, such as energy management, accuracy of solar radiation readings, and qualitative soil moisture measurements, as well as implementations to the hydraulic system and the control and monitoring system of the central unit, are explored. This article provides an overview of the results obtained from solar radiation and soil moisture measurements. In addition, the results of an experimental campaign, in which 300 salad plants were grown using the SolarFertigation system in a photovoltaic field, are presented. This study demonstrated the effectiveness and applicability of the system under real-world conditions and highlighted its potential in optimizing resources and increasing agricultural productivity, especially in agrivoltaic settings.
1. Introduction
The development of precision agriculture is based on the use of technologies that facilitate better management of agricultural production by optimizing available land resources. Thanks to the spread of the Internet of Things (IoT) [1], modern technologies can provide a solution to the needs of the agricultural sector: many low-cost, low-power sensors can be easily deployed on agricultural land to collect accurate climate and soil data. Furthermore, the collected data can be processed in various ways by the IoT on-cloud facility [2,3,4,5,6]. The innovative system referred to in this paper is an energy self-sufficient fertigation system, powered by photovoltaic energy and integrated with a low-cost wireless sensor network (WSN) to directly monitor crops in the field (the patent and preliminary studies are reported in [7,8,9]). The system was developed considering specific aspects related to the characteristics of the WSN used in smart fertigation applications that have been extensively studied [10,11,12,13,14].
The research focuses on the evolution and optimization of the “SolarFertigation” system. The main innovation of the patented system is a new way of managing fertilizer and water quantities (as demonstrated in [9]), enabling the optimization of consumption and reduction of environmental impact. For instance, it addresses the reduction in groundwater pollution caused by excessive fertilizer use, as recent studies [15] have highlighted the harmful effects of excessive fertilizer use on land, public health, and the environment. The indiscriminate and excessive application of fertilizers has been linked to issues such as soil salinization, heavy metal accumulation, water eutrophication, nitrate accumulation, and air pollution through nitrogen- and sulfur-containing gases, contributing to the greenhouse effect.
The smart component of the system resides in its cloud. In its final version, this cloud will have to execute data analysis using artificial intelligence algorithms to identify a predictive model related to soil evapotranspiration values and other agronomic parameters. Based on these analyses, the system will be able to generate automatic fertigation events, optimizing the use of water resources and ensuring optimal crop growth. In addition, the project includes the integration of weather forecasts that will enable the system to anticipate and adapt to adverse or favorable weather conditions. This additional functionality will enable even more precise management of water resources and improved crop resilience, including concerning new requirements due to climate change. An additional innovative element of SolarFertigation is its development in the agrivoltaic sector. By integrating photovoltaic technologies, the system can harness solar energy to power its operations, reducing energy costs and making the system usable in contexts where it is not possible to connect to the traditional power grid. There are already several studies and prototypes similar to the Solar Fertigation system, as described in related studies. For example, a design of an automatic irrigation system that can also control the quantity of the three main macronutrients, nitrogen (N), phosphorus (P), and potassium (K), is described in [16]. An example of a web application related to this system is presented in [17], where it describes how data from the SQLite database are used in the web-GUI to visualize parameters, such as water level status, flow condition of valves and pipes, and the overall operation of the automated fertigation system. Differently from traditional fertigation systems, which require constant human intervention and often rely on rough estimates, SolarFertigation offers a very high level of accuracy and efficiency due to a large number of sensors and different types of measured quantities. The goal of the project is broad: it aims to create a complex system designed to be continuously enriched in functionality, as well as improve accuracy and reliability. The ultimate goal is to develop a system that can be a valuable aid to the agricultural sector in general, but especially one that can be effectively integrated into the new type of systems, known as agrivoltaic systems. This system should be able to manage both photovoltaic and agricultural production through a single cloud software infrastructure.
Section 2 describes in detail the various components of SolarFertigation, focusing on the technologies, while Section 3 shows methodologies used in the refinement process of the system, which enabled it to become more reliable, robust, and scalable. Section 4 shows the results of research related to both the design and prototyping of some parts of the system and a test under real conditions carried out in Italy in a photovoltaic field. Through a detailed analysis of the basic architecture, a new infrastructure (described in Section 5) has been implemented, consisting of smart devices connected to an Amazon Web Services (AWS)-based cloud [18]. This innovation allows better management of an agricultural field. Indeed, through an online dashboard, the farmer can control the parameters of his field and implement fertilization actions and events, improving the management of time and resources to be dedicated to agricultural activity. In addition, the cloud architecture implemented in the system opens up the possibility of integrating advanced levels of artificial intelligence for the planning and management of fertilization events, which would make it possible to optimize the use of resources by reducing their consumption. It would be possible to build a decision support system for farmers and continuously monitor its performance to ensure accuracy over time using the collected data to train machine learning models and data analytics, such as regression (linear and ridge/lasso), decision trees (random forest and gradient boosting), neural networks (artificial neural network—ANN, and long short-term memory—LSTM), and support vector regression, training and optimizing them through techniques such as Grid Search and evaluating their performance with appropriate metrics, such as root mean square error (RMSE). A second distinguishing feature of the new SolarFertigation is the possibility of integrating the system in different and innovative contexts, such as with agrivoltaic systems, or in the field of supply chain traceability thanks to the implementation of a blockchain, which guarantees accurate and transparent management of agricultural products. Indeed, as reported in [19], blockchain has rapidly become an important technology in many applications of the precision agriculture discipline. The need to develop intelligent P2P systems capable of verifying, securing, monitoring, and analyzing agricultural data is leading to thoughts of building blockchain-based IoT systems in precision agriculture. The primary objective of the research was to design, implement, and at least partially, validate this new architecture, with a focus on future integration with artificial intelligence. The research focused on the development and validation of an innovative sensor node model, supported by a temporary cloud architecture for data collection and validation, using indirect calibration methods based on the databases provided by meteo.it and data extracted through the online Photovoltaic Geographical Information System (PV GIS) software [20]. This study represents significant progress toward the realization of a more intelligent and sustainable system specifically designed for precision agriculture.
2. SolarFertigation
The SF system (Figure 1) represents an IoT-based solution for advanced precision agriculture. The system is designed for precise fertigation management and monitoring of an agricultural field. The new version of the system consists of two distinct components: the central unit and the sensor node. The system, as designed, allows the field to be divided into different zones to manage it in a customized and specific way based on the feedback from the zone itself and the needs of the culture.
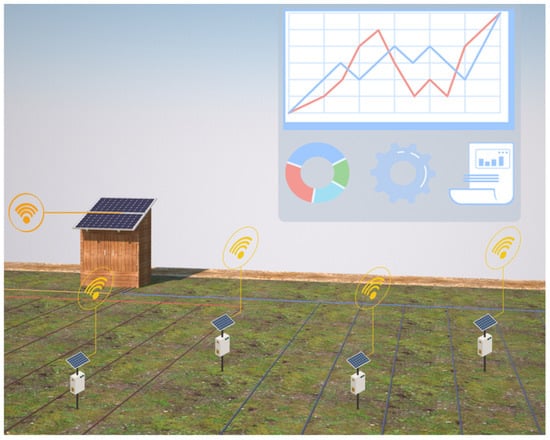
Figure 1.
SolarFertigation system.
The central unit is responsible for the distribution of the water and fertilizer solution within one or more agricultural areas of interest (zones). The central unit and the sensor node are based on the STM-32WL55JC [21] microcontroller, which uses LoRaWan (Low-Power Wide-Area Network) [22] technology to establish communication with a gateway. The sensor node is equipped with a series of sensors that enable comprehensive and customizable monitoring of environmental and soil parameters. These parameters include solar irradiation, soil moisture levels, ambient temperature, humidity, and wind speed. In addition, the sampling rate can be set. With a similar operation as the central unit, the sensor node communicates data to the gateway via a communication standard, based on the interpretation of bytes. The LoRaWan gateway acts as a single access point to the Internet, acting as a bridge between all devices deployed in the field and the AWS cloud infrastructure. Data transmitted over LoRaWan frequencies, after being interpreted by the gateway, are processed, stored, and analyzed within the AWS cloud environment, enabling it to provide agricultural operators with valuable information to optimize fertigation practices and resource utilization.
2.1. Central Unit
The central unit is housed inside a wooden shed of varying sizes. Solar panels are installed on the roof of the shed. Inside the shed, the inverter and batteries (Figure 2h) power the main switchboard (Figure 2f) of the system. This panel distributes power to the various components and the microcontroller located inside the system logic board (Figure 2g). The microcontroller is connected to four types of devices: an RTC (Real-Time Clock) for synchronization, an LCD (Liquid Crystal Display) for local display of machine status, I2C (Inter-Integrated Circuit) expanders for activating relay boards, and control devices, such as level, pressure (Figure 2b), and flow sensors. In the hydraulic circuit of the system, a centrifugal electric pump (Figure 2d) draws water from a cistern or well. At this point, the water undergoes a filtering process (Figure 2c). A fraction of this flow is directed to a mixing tank by the action of a solenoid valve. At this point in the logic flow, fertilizers are added: for those in granular form, a rotating auger is provided (Figure 2i), while for liquid fertilizers, they can be inserted through peristaltic pumps (Figure 2l). With the SF system, specific fertilizer can be accurately dosed and fed into the tank (Figure 2e), where specially designed nozzles act to amalgamate the solution. Once the solution is ready, the electro-valve related to the area of interest opens, and the fertilizer mixture is integrated into the main flow, exploiting the venturi effect (Figure 2a). This process continues until the tank reaches its minimum level, which activates the level sensors that signal the microcontroller to begin preparing a new solution. During all these stages, thanks to the presence of pressure and flow sensors, each parameter can be monitored, sending information to the cloud through feedback. These data can be very important for remote control of the system or detailed analysis.
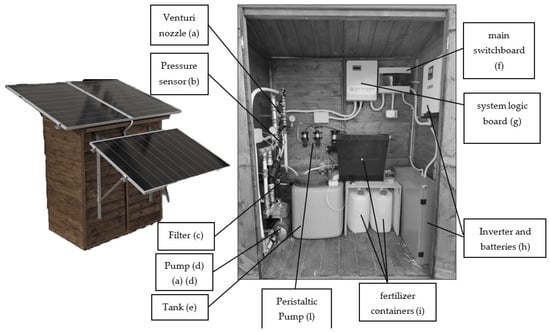
Figure 2.
SolarFertigation system.
2.2. Central Unit Firmware
Before writing the new firmware, an analysis of the cycle was carried out by evaluating its criticality and essentiality. The central unit is the part of the system that enables fertigation. Therefore, the microcontroller’s task is to activate the various components, carrying out the fertigation cycle according to the instructions received from the cloud. Additionally, it is responsible for monitoring various hydraulic and electrical parameters and informing the cloud about the machine’s status. The microcontroller communicates with a gateway through long-range radio frequencies (868 MHz). The gateway acts as a bridge to the cloud, exchanging messages with the AWS IoT Core [23] broker based on the MQTT (Message Queuing Telemetry Transport) protocol [24]. The system is also able to record more than one event and trigger them at the appropriate time by providing feedback to the user/cloud.
In the system cycle, the level of the mixing tank has been identified as a critical element. In fact, in the way the prototype is constructed, if the level drops below the venturi tube pickup point, the system will continue to operate by drawing in air and feeding it into the distribution cycle, causing malfunctions in the irrigation system. To address this issue, the firmware has been developed to read both a low-level sensor and a high-level sensor. When the level drops below a predetermined threshold, the program interrupts the irrigation process and initiates tank refilling. Once the high level is reached, irrigation resumes. The approach to the final firmware has been characterized by maximum adaptability and scalability. It was chosen not to physically bind the gateway to the central unit so that the operation of the application does not depend on the presence of the central unit itself.
Considering the characteristics of the machine, its functionality, and the variety among models, it was decided to create standard but remotely reconfigurable firmware (“over the air”).
The approach to the internal firmware was marked by replicating industrial design logic in the microcontroller. Analyzing the firmware from a higher level, it was observed that it uses the FreeRTOS (Real-Time Operating System) [25] operating system, which enables task management with preemption and priority. In the specific case of SolarFertigation firmware, two tasks were used. The higher priority task was used for communication in LoRaWan with the gateway (TX-RX-RX class A) [26].
The lower priority task was used for checking event scheduling and possible activation of the logic outputs to execute the fertigation event. At the structural logic level, some more important functions at the operation/robustness level were placed outside the tasks themselves with interruptions to assign them higher priority on execution. Even at a lower level, we could identify industrial programming techniques. In this specific case, the batch technique [27] for PLC (Programmable Logic Controller) was revisited, which allowed the state of action of the machine to be uniquely identified and schematized/translatable through flowcharts (Figure 3).
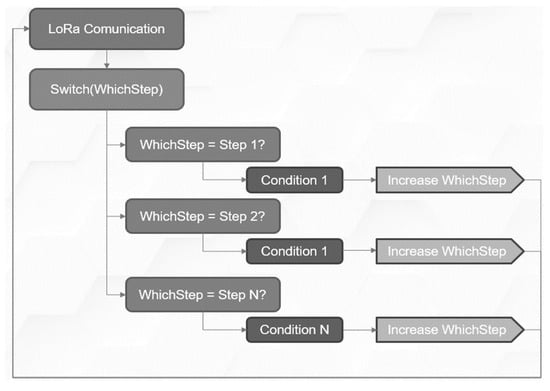
Figure 3.
Firmware logic.
A great potential demonstrated by the firmware is that a single program can manage all combinations of fertilizers and work zones; in fact, each fertigation event has a unique identifier, a configuration number, a machine configuration number, and information on which fertilizers to use (quantity) and zones to serve. Controls were later added to manage and monitor the execution of a cycle to allow greater control over how many resources were saved and management of mechanical stresses due to hydraulics. The machine was designed to work in remote areas and be able to act independently of a constant internet presence. To do so, it can store a certain number of fertigation events by being able to manage their temporal proximity and possible reboots. As the construction of the machine is based on Industry 4.0 and IoT, the machine can provide feedback on alarms, functional warnings, and information about its operation. Other internal functions built into the new firmware include RTC setting, remote reconfiguration and reassignment of relays, and the ability to equip the machine with an LCD screen for improved management by the end-user.
2.3. Sensor Node
The new node model features a structure made of galvanized T-shaped steel profiles with an adjustable axis, allowing for the optimal installation orientation of the photovoltaic panel. Each sensor node can accommodate up to eight analog sensors and various I2C sensors, depending on the specific requirements. As shown in Figure 4, the first sensor node prototypes were equipped with:
- Three capacitive soil moisture sensors,
- One light sensor,
- One ambient temperature and humidity sensor,
- One module for monitoring the battery charge status,
- One sensor for detecting the average and maximum wind speed.

Figure 4.
Sensor node layout.
2.4. Sensor Node Firmware and Software Cloud
The logic of the sensor unit is simpler than that of the central unit and does not require the use of the FreeRTOS operating system [25]. The firmware was designed to access various types of sensors (I2C, digital, and analog). Once these sensors are enabled through a straightforward initial configuration, time intervals can be set remotely. This interval dictates how often the unit sends feedback to the cloud with the collected information. Specifically, the transmitted data represent the average of six measurements taken within the chosen timeframe.
To evaluate the robustness of the sensor node and the accuracy of its measurements, a cloud architecture was implemented to collect and visualize data generated by prototypes of the system. Using the TTN (The Things Network) [28] server and the CloudFormation [29] service, a Thing was created on the IoT Core for each prototype. Then, through TTN, payload formatting was implemented, structuring the message in JSON (JavaScript Object Notation) format. Through IoT Core rules, the data were routed and stored in a Timestream database. For data visualization, a dashboard (Figure 5) was developed using an AWS-associated service, Grafana [30]. This system allowed specific tests to be conducted on the collected data, focusing on battery sizing and calibration of the lighting and soil moisture sensors, topics that will be discussed in the next section.
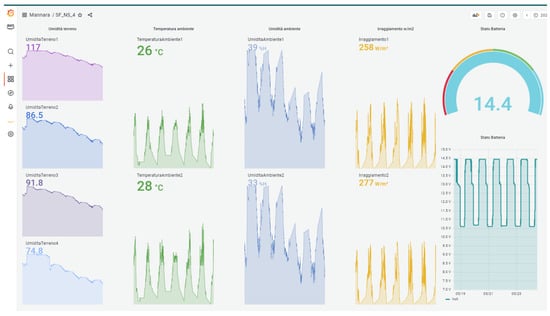
Figure 5.
Grafana-based dashboard.
3. System Development Sensor Node and Preliminary Calibration
3.1. Power Monitoring of Sensor Nodes
The sizing of the electrical system to ensure the autonomy of the sensor nodes was carried out using the same methods described for similar systems [31,32,33,34]. Starting from the electrical power consumption of 0.5 W and establishing an autonomy of 48 h, the system’s battery was sized accordingly. Additionally, each sensor node was equipped with a system based on a voltage divider (according to the wiring diagram shown in Figure 6).
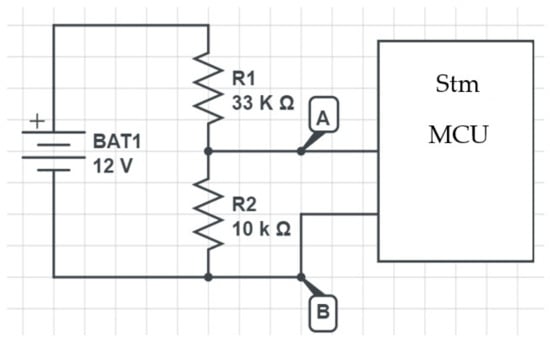
Figure 6.
Voltage divider electrical circuit.
To calculate the battery’s state of charge, the voltage divider rule was applied. Considering that the battery voltage is 12 V and the microcontroller can read up to 3.3 V, an analog reading of the voltage between nodes A and B of the illustrated circuit was taken.
The dimensioning of the resistors was determined by the maximum voltage between nodes A and B under conditions of maximum battery charge and the electric current flowing through the circuit, as this affects the system’s energy consumption, which must be minimized.
Equations (1) and (2) allow the voltage between nodes A and B (VAB) to be derived as a function of the input voltage (Vin) and the resistances (R1 and R2):
With .
3.2. Reading Solar Radiation Intensity
The selected sensor (VEML7700-TT) produced by Vishay Intertechnology (Shelton, CT, USA) allows the reading of illuminance (lux) up to about 100,000.00 lux. Measuring solar irradiance, compared to lighting, offers greater precision and relevance when it comes to assessing the energy available for photosynthesis and plant development. Indeed, thanks to this measurement, agronomists can plan the layout of crops according to the availability of sunlight, thereby optimizing the use of space and maximizing productivity, especially in contexts where there is not a complete availability of natural lighting, such as in agrivoltaic systems. For this reason, a method was sought for tracing the solar irradiance values from the illumination measurement of the VEML7700 sensor.
The methodology used and the calibration tests of the system are reported in the next paragraphs.
For calibration, reference was made to the equation in the data sheet, where Output data is the value read by the sensor (Equation (3)):
The system used a correction factor of 1.6, having set the ALS sensitivity equal to 1/8 and IT (integration time) equal to 50 ms. The sensor was configured so that its ALS sensitivity spectrum corresponded to the human eye’s photopic curve, v(λ). The comparison is shown in Figure 7.
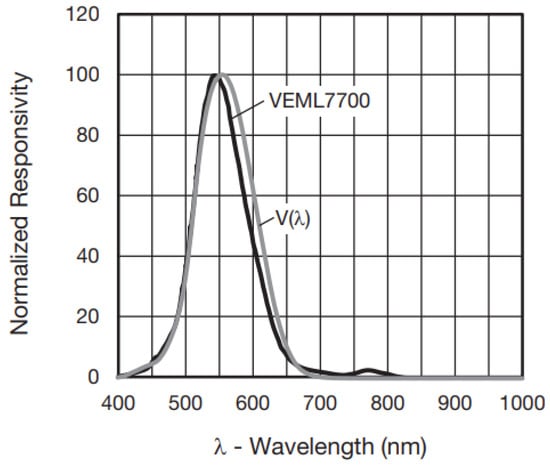
Figure 7.
ALS sensitivity spectrum vs. human eye’s photopic curve, v(λ).
Having obtained the correspondence with the photopic curve, V(λ), of the human eye and secondarily considering the solar spectrum, it can be assumed that 1 lux = 0.0079 W/m2, in agreement with what was stated in [35]. Therefore, the multiplication factor used to derive the solar radiation intensity from the VEML7700-TT reading is described in Equation (4):
3.3. Soil Moisture Measurement
Spatial and temporal assessment of soil moisture is particularly complex. There are various methodologies for measuring soil moisture, but few standardized systems for collecting and transmitting data from different stations over large areas, such as the International Soil Moisture Network (ISMN). The lack of accurate information limits the effectiveness of precision agriculture, which aims to optimize resources based on soil variability. Despite technological progress, the adoption of precision agriculture in Europe is lower than in other regions, such as America and Australia [36]. In the case of the system under consideration, capacitive probes were used, which are devices used to measure the water content of the soil by measuring the dielectric capacity of the soil itself. The principle of operation is based on the relationship between the dielectric capacitance of the soil and its water content.
As described in [36], this type of sensor is widely used in the field due to its ease of use and low cost. However, capacitive probe measurements are affected by systematic error due to the influence of salinity and soil texture. Initially, to determine the soil moisture value, it was considered that these sensors provide a value proportional to the water content in the soil, ranging from zero to the maximum resolution value of the analog reading (in this case, 12 bits). The calibration curve varied according to soil type and input method. The readings were initially scaled empirically in the range 0–100: where 0 indicated that the sensor was out of the soil, while 100 represented the saturated condition (sensor immersed in water). From a qualitative point of view, the results were satisfactory, as shown in Figure 8. The variation in soil moisture levels was highlighted in two different scenarios: two probes were placed in a pot (data plotted with blue and orange lines), while the other two probes were inserted directly into the soil (data plotted with yellow and green lines). Both the soil and the pot were very moist; subsequently, the probes were inserted to monitor moisture trends over time. Based on experimental observations, as expected, moisture in the pot decreased more rapidly. This phenomenon was due to several factors, including less soil in the pot, direct exposure to sunlight, and the absence of vegetation. The objective of this simple experiment was to explore two distinct scenarios simultaneously, highlighting the system’s ability to detect changes.
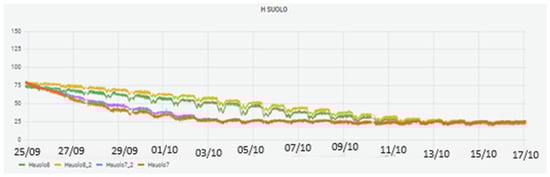
Figure 8.
Measurements derived from soil moisture sensors.
Regarding the quantitative measurement of soil water content, the results of the experiments highlighted and confirmed the challenges associated with the use of this specific type of sensor, in particular, the difficulty of placing the probes in the soil. However, one of the most interesting aspects, which relates to the IoT nature of the system, is that by increasing the number of probes and transmitting information on soil characteristics to the cloud, a large amount of data (big data) could be accumulated. This comprehensive collection of data would allow artificial intelligence to assess and interpret soil conditions without direct reference to the specific measurement of water content.
4. Research and Results
This section explores and presents the results of the research and tests conducted on the prototype of the sensor node. The system was developed to provide a tool for agronomists to study the agronomic parameters of an agri-field in the season from March to April 2024, as reported in Figure 9. The benefits arising from the use of an agrivoltaic system lie in the partial or total shading provided by photovoltaic modules. This reduces water evaporation from the soil and the soil temperature, thereby decreasing irrigation interventions and plant stress while increasing their productive efficiency. These outcomes appear even more compelling in a context where the water demand, intended for irrigation, will increase in areas characterized by desertification processes. The APV SF model (Agrivoltaics with SolarFertigation) combines all the elements of an agrivoltaic system with the characteristics of the SF system and further optimizes the water use efficiency, adjusting irrigation and fertigation interventions according to the shade cast by the modules on different portions of the field. To assess the robustness of the system and the distinctive parameters of agrivoltaic installations, a field trial was conducted. The experimental test involved installing a SolarFertigation system consisting of four sensor nodes and a central unit capable of managing two different irrigation lines, which branched into four field subzones, two located beneath the panels and two in the open field. The objective of the test was to evaluate the functionality of the SolarFertigation system and to use it to collect and compare agronomic data relating to environmental parameters, soil, productivity, and quality of three different crop types. Each type of cultivation was planted in two subzones, one between the panel rows and one in the open field. Since the subzones were irrigated by the same main line, they received the same amount of water and fertilizer, allowing for comparisons to assess the potential advantages and disadvantages of solar agricultural fields. The first crop cycle took place from March to May 2024 and involved the cultivation of lettuce in one area of the field. The remaining areas were left fallow to assess the differences between cultivated and non-cultivated zones, both in open fields and between the rows of photovoltaic strings.
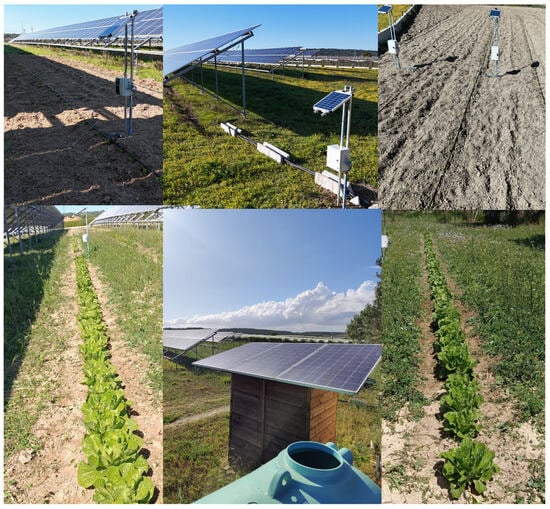
Figure 9.
Photographic report of the experimental test APV SF system.
4.1. Energy Assessments of the System
The follow-up data extrapolated from the dashboard experimentally confirmed the correct energy sizing. Analyzing the data collected from 23 to 25 February, these days were characterized by completely overcast skies and precipitation. This was confirmed by the consistently high levels of ambient humidity (shown in Figure 10) and low levels of solar irradiation (shown in Figure 11). Despite negligible PV production during these days, Figure 12 shows that the sensor nodes remained operational throughout the period.
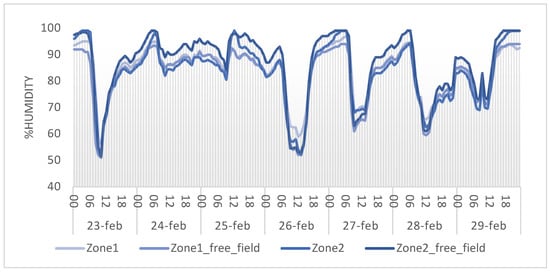
Figure 10.
Hourly average relative humidity for the period 23–29 February 2024.
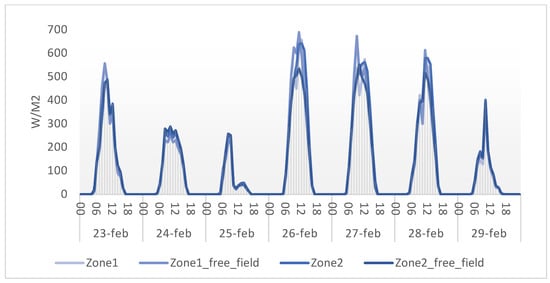
Figure 11.
Hourly average solar radiation for the period 23–29 February 2024.
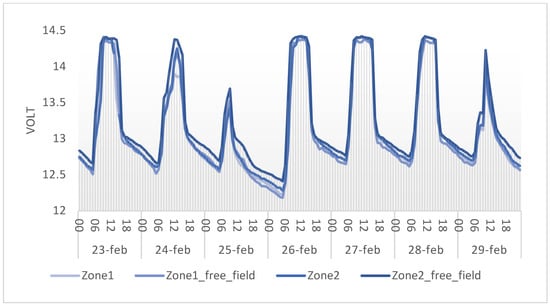
Figure 12.
Hourly average battery voltage for the period 23–29 February 2024.
4.2. Experimental Evaluations of the Accuracy of Solar Irradiance Measurement
After the development and installation of the prototype sensor node, a data collection phase was started in September 2023. The solar radiation values recorded since December were integrated to determine the monthly and daily average solar radiation. These integrated values were then compared with data extracted using PV GIS software [20]. The results of this comparison are presented in Table 1, which highlights the system’s reliability, although it is opportune to consider that PV GIS provides data from 2018 to 2020.

Table 1.
Monthly global horizontal irradiation, kWh/m2.
Further confirmation of the reliability of the solar radiation measurement emerged when comparing the daily global radiation. Specifically, Figure 13 shows a comparison between the graph derived from experimental data and the daily irradiance average for November, extracted from PV GIS.
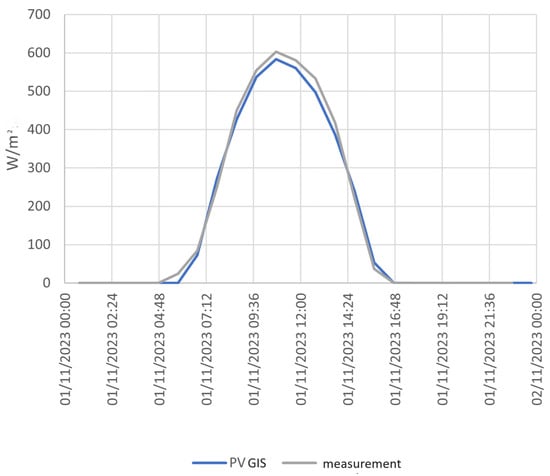
Figure 13.
Daily average irradiance comparison.
4.3. Experimental Evaluations of the Accuracy of Humidity Measurement
Figure 14 shows soil moisture sensor data collected during a more recent period (20–30 May 2024), while Figure 15 presents ambient moisture data collected during the same time. It is interesting to observe, comparing the two figures, that soil moisture reached the maximum value (100%) during the rainy events (20–21 and 28–29 May), which can be verified by the air moisture values reaching 100% (Figure 15). In the intermediate period between the two rainfall events (21–28 May), the values recorded by the soil moisture sensors decreased from the maximum value (about 100%) to lower and lower values, proportional to the residual water content in the soil. An additional element visible from Figure 14 is that slightly different trends were recorded among the probes during the stages of soil dewatering. For example, sensor 4 showed larger oscillations than sensor 3. Two factors can influence this phenomenon: the first is the depth of probe insertion, while the second is the nature of the soil in the vicinity of the probe. However, since the probes were meticulously placed at the same depth, the cause of these differences can be attributed to variations in the composition of the surrounding soil. Further tests on the soil moisture measurement are in the process of being conducted to generate a methodology for proper data input and interpretation.
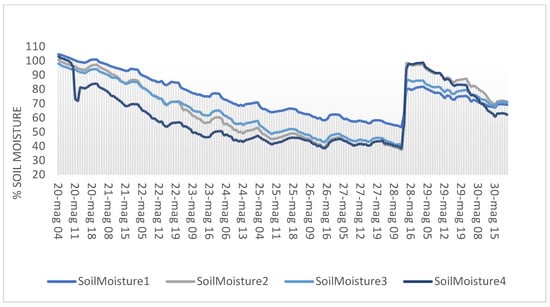
Figure 14.
Daily average soil moisture from the SF monitoring system from 20 to 30 May 2024.
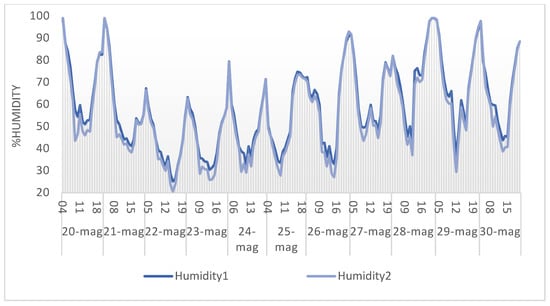
Figure 15.
Daily average environment humidity from the SF monitoring system from 20 to 30 May 2024.
5. IoT and Cloud
5.1. Structure and Contents of the Feedback Message from the Machine to the Cloud
The message transmitted from the machine to the cloud was presented in the format of a byte array (Table 2), which was subsequently aggregated into a JSON message. Upon detailed analysis, the message contained specific fields that are essential for understanding the current state and activities of the machine.
Table 2.
Payload structure.
Pressure Levels (P1 and P2): These parameters are crucial for monitoring the efficiency of the Venturi tube. A pressure difference of at least 0.8 bar between P1 and P2 ensures proper suction of the concentrated fertilizer solution. Battery Level (B): this provides information about the energy status of the machine. Flow Rate (F): This parameter, along with the number of filling cycles (N), is used to calculate calibration coefficients. Once determined, these coefficients allow the cloud to accurately understand how quickly water and concentrated fertilizer are distributed. Alarms (A1 and A2): alarms provide immediate information about undesirable or problematic events that may occur during the machine’s operation. Warnings (W): signal conditions that may not be critical, as alarms are, but require the attention of the operator or the system. Event ID: This field, located in payload (byte 7), uniquely identifies each scheduled fertigation event. It is essential for ensuring precise tracking of events. Machine Status (CurrentStep): Communicated through the field in payload (byte 8), it provides information about ongoing actions, such as fertilizer injection or fertigation of specific zones. Depending on the machine’s configuration, this field can take on different meanings, allowing for customization of actions and optimized resource management. By incorporating these details into the JSON message, the system is designed to provide the cloud with a comprehensive and detailed overview of the machine’s operations. This data structuring is crucial not only for real-time monitoring but also to leverage the capabilities of artificial intelligence, which can analyze and interpret these data to further optimize operations and anticipate potential issues or future needs.
5.2. Cloud Architecture
The cloud infrastructure was developed using the services provided by AWS. Currently, this configuration supports several core functionalities that will be described in the next section:
- The EC2 (Elastic Compute Cloud) microservice [23] allows the creation of instances to run the backend, the database, and other services of CloudFormation.
- The RDS (Relational Database Service) is a relational database management system; in this case, a postgreSQL engine was chosen to build the DBMS (Database Management System).
- AWS App Runner manages containerized applications for both the front end and the backend.
- AWS Amplify allows to host the application on the web and ensure infrastructure scalability.
- AWS IoT for MQTT message management.
Below is a brief description of the AWS services used for the application (extrapolated with the support of the Chat GPT tool). EC2 is a computing service that provides computing capabilities in the AWS cloud environment. Users can start virtual server (VM) instances with different hardware and software configurations, adapting them to their specific needs. RDS offers scalable relational databases in the AWS cloud. It supports different database engines, such as MySQL, PostgreSQL, SQL Server, Oracle, and Amazon Aurora. This service simplifies the configuration, management, and maintenance of relational databases, making it easier to define the infrastructure. App Runner is a fully managed service that simplifies application deployment in AWS, generally allowing developers to implement codes without having to worry about the underlying infrastructure. AWS Amplify is a set of tools and services that enables developers to build secure and scalable web and mobile applications. It provides various features, such as authentication, push notifications, storage, and more, making it easier for developers to add cloud capabilities to their applications. Amazon Cognito is an AWS service for managing authentication, authorization, and user management features for web and mobile applications. It allows developers to easily add registration, access, and security to their services without having to manage the authentication infrastructure. AWS IoT Core is a service that enables applications to communicate with IoT devices securely. It provides messaging and management capabilities for devices, enabling applications to collect, process, and act on data generated by IoT devices.
Features of the new basic version of the “SolarFertigation” Application include:
- Integration of Sensor Data: The application enables the integration and visualization of data from sensors installed in the fields. This feature facilitates the collection and analysis of environmental and agricultural data.
- User authentication: end-users can pod-authenticate via email and password to access the platform, ensuring a safe and secure environment.
- Field visualization: once authenticated, users can view a list of their fields, obtaining detailed and tabular information on each field.
- Monitoring the status of fields and central units: Users can access specific details about each field, such as aggregated sensor data, zone information, warehouses, and fertilizer quantities. In addition, they can view the event history, upcoming events, and alarms associated with each field.
- Viewing and analyzing data by zone: The application offers the ability to analyze data collected by zone, presenting information through aggregated graphs. This feature helps users understand trends and variations in zone-level data.
- Scheduling of fertigation events: Users can schedule fertigation events through a dedicated module. Once scheduled, these events are managed by the application.
6. Discussion
6.1. Evolution and Advancements: Comparing the Initial Prototype to the Current System
In its initial phase [7,8,9], the system had limited control capabilities and a minimal number of mechanisms for monitoring and data acquisition. To develop an autonomous machine and integrate artificial intelligence for fertigation event management, the system layout underwent significant modifications. Below is a comparison between the previous and the current system versions.
A minimum- and maximum-level sensor was integrated within the mixing tank, accompanied by a solenoid valve to regulate its filling. This configuration allows for the monitoring of water volume, fertilizer concentration, and the flow rate through the Venturi tube. Although this modification may appear straightforward, it necessitated specific hardware implementations. For instance, an RC filter was inserted between the signal cable and the ground. The sensor developments also required firmware modifications to manage various states and interruptions.
During the fertigation process, the microcontroller calculates the elapsed time between detecting zero levels on the level sensors. If the water level falls below a predetermined threshold, irrigation is automatically halted to prevent the introduction of air. Additionally, the emptying time and the overall number of emptying events are recorded.
Initially, a Venturi tube was considered for water flow measurement. However, tests conducted with pressure sensors revealed the inadequacy of this method. Consequently, pressure sensors were retained for detailed information, and a pulse flow meter was integrated. The central unit currently features:
- An RTC (Real-Time Clock) for precise synchronization and control of the fertigation event.
- An LCD screen for meticulous machine oversight.
- I2C modules to expand the number of manageable relays.
- Various sensors designed for monitoring different process parameters.
- Venturi effect mixing nozzles to optimize the mixing process.
- Hydraulic circuit modifications aimed at minimizing losses and maximizing adjustability.
6.2. Development of Cloud Infrastructure and Future Objectives
The current research phase is focused on enhancing the cloud infrastructure, with particular emphasis on creating a back office capable of interpreting feedback from the machine in a more comprehensive and advanced manner. In the short term, priority objectives include releasing new functionalities that are more advanced than those already implemented. A tangible example is the optimization of communication between the machine and the cloud, especially in handling abnormal situations, such as the machine being in offline mode or general errors in transmitting or receiving events.
Numerous tests are currently underway to validate the entire system, ranging from environmental parameters to specific machine parameters, and extending to a detailed analysis of the entire mechanical and hydraulic system of the central unit. This validation phase is crucial to ensure the robustness and reliability of the implemented model.
Once the model is fully validated and the cloud has reached a sufficiently developed state, new research opportunities will emerge. Specifically, there will be a focus on more advanced levels, such as the integration of artificial intelligence. This evolution will explore the automation of fertigation routines, further enhancing system efficiency and enabling smarter resource management. Once completed, the system will be able to include several specific features of intelligent agriculture. The most common examples extrapolated from the ChatGPT tool include:
- The use of sensors to collect real-time data on soil conditions, climate, and crops. These data can be used by growers to make more informed decisions on irrigation, fertilization, and general crop management.
- New targeted farming practices can be developed based on the data collected, such as precise fertilizer distribution, thus reducing waste and improving sustainability.
- The use of intelligent algorithms capable of analyzing large amounts of agricultural data and providing predictions, suggestions, and optimization of supply chain processes.
Additional examples [37] that extend beyond the scope of the specific system but could be integrated into a unified cloud infrastructure, thereby opening up new research scenarios, include:
- Drones: Drones make it possible to take aerial photographs and can, therefore, be used to monitor large areas of cultivation, providing high-resolution images and multispectral data. This allows farmers to quickly identify problems, such as plant diseases or nutrient deficiencies.
- Automation and robotics: The use of robots and automated machines to perform tasks, such as planting, harvesting, and pruning. This not only increases efficiency but can also reduce dependence on manual labor and associated risks.
The integration of these technologies promises to improve the efficiency and sustainability of farming practices. Furthermore, the creation of a unified cloud infrastructure could facilitate the seamless integration and centralized management of agricultural data and activities, thus paving the way for innovative research pathways. In summary, the envisioned system, once completed, is poised to integrate seamlessly into the smart farming environment, contributing to real-time data collection, analysis, and management for informed decision-making and optimized operations.
7. Conclusions
The hydraulic differences between the patented preliminary basic version of the system [7,8,9] and the device shown here are the result of a better understanding of water and fertilizer distribution dynamics. The advanced version of the system will introduce new features, such as optimized communication between the machine and the cloud platform, capable of dealing with non-standard situations, such as handling errors when sending or receiving events. The current phase of extensive testing involves environmental parameters, machine-specific metrics, and a comprehensive analysis of the mechanical and hydraulic systems, demonstrating a commitment to ensuring the robustness and reliability of the entire system. Despite the challenges encountered in the use of soil moisture sensors, satisfactory conclusions were reached regarding their ability to detect changes in soil moisture. Furthermore, the methodology developed to measure solar radiation intensity showed good consistency with reference data, confirming the reliability of the measurement. Automating the fertigation routines promises to take the system to new levels of efficiency and adaptability, cementing the role of the ‘SolarFertigation’ project in precision farming. The trial test conducted in the agri-photovoltaic field not only allowed agronomists to conduct tests to evaluate these new types of plants but also to verify the reliability and usefulness of the SolarFertigation system. It was possible to evaluate the energy autonomy of the central units concerning water demand: on sunny days (i.e., from June 2024), it became necessary to irrigate at night or in the evening hours due to high temperatures. In this case, the central unit provided an autonomy of 4 h, distributing up to 5 cubic meters of water. These parameters can be further scaled and adapted to the needs of clients or operational conditions. In conclusion, this system can be considered energy-autonomous, and it is capable of collecting various environmental and soil parameters, as well as technical agronomic data regarding the amounts of water and fertilizer used. Because of these features, the system is particularly suitable for agricultural sectors that need precise monitoring of microclimates and consumption of water and fertilizer resources. The planned integration of artificial intelligence opens up interesting new scenarios, such as the possible integration of the system into agri-photovoltaic fields, allowing the cloud to manage the system according to the multitude of variables that can be gathered by the system to optimize the combined production of food and electricity. Briefly, this article analyzed not only some of the development steps related to the present challenges but also an approach for a smarter and more sustainable future in agriculture.
Author Contributions
Conceptualization, F.Z. and N.I.G.; methodology, F.Z. and R.S.; software, R.S.; validation, F.Z., N.I.G., and R.S.; formal analysis, F.Z. and N.I.G.; investigation, N.I.G.; resources, F.Z. and N.I.G.; data curation, F.Z. and N.I.G.; writing—original draft preparation, F.Z.; writing—review and editing, F.Z. and N.I.G.; visualization, F.Z.; supervision, S.S. and N.I.G.; project administration, S.S.; funding acquisition, S.S. All authors have read and agreed to the published version of the manuscript.
Funding
This research received no external funding.
Data Availability Statement
The data presented in this study are available on request from the corresponding author due to industrial participation to this research.
Acknowledgments
ChatGPT and DeepL tools were used to summarize and express some concepts correctly in English, and to describe and summarize the AWS services in Section 4.3.
Conflicts of Interest
The Autor S.Strazzella is the inventor of the patent, the Ceo of SF System s.r.l. (currently Company owner of the patent) and the coordination of the research and development activities of the project. the company SF System s.r.l. is a subsidary company of Asepa Energy s.r.l. The autor Sergio Strazzella is also the CEO of Asepa Energy s.r.l.; the authors R. Serio is is an employee of Asepa Energy s.r.l. and contributed to the development of the firmware and some parts of the whole system.
References
- Kiełbasa, P.; Juliszewski, T.; Kurpaska, S. Special Issue on the Engineering of Smart Agriculture. Appl. Sci. 2023, 13, 8523. [Google Scholar] [CrossRef]
- Hafezalkotob, A.; Hami-Dindar, A.; Rabie, N.; Hafezalkotob, A. A decision support system for agricultural machines and equipment selection: A case study on olive harvester machines. Comp. Electron. Agric. 2018, 148, 207–216. [Google Scholar] [CrossRef]
- Foughali, K.; Fathallah, K.; Frihida, A.A. Using cloud IOT for disease prevention in precision agriculture. Proc. Comp. Sci. 2018, 130, 575–582. [Google Scholar] [CrossRef]
- Lokers, R.; Knapen, R.; Janssen, S.; Randen, Y.; Jansen, S. Analysis of Big Data technologies for use in agro-environmental science. J. Environ. Modell. Softw. 2016, 84, 494–504. [Google Scholar] [CrossRef]
- Portocarrero, J.M.; Tobón, L.E.; Gómez Escobar, J.A.; Culman, M.; Aranda, J.M.; Parra-Sanchez, D.T.; Quiroz, L.; Hoyos, A.; Garreta, L.E. Review of IoT Applications in Agro-industrial and Environmental Fields. Comput. Electr. Agric. 2017, 142, 283–297. [Google Scholar]
- Jo, H.; Schimdt, N.S.; Cho, Y. An agile operations management system for green factory. Int. J. Precis. Eng. Manuf.-Green Technol. 2014, 1, 131–143. [Google Scholar] [CrossRef][Green Version]
- Visconti, P.; Giannoccaro, N.I.; de Fazio, R.; Strazzella, S.; Cafagna, D. IoT-oriented software platform applied to sensors-based farming facility with smartphone farmer app. Bull. Electr. Eng. Inform. 2020, 9, 1095–1105. [Google Scholar] [CrossRef]
- Visconti, P.; de Fazio, R.; Primiceri, P.; Cafagna, D.; Strazzella, S.; Giannoccaro, N.I. A solar powered fertigation remotely controlled by farmer for irrigation cycles and crops growth optimization. Int. J. Electron. Telecomun. 2020, 66, 59–68. [Google Scholar]
- Giannoccaro, N.I.; Persico, G.; Strazzella, S.; Lay-Ekuakille, A.; Visconti, P. A system for optimizing fertilizer dosing in innovative smart fertigation pipelines:,modeling, construction, testing and control. Int. J. Prec. Eng. Manufact. 2020, 21, 1581–1596. [Google Scholar] [CrossRef]
- Hanady, A.; Bader, A.; Anwar, A. Air quality monitoring using a LEACH-based data aggregation technique in wireless sensor. Network 2015, 32, 275–300. [Google Scholar]
- Jawad, H.M.; Nordin, R.; Gharghan, S.K.; Jawad, A.M.; Ismail, M. Energy-efficient wireless sensor networks for precision agriculture: A review. Sensors 2017, 17, 1781. [Google Scholar] [CrossRef]
- Liqiang, Z.; Shouyi, Y.; Leibo, L.; Zhen, Z.; Shaojun, W. A crop monitoring system based on wireless sensor network. Proc. Environ. Sci. 2011, 11, 558–565. [Google Scholar] [CrossRef]
- Ojha, T.; Misra, S.; Raghuwanshi, N.S. Wireless sensor networks for agriculture: The state-of-the-art in practice and future challenges. Comp. Electron. Agric. 2015, 118, 66–84. [Google Scholar] [CrossRef]
- Ramadan, K.M.; Oates, M.J.; Molina-Martinez, J.; Canales, A.R. Design and implementation of a low-cost photovoltaic soil moisture monitoring station for irrigation scheduling with different frequency domain analysis probe structures. Comp. Electron. Agric. 2018, 148, 148–159. [Google Scholar] [CrossRef]
- Serpil Savci, Investigation of Effect of Chemical Fertilizers on Environment. APCBEE Procedia 2012, 1, 287–292. [CrossRef]
- Raut, R.; Varma, H.; Mulla, C.; Pawar, V.R. Soil Monitoring, Fertigation, and Irrigation System Using IoT for Agricultural Application. In Intelligent Communication and Computational Technologies; Lecture Notes in Networks and Systems; Springer: Singapore, 2018. [Google Scholar]
- Abidin, S.A.H.Z.; Ibrahim, S.N. Web-based monitoring of an automated fertigation system: An IoT application. In Proceedings of the 2015 IEEE 12th Malaysia International Conference on Communications (MICC), Kuching, Malaysia, 23–25 November 2015. [Google Scholar]
- Amazon Web Services. Amazon Web Services, Inc., Seattle, Washingthon, United States. Available online: https://aws.amazon.com/it/what-is-aws/?nc1=f_cc (accessed on 5 January 2024).
- Torky, M.; Hassanein, A.E. Integrating blockchain and the internet of things in precision agriculture: Analysis, opportunities, and challenges. Comput. Electron. Agric. 2020, 178, 0168–1699. [Google Scholar] [CrossRef]
- Photovoltaic Geographical Information System (PVGIS), European Commission, Bruxelles (Belgium). Available online: https://joint-research-centre.ec.europa.eu/photovoltaic-geographical-information-system-pvgis_en (accessed on 5 January 2024).
- NUCLEO-WL55JC. STMicroelectronics, Geneve (Switzerland). Available online: https://www.st.com/en/evaluation-tools/nucleo-wl55jc.html (accessed on 5 January 2024).
- LoRa Alliance. Powering the IoT. Available online: https://lora-alliance.org/ (accessed on 5 January 2024).
- AWS IoT Core. Available online: https://aws.amazon.com/it/iot-core/ (accessed on 5 January 2024).
- MQTT. The Standard for IoT Messaging. Available online: https://MQTT.org/ (accessed on 5 January 2024).
- FreeRTOS. Market Leading RTOS (Real Time Operating Sistem); Real Time Engineers Ltd.: Manchester, UK; Available online: https://www.freertos.org/index.html (accessed on 5 January 2024).
- Device Classes. Available online: https://www.thethingsnetwork.org/docs/LoRaWan/classes/ (accessed on 5 January 2024).
- Parshall, J.; Lamb, L. (Eds.) Applying S88: Batch Control from a User’s Perspective; Instrument Society of America: Pittsburgh, PA, USA, 2000. [Google Scholar]
- The Things Network. Available online: https://www.thethingsindustries.com/docs (accessed on 5 January 2024).
- AWS CloudFormation. Available online: https://aws.amazon.com/it/cloudformation/ (accessed on 5 January 2024).
- Grafana Cloud | Observability Platform Overview. Available online: https://grafana.com/products/cloud/?src=ggl-s&mdm=cpc&camp=b-grafana-exac-emea&cnt=118483912276&trm=grafana&device=c&gclid=Cj0KCQjw06-oBhC6ARIsAGuzdw16VvHye-XWBwkmYwQcGuz07myUDwnmisiyFvSyiYbINOtrA0L1O94aAiUGEALw_wcB (accessed on 5 January 2024).
- Zito, F.; Giannoccaro, N.I.; Serio, R.; Strazzella, S. Development of an IoT Cloud Control System for Managing Pressurized Gas Containers. WSEAS Trans. Electron. 2023, 14, 79–90. [Google Scholar] [CrossRef]
- Alqinsi, P.; Edward, I.J.M.; Ismail, N.; Darmalaksana, W. IoT-Based UPS Monitoring System Using MQTT Protocols. In Proceedings of the 4th International Conference on Wireless and Telematics (ICWT), Nusa Dua, Bali, Indonesia, 12–13 July 2018; pp. 1–5. [Google Scholar]
- Tsyani, D.N.; Kurniasari, A.; Hudaya, C. Battery monitoring system with LoRA technology. In Proceedings of the 3rd Internationa Conference on Information Technology, Information System and Electrical Engineering, Yogyakarta, Indonesia, 13–14 November 2018. [Google Scholar]
- Loganathan Nachimuthu, Reem Ahmed Al-Mahrouqi, Tamadhar Salim Al-Abri, Muna Al-Hadrami, IOT based Energy Monitoring for Practical Loads using NodeMCU. WSEAS Trans. Electron. 2023, 14, 49–56. [CrossRef]
- Nouman, A.S.; Chokhachian, A.; Santucci, D.; Auer, T. Prototyping of Environmental Kit for Georeferenced Transient Outdoor Comfort Assessment. ISPRS Int. J. Geo-Inf. 2019, 8, 76. [Google Scholar] [CrossRef]
- Gałęzewski, L.; Jaskulska, I.; Jaskulski, D.; Lewandowski, A.; Szypłowska, A.; Wilczek, A.; Szczepańczyk, M. Analysis of the need for soil moisture, salinity and temperature sensing in agriculture: A case study in Poland. Sci. Rep. 2021, 11, 16660. [Google Scholar] [CrossRef]
- Bagha, H.; Yavari, A.; Georgakopoulos, D. Hybrid Sensing Platform for IoT-Based Precision Agriculture. Future Internet 2022, 14, 233. [Google Scholar] [CrossRef]
Disclaimer/Publisher’s Note: The statements, opinions and data contained in all publications are solely those of the individual author(s) and contributor(s) and not of MDPI and/or the editor(s). MDPI and/or the editor(s) disclaim responsibility for any injury to people or property resulting from any ideas, methods, instructions or products referred to in the content. |
© 2024 by the authors. Licensee MDPI, Basel, Switzerland. This article is an open access article distributed under the terms and conditions of the Creative Commons Attribution (CC BY) license (https://creativecommons.org/licenses/by/4.0/).