
Oxygen Measurement in Cuprate Superconductors Using the Dissolved Oxygen/Chlorine Method

Abstract
1. Introduction

| Type | Method | Weight | Error | Time | Merit | Demerit |
|---|---|---|---|---|---|---|
| Physical analysis | Thermogravimetric analysis (TGA) [9] | 0.1 mg | 0.1% | 1 h | High accuracy | Cannot ascertain the precise oxygen content. |
| X-ray Photoelectron Spectroscopy (XPS) [10] | 1 μg | >10% | 1 h | The depth profile can be determined. | Sensitive to the surface Lacks precision | |
| Auger Electron Spectroscopy (AES) [10] | 1 μg | ~10% | 1 h | The depth profile can be determined. | Sensitive to the surface Lacks precision | |
| Oxygen Analyzer [11] | 1 g | ~10% | 10 min | Simple measuring | Requires a large sample Limited accuracy | |
| Chemical analysis | Coulometric [12] | 50 mg | 0.1% | 1 h | Minor error Automatic measurement | Long measurement time |
| Iodometric [13] | 50 mg | 0.1% | 1 h | Simple measuring | Long measurement time |
2. Experimental
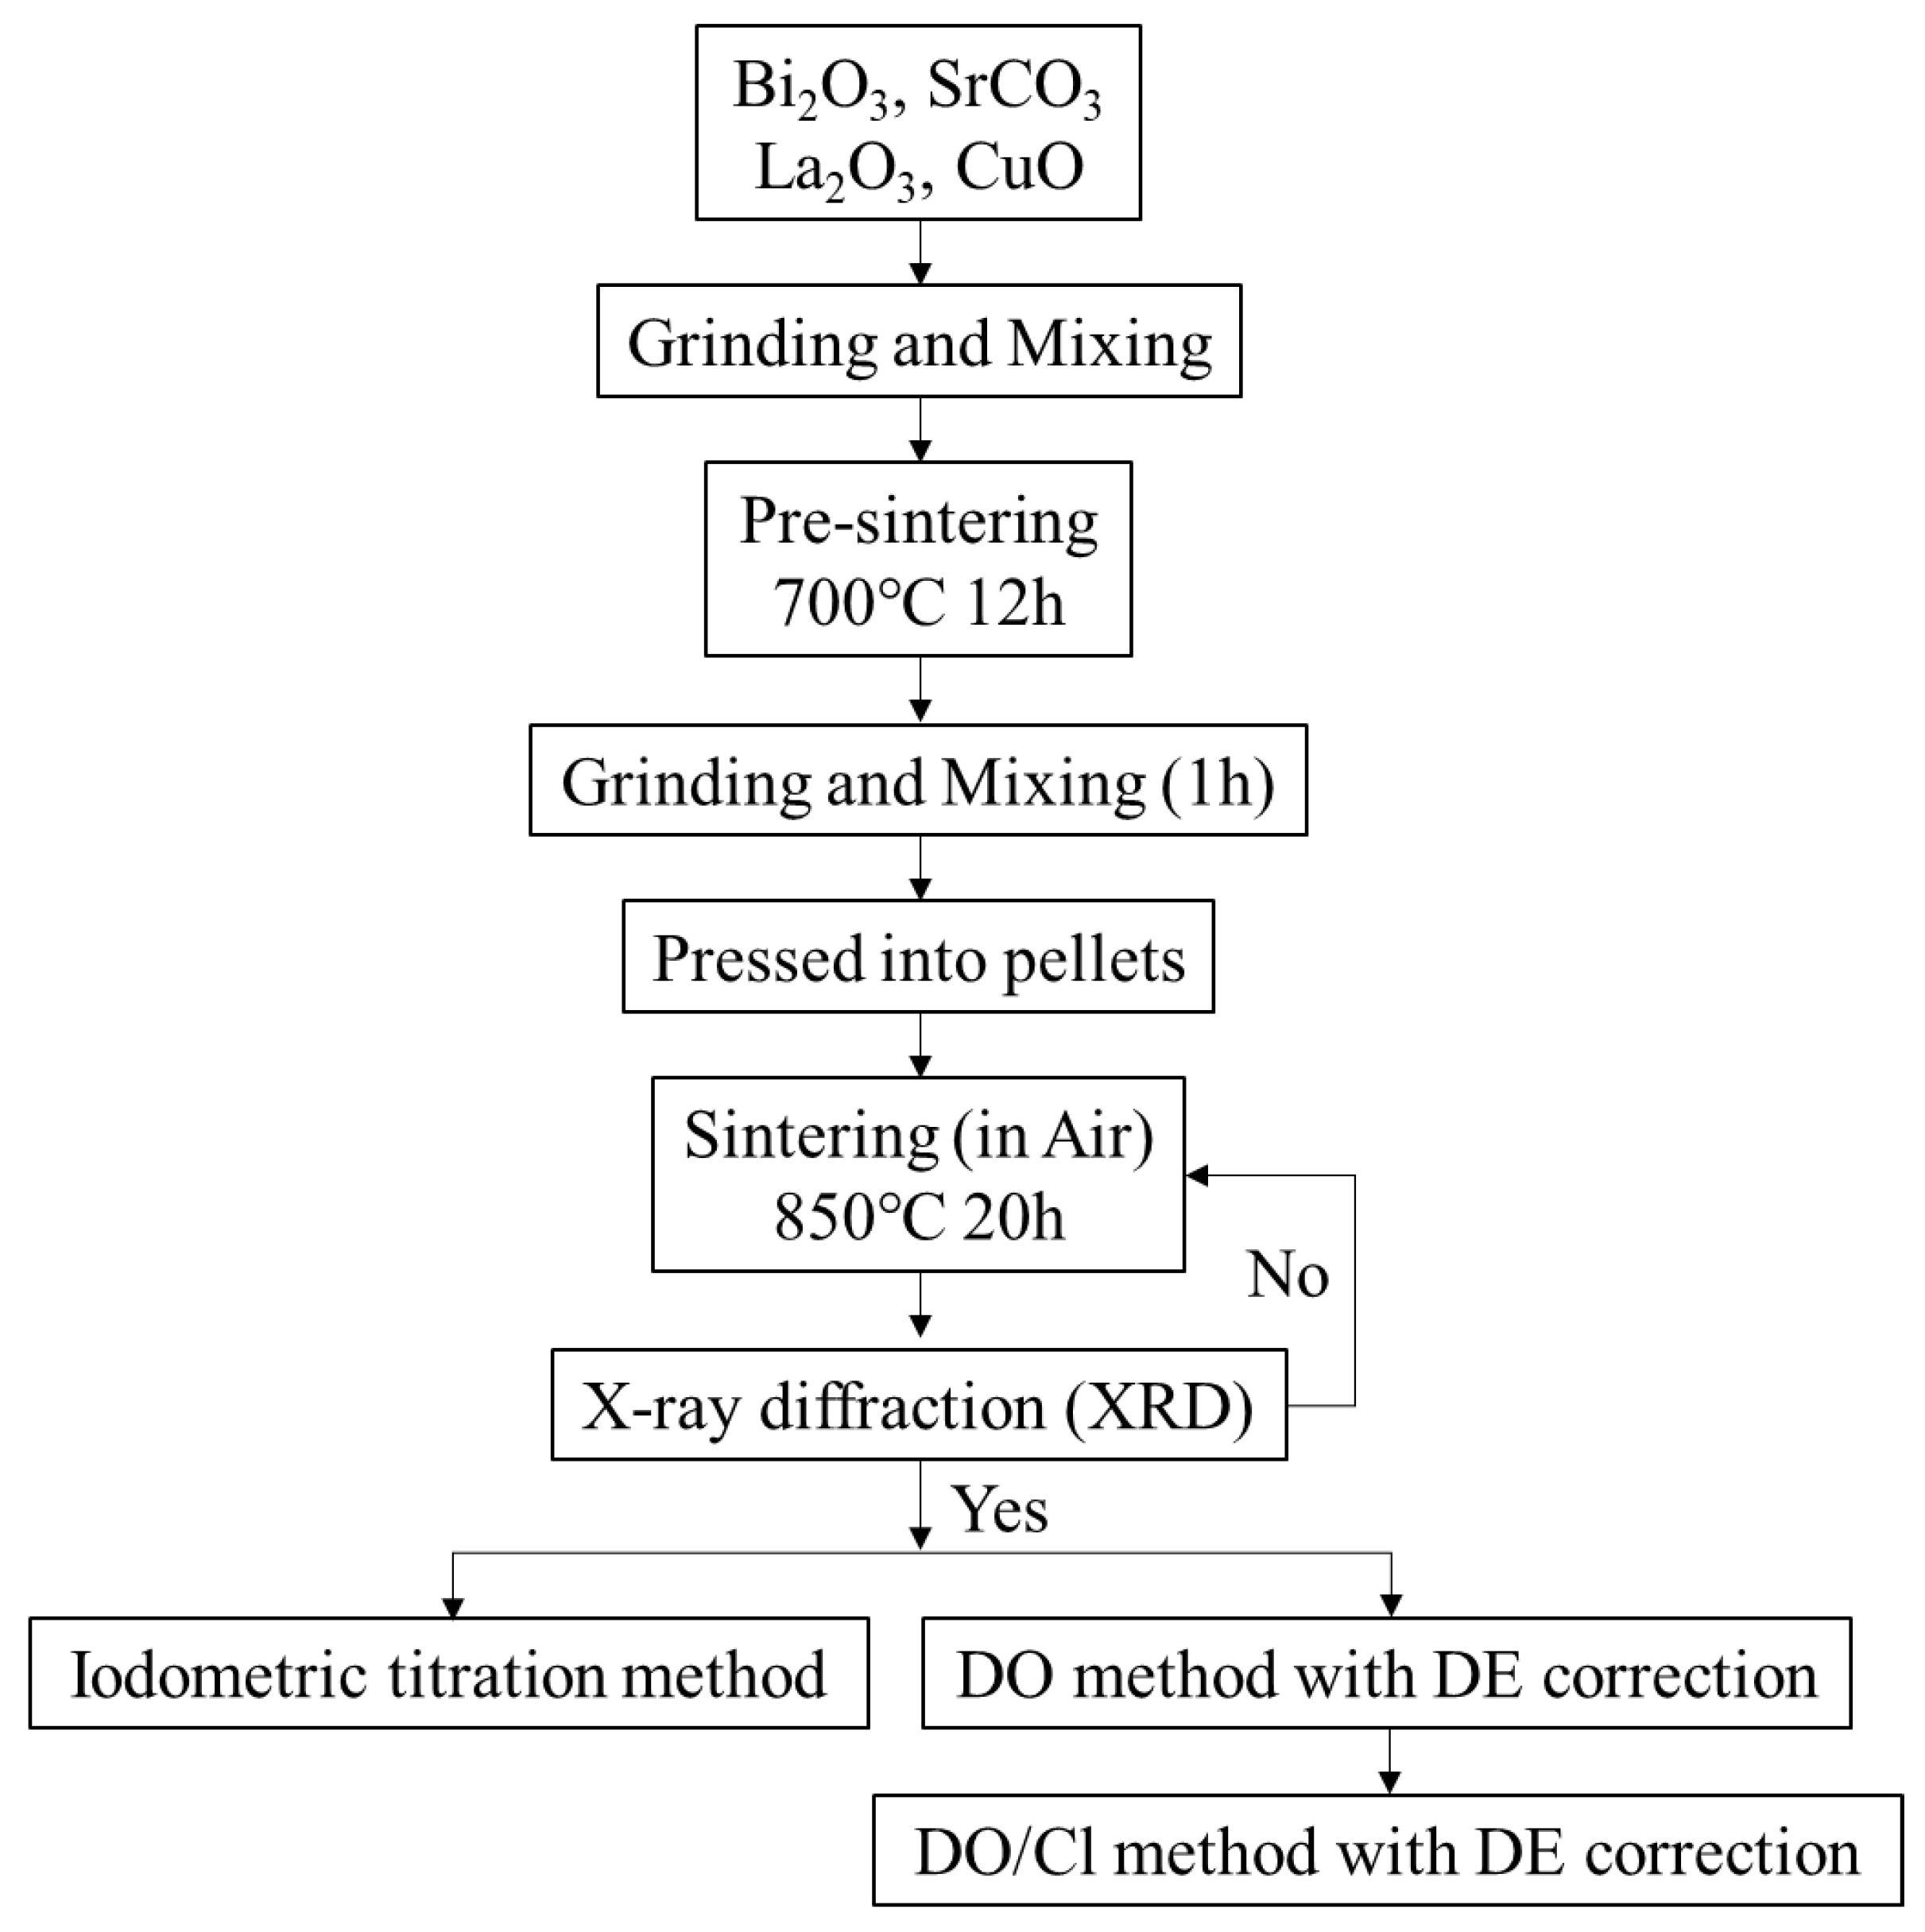
2.1. Preparation
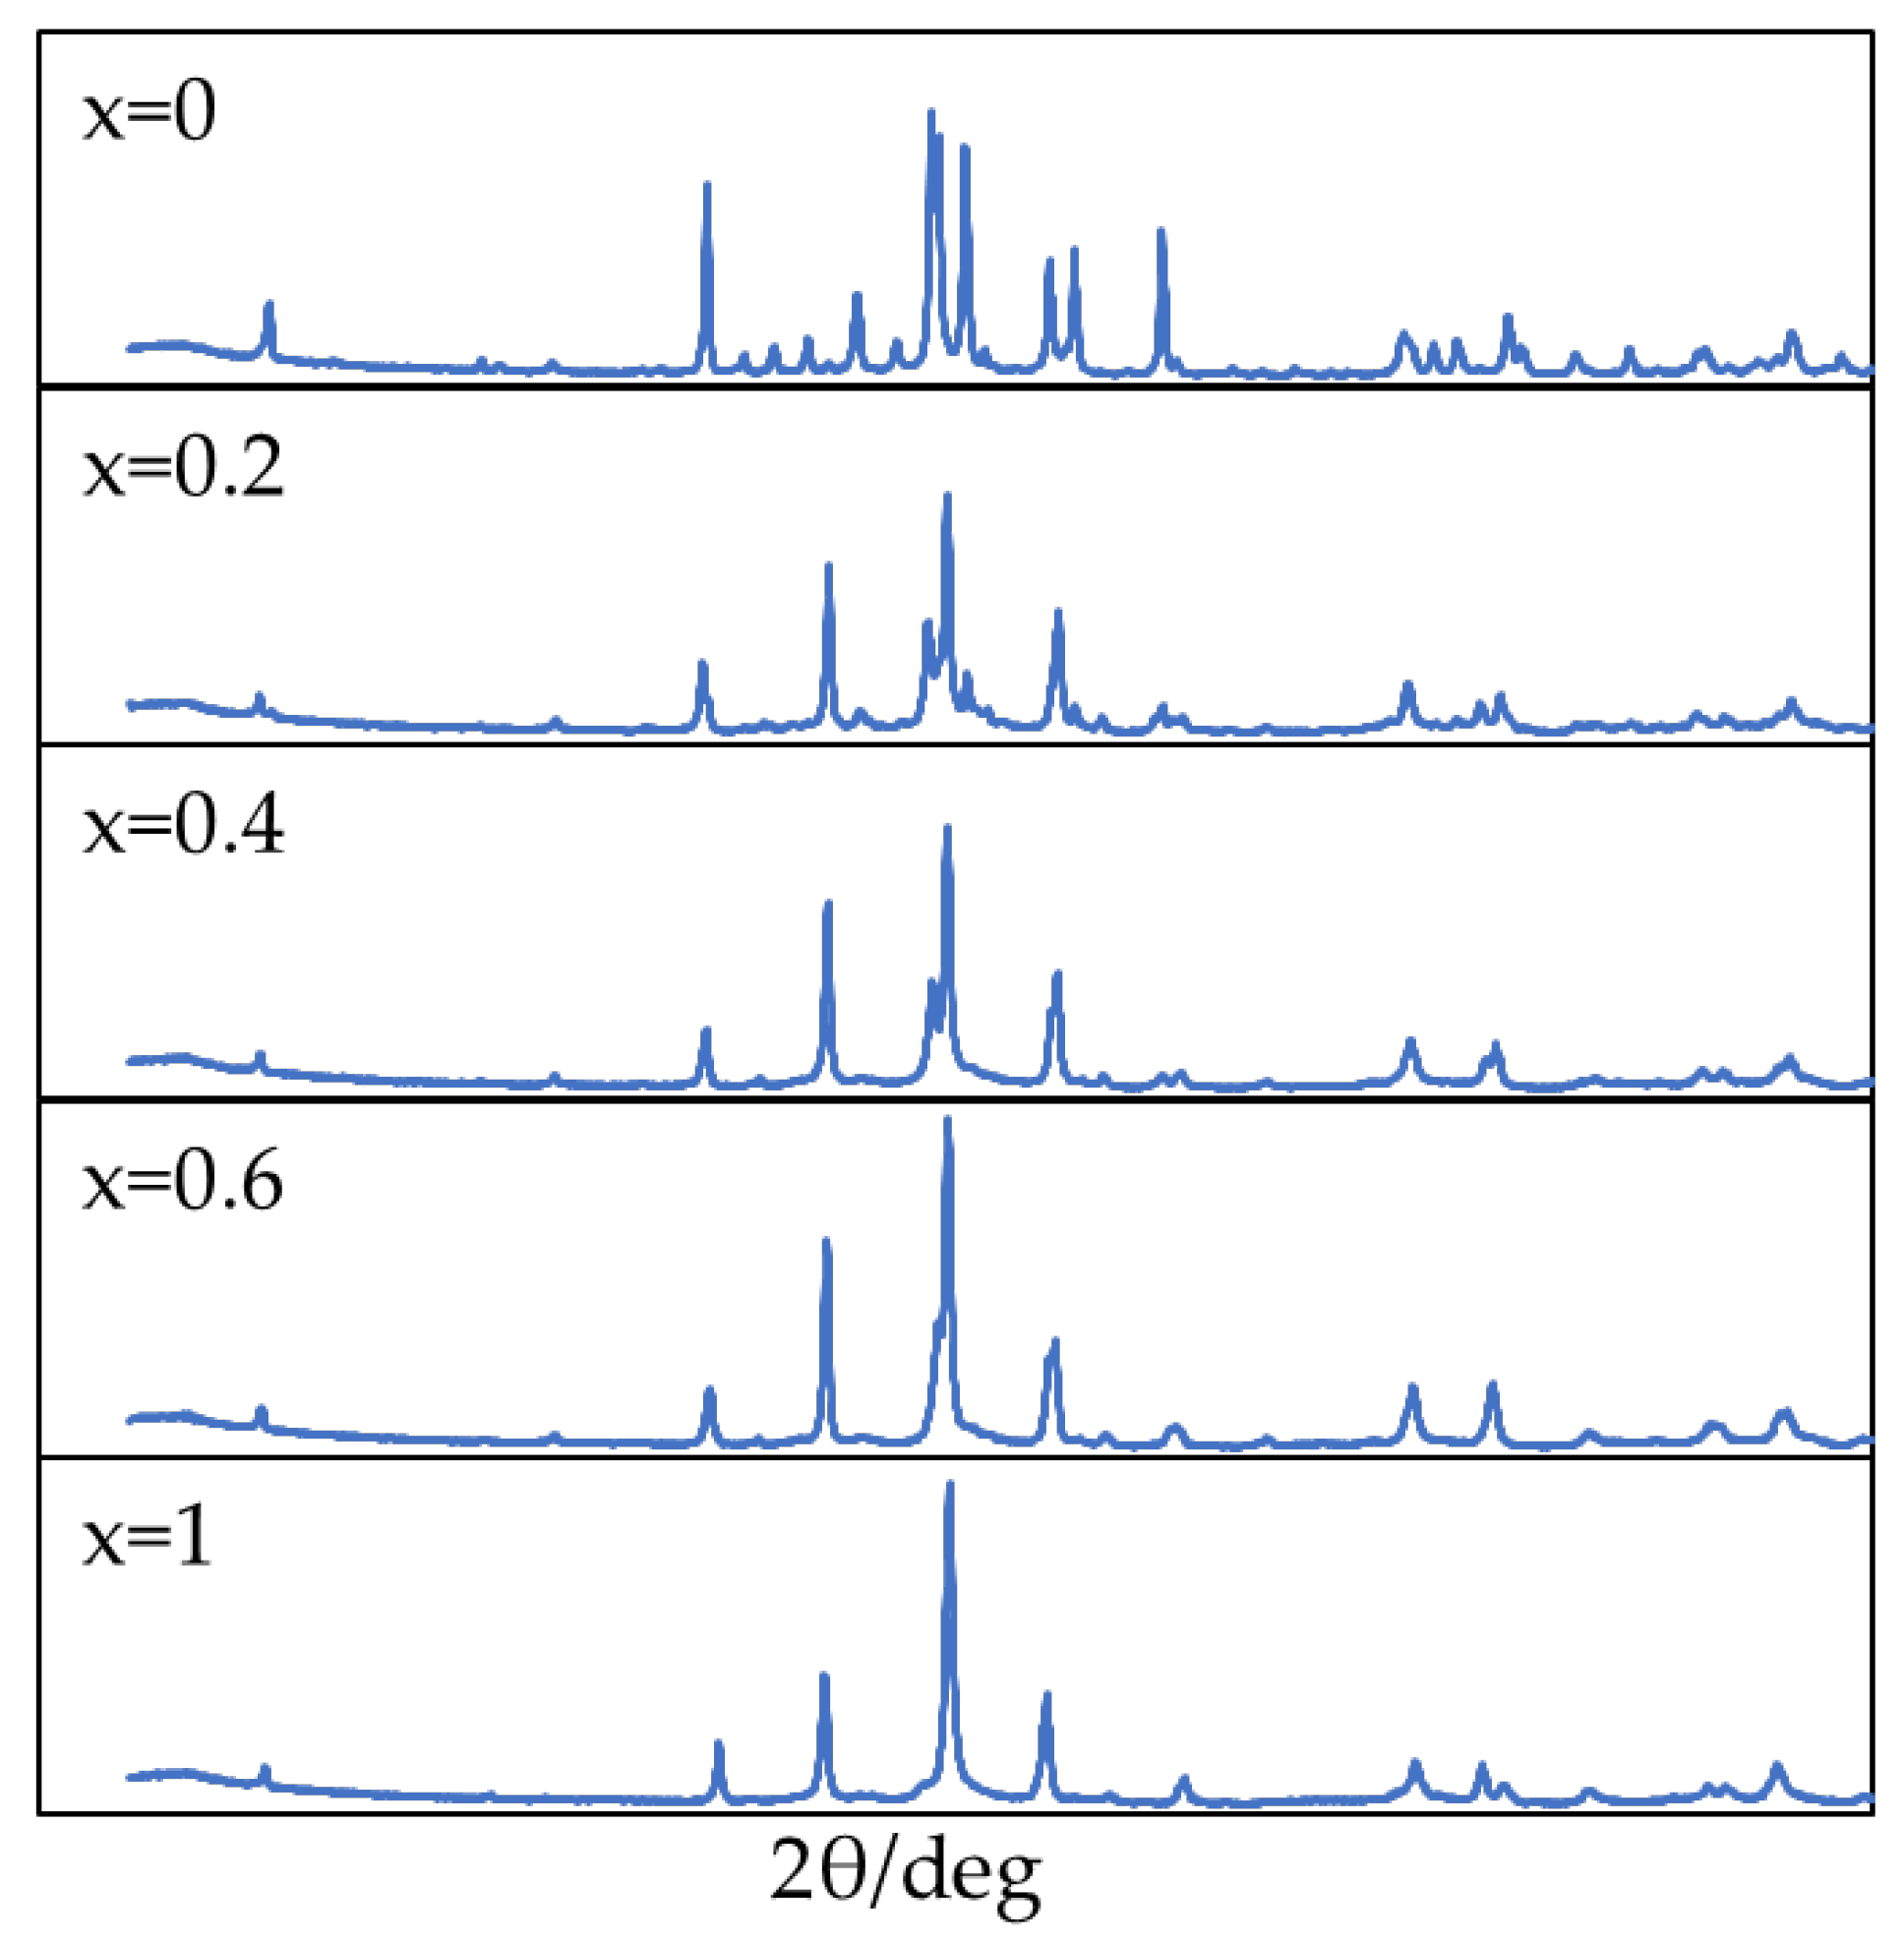
2.2. XRD
2.3. Iodometric Titration Method
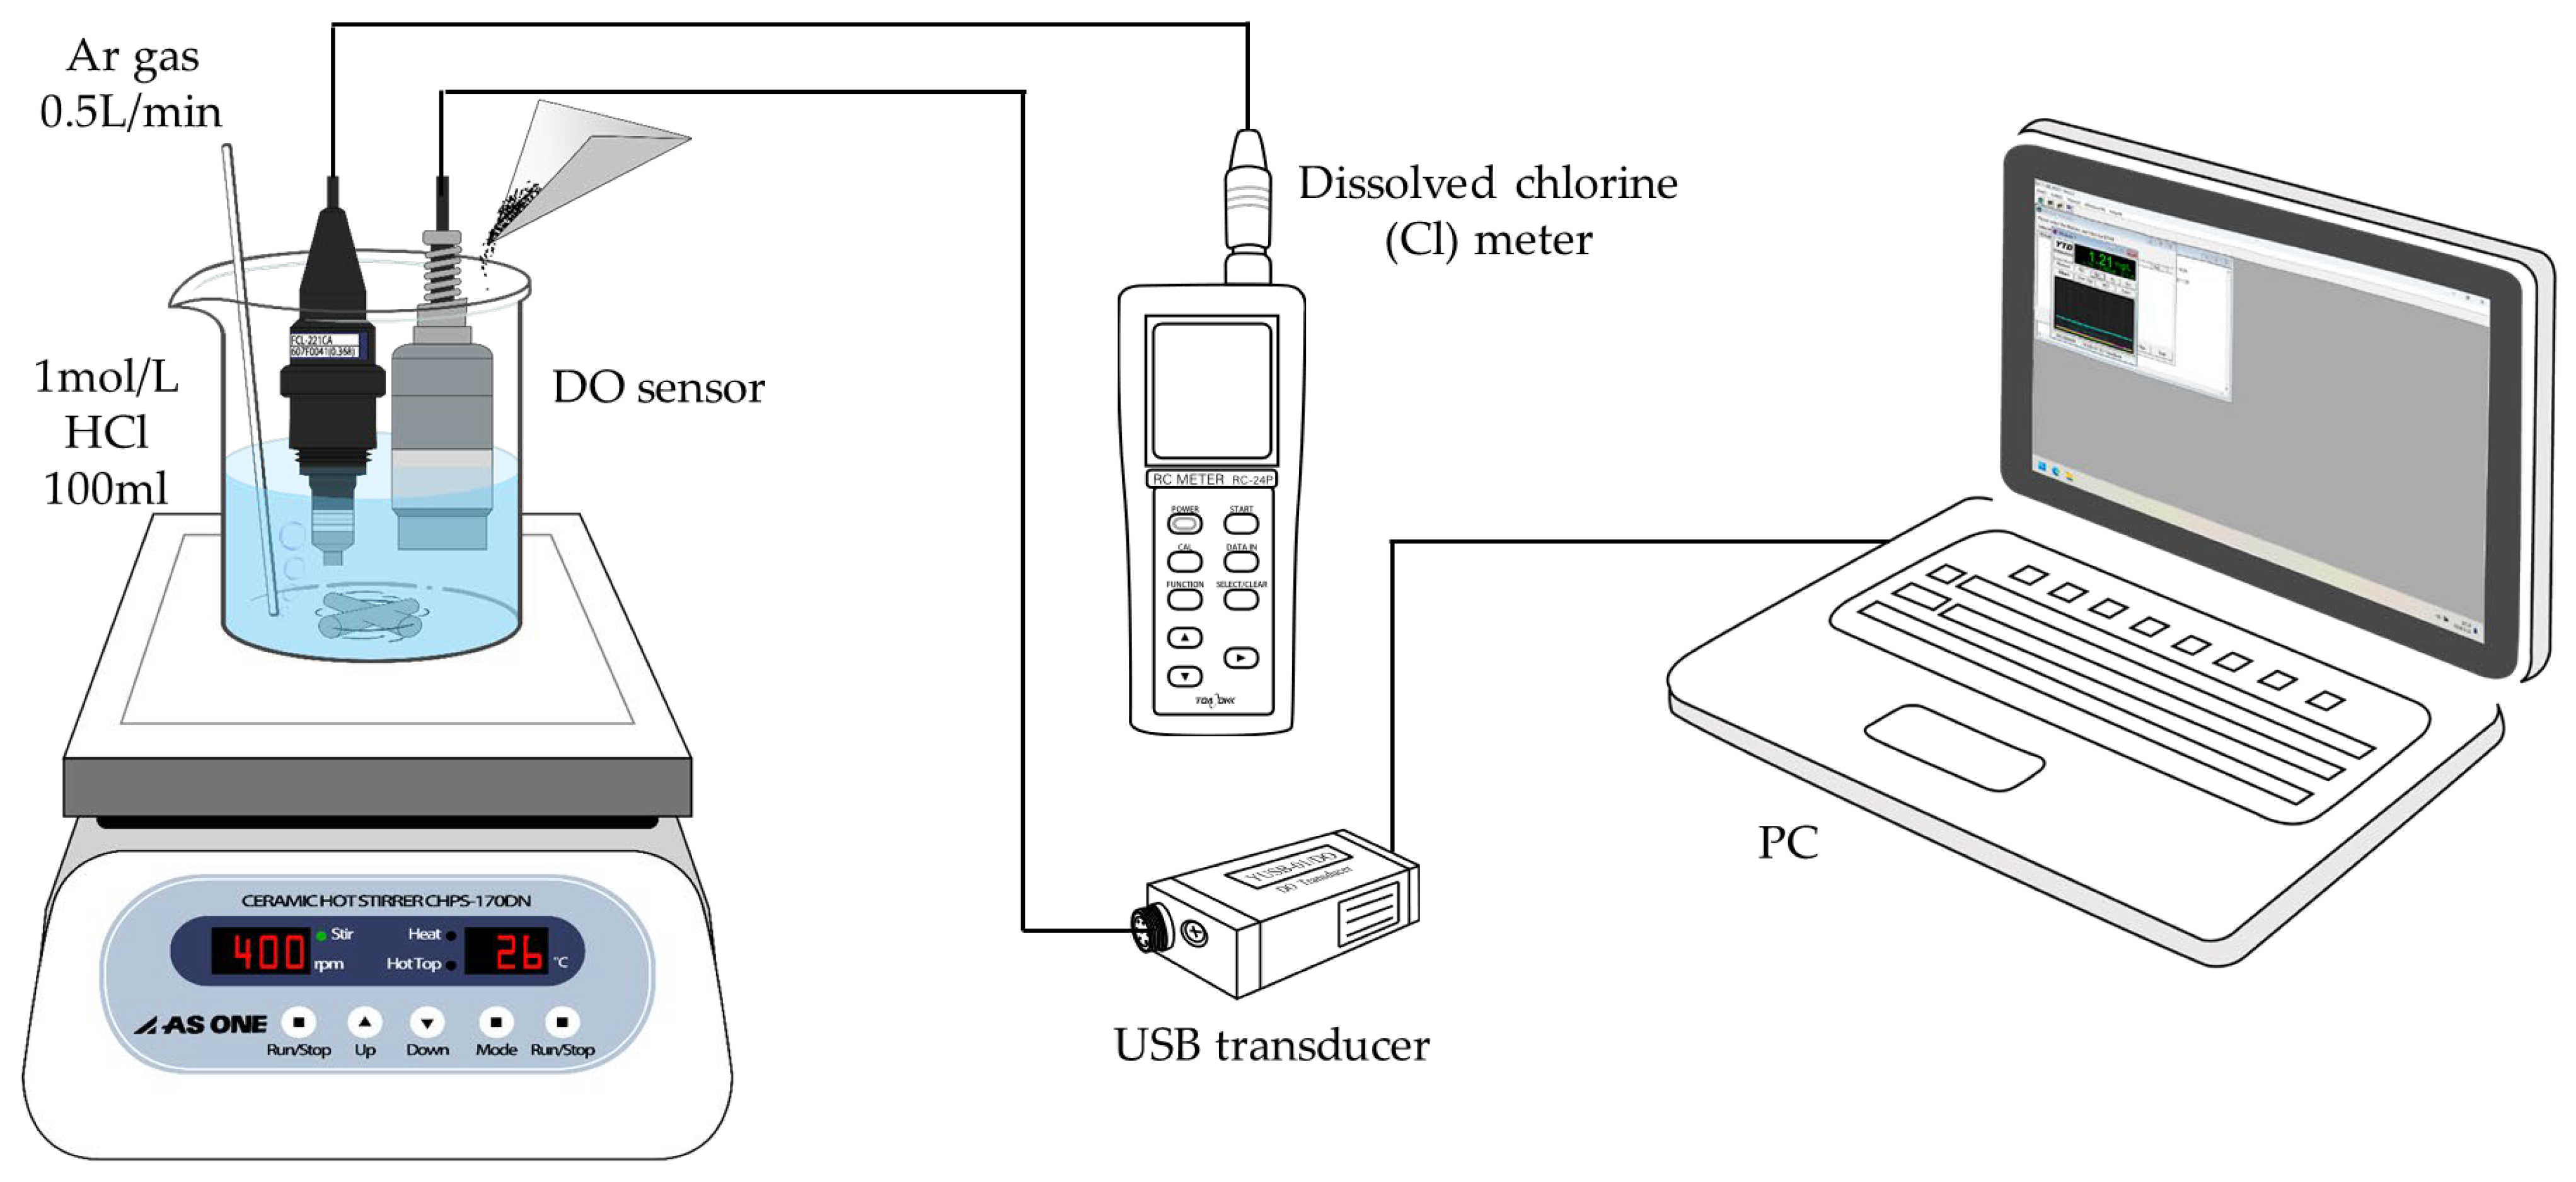
2.4. Dissolved Oxygen Method
| m(CuO1+z) = w(CuO1+z)/M(CuO1+z) mO2 = Δc V/MO2 1:z/2 = m(CuO1+z):mO2 = w(CuO1+z)/M(CuO1+z):Δc V/MO2 Δc V/MO2 = (z/2) × w(CuO1+z)/M(CuO1+z) |
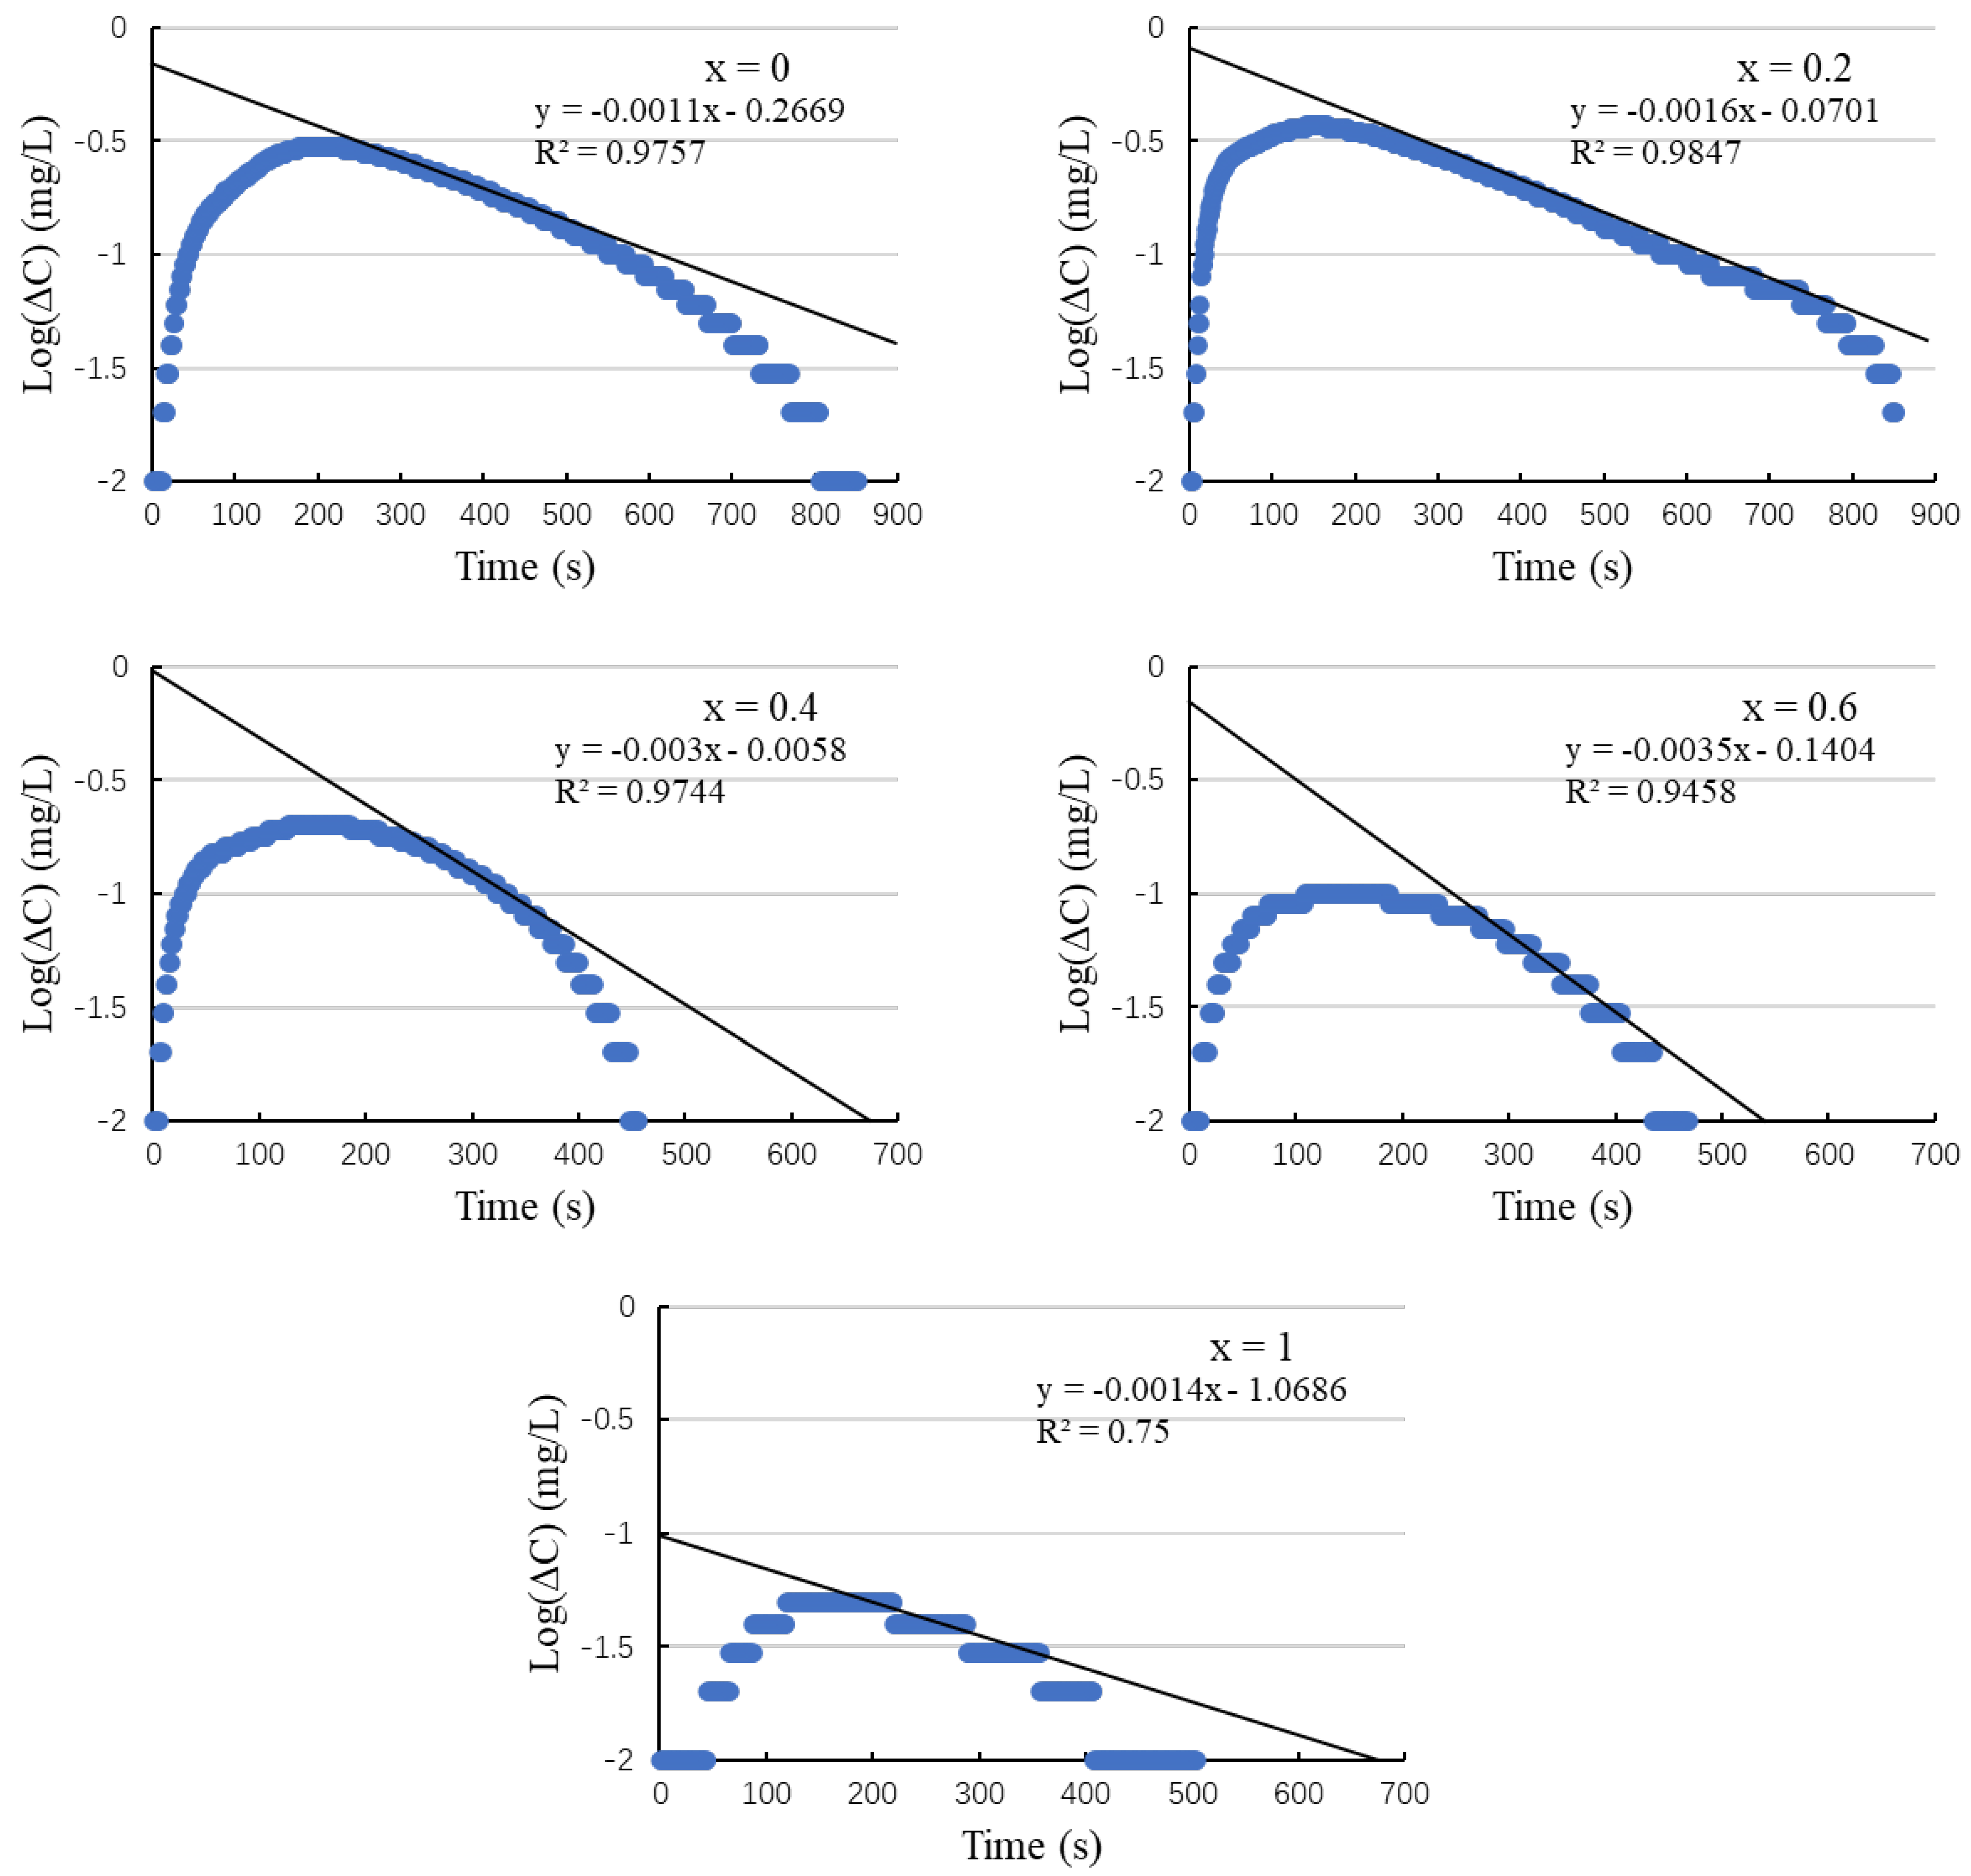
2.5. DO Method with Differential Equation Correction
2.6. DO/Cl Method with DE Correction
2.7. Effect of Different Acidic Solutions in the DO/Cl Method with DE Correction
3. Results and Discussion
3.1. XRD Analysis
3.2. Iodometric Titration Method Results as a Standard
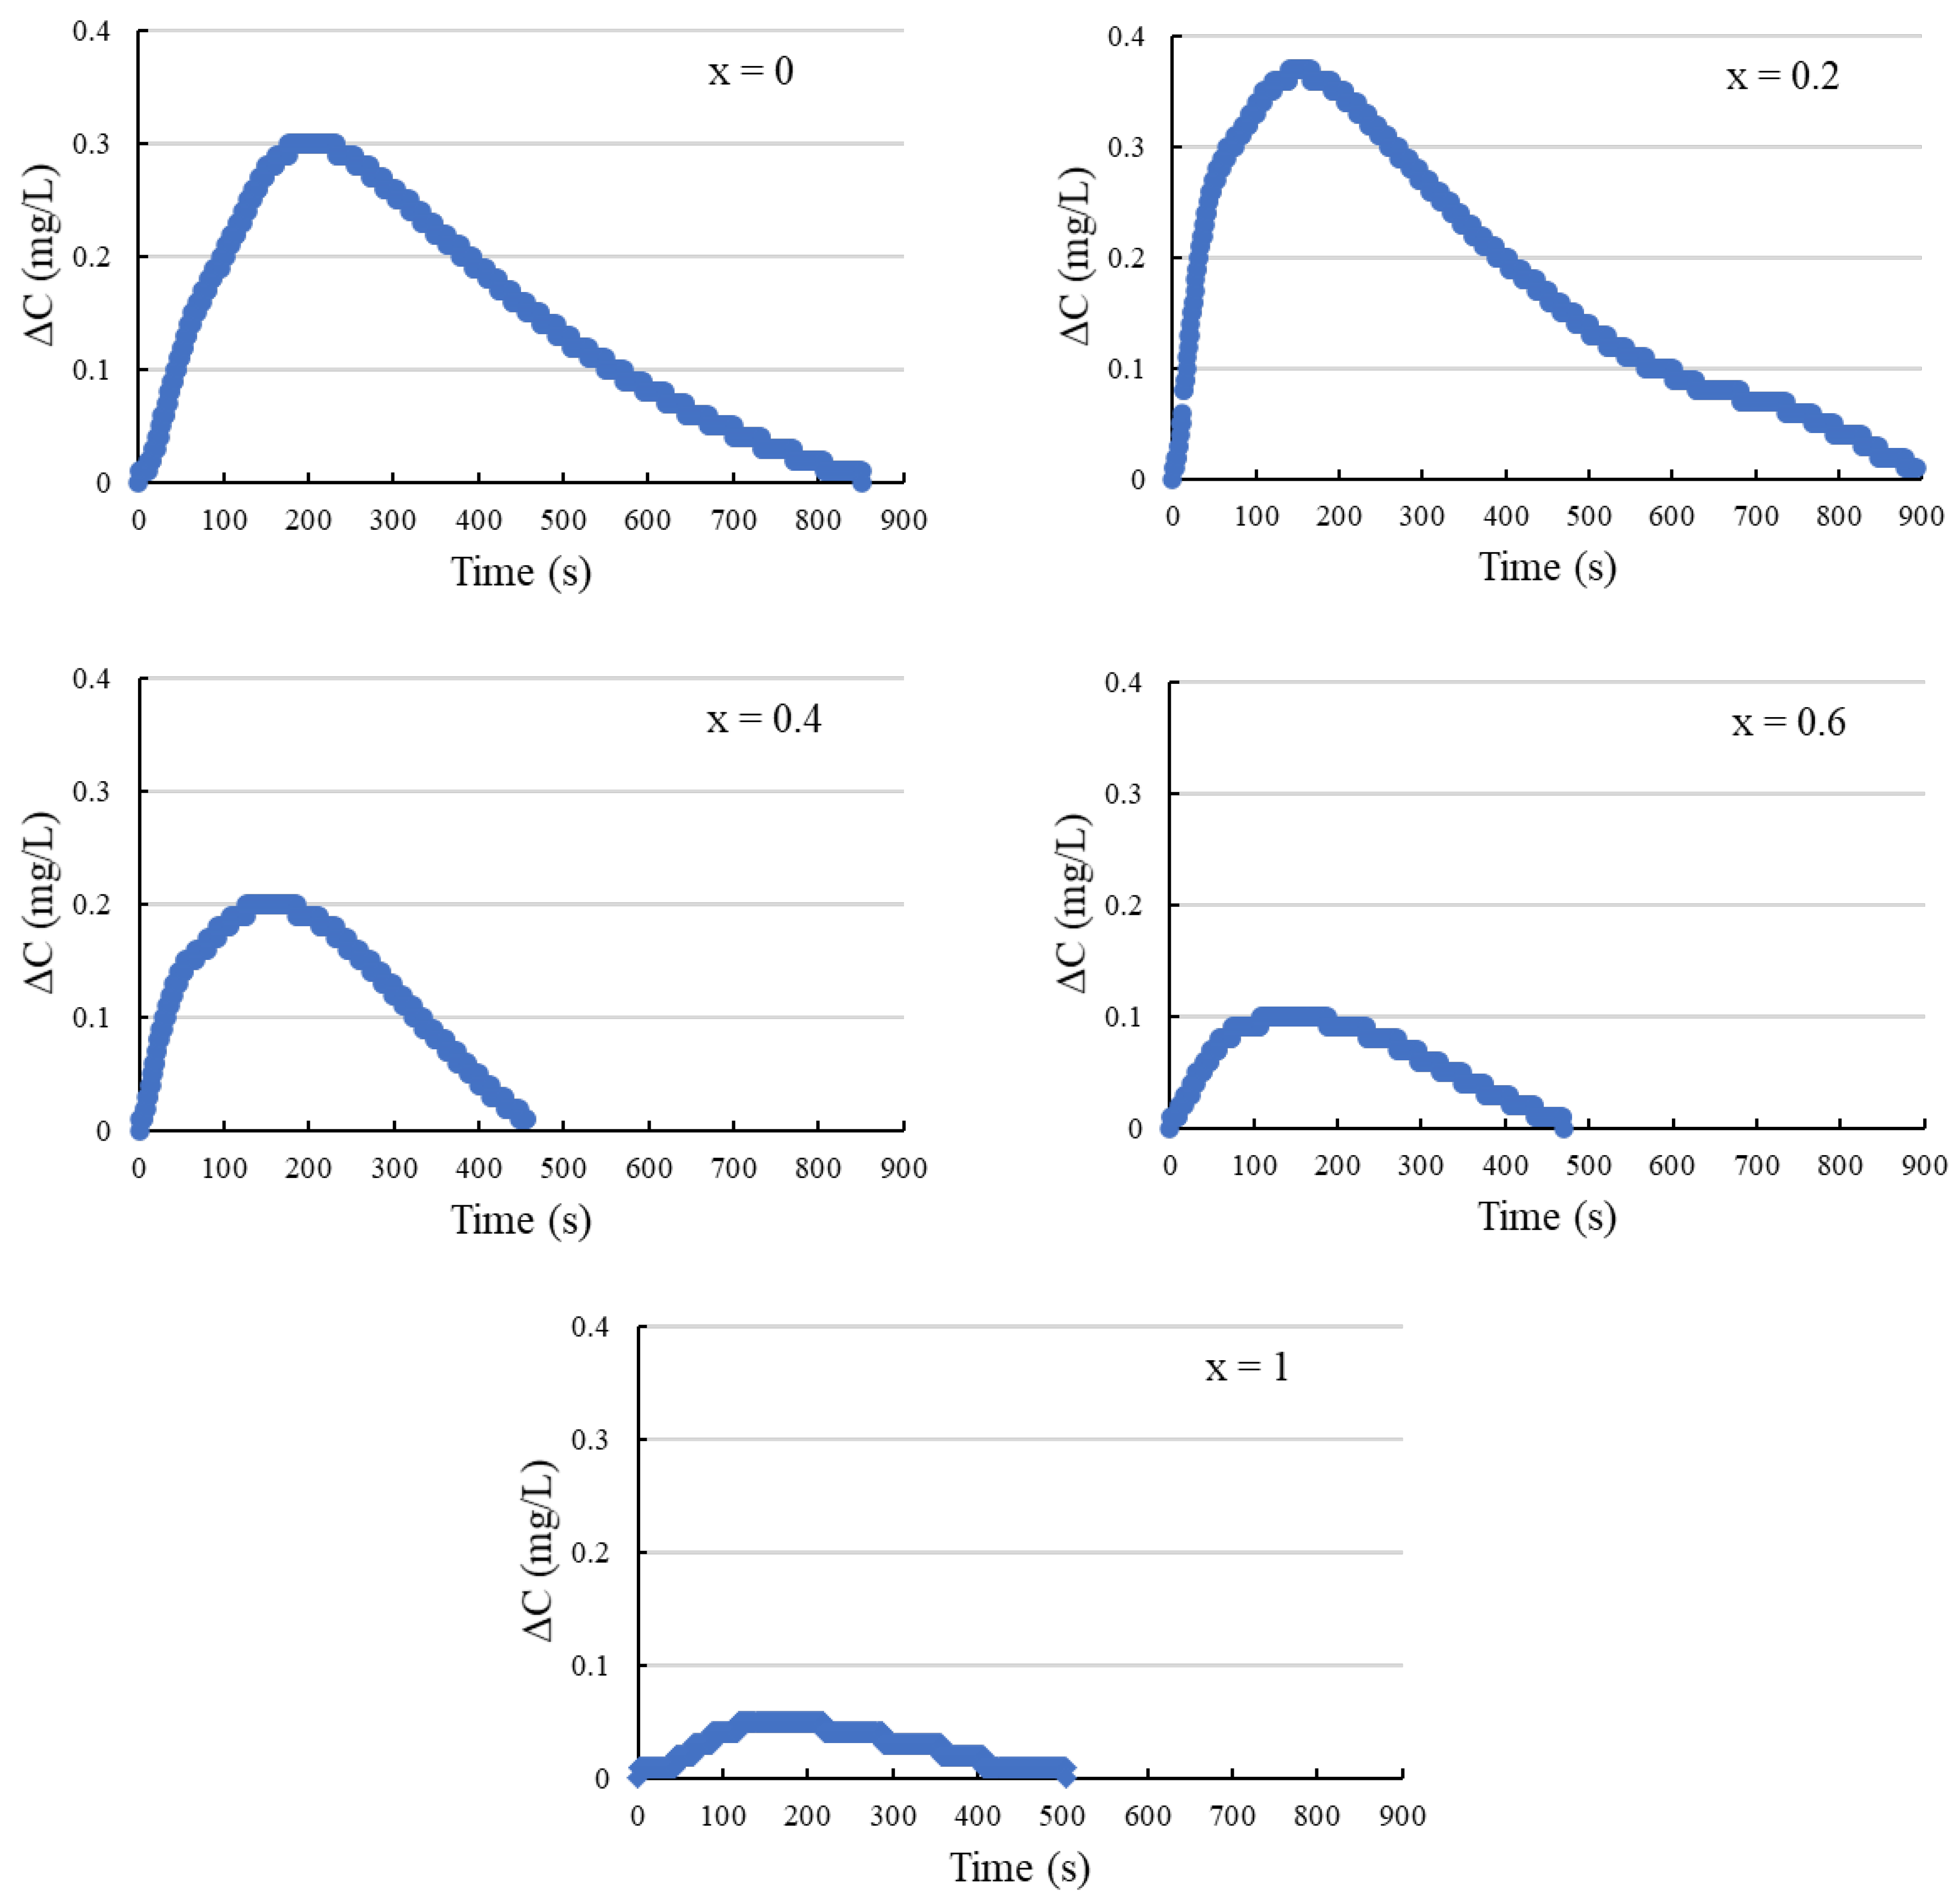
3.3. DO Method Analysis
3.4. DO Method with DE Correction
3.5. Comparison of DO Method with DE Correction and Iodometric Titration Method for Oxygen Content in Bi2Sr2−xLaxCuOy
3.6. Comparison of DO/Cl Method with DE Correction and Iodometric Titration Method for Oxygen Content in Bi2Sr2−xLaxCuOy
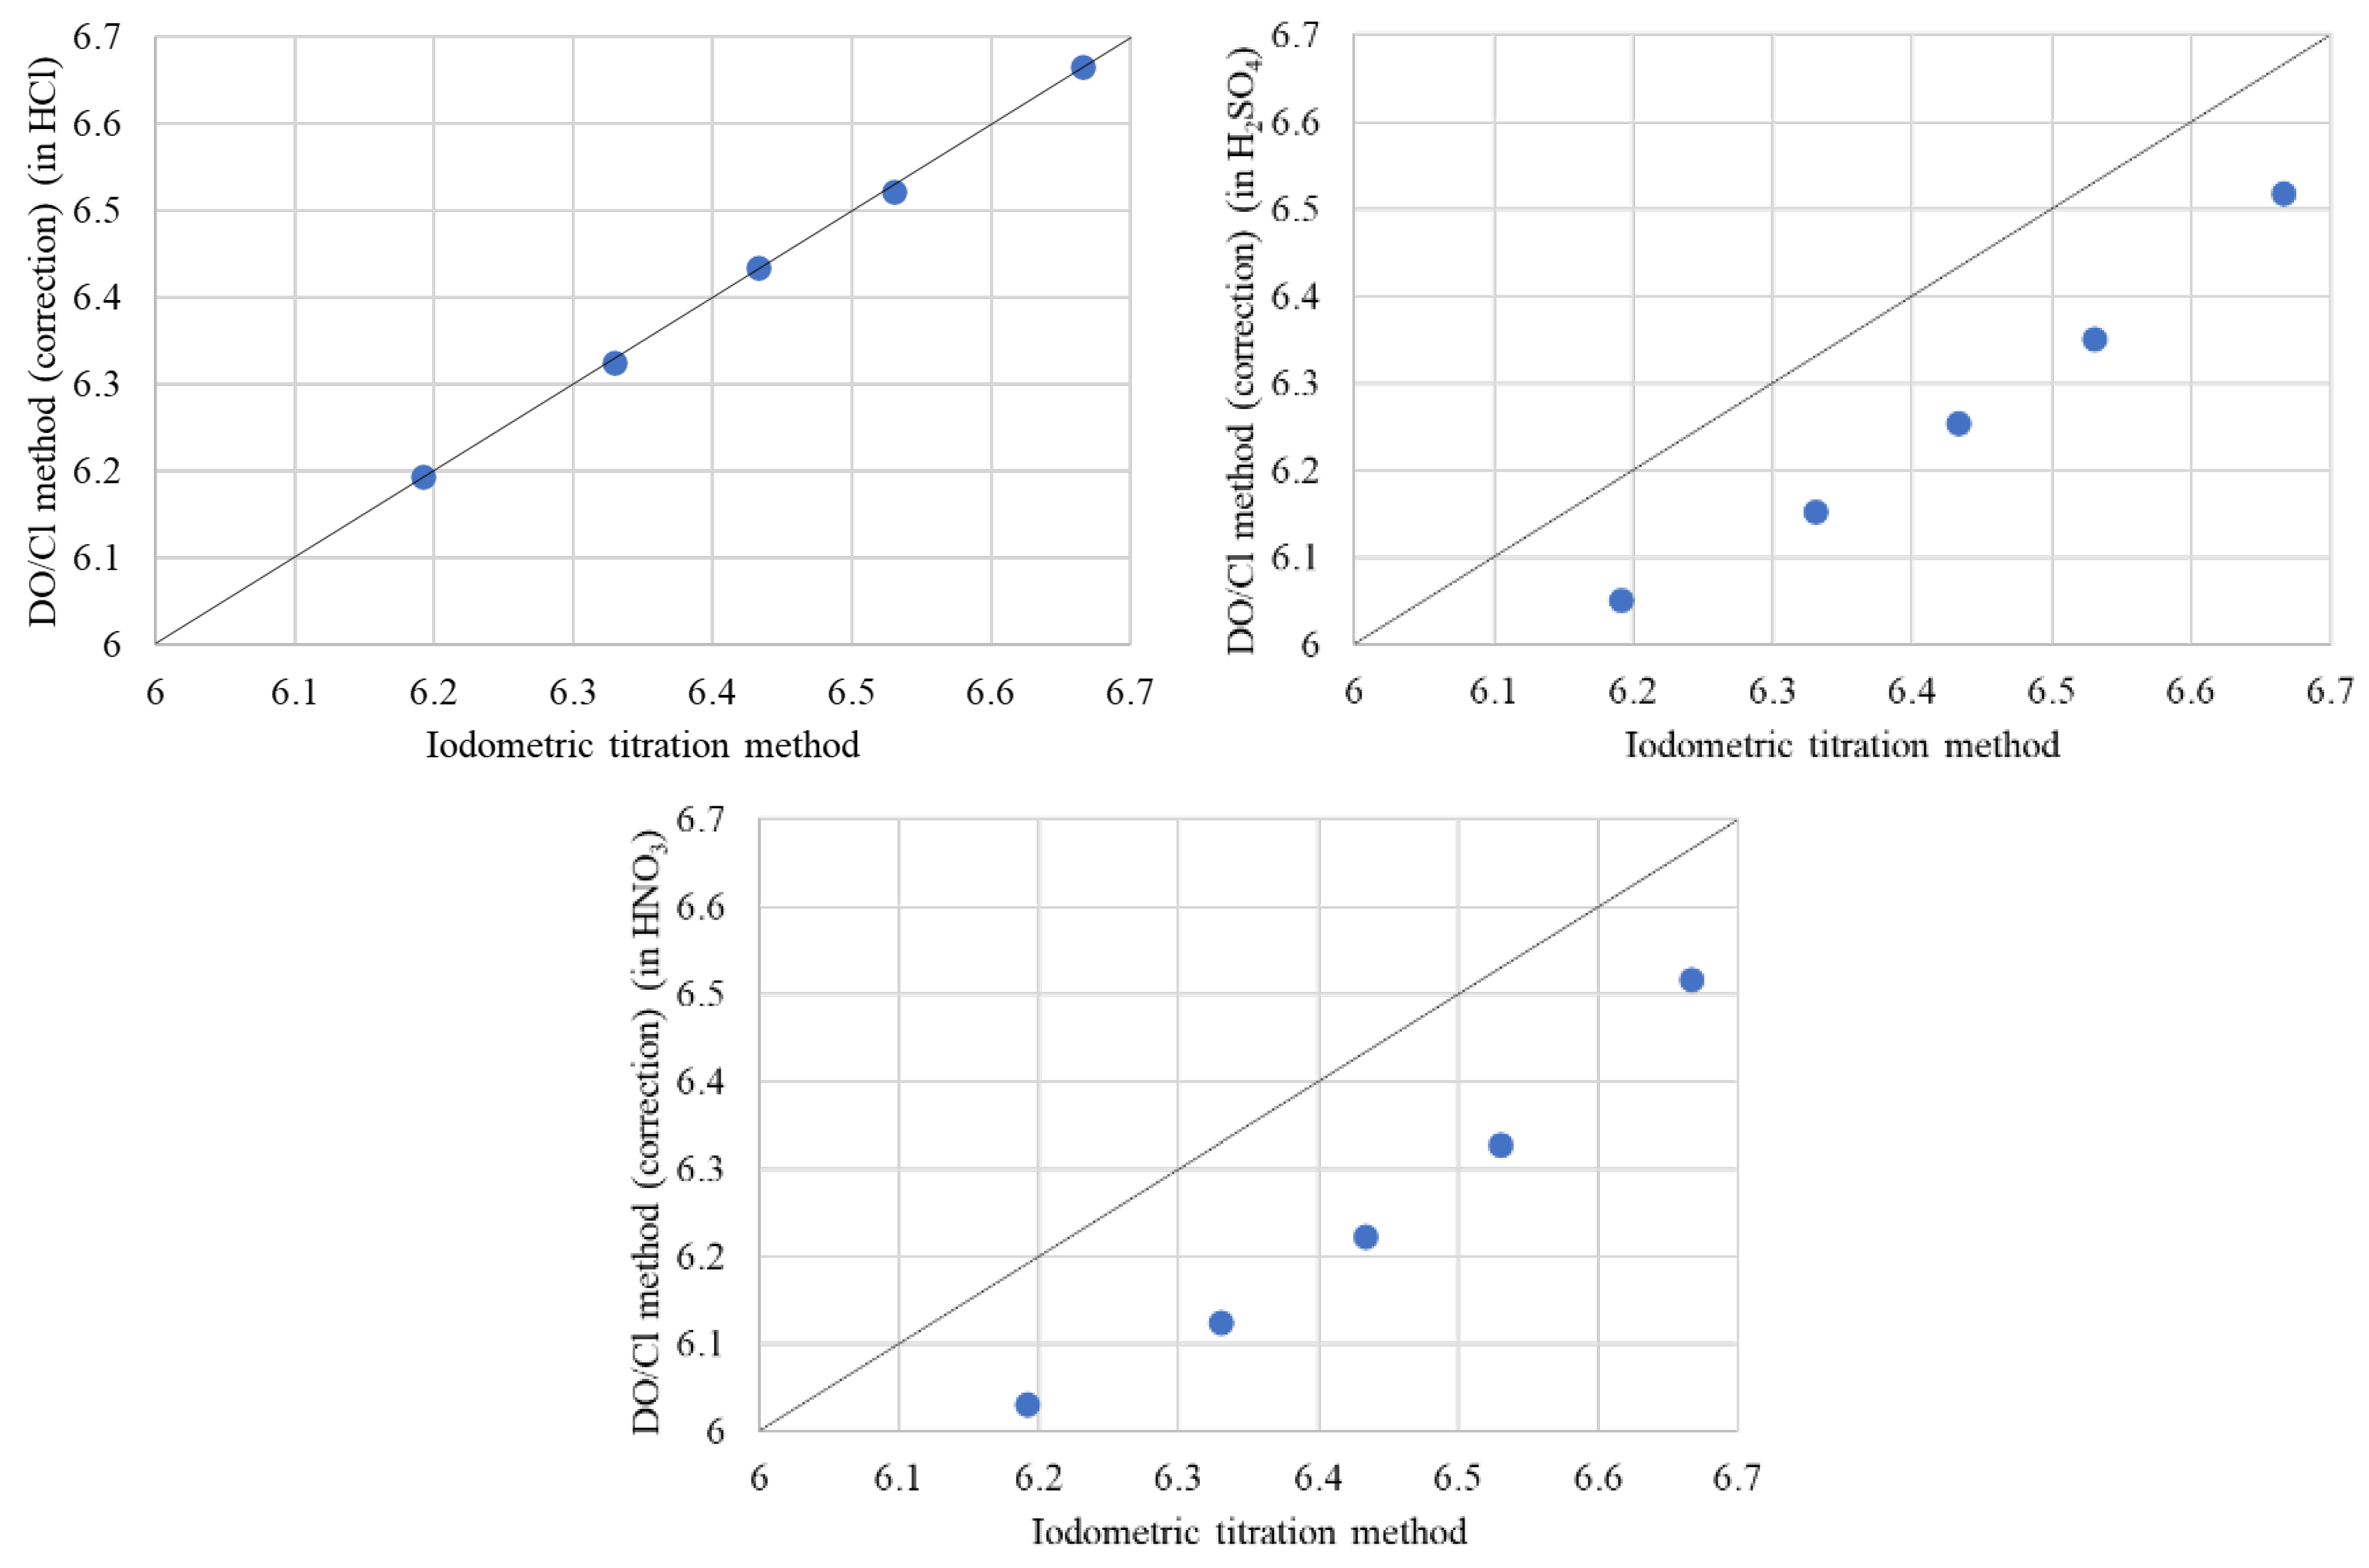
3.7. Effect of Acidic Solutions on DO/Cl Method with DE Correction
4. Conclusions
Author Contributions
Funding
Institutional Review Board Statement
Informed Consent Statement
Data Availability Statement
Conflicts of Interest
References
- Takagi, H.; Ido, T.; Ishibashi, S.; Uota, M.; Uchida, S.; Tokura, Y. Superconductor-to-non superconductor transition in (La1−xSrx)2 CuO4 as investigated by transport and magnetic measurements. Phys. Rev. B 1989, 40, 2254. [Google Scholar] [CrossRef] [PubMed]
- Cava, R.; Hewat, A.; Hewat, E.; Batlogg, B.; Marezio, M.; Rabe, K.; Krajewski, J.; Peck, W.; Rupp, L. Structural anomalies, oxygen ordering and superconductivity in oxygen deficient Ba2YCu3Ox. Phys. C Supercond. 1990, 165, 419–433. [Google Scholar] [CrossRef]
- Akimitsu, J.; Yamazaki, A.; Sawa, H.; Fujiki, H. Superconductivity in the Bi-Sr-Cu-O System. Jpn. J. Appl. Phys. 1987, 26, L2080. [Google Scholar] [CrossRef]
- Karppinen, M.; Fukuoka, A.; Niinistö, L.; Yamauchi, H. Determination of oxygen content and metal valences in oxide superconductors by chemical methods. Supercond. Sci. Technol. 1996, 9, 121. [Google Scholar] [CrossRef]
- Karppinen, M.; Matvejeff, M.; Salomäki, K.; Yamauchi, H. Oxygen content analysis of functional perovskite-derived cobalt oxides. J. Mater. Chem. 2002, 12, 1761–1764. [Google Scholar] [CrossRef]
- Chen, M.; Wang, X.; Yu, Y.; Pei, Z.; Bai, X.; Sun, C.; Huang, R.; Wen, L. X-ray photoelectron spectroscopy and auger electron spectroscopy studies of Al-doped ZnO films. Appl. Surf. Sci. 2000, 158, 134–140. [Google Scholar] [CrossRef]
- Fukuoka, A.; Tokiwa-Yamamoto, A.; Itoh, M.; Usami, R.; Adachi, S.; Yamauchi, H.; Tanabe, K. Dependence of superconducting properties on the Cu-valence determined by iodometry in HgBa2CuO4+ δ. Phys. C Supercond. 1996, 265, 13–18. [Google Scholar] [CrossRef]
- Yasukawa, Y.; Yamauchi, H.; Karppinen, M. Accurate oxygen-content determination method for decreased sample amounts of superconductive and other functional oxides. Appl. Phys. Lett. 2002, 81, 502–504. [Google Scholar] [CrossRef]
- TGA THERMOSTEP ML Operation Manual; Eltra GmbH: Haan, Germany, 2023; Volume 15, Chapter 3.
- Onishi, K.; Horiike, Y.; Yoshihara, K. Surface Analysis of Solids I; Kodansha: Tokyo, Japan, 1995; Volume 55. (In Japanese) [Google Scholar]
- Salaville, A.; Marciano, J. Oxygen, Nitrogen and Hydrogen Analyzer EMGA-930/EMGA-830: In Pursuit of High Performance, Speed and Operability; Horiba Scientific: Kyoto, Japan, 2009. [Google Scholar]
- Kurusu, K.; Takami, H.; Shintomi, K. Coulometric determination of the average valencies of copper and bismuth in the superconducting bismuth-strontium-calcium-copper-oxygen system. Analyst 1989, 10, 1341–1343. [Google Scholar] [CrossRef]
- Maeno, Y.; Teraoka, H.; Matsukuma, K. Kotai-Butsuri. Solid State Phys. 1991, 26, 235. (In Japanese) [Google Scholar]
- Wei, Y.; Kambe, S. A more accurate method to measure the oxygen content in YBa2Cu3Oy superconductors. J. Ceram. Soc. Jpn. 2023, 131, 789–796. [Google Scholar] [CrossRef]


| Target | Cu |
| Voltage | 40 kV |
| Current | 20 mA |
| Scan axis | 2θ/θ |
| Sampling angle | 0.02° |
| Scan speed | 5°/min |
| Scanning range | 3°~60° |
| Cumulative number | 1 time |
| Divergence slit width | 1/2° |
| Scattering slit width | 8.0 mm |
| Receiving slit width | Open |
| La Content (x) | Iodometric | |
|---|---|---|
| Cu Valance (v) | Oxygen Content (y) | |
| x = 0 | 2.383 | 6.191 |
| x = 0.2 | 2.459 | 6.330 |
| x = 0.4 | 2.466 | 6.433 |
| x = 0.6 | 2.460 | 6.530 |
| x = 1 | 2.331 | 6.666 |
| La Content (x) | Iodometric | DO Method | DO Method with DE Correction | DO/Cl Method with DE Correction | ||||
|---|---|---|---|---|---|---|---|---|
| Cu Valance (v) | Oxygen Content (y) | Cu Valance (v) | Oxygen Content (y) | Cu Valance (v) | Oxygen Content (y) | Cu Valance (v) | Oxygen Content (y) | |
| x = 0 | 2.383 | 6.191 | 2.056 | 6.028 | 2.101 | 6.050 | 2.387 | 6.193 |
| x = 0.2 | 2.459 | 6.330 | 2.070 | 6.135 | 2.162 | 6.181 | 2.451 | 6.325 |
| x = 0.4 | 2.466 | 6.433 | 2.038 | 6.219 | 2.190 | 6.295 | 2.469 | 6.434 |
| x = 0.6 | 2.460 | 6.530 | 2.020 | 6.310 | 2.142 | 6.371 | 2.444 | 6.522 |
| x = 1 | 2.331 | 6.666 | 2.010 | 6.505 | 2.017 | 6.509 | 2.329 | 6.665 |
| La Content (x) | Iodometric | DO/Cl Method (in HCl) | DO/Cl Method (in H2SO4) | DO/Cl Method (in HNO3) | ||||
|---|---|---|---|---|---|---|---|---|
| Cu Valance (v) | Oxygen Content (y) | Cu Valance (v) | Oxygen Content (y) | Cu Valance (v) | Oxygen Content (y) | Cu Valance (v) | Oxygen Content (y) | |
| x = 0 | 2.383 | 6.191 | 2.387 | 6.193 | 2.104 | 6.052 | 2.061 | 6.031 |
| x = 0.2 | 2.459 | 6.330 | 2.451 | 6.325 | 2.106 | 6.153 | 2.051 | 6.125 |
| x = 0.4 | 2.466 | 6.433 | 2.469 | 6.434 | 2.109 | 6.254 | 2.046 | 6.223 |
| x = 0.6 | 2.460 | 6.530 | 2.444 | 6.522 | 2.102 | 6.351 | 2.056 | 6.328 |
| x = 1 | 2.331 | 6.666 | 2.329 | 6.665 | 2.036 | 6.518 | 2.032 | 6.516 |
Disclaimer/Publisher’s Note: The statements, opinions and data contained in all publications are solely those of the individual author(s) and contributor(s) and not of MDPI and/or the editor(s). MDPI and/or the editor(s) disclaim responsibility for any injury to people or property resulting from any ideas, methods, instructions or products referred to in the content. |
© 2024 by the authors. Licensee MDPI, Basel, Switzerland. This article is an open access article distributed under the terms and conditions of the Creative Commons Attribution (CC BY) license (https://creativecommons.org/licenses/by/4.0/).
Share and Cite
Wei, Y.; Yan, C.; Kambe, S. Oxygen Measurement in Cuprate Superconductors Using the Dissolved Oxygen/Chlorine Method. Technologies 2024, 12, 115. https://doi.org/10.3390/technologies12070115
Wei Y, Yan C, Kambe S. Oxygen Measurement in Cuprate Superconductors Using the Dissolved Oxygen/Chlorine Method. Technologies. 2024; 12(7):115. https://doi.org/10.3390/technologies12070115
Chicago/Turabian StyleWei, Yuliang, Chengcheng Yan, and Shiro Kambe. 2024. "Oxygen Measurement in Cuprate Superconductors Using the Dissolved Oxygen/Chlorine Method" Technologies 12, no. 7: 115. https://doi.org/10.3390/technologies12070115
APA StyleWei, Y., Yan, C., & Kambe, S. (2024). Oxygen Measurement in Cuprate Superconductors Using the Dissolved Oxygen/Chlorine Method. Technologies, 12(7), 115. https://doi.org/10.3390/technologies12070115