Article

Roles of Micropillar Topography and Surface Energy on Cancer Cell Dynamics

Queensland Micro- and Nanotechnology Centre, Nathan Campus, Griffith University, 170 Kessels Road, Brisbane, QLD 4111, Australia
*
Authors to whom correspondence should be addressed.
Technologies 2024, 12(8), 130; https://doi.org/10.3390/technologies12080130
Submission received: 17 June 2024 / Revised: 18 July 2024 / Accepted: 8 August 2024 / Published: 10 August 2024

Abstract

:
Microstructured surfaces are renowned for their unique properties, such as waterproofing and low adhesion, making them highly applicable in the biomedical field. These surfaces play a crucial role in influencing cell response by mimicking the native microenvironment of biological tissues. In this study, we engineered a series of biomimetic micropatterned surfaces using polydimethylsiloxane (PDMS) to explore their effects on primary breast cancer cell lines, contrasting these effects with those observed on conventional flat surfaces. The surface topography was varied to direct cells’ attachment, growth, and morphology. Our findings elucidate that surface-free energy is not merely a background factor but plays a decisive role in cell dynamics, strongly correlating with the spreading behaviour of breast cancer cells. Notably, on micropillar surfaces with high surface-free energy, an increase in the population of cancer cells was observed. Conversely, surfaces characterised by lower surface-free energies noted a reduction in cell viability. Moreover, the structural parameters, such as the gaps and diameters of the pillars, were found to critically influence cellular dispersion and adherence, underscoring the importance of the microstructures’ topography in biomedical applications. These insights pave the way for designing advanced microstructured surfaces tailored to specific cellular responses, opening new avenues for targeted cancer therapies and tissue engineering.

1. Introduction

Cell adhesion and migration are crucial in cell biology and biomedical research, playing significant roles in processes such as mechanosensing, where cells detect and respond to the physical properties of their surroundings. These properties include surface morphology, texture, stiffness, and topography [1,2]. These mechanical cues are translated into biochemical signals inside the cell, influencing various cellular processes, including adhesion, migration, proliferation, and differentiation [3,4].
Cells within tissues establish adhesion and communication with their surrounding extracellular environment through specific cell–cell and cell–extracellular matrix interactions [5]. The initial recognition of surface topography’s impact was credited to Harrison and led to the development of contact guidance principles [6,7]. Since then, topographical attributes have been harnessed as signals to steer the alignment and proliferation of cells.
Cell adhesion is a critical regulator of cellular behaviour, with cells sensing their surroundings through ion channels and receptors located on their membranes [8]. Cancer cells and their microenvironment interaction profoundly influence disease progression and treatment outcomes. Microstructured surfaces have recently emerged as promising platforms to modulate cellular behaviour in various biomedical applications such as drug discovery and tissue engineering [9,10,11].
Various methods for creating patterns and applying selective chemical modifications across different length scales can produce biocompatible surfaces [12,13,14,15,16,17,18]. These surfaces can control cellular interactions within micro- and sub-micrometre dimensions, mimicking the organisation of cells [1]. Numerous studies have explored the fundamental principles of cell-surface interactions and have detailed cellular responses to various substrate topographical patterns [19,20,21,22,23,24,25,26,27,28,29,30,31,32,33].
Exploring how cells respond to surfaces featuring micrometre-scale topographical variations has involved using diverse natural and synthetic substrates. These investigations have revealed that such structured surfaces can induce cell polarisation, guide cell migration, and potentially influence gene expression and cellular signalling pathways. For example, Antmen et al. showed that breast cancer cells exhibit increased deformability when subjected to micropatterned surfaces [34]. For instance, Jungbauer et al. demonstrated how cellular shape regulation is influenced by structured surfaces [35]. Understanding the intricate relationship between the behaviour of breast cancer cells and the apparent surface-free energy (SFE) of microstructured surfaces offers a novel perspective in deciphering the molecular mechanisms governing cancer progression. It holds immense potential for advancing the development of targeted therapies and precision medicine.
The influence of surface wettability and chemical composition on cell adhesion and protein adsorption onto a substrate is a widely recognised phenomenon [36,37,38,39]. Alves et al. observed the interaction of bone marrow-derived cells with these poly(L-lactic acid) surfaces and concluded that their superhydrophobic nature notably impacted cell culture [40]. These textured surfaces hinder cell adhesion and growth to a greater extent than a smoother surface. Song et al. proved that with oxygen plasma treatment, the hydrophilicity of the substrate increases and enhances cell attachment [41]. While substantial research has been conducted on cell-material interactions, the relationship between breast cancer cell behaviour and the apparent SFE of microstructured substrates remains unexplored [42,43]. Apparent SFE, a fundamental physicochemical property characterising the interaction between materials and cells, is crucial in determining cellular adhesion and dispersion. Notably, Majhy et al. explored the impact of surface energy on cell adhesion and growth using HeLa and MDA-MB 231 cancer cell lines [44]. Expanding upon these findings, our study adopts a novel approach by explicitly examining how variations in micropillar gaps, diameters, and SFE impact cell behaviour. This research provides fresh insights into how different microtopographies influence cell dispersion, assembly, and free spreading, extending the investigation scope beyond merely surface energy.
Building on our pioneering research, we continue to explore the impact of microstructured surfaces on cellular dynamics and microfluidic applications [45]. Our investigations have ranged from evaluating the mechanical properties of micropillar and microhole arrays in microfluidic channels [46,47] to the development of novel microfluidic devices integrating electrospun membranes for advanced cell culture applications [48]. This work underscores the importance of surface design in manipulating cellular environments and its potential in biomedical engineering and diagnostic applications. Further, we have advanced the understanding of how microscale texturing can influence cell adhesion and migration, which is crucial for applications in tissue engineering and regenerative medicine [49]. Complementing these studies, we explored three-dimensional modelling of avascular tumour growth within both static and dynamic culture platforms, which provided insights into how microenvironments can be engineered to influence tumour development and treatment outcomes [50].
These studies have laid the groundwork for our current investigation into the roles of micropillar topography and surface energy on the dynamics of cancer cells, emphasising the design of microenvironments that mimic physiological conditions more closely than ever before. The controlled microenvironments created by pillar arrays simulate the extracellular matrix, offering insights into cell spreading, proliferation, and migration.
To the best of our knowledge, this study is the first to explore the relationship between the apparent SFE of hydrophobic micropillar surfaces and the behaviour of breast cancer cells, marking a significant advancement in understanding cancer cell microenvironment interactions. This constitutes the primary focus of our current research endeavour. To achieve this objective, we fabricated various micropillar surfaces based on polydimethylsiloxane (PDMS) and assessed their wettability by measuring both apparent SFE and contact angles. Next, we observed the behaviour of breast cancer cells and their morphology on these microstructured surfaces. Understanding these unique microenvironment interactions could pave the way for innovative breast cancer therapies, including tailored drug delivery systems and personalised treatments.

2. Materials and Methods

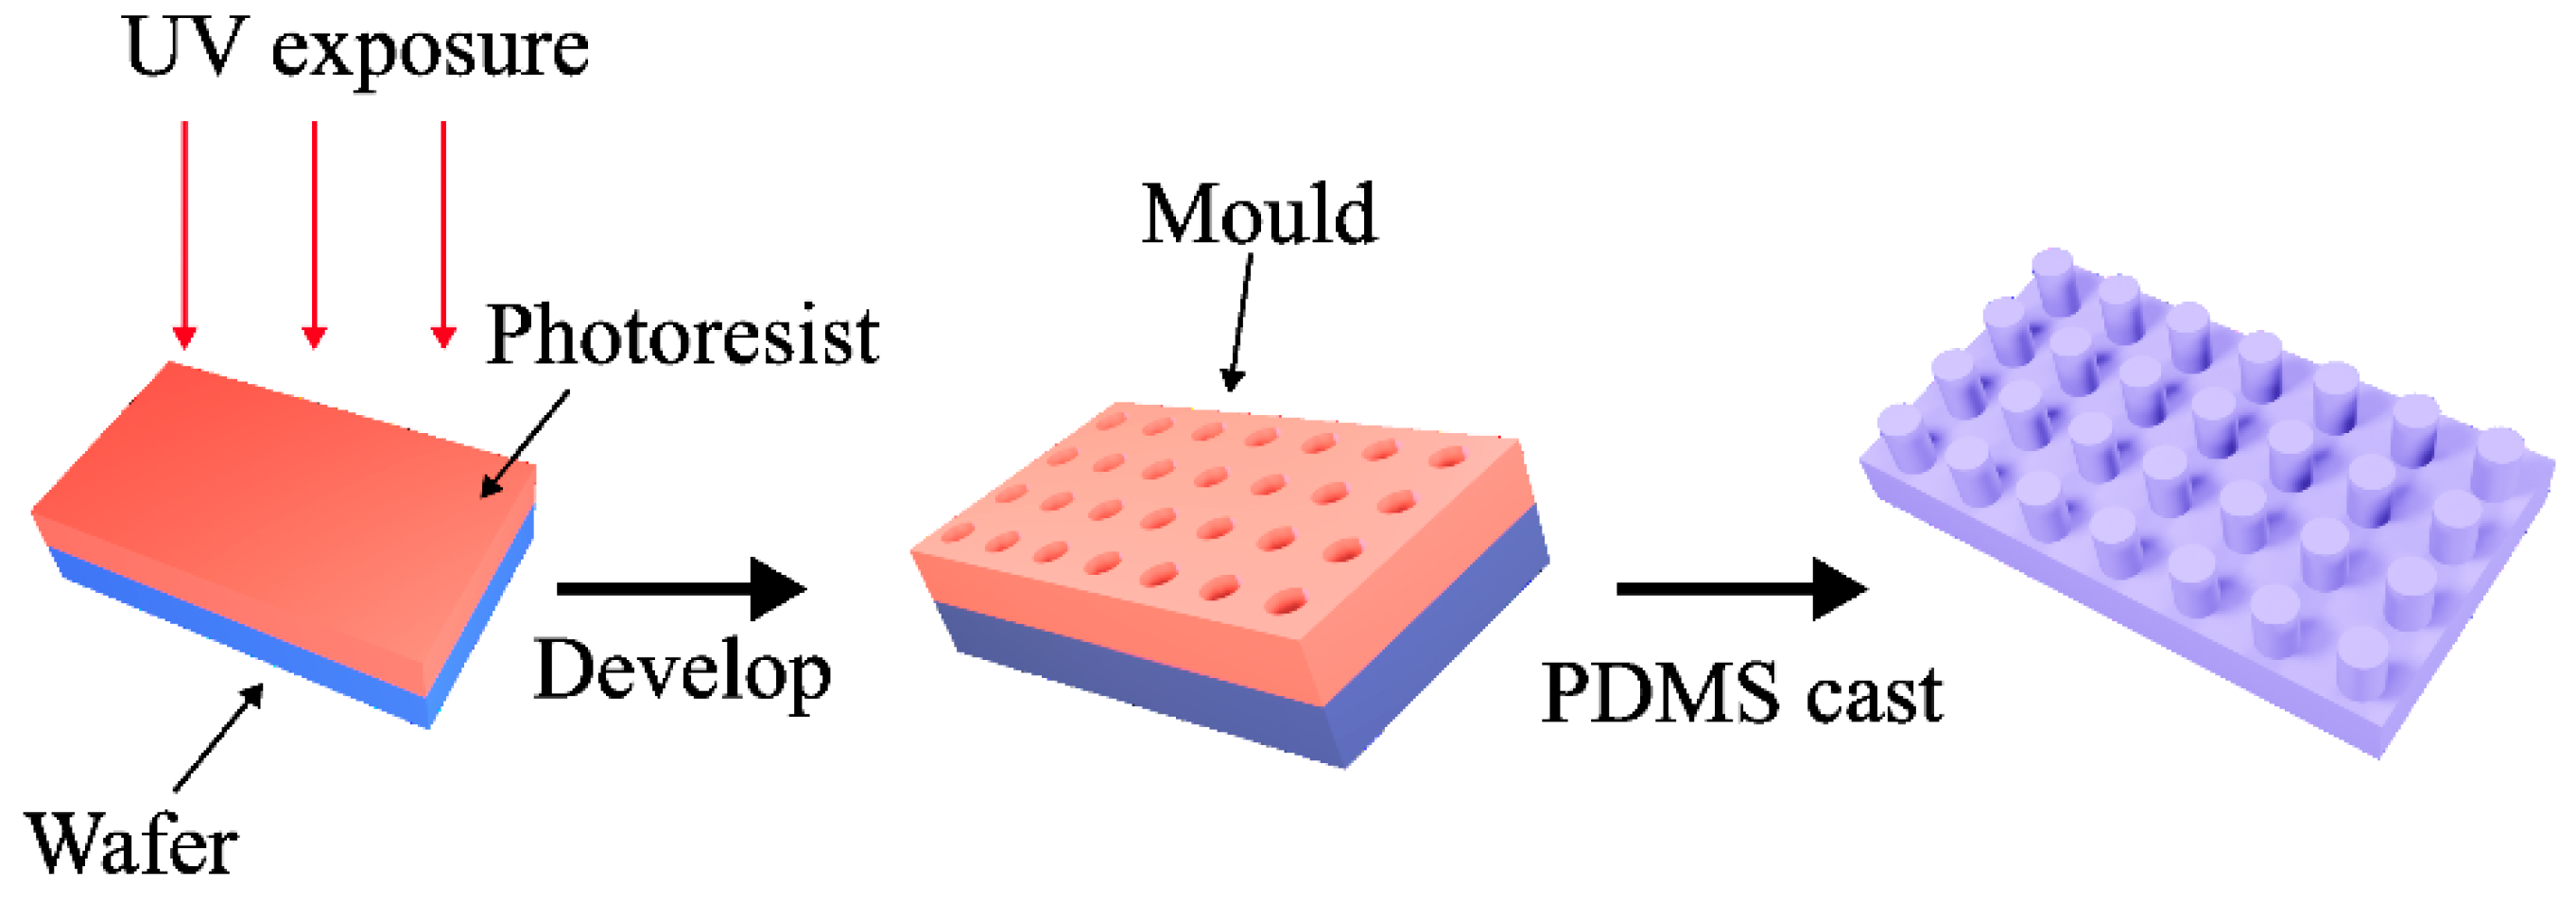
2.1. Fabrication of the Mould

Figure 1 depicts the process of creating micropillars of uniform circular shape with diameter (L), gap (G), and height (H = 10 µm) using conventional soft lithography. The procedure was explained in detail in our previous work [51].
To ensure consistent surface properties, the PDMS samples were prepared using a standardised protocol. The PDMS prepolymer and curing agent (Sylgard 184, Dow Corning, Midland, MI, USA) were mixed at a 10:1 ratio, degassed under vacuum to remove air bubbles, and poured into moulds. The samples were cured at 70 °C for 2 h. During post-curing, the samples were stored in a desiccator at room temperature to prevent exposure to moisture and contaminants. Prior to experiments, the PDMS surfaces were sterilised with 80% ethanol and UV irradiation for 30 min.
The surface between the pillars is flat PDMS. Both the micropillared PDMS and the flat PDMS control were fabricated using the same batch of PDMS prepolymer and curing agent. The flat PDMS was cast on a flat photoresist substrate to ensure consistency. This approach ensures that any differences in cell behaviour are attributable to the topographical features rather than variations in the surface properties of the PDMS.

2.2. Cell Culture

MDA-MB-231 human breast cancer cells were cultured in DMEM/F12 (Dulbecco’s Modified Eagle Medium/Nutrient Mixture F-12) medium (Gibco, Thermo Fisher Scientific, Waltham, MA, USA). These media contained 5% foetal bovine serum (FBS) and antibiotics (1% penicillin/streptomycin) (Life Technologies, Grand Island, NY, USA). Cells were maintained at 37 °C and 5% CO2 in a humidified incubator and detached from the culture dish by trypsin prior to the experiment. The PDMS sample was sterilised with 80% ethanol, followed by ultraviolet (UV) irradiation for 30 min. Subsequently, the sample was washed (3×) with sterile 1× Hank’s balanced salt solution (HBSS). Before cell seeding, the PDMS membrane was treated with 3 mL of DMEM-F12 medium and incubated at room temperature for one hour to further enhance its biocompatibility. Once the cells reached 80% confluence, they were harvested from the flasks and counted with a hemocytometer. In total, we seeded 50,000 cells onto the PDMS surface. The cells were placed inside the incubator for 4 days to optimise their adhesion and growth on the patterned surface.

2.3. Quantification and Detection of MDA MB-231

To quantify the number of viable cells in the experiment, first, the cells were detached from the PDMS and collected by centrifugation. The collected cells were added to 96-well plates. A cell counting kit (AbcamTM WST-8, Abcam, Waltham, MA, USA) dye was introduced into the test sample to determine the cell count. The dye is designed to undergo a colour change in the presence of metabolically active cells. Following the addition of the dye, the test sample was incubated for 4 h at 37 °C, and the absorbance was measured at 460 nm. Each experiment was performed in triplicate, with three independent replicates for each micropillar surface configuration to ensure statistical reliability. The total PDMS surface area used for calculation was 4.25 cm2.
We performed a quantitative analysis of the fluorescence images using ImageJ (version 1.54d) to support our observations regarding cell spreading patterns. We analysed the cell spreading patterns by measuring the area occupied by the adhered cells and dividing it by the total surface area.

2.4. Statistical Analysis

Statistical analysis for all experiments was conducted using Microsoft Excel (version 2405, Microsoft, Redmond, WA, USA). The data presented represent the mean values obtained from three independent repetitions. We employed Student’s t-test to determine the associated p-values. Results were considered statistically significant when the calculated p-values were below 5%. The p values were obtained using Student’s t-test: (*): p ≤ 0.05; (**): p ≤ 0.005; (***): p ≤ 0.0005; and (****): p ≤ 0.0001. The error bars show the standard deviations of the experiments (n = 3).

2.5. Immunofluorescence Staining

We employed conventional immunofluorescence staining techniques to examine the actin filaments and cell nuclei on the PDMS membrane. The cells were first fixed with 4% paraformaldehyde (PFA) for 15 min, followed by washing with HBSS (3×). Next, the cells were stained with ActinGreenTM 488 (Thermo Fisher Scientific) and NucBlueTM ReadyProbeTM reagents (Thermo Fisher Scientific) and kept for incubation at room temperature for 30 min (based on the manufacturer’s recommendations). Finally, the stained cells were washed with HBSS (3×) and kept in DMEM-F12 medium at 4 °C.

2.6. Fluorescence Microscopy

We took the PDMS membrane containing the stained cells (the immunostaining procedure is explained in the previous section) and placed it directly onto a microscope slide. A fluorescent microscope (Nikon Eclipse Ti2, Tokyo, Japan) was used to capture the images of the actin fibres and nuclei of the cells. We used Image J 1.47v (National Institutes of Health, Bethesda, MD, USA) for subsequent image processing.

2.7. Contact Angle Measurement

Wettability, which signifies how a surface interacts with a liquid, can be assessed by measuring contact angles (CA). The procedure was explained in detail in our previous work [51].

2.8. Surface Free Energy Measurement

The apparent SFE, representing the apparent surface tension of the solid surface, was determined using the Owens, Wendt, Rabel, and Kaelble (OWRK) approach to the contact angle values [52,53,54]. SFE is an intrinsic property of surfaces, defined with respect to their ideal, flat state. Surface roughness does not impact SFE [55]. A superhydrophobic surface is characterised by its heterogeneity, consisting of two components, air and solid. These components interact with liquids that come into contact with the surface. Consequently, even for surfaces that conform to the widely used Wenzel and Cassie–Baxter models for characterising wettable and non-wettable surfaces, respectively, establishing the SFE is a complex task. To address this issue, the term “normalised surface free energy (NSFE)” was introduced as a solution [55]. The NSFE predicts how different liquids will behave when they come into contact with actual surfaces. A detailed calculation and explanation of the NSFE were provided in our previous paper [51].
The selection and explanation of measured liquids were mentioned in our previous work [51].

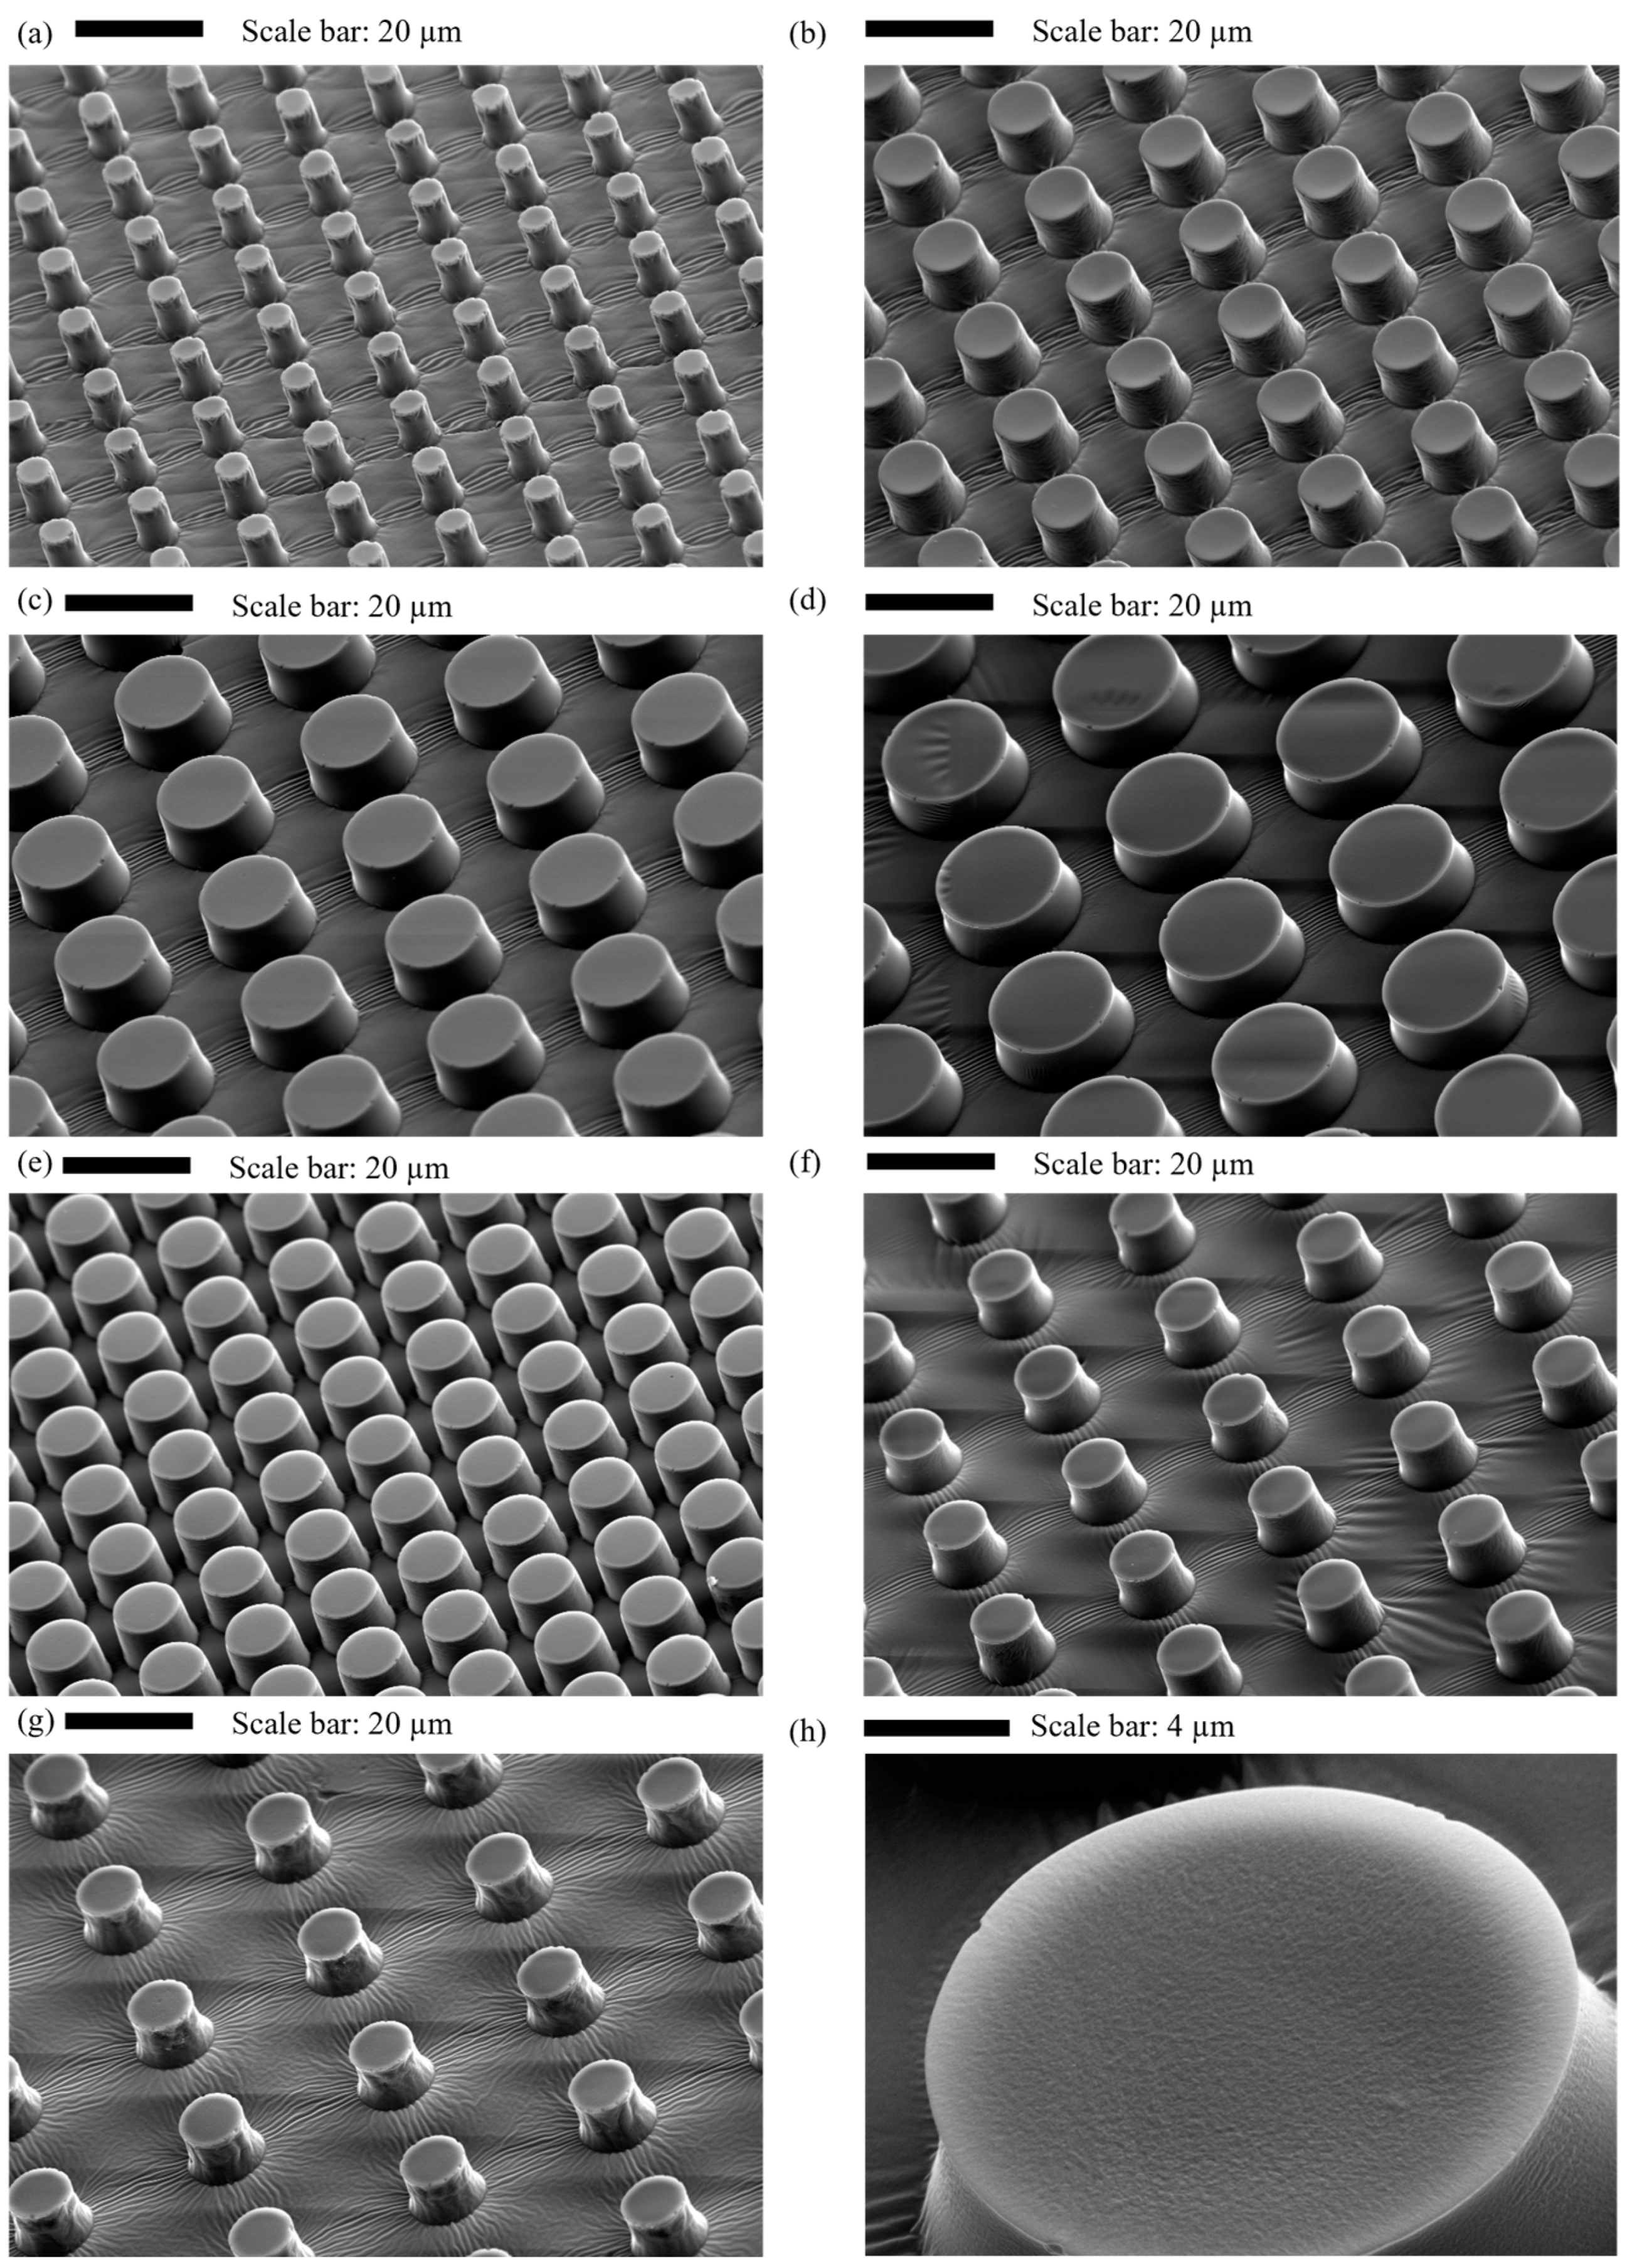
2.9. Characterisation of Micropillar Surfaces

The pattern qualities, including pattern shape, size, and surface topology, were inspected by scanning electronic microscopy (SEM). Our findings demonstrate that the fabricated micropillars closely match the intended design with minimal deviation. Table 1 summarises all geometrical parameters of these pillar structures.
Figure 2 indicates the successful fabrication of the PDMS samples with micropillars on top of the surface. Figure 2a,b show representative scanning electron microscopy (SEM) images of the array of PDMS cylindrical micropillars, having a diameter of ~5 µm, a gap of ~10 µm, and a height of ~10 µm. Figure 2c,d display SEM images of the PDMS array, having a diameter of ~20 µm, a gap of ~10 µm, and a height of ~10 µm. These images indicate that these PDMS arrays are well-defined with high accuracy and display defect-free order in extensive areas.

3. Results and Discussion

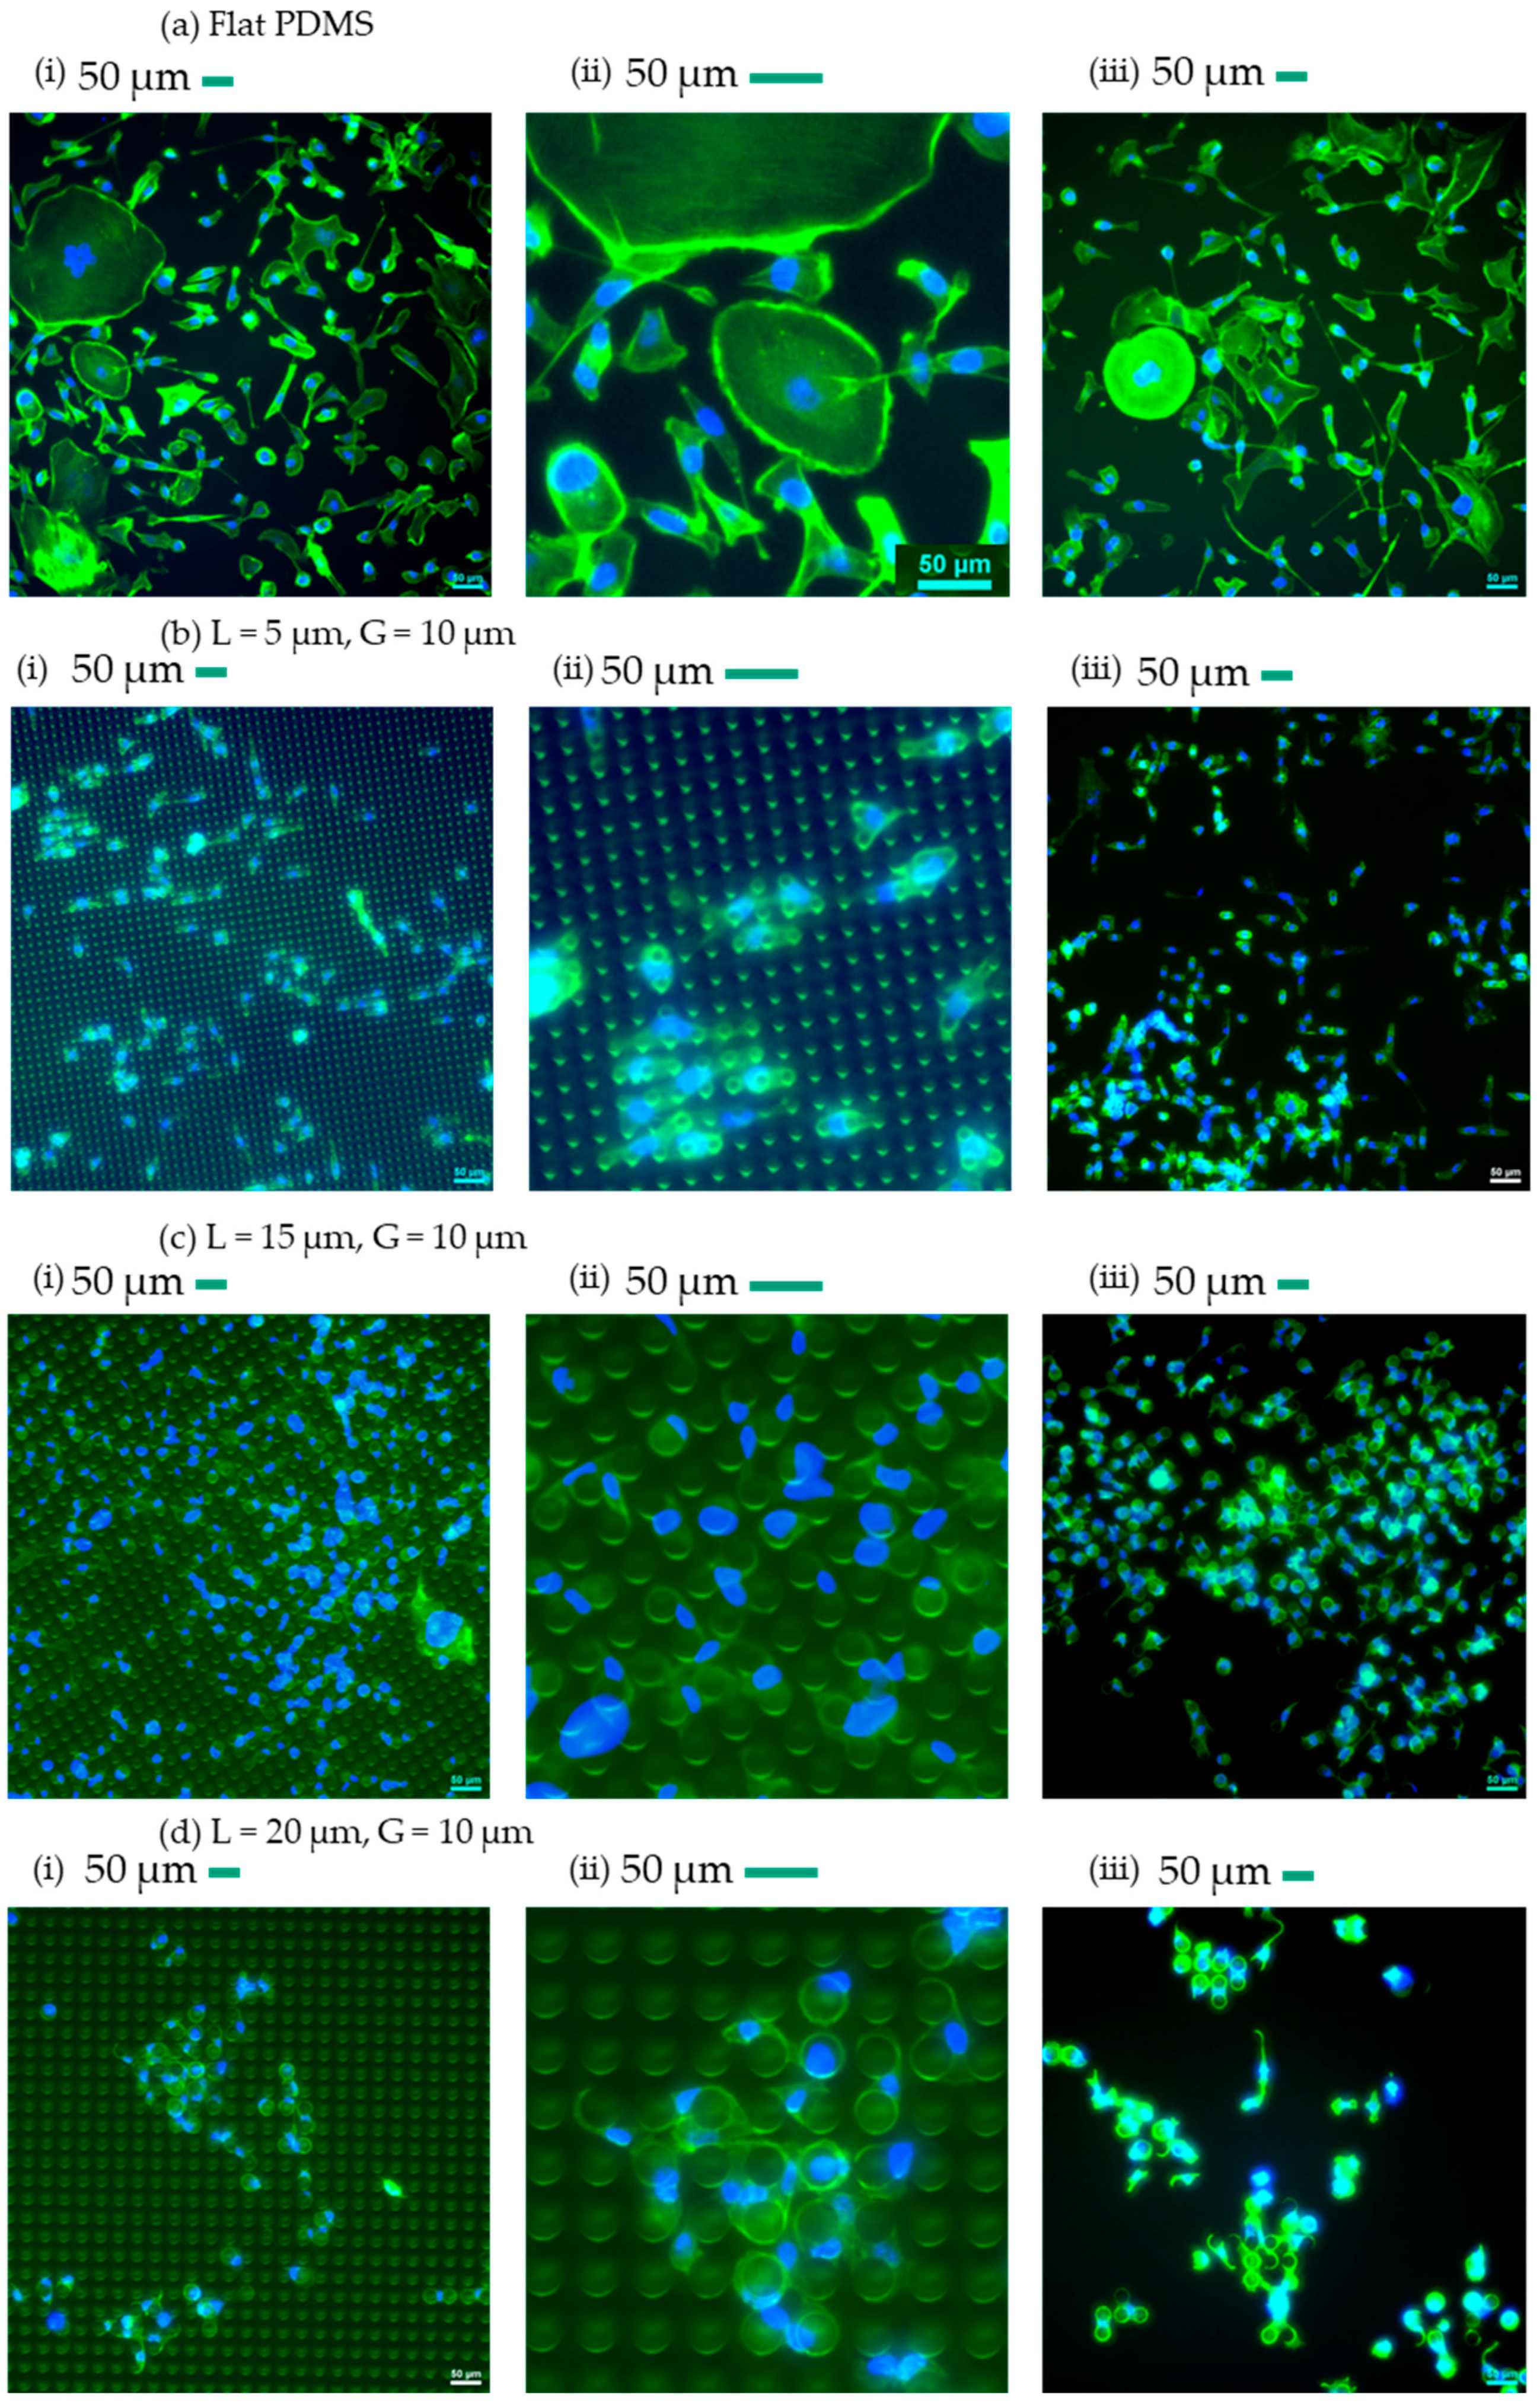
3.1. Qualitative Analysis of Cells’ Behaviour on Micropillars

Mechanosensing and mechanotransduction allow cells to detect and respond to the mechanical and topographical signals in their surrounding environment [56]. Mechanotransduction is a critical process through which cells convert mechanical signals from their environment into biochemical signals [57]. This process not only affects cellular adhesion and migration but also extends to the regulation of nuclear mechanosensing, which plays a significant role in modulating gene expression and determining cell phenotype. This process involves cell surface receptors like integrins sensing mechanical cues from the extracellular matrix (ECM), cytoskeletal dynamics transmitting mechanical forces to the nucleus, and the LINC (linker of nucleoskeleton and cytoskeleton) complex facilitating signal transfer. The nucleus responds through mechanisms such as chromatin remodelling, alterations in nuclear envelope proteins like lamin A/C, and the activation or translocation of transcription factors (e.g., YAP/TAZ), leading to changes in gene expression. Mechanotransduction influences gene activation, repression, and phenotype determination, as mechanical signals can direct stem cell differentiation and induce epigenetic modifications. We present a qualitative analysis of the behaviour of cells on micropillar surfaces. We aim to observe and describe how breast cancer cells interacted with these microscale structures. This qualitative analysis provides valuable insights into the initial response of cells to varying surface properties. The distribution of cells on micropatterned surfaces is significantly influenced by two factors: space constraints and adhesion induction mechanisms. These factors play a critical role in determining how cells adhere, proliferate, and spread in different geometrical patterns [56,58,59]. The first mechanism, space constraint, can direct cells’ behaviour in different ways: geometrical confinement, cell–cell interactions, migration, and proliferation. Firstly, cells on micropatterned surfaces experience physical confinement, which can influence their shape and size. Confinement to smaller areas can lead to higher cell density and force cells to adopt more compact morphologies. Conversely, larger patterned areas allow for more extensive spreading and lower cell density. Secondly, the limited space on micropatterned surfaces can enhance cell–cell interactions, promoting collective behaviours such as synchronised movement and communication through gap junctions. This can affect overall cell distribution and organisation. Thirdly, space constraints can restrict the migration of cells, confining them to specific regions and influencing their proliferation rates. Cells may preferentially proliferate in areas with adequate space, leading to uneven distribution. The second mechanism, cell adhesion to micropatterned surfaces, can occur through various mechanisms, primarily influenced by the pattern’s geometry and surface characteristics. Firstly, the stress fibre-based adhesion mechanism involves the formation of actin stress fibres and focal adhesions. Stress fibres are bundles of actin filaments that span across the cell, providing structural support and generating contractile forces [60]. Focal adhesions are complex assemblies of proteins where integrins cluster and link the extracellular matrix (ECM) to the actin cytoskeleton. They serve as anchor points for the cell, transmitting mechanical signals and regulating cell signalling pathways. Cells adhering via this mechanism tend to form strong, stable attachments to the substrate, which can support cell spreading and migration [56,58,59]. Patterns that promote the formation of focal adhesions, such as ridges or grooves aligned with the cell’s axis, can induce robust stress fibre-based adhesion. A pseudopodia-based adhesion mechanism allows cells to explore their environment and adhere transiently. This type of adhesion is common on surfaces with smaller features or irregular patterns, promoting frequent formation and pseudopodia retraction. Cells using pseudopodia-based adhesion tend to exhibit more exploratory behaviour and dynamic movement. Figure 3 and Figure 4 present the fluorescence imaging of the cells and the pillars on the surface. Furthermore, Figure 3 and Figure 4 also show the fluorescence imaging of the cells’ dispersion and assembly. In these figures, fluorescence imaging is used to illustrate the presence and distribution of cells on the surface. Additionally, the figures allow for a clear view of the micropillars integrated into the surface. This visual information is valuable for understanding how cells interact with the microstructured surface and how their distribution may vary depending on specific surface characteristics. Figure 3 and Figure 4 enhance the comprehensibility of the experimental setup and its outcomes. Using Figure 3 and Figure 4, we also examined the cell spreading patterns on these structures.
Upon close examination, we observed that breast cancer cells exhibited distinct adhesion and spreading patterns on the micropillar surfaces (Figure 3 and Figure 4). We examined the growth of breast cancer cells on flat PDMS as a control sample (Figure 3a). The observed behaviour of cells on surfaces featuring micropillars with varying gap sizes provides valuable insights into the influence of topographical cues on cell dispersion and assembly. The results demonstrated a distinct trend: cells tend to disperse individually on surfaces with smaller pillar gaps and diameters, while they exhibit a propensity to assemble on surfaces with larger pillar gaps and diameters (Figure 3 and Figure 4 at 50× magnification). Remarkably, cells on flat PDMS are observed to spread freely without encountering physical barriers or confinement. This observation suggests a significant correlation between surface topography and cell behaviour.
The phenomenon of cells dispersing individually on surfaces with smaller pillar gaps and larger diameters can be attributed to several factors. First, reduced inter-pillar spacing may restrict cell–cell interactions, limiting the opportunity for cells to cluster or assemble. The confined spaces between closely spaced pillars can discourage cell aggregation, forcing them to adhere individually. Moreover, the smaller gaps may exert physical constraints on the cells, preventing them from forming cohesive groups or colonies. It is also plausible that the limited space within smaller gaps hinders the establishment of cell–cell junctions and communication, further promoting isolated cell adhesion. In the meantime, larger pillar diameters restrict the space available for cell spreading and adhesion. Cells on larger pillars may experience altered mechanical stress distributions, impacting signalling pathways related to cell growth and division. Higher cell density around larger pillars may result in contact inhibition, signalling cells to slow down or stop proliferating to prevent overcrowding. This limitation impedes the establishment of extensive cell adhesions. Cells may encounter physical barriers that hinder their capacity to bridge the gaps between pillars and form extensive adhesions.
Cells may rely more on pseudopodia on these highly confined surfaces for adhesion. The small gaps necessitate frequent formation and retraction of pseudopodia as cells explore their environment and attempt to navigate the tight spaces. This dynamic, transient adhesion mechanism supports individual cell movement and dispersion rather than collective assembly. Increased space allows cells to extend stress fibres and form robust focal adhesions, promoting cell assembly and enhanced adhesion strength. Cells have additional space to extend protrusions, make contact with neighbouring cells, and create cell–cell adhesions. The increased inter-pillar spacing facilitates the formation of cellular clusters or colonies, fostering a more cooperative environment for cell assembly. The reduced physical confinement in larger gaps allows cells to establish intercellular connections and potentially engage in cooperative behaviours, such as collective migration or multicellular coordination. The presence of sufficient space allows cells to organise into clusters, where stress fibre-based adhesion predominates and strengthens the collective behaviour. Significantly, in the case of flat PDMS with smooth and non-topographical surfaces, cells extended their shapes and dispersed freely without any spatial confinement (Figure 5). Flat PDMS surfaces do not present any physical barriers or confinements to cells. This lack of topographical features allows cells to spread and migrate freely without encountering spatial constraints. Cells can explore the surface extensively, leading to a more even and unconfined distribution. On flat surfaces, cells are free to form focal adhesions and stress fibres uniformly across the substrate. This unrestricted adhesion supports widespread cell spreading and proliferation, as patterned structures do not limit cells. The even distribution of adhesion sites on the flat PDMS facilitates homogeneous cell behaviour across the surface.
Surface free energy is known to influence cell adhesion and proliferation through mechanisms involving integrin-mediated signalling pathways and focal adhesion formation. Studies have shown that higher surface free energy can enhance integrin clustering and activation, leading to increased focal adhesion activity and downstream signalling that promotes cell adhesion and proliferation [44,61]. It can also be observed that cells on surfaces with higher NSFE demonstrated enhanced adhesion, often forming well-spread clusters that covered a substantial portion of the surface area (Figure 3 and Figure 4). On surfaces with higher NSFE, we observed larger and denser cell colonies, indicating that these surfaces were conducive to the formation of cell clusters. In contrast, on surfaces with low NSFE, cells exhibited reduced adhesion and appeared to have a more rounded morphology. The cell colonies appeared smaller and less densely populated, highlighting the inhibitory effect of surface hydrophobicity on cell clustering and growth. This suggests that NSFE plays a critical role in promoting cell adhesion and spreading.
It is important to note that changes in the pillar diameter and gap ratios also affect the curvature of the pillar edges and the ratio of the length of the edges/sidewalls to the area of the top of the pillars. These factors can significantly influence cell behaviour. The curvature of a circle is defined as the reciprocal of its radius. Lower curvature (larger radius) tends to enhance cell adhesion because it provides a more extensive contact area for cell attachment. This phenomenon is evident in Figure 3d(ii) and Figure 4d(ii), where actin filaments are concentrated around the edges of the pillars, suggesting that cells preferentially adhere to these regions.
As the diameter of the pillars increases, the ratio of the length of the edges/sidewalls to the area of the top of the pillars decreases. A higher ratio provides more edge length per unit area, which can facilitate greater focal adhesion formation. This is particularly relevant for cells that rely on edge detection for adhesion and spreading. The increased edge length offers more anchoring points for the cells, thereby enhancing their ability to adhere and spread on the micropillared surface.

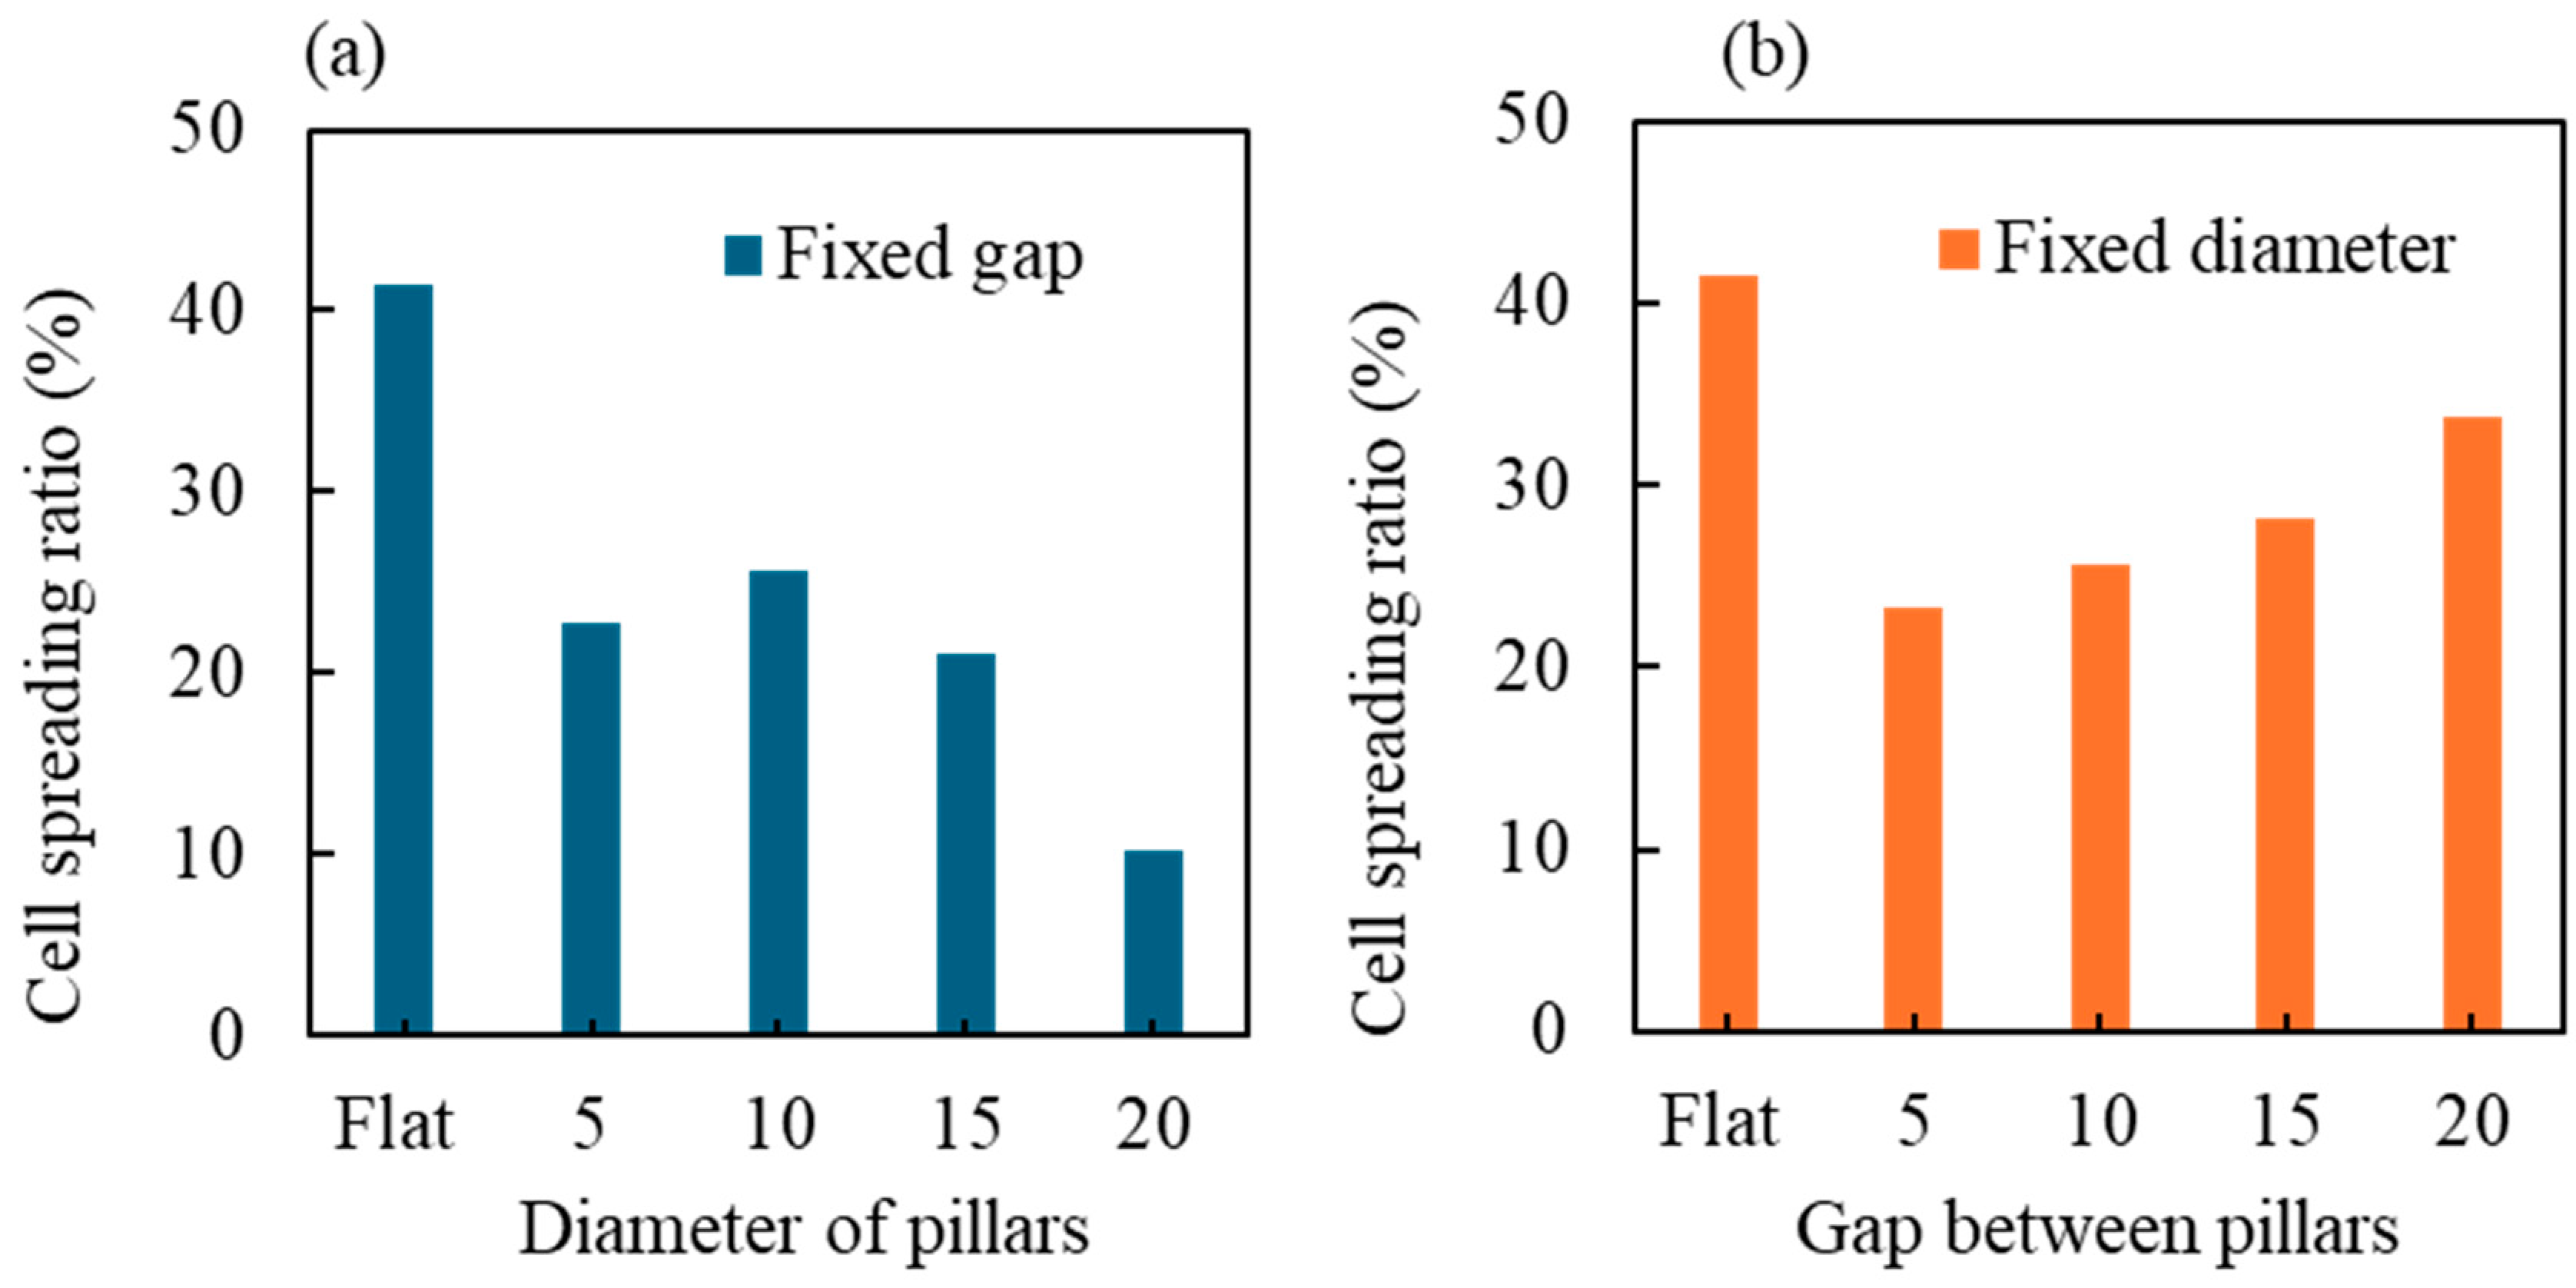
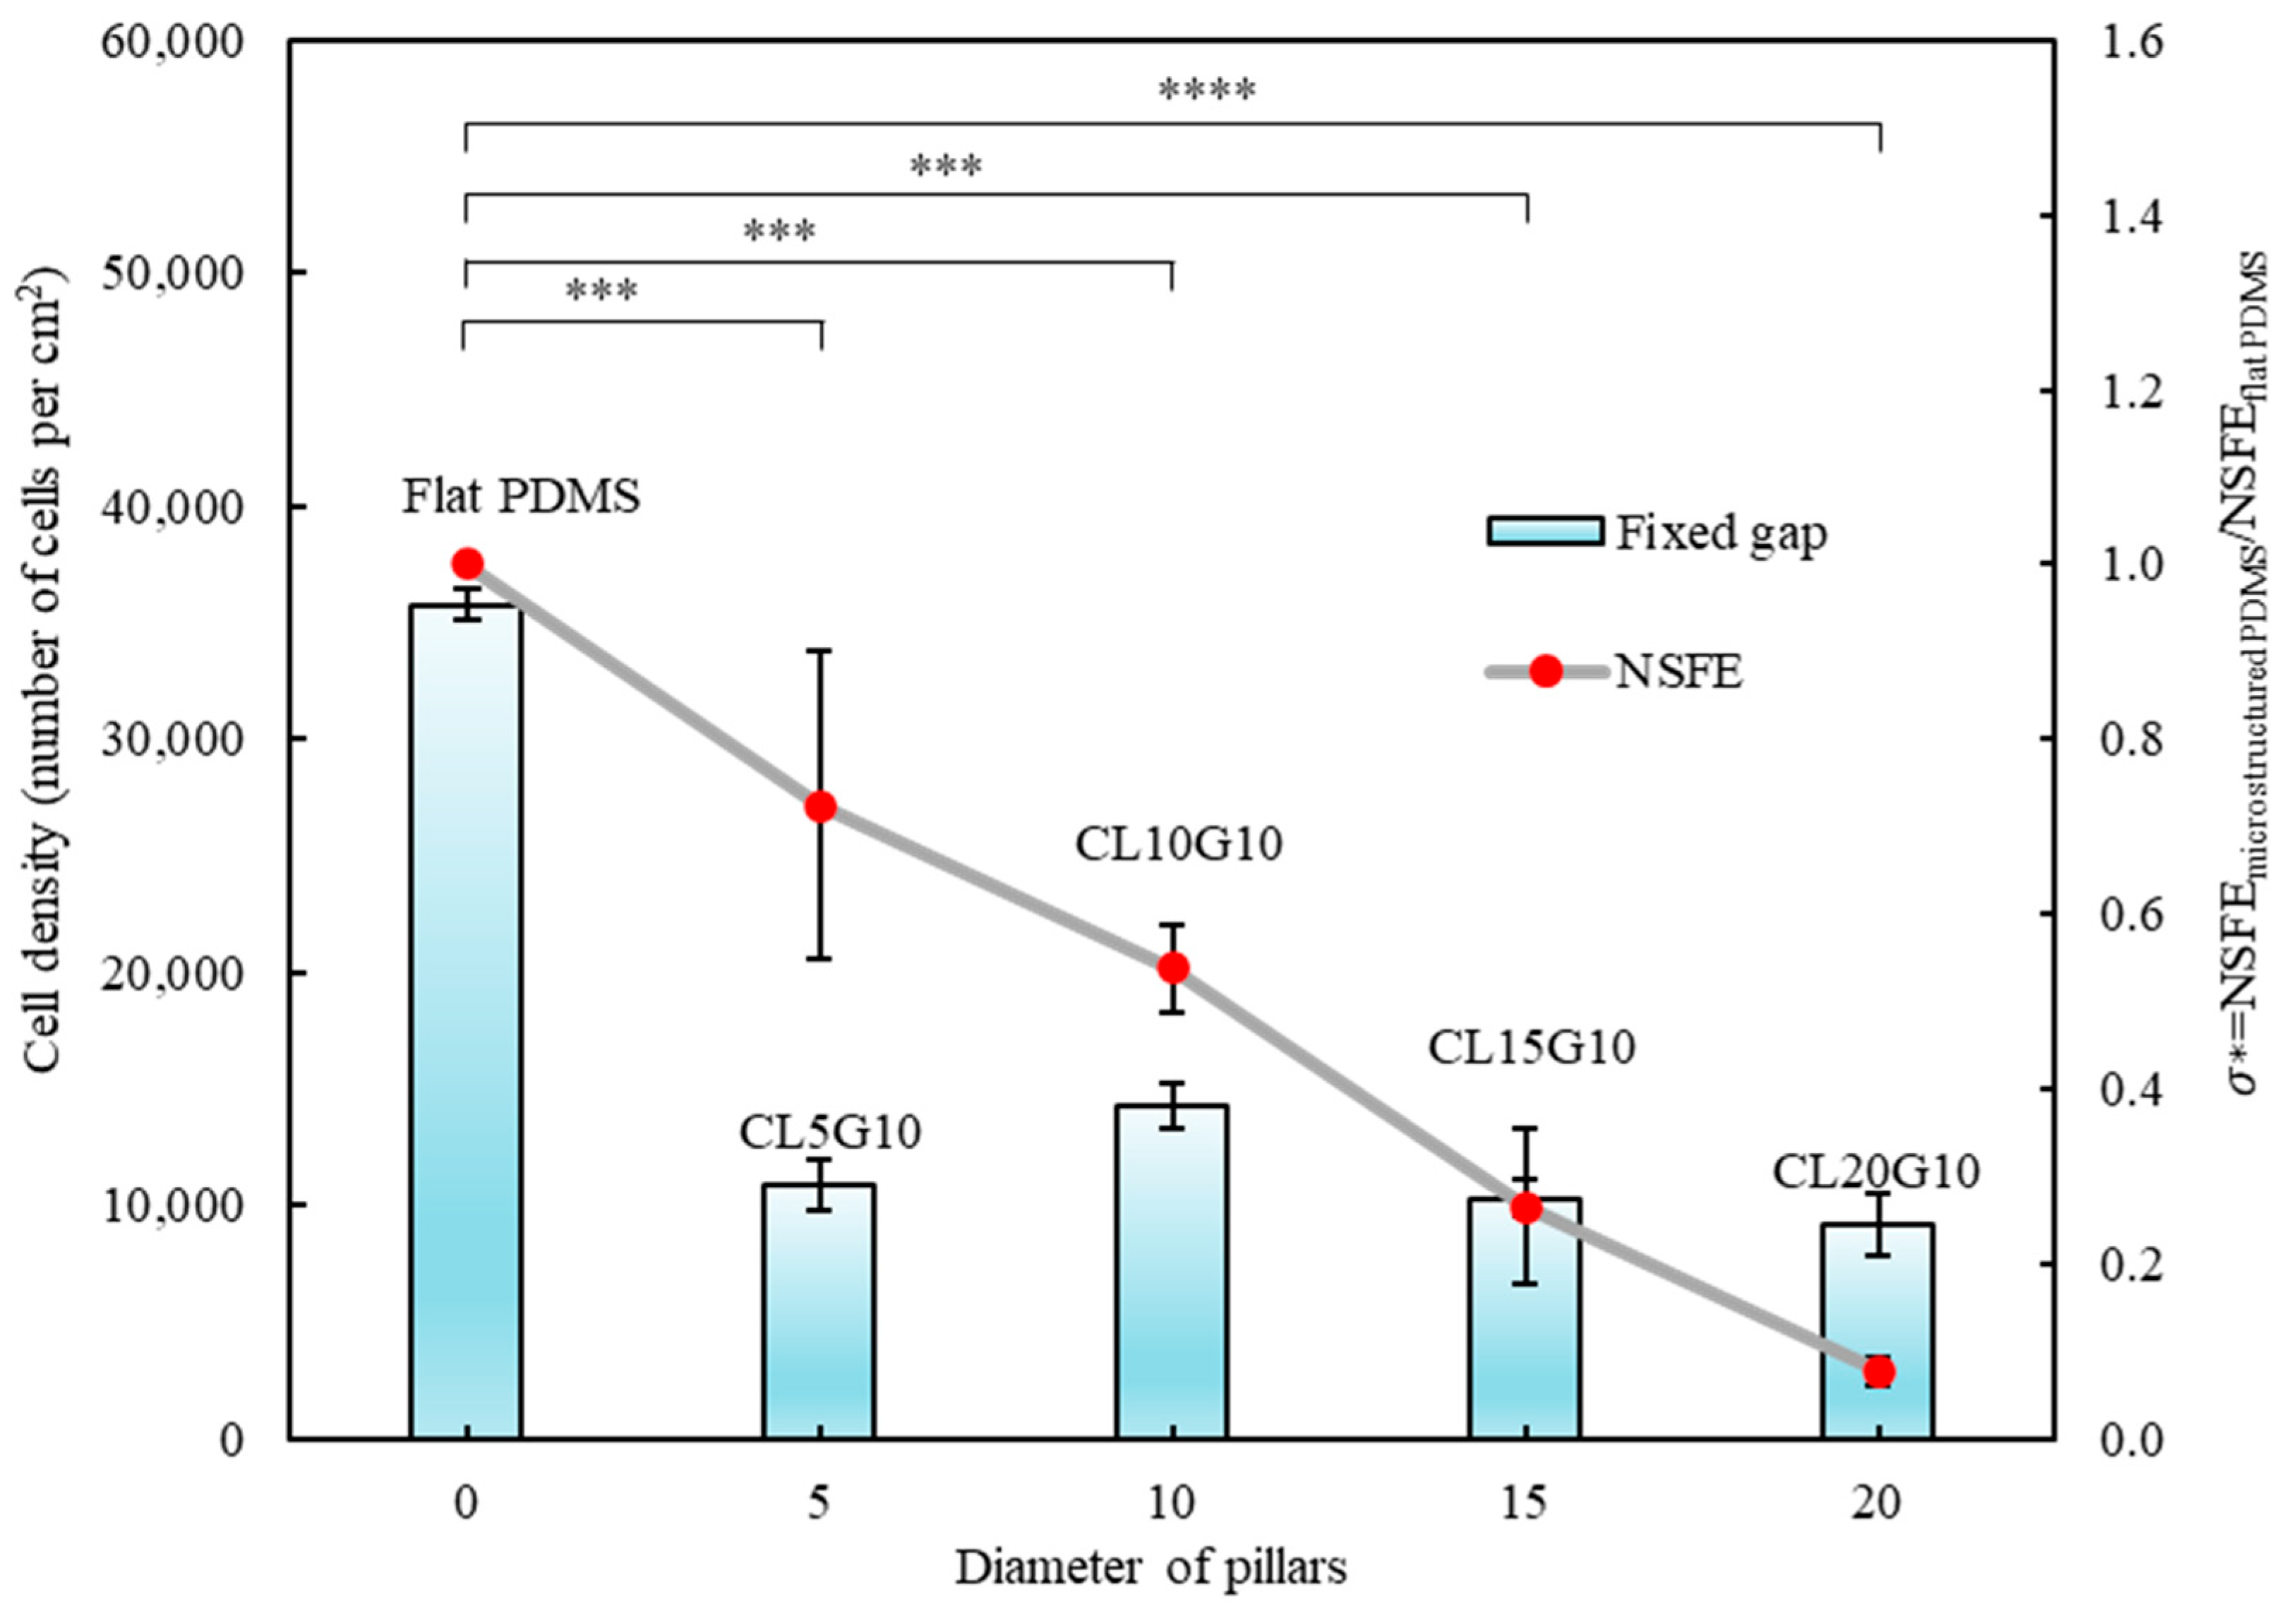
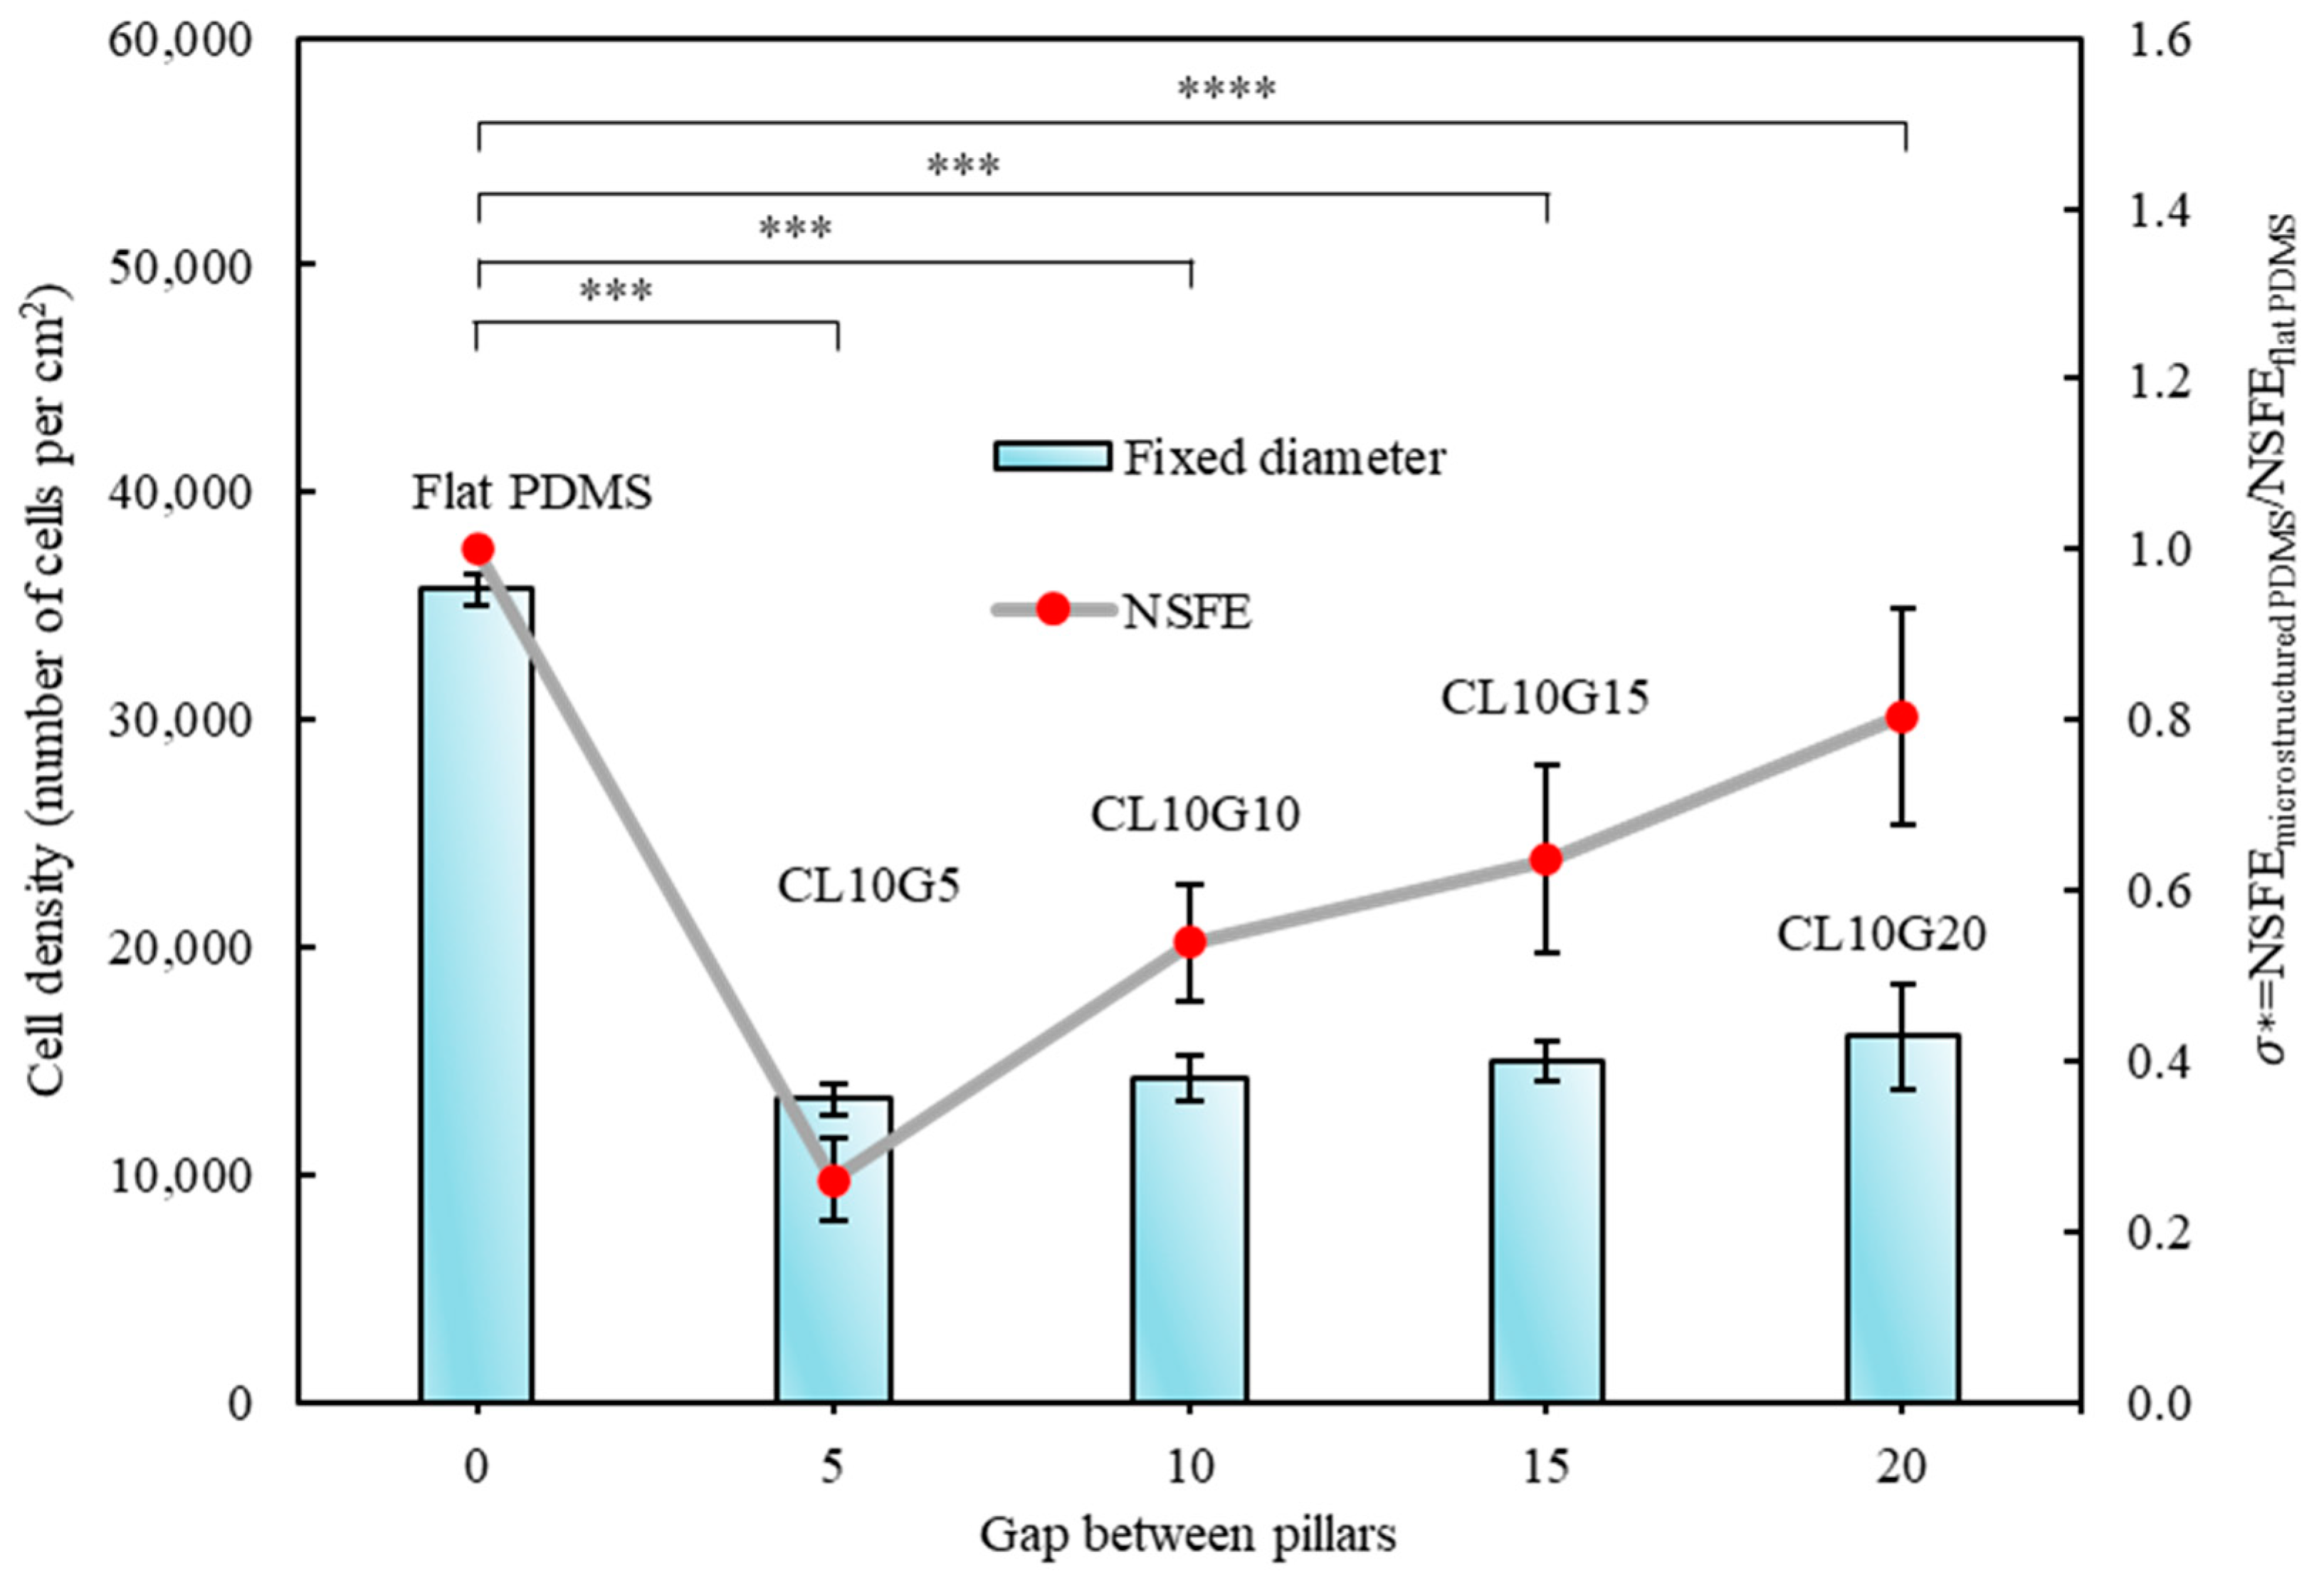
3.2. Quantitative Analysis of Cells’ Behaviour on Micropillars

For the data presented in Figure 6 and Figure 7, cell density was calculated using the method described in Section 2.3. Specifically, the number of viable cells was normalised to the surface area of the PDMS samples, providing a cell density measurement in cells per cm2. This ensures consistency and accuracy in the quantification of cell densities across different sample types. Fluorescence images (Figure 3 and Figure 4) were used for qualitative analysis and visualisation of cell distribution and morphology but were not used for quantitative cell density calculations.
We use the dimensionless values of the ratio of the NSFE of microstructured PDMS and flat PDMS. The symbol σ * is used to denote the relative NSFE of microstructured PDMS to that of flat PDMS, i.e., σ * = N S F E   o f   m i c r o s t r u c t u r e d   P D M S   N S F E   o f   f l a t   P D M S .
The experimental investigation of cell counts on surfaces with a fixed gap (10 µm) and increasing pillar diameter (5, 10, 15, 20 µm) provides valuable insights into the relationship between substrate topography and cell behaviour (Figure 6). The observation that cell count decreases as the diameter of pillars increases suggests an intriguing relationship between the physical characteristics of the substrate and cell behaviour. Larger pillars create more substantial physical obstacles for cells. Cells rely on extending their membrane processes to adhere to surfaces. With increasing pillar diameter, cells face greater challenges in spanning the gaps between pillars, limiting their ability to cover the surface effectively. Larger pillars occupy more space on the substrate, leaving less flat area where cells can attach and spread. This reduction in available adhesive surface limits the number of cells that can effectively adhere to and populate the surface. The local microenvironment between and around the pillars can also be influenced by changes in pillar diameter. Variations in pillar size may impact nutrient and oxygen availability and affect the accumulation of secreted factors, all of which can influence cell viability and behaviour. The number of cells on surfaces with pillars’ diameter 5 µm and gap 10 µm was slightly lower than others, possibly due to the relation between the size of the cells and the pillars’ diameter. The specific diameter for MDA-MB-231 cells is 12.4 ± 2.1 µm [62]. Since the diameter of the pillars is smaller than the size of the cells, the adhesive area for cells becomes limited, making it challenging for cells to establish effective adhesions.
We also investigated cell count on surfaces with a fixed pillar diameter and increasing pillar gap (5, 10, 15, and 20 µm) (Figure 7). The experiment results consistently show that as the pillar gap increases, the cell count also increases. Wider pillar gaps present fewer physical barriers for cells. When the gap between pillars increases, there is more available surface area for cells to adhere to, spread out, and proliferate. The larger gaps provide a less confined environment, allowing cells more freedom to move, explore, and occupy the substrate. Cells typically spread by extending their membrane processes, and with wider gaps, they face fewer hindrances when spanning the spaces between pillars. This promotes a greater ability for cells to cover the surface. Cells can more readily extend their pseudopodia or form stress fibres to move into the larger gaps, leading to enhanced cell distribution and higher overall cell counts. Moreover, wider pillar gaps can have a positive impact on the local microenvironment. Enhanced nutrient and oxygen diffusion can contribute to improved cell viability and behaviour.

3.3. Relationship of Cells’ Behaviour and Normalised Surface Free Energy of Micropillar Surfaces

We conducted an analysis of the surface energy for each design to examine how the characteristics of the surface are affected by variations in the gap and diameter of the micropillars. The procedure and results were reported in our previous work [51]. In one set of experiments, we maintained a constant pillar diameter of 10 µm and adjusted the gap between the pillars to investigate the gap’s impact on the NSFE of the sample. In another set of experiments, we maintained a constant 10 µm gap between pillars and modified the pillar diameter to explore the diameter’s influence on the NSFE of the sample. Additionally, we made a comparison between the surface energy of the flat PDMS and the microstructured PDMS surface. The surface energy of the flat PDMS was determined to be 12 mN/m, which agrees well with the reported values of flat PDMS in the literature [63].
We performed cell counting experiments on both micropillar surfaces with low and high NSFE to quantify cell adhesion (Figure 6 and Figure 7). Our results indicate a clear and significant association between NSFE and the presence of cancer cells. Specifically, when the micropillar surfaces exhibited a higher NSFE, there was a noticeable increase in the number of cancer cells. Specifically, the number of adhered cells per unit area was consistently greater on surfaces with a higher NSFE, suggesting that high NSFE promotes enhanced cell adhesion. On surfaces with high NSFE, colonies were larger and more densely packed, resulting in a higher colony density per unit area. In particular, cells on flat PDMS were observed to grow much better than on other surfaces. The absence of topographical features in it provides a suitable environment for cells to spread and multiply. This observation suggests that breast cancer cells have an affinity for surfaces with high NSFE, potentially due to their adhesive properties and the role of high NSFE interactions in cell adhesion and colonisation.
Conversely, we found that increasing hydrophobicity of the micropillar surfaces and the resulting lower NSFE reduce the number of viable cancer cells. This observation implies that highly hydrophobic surfaces may deter or inhibit the adhesion of breast cancer cells. Cells may struggle to establish stable adhesions on hydrophobic substrates, leading to a reduced cell count. The reduced presence of viable cells on hydrophobic surfaces may be attributed to the unfavourable environment created by low surface energy, which hinders cell adhesion and colonisation.
Previous studies have shown that surface topography influences cell adhesion, proliferation, and morphology. Curtis et al. found that microgrooved surfaces guide cell alignment and elongation, while Bettinger et al. demonstrated that nanotopographies can enhance or inhibit cell proliferation [20,29,64]. Our findings align with these studies, showing that smaller pillar gaps and larger diameters enhance breast cancer cell adhesion and proliferation. Additionally, Majhy et al. or Masuda et al. showed that higher surface free energy promotes cell adhesion and spreading, which our results confirm [44,61]. Unique to our study, breast cancer cells formed clusters on surfaces with larger pillar diameters and gaps, suggesting a potential link to metastasis. This comparative analysis underscores the complexity of cell-surface interactions and highlights the distinctive responses of breast cancer cells, paving the way for more effective biomaterial designs for cancer treatment and tissue engineering.

4. Conclusions

In conclusion, the study of the behaviour of breast cancer cells on microstructured surfaces provided valuable insights into the complex interactions between cancer cells and their microenvironment. Our findings demonstrate that microstructured surfaces can significantly influence various aspects of breast cancer cell behaviour. The experimental findings presented in this study provide compelling evidence regarding the significant influence of pillar gap size and diameter on cell behaviour, specifically the tendency of cells to either disperse individually or assemble into clusters on microstructured surfaces. The results demonstrate a clear and consistent trend: cells tend to disperse separately on surfaces with smaller pillar gaps and diameters, while they exhibit a pronounced tendency to assemble on surfaces with larger pillar gaps and diameters. These insights have the potential to inform the development of innovative therapeutic approaches and diagnostic tools for breast cancer.
Furthermore, microstructured surfaces as a model system for studying cancer cell behaviour highlight the importance of tumour microenvironment in cancer research. Our results underscore the need to explore not only the intrinsic properties of cancer cells but also their interactions with the surrounding extracellular matrix and neighbouring cells. Specifically, when the micropillar surfaces exhibited higher NSFE, a significant increase in the number of cancer cells was observed. Conversely, when the hydrophobicity of the micropillar surfaces was increased, leading to lower NSFE, there was a substantial decrease in the number of viable cancer cells.
Our study’s findings have significant implications for cancer research and tissue engineering. Understanding how surface free energy and micropillar topographies influence breast cancer cell dynamics can lead to the design of biomaterials that selectively modulate cell behaviour. For cancer research, this means creating surfaces that inhibit cancer cell growth while promoting healthy cell adhesion, aiding in targeted therapies, and developing surfaces that disrupt cancer cell migration and invasion, reducing metastasis risk. In tissue engineering, tailoring scaffold surfaces to enhance cell adhesion and proliferation can improve tissue integration and functionality while creating biomaterials with optimised properties for specific applications, such as wound healing or preventing biofilm formation. Future research should include long-term studies to evaluate cell response stability, in vivo experiments to validate findings in complex environments, identifying molecular mechanisms involved, and designing surfaces tailored to individual patient needs. By expanding our understanding of these interactions, we can develop innovative biomaterials and therapeutic strategies that significantly impact cancer treatment and tissue engineering, improving patient outcomes and advancing regenerative medicine.
While our study provides valuable insights into the influence of micropillar topographies on breast cancer cell behaviour, there are limitations to consider. The in vitro nature of the experiments may not fully replicate the complex in vivo tumour microenvironment. Additionally, we focused on a single cell line, and the results may vary with different breast cancer subtypes. Future studies should explore these interactions in more complex models and with a broader range of cell lines. Incorporating functional assays related to cancer cell migration, invasion, or drug responsiveness could also provide a more comprehensive understanding of how these topological properties influence cancer cell behaviour. Another limitation is the potential effect of the total surface area of the different samples. The increased surface area may contribute to enhanced cell adhesion and proliferation and should be considered when interpreting the results. Further studies should investigate how variations in surface area influence cell behaviour to provide a more comprehensive understanding of these effects.
Future studies should continue to explore the mechanistic underpinnings of these interactions and their relevance to clinical outcomes. Additionally, the translation of these findings into practical applications, such as developing novel therapeutic strategies or diagnostic tools, holds great promise for improving the management of breast cancer and ultimately enhancing patient outcomes.

Author Contributions

Conceptualisation, N.-T.N. and N.K.; methodology, H.H.V. and N.K.; software, H.H.V.; validation, H.H.V.; formal analysis, H.H.V. and N.K.; investigation, H.H.V. and S.Y.; resources, N.-T.N. and N.K.; data curation, H.H.V. and S.Y.; writing—original draft preparation, H.H.V., S.Y., N.K. and T.T.H.N.; writing—review and editing, N.-T.N. and N.K.; visualisation, H.H.V.; supervision, N.-T.N. and N.K.; project administration, N.-T.N. and N.K.; funding acquisition, N.-T.N. and N.K. All authors have read and agreed to the published version of the manuscript.

Funding

N.K. acknowledges funding support from the Australian Research Council (ARC) Discovery Early Career Research Award (DECRA) DE220100205. N.-T.N. acknowledges funding supports from the Australian Research Council (ARC) through the Australian Laureate Fellowship (FL230100023) and ARC Discovery Project DP220100261.

Institutional Review Board Statement

Not applicable.

Informed Consent Statement

Not applicable.

Data Availability Statement

Data are provided within the manuscript.

Acknowledgments

This work was performed in part at the Queensland node of the Australian National Fabrication Facility (ANFF). A company established under the National Collaborative Research Infrastructure Strategy (NCRIS) to provide nano- and microfabrication facilities for Australia’s researchers. H.H.V. acknowledges the support from the ANFF-Q, Griffith Hub during the fabrication process.

Conflicts of Interest

The authors declare no conflicts of interest.

References

  1. Alves, N.M.; Pashkuleva, I.; Reis, R.L.; Mano, J.F. Controlling cell behavior through the design of polymer surfaces. Small 2010, 6, 2208–2220. [Google Scholar] [CrossRef] [PubMed]
  2. Saw, T.B.; Jain, S.; Ladoux, B.; Lim, C.T. Mechanobiology of collective cell migration. Cell. Mol. Bioeng. 2015, 8, 3–13. [Google Scholar] [CrossRef]
  3. Xie, W.; Wei, X.; Kang, H.; Jiang, H.; Chu, Z.; Lin, Y.; Hou, Y.; Wei, Q. Static and dynamic: Evolving biomaterial mechanical properties to control cellular mechanotransduction. Adv. Sci. 2023, 10, 2204594. [Google Scholar] [CrossRef] [PubMed]
  4. Mustafa, R.A.; Ran, M.; Wang, Y.; Yan, J.; Zhang, Y.; Rosenholm, J.M.; Zhang, H. A pH/temperature responsive nanocomposite for chemo-photothermal synergistic cancer therapy. Smart Mater. Med. 2023, 4, 199–211. [Google Scholar] [CrossRef]
  5. Girard, P.P.; Cavalcanti-Adam, E.A.; Kemkemer, R.; Spatz, J.P. Cellular chemomechanics at interfaces: Sensing, integration and response. Soft Matter 2007, 3, 307–326. [Google Scholar] [CrossRef] [PubMed]
  6. Weiss, P. Nerve patterns: The mechanisms of nerve growth. Growth 1941, 5, 163–203. [Google Scholar]
  7. Harrison, R.G. The reaction of embryonic cells to solid structures. J. Exp. Zool. 1914, 17, 521–544. [Google Scholar] [CrossRef]
  8. Stoker, M.; O’Neill, C.; Berryman, S.; Waxman, V. Anchorage and growth regulation in normal and virus-transformed cells. Int. J. Cancer 1968, 3, 683–693. [Google Scholar] [CrossRef] [PubMed]
  9. Azioune, A.; Storch, M.; Bornens, M.; Théry, M.; Piel, M. Simple and rapid process for single cell micro-patterning. Lab A Chip 2009, 9, 1640–1642. [Google Scholar] [CrossRef]
  10. Walker, G.M.; Zeringue, H.C.; Beebe, D.J. Microenvironment design considerations for cellular scale studies. Lab A Chip 2004, 4, 91–97. [Google Scholar] [CrossRef]
  11. Craighead, H.G.; James, C.; Turner, A. Chemical and topographical patterning for directed cell attachment. Curr. Opin. Solid State Mater. Sci. 2001, 5, 177–184. [Google Scholar] [CrossRef]
  12. Kleinfeld, D.; Kahler, K.; Hockberger, P. Controlled outgrowth of dissociated neurons on patterned substrates. J. Neurosci. 1988, 8, 4098–4120. [Google Scholar] [CrossRef] [PubMed]
  13. Stenger, D.A.; Georger, J.H.; Dulcey, C.S.; Hickman, J.J.; Rudolph, A.S.; Nielsen, T.B.; McCort, S.M.; Calvert, J.M. Coplanar molecular assemblies of amino-and perfluorinated alkylsilanes: Characterization and geometric definition of mammalian cell adhesion and growth. J. Am. Chem. Soc. 1992, 114, 8435–8442. [Google Scholar] [CrossRef]
  14. Lom, B.; Healy, K.E.; Hockberger, P.E. A versatile technique for patterning biomolecules onto glass coverslips. J. Neurosci. Methods 1993, 50, 385–397. [Google Scholar] [CrossRef] [PubMed]
  15. Brunette, D. Fibroblasts on micromachined substrata orient hierarchically to grooves of different dimensions. Exp. Cell Res. 1986, 164, 11–26. [Google Scholar] [CrossRef] [PubMed]
  16. Dunn, G.; Brown, A. Alignment of fibroblasts on grooved surfaces described by a simple geometric transformation. J. Cell Sci. 1986, 83, 313–340. [Google Scholar] [CrossRef] [PubMed]
  17. Clark, P.; Connolly, P.; Curtis, A.; Dow, J.; Wilkinson, C. Topographical control of cell behaviour: I. Simple step cues. Development 1987, 99, 439–448. [Google Scholar] [CrossRef] [PubMed]
  18. Clark, P.; Connolly, P.; Curtis, A.; Dow, J.; Wilkinson, C. Topographical control of cell behaviour: II. Multiple grooved substrata. Development 1990, 108, 635–644. [Google Scholar] [CrossRef] [PubMed]
  19. Nikkhah, M.; Strobl, J.S.; Agah, M. Attachment and response of human fibroblast and breast cancer cells to three dimensional silicon microstructures of different geometries. Biomed. Microdevices 2009, 11, 429–441. [Google Scholar] [CrossRef]
  20. Bettinger, C.J.; Orrick, B.; Misra, A.; Langer, R.; Borenstein, J.T. Microfabrication of poly (glycerol–sebacate) for contact guidance applications. Biomaterials 2006, 27, 2558–2565. [Google Scholar] [CrossRef]
  21. Turner, A.; Dowell, N.; Turner, S.; Kam, L.; Isaacson, M.; Turner, J.; Craighead, H.; Shain, W. Attachment of astroglial cells to microfabricated pillar arrays of different geometries. J. Biomed. Mater. Res. 2000, 51, 430–441. [Google Scholar] [CrossRef]
  22. Charest, J.L.; García, A.J.; King, W.P. Myoblast alignment and differentiation on cell culture substrates with microscale topography and model chemistries. Biomaterials 2007, 28, 2202–2210. [Google Scholar] [CrossRef] [PubMed]
  23. Dusseiller, M.R.; Schlaepfer, D.; Koch, M.; Kroschewski, R.; Textor, M. An inverted microcontact printing method on topographically structured polystyrene chips for arrayed micro-3-D culturing of single cells. Biomaterials 2005, 26, 5917–5925. [Google Scholar] [CrossRef] [PubMed]
  24. Liao, H.; Andersson, A.-S.; Sutherland, D.; Petronis, S.; Kasemo, B.; Thomsen, P. Response of rat osteoblast-like cells to microstructured model surfaces in vitro. Biomaterials 2003, 24, 649–654. [Google Scholar] [CrossRef] [PubMed]
  25. Mai, J.; Sun, C.; Li, S.; Zhang, X. A microfabricated platform probing cytoskeleton dynamics using multidirectional topographical cues. Biomed. Microdevices 2007, 9, 523–531. [Google Scholar] [CrossRef] [PubMed]
  26. Rovensky, Y.A.; Slavnaja, I.; Vasiliev, J.M. Behaviour of fibroblast-like cells on grooved surfaces. Exp. Cell Res. 1971, 65, 193–201. [Google Scholar] [CrossRef] [PubMed]
  27. Von Recum, A.; Van Kooten, T. The influence of micro-topography on cellular response and the implications for silicone implants. J. Biomater. Sci. Polym. Ed. 1996, 7, 181–198. [Google Scholar] [CrossRef]
  28. Clark, P. Cell behaviour on micropatterned surfaces. Biosens. Bioelectron. 1994, 9, 657–661. [Google Scholar] [CrossRef]
  29. Curtis, A.S.; Wilkinson, C.D. Reactions of cells to topography. J. Biomater. Sci. Polym. Ed. 1998, 9, 1313–1329. [Google Scholar] [CrossRef]
  30. van Kooten, T.G.; Whitesides, J.F.; von Recum, A.F. Influence of silicone (PDMS) surface texture on human skin fibroblast proliferation as determined by cell cycle analysis. J. Biomed. Mater. Res. 1998, 43, 1–14. [Google Scholar] [CrossRef]
  31. Walboomers, X.; Monaghan, W.; Curtis, A.; Jansen, J. Attachment of fibroblasts on smooth and microgrooved polystyrene. J. Biomed. Mater. Res. 1999, 46, 212–220. [Google Scholar] [CrossRef]
  32. Milner, K.R.; Siedlecki, C.A. Submicron poly (L-lactic acid) pillars affect fibroblast adhesion and proliferation. J. Biomed. Mater. Res. Part A 2007, 82, 80–91. [Google Scholar] [CrossRef] [PubMed]
  33. Wilkinson, C.; Riehle, M.; Wood, M.; Gallagher, J.; Curtis, A. The use of materials patterned on a nano-and micro-metric scale in cellular engineering. Mater. Sci. Eng. C 2002, 19, 263–269. [Google Scholar] [CrossRef]
  34. Antmen, E.; Demirci, U.; Hasirci, V. Amplification of nuclear deformation of breast cancer cells by seeding on micropatterned surfaces to better distinguish their malignancies. Colloids Surf. B Biointerfaces 2019, 183, 110402. [Google Scholar] [CrossRef] [PubMed]
  35. Jungbauer, S.; Kemkemer, R.; Gruler, H.; Kaufmann, D.; Spatz, J.P. Cell Shape Normalization, Dendrite Orientation, and Melanin Production of Normal and Genetically Altered (Haploinsufficient NF1)-Melanocytes by Microstructured Substrate Interactions. ChemPhysChem 2004, 5, 85–92. [Google Scholar] [CrossRef]
  36. Arima, Y.; Iwata, H. Effect of wettability and surface functional groups on protein adsorption and cell adhesion using well-defined mixed self-assembled monolayers. Biomaterials 2007, 28, 3074–3082. [Google Scholar] [CrossRef] [PubMed]
  37. Benoit, D.S.; Schwartz, M.P.; Durney, A.R.; Anseth, K.S. Small functional groups for controlled differentiation of hydrogel-encapsulated human mesenchymal stem cells. Nat. Mater. 2008, 7, 816–823. [Google Scholar] [CrossRef] [PubMed]
  38. Lim, J.Y.; Shaughnessy, M.C.; Zhou, Z.; Noh, H.; Vogler, E.A.; Donahue, H.J. Surface energy effects on osteoblast spatial growth and mineralization. Biomaterials 2008, 29, 1776–1784. [Google Scholar] [CrossRef]
  39. Vu, H.H.; Nguyen, N.T.; Kashaninejad, N. Re-Entrant Microstructures for Robust Liquid Repellent Surfaces. Adv. Mater. Technol. 2023, 8, 2370023. [Google Scholar] [CrossRef]
  40. Alves, N.M.; Shi, J.; Oramas, E.; Santos, J.L.; Tomás, H.; Mano, J.F. Bioinspired superhydrophobic poly (L-lactic acid) surfaces control bone marrow derived cells adhesion and proliferation. J. Biomed. Mater. Res. Part A 2009, 91, 480–488. [Google Scholar] [CrossRef]
  41. Song, W.; Veiga, D.D.; Custódio, C.A.; Mano, J.F. Bioinspired degradable substrates with extreme wettability properties. Adv. Mater. 2009, 21, 1830–1834. [Google Scholar] [CrossRef]
  42. Xu, C.; Yang, F.; Wang, S.; Ramakrishna, S. In vitro study of human vascular endothelial cell function on materials with various surface roughness. J. Biomed. Mater. Res. Part A 2004, 71, 154–161. [Google Scholar] [CrossRef] [PubMed]
  43. Owen, G.R.; Jackson, J.; Chehroudi, B.; Burt, H.; Brunette, D. A PLGA membrane controlling cell behaviour for promoting tissue regeneration. Biomaterials 2005, 26, 7447–7456. [Google Scholar] [CrossRef] [PubMed]
  44. Majhy, B.; Priyadarshini, P.; Sen, A. Effect of surface energy and roughness on cell adhesion and growth–facile surface modification for enhanced cell culture. RSC Adv. 2021, 11, 15467–15476. [Google Scholar] [CrossRef]
  45. Sheidaei, Z.; Akbarzadeh, P.; Kashaninejad, N. Advances in numerical approaches for microfluidic cell analysis platforms. J. Sci. Adv. Mater. Devices 2020, 5, 295–307. [Google Scholar] [CrossRef]
  46. Kashaninejad, N.; Nguyen, N.-T.; Chan, W.K. Eccentricity effects of microhole arrays on drag reduction efficiency of microchannels with a hydrophobic wall. Phys. Fluids 2012, 24, 112004. [Google Scholar] [CrossRef]
  47. Kashaninejad, N.; Chan, W.K.; Nguyen, N.-T. Eccentricity effect of micropatterned surface on contact angle. Langmuir 2012, 28, 4793–4799. [Google Scholar] [CrossRef]
  48. Moghadas, H.; Saidi, M.S.; Kashaninejad, N.; Nguyen, N.-T. A high-performance polydimethylsiloxane electrospun membrane for cell culture in lab-on-a-chip. Biomicrofluidics 2018, 12, 024117. [Google Scholar] [CrossRef]
  49. Yadav, S.; Kashaninejad, N.; Nguyen, N.-T. RhoA and Rac1 in Liver Cancer Cells: Induction of Overexpression Using Mechanical Stimulation. Micromachines 2020, 11, 729. [Google Scholar] [CrossRef]
  50. Taghibakhshi, A.; Barisam, M.; Saidi, M.S.; Kashaninejad, N.; Nguyen, N.-T. Three-Dimensional Modeling of Avascular Tumor Growth in Both Static and Dynamic Culture Platforms. Micromachines 2019, 10, 580. [Google Scholar] [CrossRef]
  51. Vu, H.H.; Nguyen, N.-T.; Nguyen, N.-K.; Luu, C.H.; Hettiarachchi, S.; Kashaninejad, N. Tunable wettability with stretchable microstructured surfaces. Adv. Eng. Mater. 2023, 25, 2300821. [Google Scholar] [CrossRef]
  52. Annamalai, M.; Gopinadhan, K.; Han, S.A.; Saha, S.; Park, H.J.; Cho, E.B.; Kumar, B.; Patra, A.; Kim, S.-W.; Venkatesan, T. Surface energy and wettability of van der Waals structures. Nanoscale 2016, 8, 5764–5770. [Google Scholar] [CrossRef] [PubMed]
  53. Owens, D.K.; Wendt, R. Estimation of the surface free energy of polymers. J. Appl. Polym. Sci. 1969, 13, 1741–1747. [Google Scholar] [CrossRef]
  54. Kaelble, D. Dispersion-polar surface tension properties of organic solids. J. Adhes. 1970, 2, 66–81. [Google Scholar] [CrossRef]
  55. Shaker, M.; Salahinejad, E. A combined criterion of surface free energy and roughness to predict the wettability of non-ideal low-energy surfaces. Prog. Org. Coat. 2018, 119, 123–126. [Google Scholar] [CrossRef]
  56. Liu, W.; Sun, Q.; Zheng, Z.L.; Gao, Y.T.; Zhu, G.Y.; Wei, Q.; Xu, J.Z.; Li, Z.M.; Zhao, C.S. Topographic cues guiding cell polarization via distinct cellular mechanosensing pathways. Small 2022, 18, 2104328. [Google Scholar] [CrossRef] [PubMed]
  57. Geng, J.; Kang, Z.; Sun, Q.; Zhang, M.; Wang, P.; Li, Y.; Li, J.; Su, B.; Wei, Q. Microtubule Assists Actomyosin to Regulate Cell Nuclear Mechanics and Chromatin Accessibility. Research 2023, 6, 0054. [Google Scholar] [CrossRef] [PubMed]
  58. Fujimori, T.; Nakajima, A.; Shimada, N.; Sawai, S. Tissue self-organization based on collective cell migration by contact activation of locomotion and chemotaxis. Proc. Natl. Acad. Sci. USA 2019, 116, 4291–4296. [Google Scholar] [CrossRef]
  59. Yanakieva, I.; Erzberger, A.; Matejčić, M.; Modes, C.D.; Norden, C. Cell and tissue morphology determine actin-dependent nuclear migration mechanisms in neuroepithelia. J. Cell Biol. 2019, 218, 3272–3289. [Google Scholar] [CrossRef]
  60. Sun, Q.; Pei, F.; Zhang, M.; Zhang, B.; Jin, Y.; Zhao, Z.; Wei, Q. Curved nanofiber network induces cellular bridge formation to promote stem cell mechanotransduction. Adv. Sci. 2023, 10, 2204479. [Google Scholar] [CrossRef]
  61. Masuda, Y.; Inami, W.; Miyakawa, A.; Kawata, Y. Cell culture on hydrophilicity-controlled silicon nitride surfaces. World J. Microbiol. Biotechnol. 2015, 31, 1977–1982. [Google Scholar] [CrossRef] [PubMed]
  62. TruongVo, T.; Kennedy, R.; Chen, H.; Chen, A.; Berndt, A.; Agarwal, M.; Zhu, L.; Nakshatri, H.; Wallace, J.; Na, S. Microfluidic channel for characterizing normal and breast cancer cells. J. Micromech. Microeng. 2017, 27, 035017. [Google Scholar] [CrossRef]
  63. Kim, Y.G.; Lim, N.; Kim, J.; Kim, C.; Lee, J.; Kwon, K.-H. Study on the surface energy characteristics of polydimethylsiloxane (PDMS) films modified by C4F8/O2/Ar plasma treatment. Appl. Surf. Sci. 2019, 477, 198–203. [Google Scholar] [CrossRef]
  64. Bettinger, C.; Langer, R.; Borenstein, J. Engineering substrate microand nanotopography to control cell function. Angew. Chem. Int. Ed. Engl. 2009, 48, 5406–5415. [Google Scholar] [CrossRef]
Figure 1. Schematic to show the creation of microstructured PDMS using lithography technique. A clean wafer was spin-coated with positive photoresist. A mask aligner was then utilised during the process of UV lithography. With the circular micro-hole arrays standing on the wafer, PDMS was carefully poured onto the masters and then gently peeled from the mould to form a PDMS sample featuring arrays of micropillars on its surface.
Technologies 12 00130 g001
Figure 2. Representative SEM images of the micropillar array after fabrication. Images of the top section of the fabricated PDMS structures with cylindrical shapes at a close distance. The approximate height of the pillar is ~10 µm. (ad) The gap between pillars is kept constant at 10 µm, and the diameter of the pillars is varied from 5, 10, 15, and 20 µm, respectively. Scale bar: 20 µm. (eg) The gap between pillars is kept constant at 10 µm, and the diameter of the pillars is varied from 5, 15, and 20 µm, respectively. Scale bar: 20 µm. (h) A magnified view of the surface of a single pillar with 20 µm diameter and 10 µm gap. Scale bar: 4 µm. All the PDMS surfaces show no defects and are uniform.
Technologies 12 00130 g002
Figure 3. Representative fluorescence images of cells attached on (a) flat PDMS (control sample) compared to those on micropillar arrays at constant pillar gap (10 µm) while varying the pillars’ diameter from 5 to 20 µm (to avoid repetition, CL10G10 is shown in Figure 4). (b) CL5G10, (c) CL15G10, and (d) CL20G10. In each section, (i) a fluorescent image of cells with pillars (20× magnification); (ii) a close-up fluorescent image of cells with pillars (50× magnification); and (iii) a fluorescent image of cells without pillars (20× magnification). ActinGreen (green) labels cellular actin, and Nucblue (blue) stains nuclei (×20). The scale bar is 50 µm.
Technologies 12 00130 g003
Figure 4. Representative fluorescence images of cells on micropillar arrays by fixing the pillars’ diameter at 10 µm while varying the pillar gaps from 5 to 20 µm. (a) CL10G5, (b) CL10G10, (c) CL10G15, and (d) CL10G20. In each section, (i) a fluorescent image of cells with pillars (20× magnification); (ii) a close-up fluorescent image of cells with pillars (50× magnification); and (iii) a fluorescent image of cells without pillars (20× magnification). ActinGreen (green) labels cellular actin, and Nucblue (blue) stains nuclei (×20). The scale bar is 50 µm.
Technologies 12 00130 g004
Figure 5. Comparison of cell spreading ratio on different micropillar surfaces and a flat PDMS surface. The cell spreading ratio was the ratio of surface area occupied by cells divided by the total surface area. (a) The blue bars represent the cell spreading ratios on various micropillar surfaces with fixed gaps. (b) The orange bars represent the cell spreading ratios on various micropillar surfaces with fixed diameter. A flat PDMS surface is a control to highlight the differences in cell spreading on micropillar surfaces compared to a uniform, flat surface. The comparison between the two sets of bars emphasises the impact of surface topography on cell spreading dynamics.
Technologies 12 00130 g005
Figure 6. Correlation between surface free energy and cell count versus diameter of pillars. The graph of cell count and surface free energy for the designs CL5G10, CL10G10, CL15G10, CL20G10, and flat PDMS. The p values were obtained using Student’s t-test. (***): p ≤ 0.0005; and (****): p ≤ 0.0001. The error bars show the standard deviations of the experiments (n = 3).
Technologies 12 00130 g006
Figure 7. Correlation between surface free energy and cell count versus gap between pillars. The graph of cell count and surface free energy for the designs CL10G5, CL10G10, CL10G15, CL10G20, and flat PDMS. The p values were obtained using Student’s t-test. (***): p ≤ 0.0005; and (****): p ≤ 0.0001. The error bars show the standard deviations of the experiments (n = 3).
Technologies 12 00130 g007
Table 1. Size of diameter of pillars (L) and gaps between pillars (G) of different microstructured PDMS surfaces.
L (µm)G (µm)Symbol
510CL5G10
1010CL10G10
1510CL15G10
2010CL20G10
105CL10G5
1015CL10G15
1020CL10G20
Disclaimer/Publisher’s Note: The statements, opinions and data contained in all publications are solely those of the individual author(s) and contributor(s) and not of MDPI and/or the editor(s). MDPI and/or the editor(s) disclaim responsibility for any injury to people or property resulting from any ideas, methods, instructions or products referred to in the content.

