Abstract
The use of DC microgrids (DC-µGs) offers a variety of environmental benefits; albeit, a successful implementation depends on the implementation of an Energy Management System (EMS). An EMS is broadly implemented with a hierarchical and centralized structure, where the communications layer presents as a key element of the system to achieve a successful operation. Additionally, the relatively low cost of wireless communication technologies and the advantages offered by remote monitoring have promoted the inclusion of the Internet of Things (IoT) and Wireless Sensor and Actuator Network (WSAN) technologies in the energy sector. In this article is presented the development of an IoT EMS based on a WSAN (IoT-EMS-WSAN) for the management of a DC-µG. The proposed EMS is composed of a WiFi-based WSAN that is interconnected to a DC-µG, a cloud server, and a User Web App. The proposed system was compared to a conventional EMS with a high latency wired communication layer. In comparison to the conventional EMS, the IoT-EMS-WSAN increased the updating time from 100 ms to 1200 ms; also, the bus of the DC-µG maintained its stability even though its variations increased; finally, the DC bus responded to an energy-outage scenario with a recovery time of 1 s instead of 150 ms, as seen with the conventional EMS. Despite the reduced latency, the developed IoT-EMS-WSAN was demonstrated to be a reliable tool for the management, monitoring, and remote controlling of a DC-µG.
1. Introduction
Even though energy availability became indispensable to perform our daily tasks, the production of energy is still responsible for greenhouse gas emissions. This is due to the use of fossil fuels, as well as the constant increasing energy demand by different productive sectors. The use of renewable energy resources (RESs) such as the sun, the wind, and the oceanic waves, is a viable alternative to attend to this worldwide concern. To enhance the exploitation of these energies, the microgrids (µGs) emerge by also presenting the advantage of their implementation in remote locations [1]. A µG is defined as “a group of interconnected loads and distributed energy resources with defined electrical boundaries forming a local electric power system at distribution voltage levels, that acts as a single controllable entity and is able to operate in either grid-connected or island mode” [2].
However, a µG presents the inconvenience of an intermittent energy production from RES due to the stochastic behavior in the atmospheric conditions; this is typically seen in photovoltaic panels and wind turbines. If we add the fluctuations in the daily energy consumption, the different elements interconnected in a µG (e.g., generators, storing energy devices, loads, etc.), and the operating modes of the grid, then the management of the energy balance in a µG becomes a multi-constraint, multi-objective problem. This type of problem implicates a coordinated control of the interconnected elements in the µG; this coordinated control is generally called the Energy Management System (EMS) [3]. An EMS guarantees an efficient and economical operation of a µG by taking account of the generated power by the RES, the state of each element of the µG, the demanded energy by the loads, and even some external factors that could include the electricity and fuel costs, the weather conditions, and their forecasting. Based on these variables, the EMS can manage the energy interchange to minimize the daily operation costs and to reduce energy losses [4].
The interconnectivity of elements in a µG is performed with the use of power electronic converters (PECs). Thanks to the PEC, it is possible for different types of RESs to create a compatibility between them in the µG; therefore, the µG functionality basically depends on the PEC control executed by an EMS [5]. In addition to reducing the negative impact produced by the energy production techniques operating with fossil fuels, the µG not only stands out due to its operation at a higher efficiency and with a lower cost, but also because they it is flexible, resilient, and stable [6,7]. If a µG can operate with a main bus of DC, AC, or both, then a µG can be classified as an AC-µG, a DC-µG, or a hybrid DC-AC-µG [8,9]. However, a DC-µG has more advantages than an AC-µG, such as its independence from a frequency synchronization control and its reduced energy losses by conductivity and reactive power while it transfers a higher power [10].
1.1. Centralized Energy Management System
An EMS is defined as “a computer system comprising a software platform providing basic support services and a set of applications providing the functionality needed for the effective operation of electrical generation and transmission facilities so as to assure adequate security of energy supply at minimum cost” [11]. Usually, a structural hierarchy is implemented as a standardized solution for an EMS, where there could exist three control levels: a primary level, a secondary level, and a tertiary level. The primary level contains a local control for each of the elements interconnected in the µG. In the case of the secondary level, there is a coordinated voltage regulation with the local controllers in the primary level. This level can also include a frequency control in both AC-µG and hybrid DC-AC-µG cases. Finally, the tertiary level is a supervisory level in charge of implementing the control strategies, managing the power interchange, matching the production and energy demand, and optimizing the µG operativity [12]. Based on the distribution of the controllers in each level, the structure control of an EMS can be divided into centralized, decentralized, and distributed. Particularly, in a centralized structure (CS), all the local controllers are managed by a central controller (CC). Here, each present element in the µG sends a constant update about its operative state to the CC, who sends them feedback by using control signals. These signals are essential to set a stability over the DC bus and an organized power interchange between the elements. As the CS operation is based on the information interchange between the interconnected elements in the µG and the CC, the communications layer is the key element for this structure [13,14]. To select the adequate technology for the communication layer in an EMS, it is important to consider the area coverage, the speed transmission, the reliability, and the energy consumption. In the literature is reported the use of both wired (e.g., power line communication, ethernet, and optic fiber, among others) and wireless (e.g., GSM, GPRS, WiMAX, Z-wave, ZigBee, 5G, Bluetooth, etc.) technologies. On the one hand, the wired technologies are not only more reliable than the wireless alternatives; they also have higher transmission speeds. On the other hand, the wireless technologies are cheaper than their counterparts. At the same time, there is a clear tendency to integrate the Internet of Things (IoT) in a µG context; therefore, using wireless communications technologies makes a µG more compatible with this trend [12,15].
1.2. Wireless Sensor and Actuator Network in Internet of Things
A Wireless Sensor Network (WSN) is defined as a set of sensors (wireless sensor nodes) intercommunicated wirelessly and distributed in a determined area. In turn a wireless sensor node (WSn) is an electronic device composed by at least one transducer for measuring physical phenomena, a digital processing unit, a transceiver, and an energy source. Additionally, a WSn can include analog-to-digital converters (ADCs) and digital-to-analog converters (DACs) [16,17,18]. The main tasks of a WSN are acquiring information from its working environment, preprocessing it, and transmitting it to a central node through intermediate nodes. In particular, the WSN has been employed in different fields of study, such as defense, the environment, healthcare, agriculture, energy, and transportation, among others. In all of these fields, the WSN is responsible for three key functions: positioning, monitoring, and controlling [19,20]. To develop a control application with a WSN, it is necessary to extend the network with actuator wireless nodes and controlling nodes to evolve into a Wireless Sensor and Actuator Network (WSAN). Generally, with a WSAN, it is possible to measure the physical phenomena in a process; furthermore, this information is transferred to a controller, whose control actions are finally retransmitted as feedback under a low latency with reliable conditions. As WSANs offer an easy aggregation into IoT applications, they have also gained popularity not only because their implementation requires a smaller infrastructure and expends less effort, but also because they are cheaper than the wired solutions [21,22,23].
The IoT is a paradigm focused on the interconnectivity of collaborative devices working with a common purpose, i.e., to achieve an interactivity between both the physical and virtual environments. Therefore, the IoT integrates sensors, computing systems, Internet, embedded systems, radio-frequency identification (RFID), and communication technologies. In general, an IoT application has three main layers: a perception layer, a network layer, and an application layer. First, the perception layer collects information from the devices (things) after they have acquired information from the working environment. Then, this information is transferred to the application layer through a set of communication technologies established in the network layer. Lastly, the application layer stores the acquired information by the things, and this information is also analyzed and arranged to be displayed for the users in a comprehensible format. Since the perception layer is interacting with the physical world by collecting information from it, the WSN and the WSAN are key elements in this layer [24,25,26]. Today, the IoT has transformed the daily lifestyle of people, mainly by offering the possibilities of monitoring, analyzing, and controlling any kind of device (thing) around the globe with the use of an Internet connection [27].
1.3. Proposal and Paper Layout
This article describes the development of an IoT EMS based on a WSAN (IoT-EMS-WSAN) for a DC-µG. The DC-µG is composed of a PVS, a BESS, a bidirectional AC/DC PEC for the MG interconnection, and variable resistive loads. The EMS overseeing the DC-µG was designed to be centralized and hierarchical, and to function based on a Finite-State Machine (FSM). To make the EMS operative, a WSAN with a central node and three peripheral nodes was developed. These peripheral nodes sense different variables from the connected elements to the µG and establish the operative mode (OM) for their local controllers. Then, the acquired information is sent to the central node, which contains the FSM and responds to the peripherals with the adequate OM for their local controllers. Furthermore, the central node concentrates the received data from the µG and sends them to a cloud server for their storage. Finally, the collected data can be displayed remotely in a User Web App (UWA). The UWA also allows the user to define the OM for each element connected to the µG, where each one can be set to work either with an automatic control (states defined by the FSM) or a manual control.
With this proposal is provided a centralized EMS with a low-cost communication layer between the local controllers and a CC in comparison to wired technologies. Additionally, the EMS has a flexible infrastructure to add more elements in the WSAN, without significant changes. An UWA is included to remotely monitor and control the DC-µG. For this purpose, the UWA presents a graphical and friendly interface that shows the behavior of all the elements connected to the DC-µG, giving the user a general panorama of the whole system, as well as its performance. For the control, the user counts on the possibility of defining an individualized OM for each system contained in the DC-µG. Since the system includes a manual management mode, the user can configure the DC-µG to operate in a safe and stable operative mode under unexpected operating conditions by the energy-management strategies, even for cases unsuccessfully managed by the CC, where any of the systems in the DC-µG presented a failure. Overall, this work contributes to the EMS literature with the following points:
- To present an alternative low-cost flexible communications infrastructure.
- To offer a remote monitoring application based on a graphical and friendly context for the user.
- To provide a remote mechanism for both monitoring and controlling a DC-µG.
- To extend the tertiary layer of an EMS by including remote manual actions to manage unexpected operating conditions (e.g., a failure in any system).
In the following sections of this work, the reader will find related works in Section 2. A description of the structure of the µG and its elements is in Section 3, which also includes the structure of the EMS, as well as its algorithm. Next, in Section 4 is presented the implementation of the EMS by using both IoT and WSAN, whose results are presented in Section 5 and discussed in Section 6. Finally, the conclusions from the system performance are presented in Section 7.
2. Related Works
In this section, the reader will find a set of related works aligned with the application of WSN, WSAN, and IoT in the energy industry. Particularly, these works are focused on the development of applications to manage and monitor energy systems. A comparison between the state of the art of this section and the proposed IoT-EMS-WSAN of this research is performed in Section 7.
Reference [28] presented a smart IoT-based EMS for demand-side management in a smart grid. The system possesses a smart meter, which was built with voltage and current sensors, and a mechanical relay too. With the reading from the sensors, the smart meter computes the values of RMS voltage, RMS current, and the power factor. Then, these values are uploaded to a cloud server, where they are stored and used to compute statistical data about the energy consumption. The statistical data allocated on the server can be accessed by a user through a Web application based on APIs. This system, presented by [28], has only the control action of connecting/disconnecting a load since the system only manages the demand side.
Similarly, Ref. [29] presented the implementation of an intelligent IoT-based EMS for the demand side. Here, the EMS smartly connects/disconnects three loads that are energized with a photovoltaic system (PVS). To define which load must be connected/disconnected, the algorithm takes account of the PVS production and the priority level assigned to each load. A local network oversees for collecting the production, prediction, and operating data of the system, and these data are uploaded to a server for a later visualization. This local network includes a WSAN with a central node and three peripherals to connect the loads. In particular, the EMS proposed in [29] has a control on the demand-side, taking the decision to connect/disconnect a load, but the user cannot infer on this decision.
The design and development of an IoT smart meter with load control for home EMS was presented in [30]. In particular, the smart meter was developed with an electrical energy measurement unit, an ESP32 microcontroller to perform an Internet connection, and a pair of relays to control electric loads connected to two plugs. A cloud server receives the electrical measurements from the smart meter. With this cloud server, it is possible not only to visualize these measurements but also to define some settings to both connect or disconnect an electric load when it exceeds a preestablished threshold for the active power. In a similar way to [28,29], this application only executes controlling actions on the demand side, but in comparison to [29], the user has the possibility to either turn on or turn off the connected electric loads.
In [31], the authors developed an IoT system for a µG to monitor the operation of a lithium-ion battery in real time. The system consists of a battery, a Battery Management Unit (BMU), a GX Gateway, a Raspberry Pi, and a cloud monitoring application developed with Grafana and mariaDB. The BMU used to monitor the battery has the capabilities of measuring the voltage, current, and temperature from the battery, in addition to estimating its state of charge (SoC). With this system, the user not only monitors remotely both the actual and historical state of the battery but also receives an alert if either the SoC or the temperature is out of range from a preconfigured value. In comparison to [28,29,30], this system cannot perform a control action.
A PVS performance-monitoring system was described in [32]. Here, some PV panels were remotely monitored with the use of both voltage and current sensors under an IoT perspective, where all the measurements are uploaded to a cloud server. This proposal presents a simple and economical tool for photovoltaic systems to maintain a continuous follow-up during the energy production. As in [31], this system does not execute any control action, but it differs with a monitoring executed in the generation side.
Correspondingly, Reference [33] introduced a hierarchical control of a µG using IoT, whose control was developed with three layers and evaluated with a simulation in MATLAB. The primary layer was developed to locally control four distributed generators (DGs) which were connected to the main grid (MG). Next, the second layer eliminates the steady-state errors from the voltage and frequency by implementing a sharing algorithm between the DG. Finally, the third layer contains a machine-learning algorithm to detect the best conditions to switch the grid into an islanded mode. The control scheme was implemented with an MQTT broker, where each of the DGs, as well as a pair of phasor measurement units, are connected. In this work, the developed control was centralized, and its algorithm was executed on the cloud.
Along with WSAN applications for µG, Reference [34] showed the implementation of a low-latency secure communication architecture for control operations in an islanded µG. Here, the control was designed to be centralized and to work in a Wi-Fi network. In this case, the control manages a lab-scale DC-µG that is composed of a PVS, a battery energy storage system (BESS), and two loads with the capability of being disconnected. The wireless network is composed of a CC and peripheral nodes that monitor the connected elements in the DC-µG. On the one hand, the peripheral nodes send to the CC relevant information from the devices connected to the DC-µG. On the other hand, the CC responds with commands to the peripheral nodes to configure the operation modes of the local controllers from the PVS, the BESS, and the loads. Contrary to [33], the control algorithm of this architecture is executed in a local node and does not count with Internet connectivity.
3. Microgrid Description
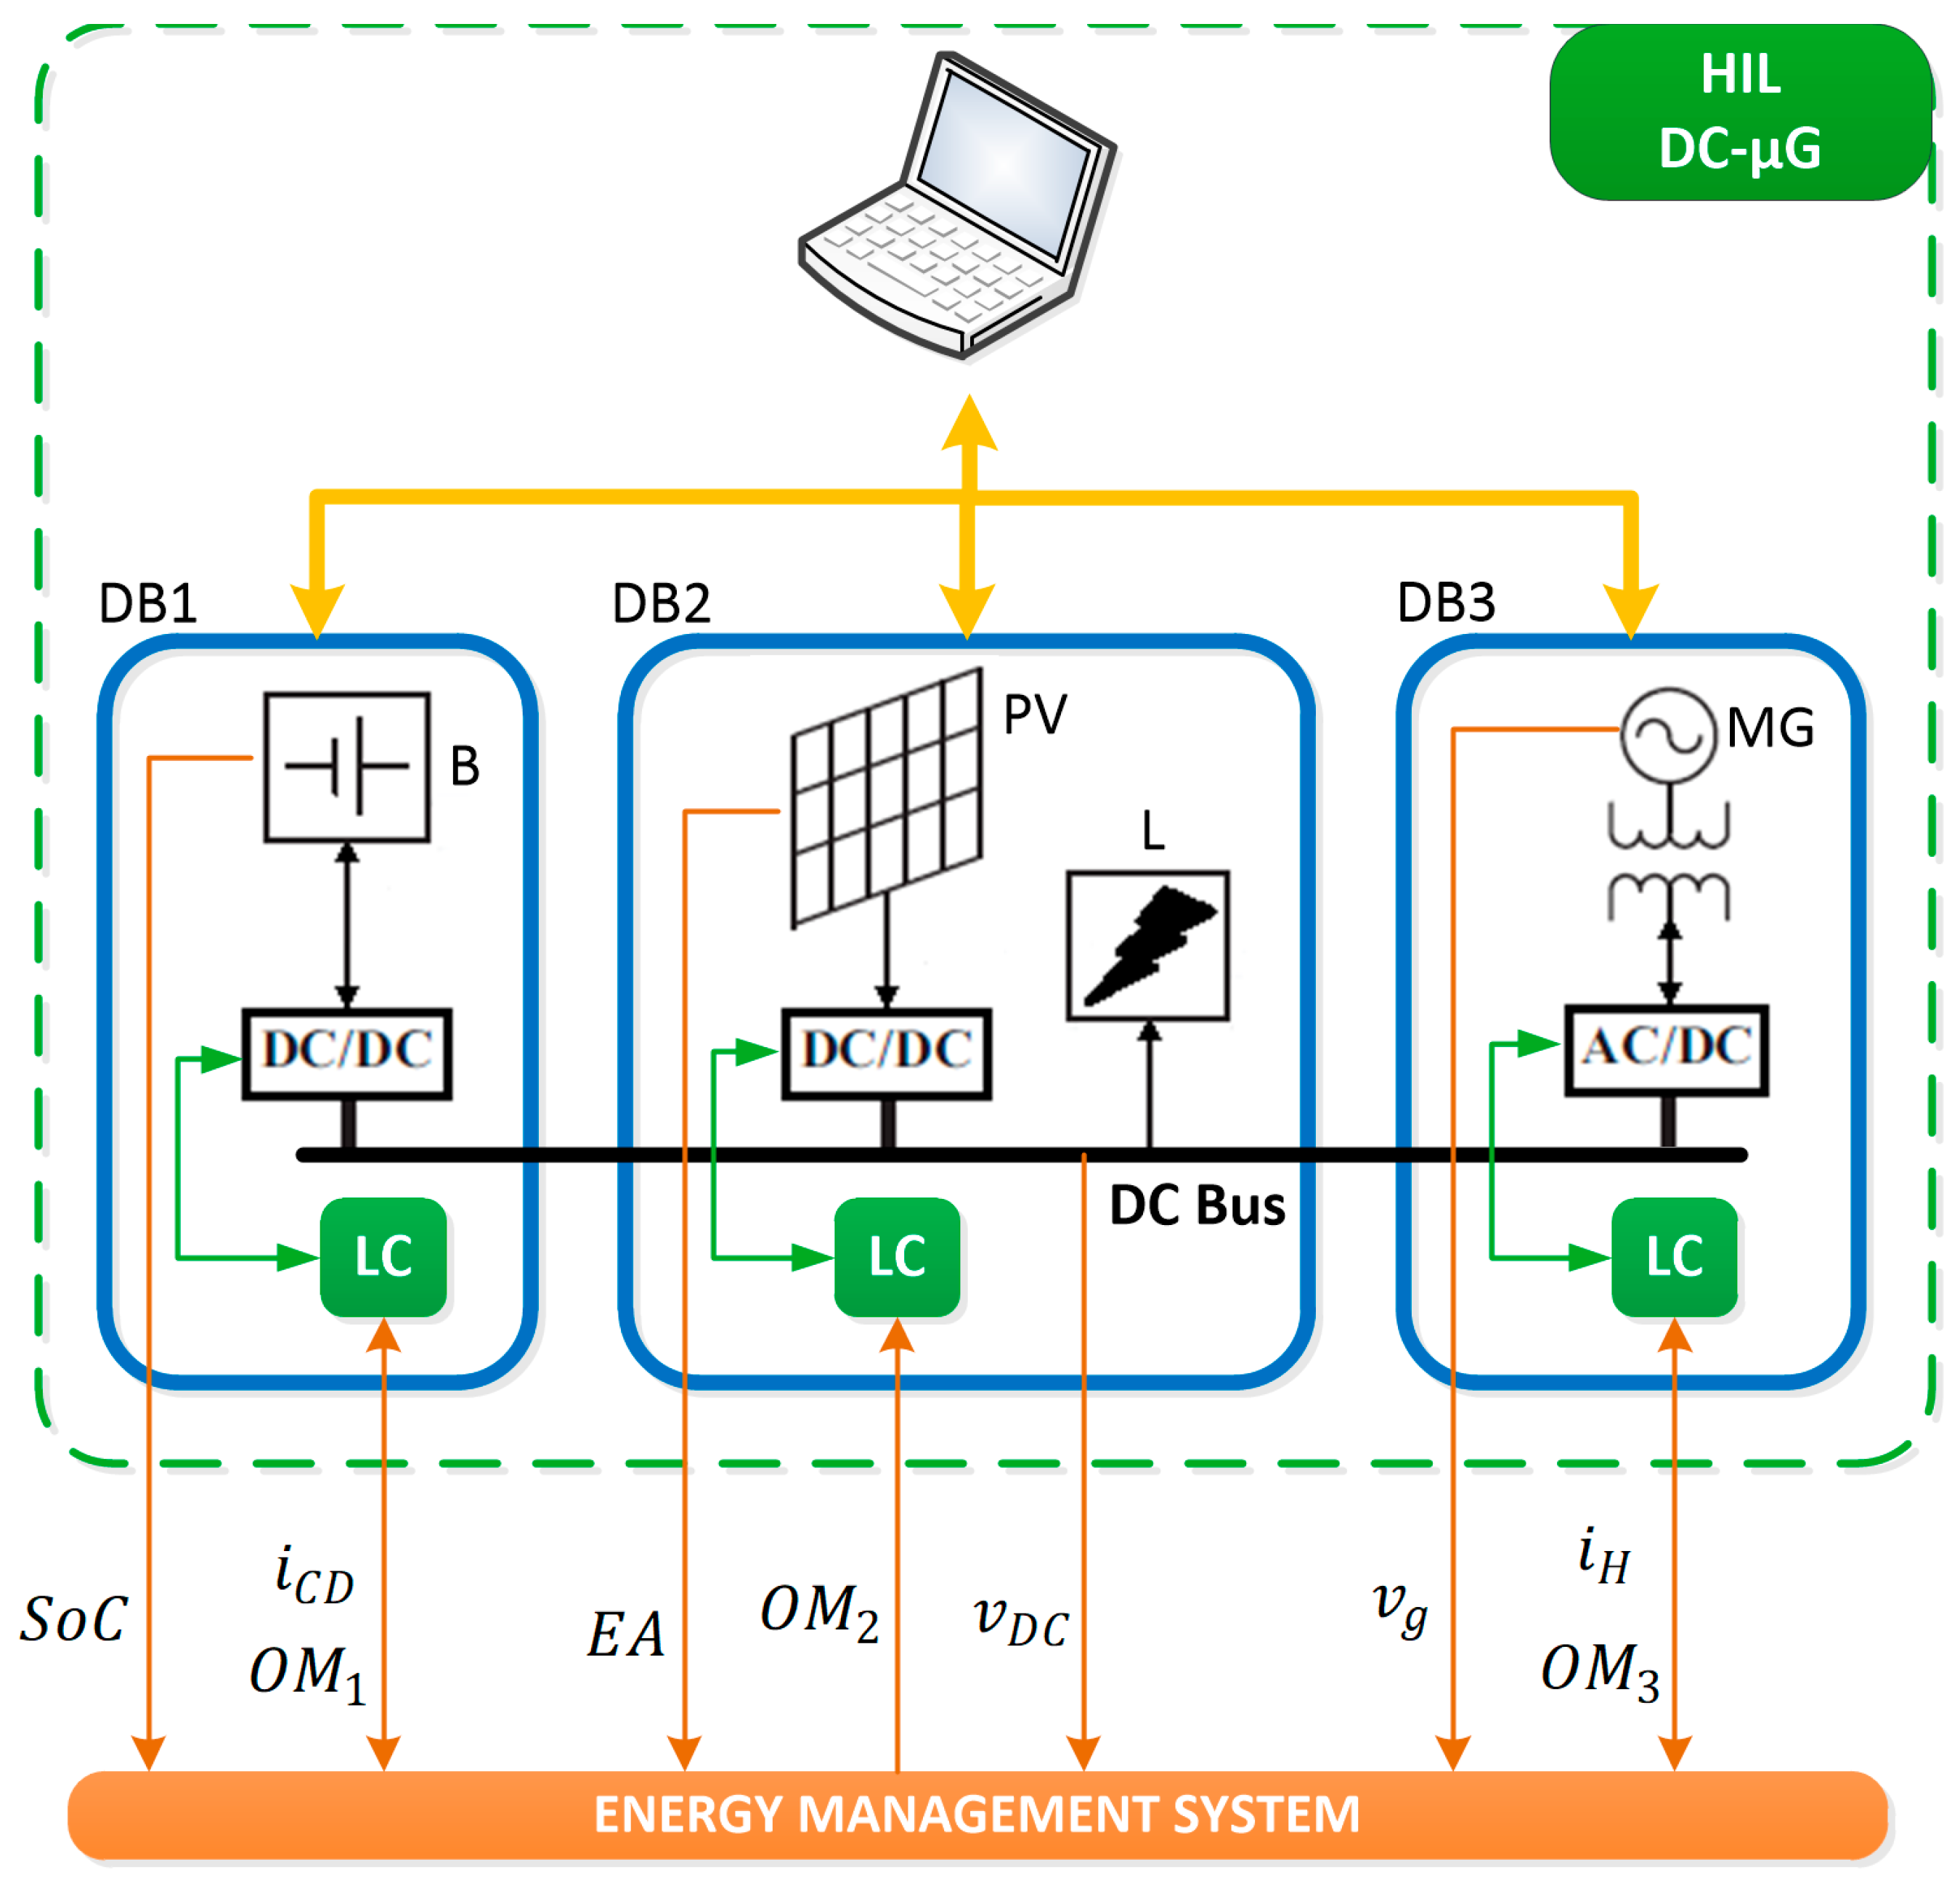
The DC-µG that was designed and implemented in this work is shown in Figure 1. The µG includes a PVS, a BESS, a bidirectional AC/DC PEC interconnected with the main grid (labeled MG in Figure 1), and a DC load (labeled L in Figure 1). In the case of the PVS, the system is composed of a photovoltaic array (labeled PV in Figure 1), a DC/DC Boost PEC, and a local controller (labeled LC in Figure 1). It is important to mention that the PVS can be disconnected from the DC bus or, while connected to the bus, operate in either a Maximum Power Tracking Point (MPPT) mode or voltage mode. In the first mode, the system operates by extracting the maximum power available from the PV to be injected into the bus. The second mode maintains the regulation of the DC bus voltage to a setpoint. The BESS is built with a battery bank (labeled B in Figure 1), a bidirectional DC/DC PEC, and a LC. This system can work in two directions: it can extract the stored energy from the batteries to be used by the DC bus or extract the energy from the DC bus to charge the batteries. The bidirectional AC/DC PEC includes an LC and has the purpose of interconnecting the DC-µG to the MG. Therefore, the AC/DC PEC can be set to operate as a rectifier to provide the DC bus with energy from the MG or to operate as an inverter to provide the MG with energy from the DC bus. Finally, the local loads were defined as purely resistive and variable for this study.

Figure 1.
Implemented DC-µG to develop an IoT-based EMS.
A HIL platform was used to emulate the DC-µG, which is a broadly used strategy to validate control systems and EMS [35,36,37,38]. So then, the HIL platform used in this work was built with three NI MyRIO 1900 development boards and a PC. The HIL platform is marked with a dashed green rectangle in Figure 1; meanwhile, the development boards correspond to the blue rectangles with the identifiers DB1, DB2, and DB3. The PC is used to configure the parameters of each system contained in the DC-µG. These parameters include the number of PVs, the daily profile of photovoltaic energy production, the number of battery cells, the initial state of charge (SoC) of the battery bank, and the MG voltage, among others. Also, the PC interface allows the user to specify power outages in both the MG and PV to monitor the evolution of each system of the DC-µG and to store data locally during the operation of the DC-µG.
Energy Management System
To achieve a safe, efficient, and economical operation from the DC-µG, the implementation of an EMS with 4 main objectives was proposed:
- To maximize the use of the RES.
- To guarantee the demanded energy supply by the DC load.
- To maintain a regulated DC bus.
- To reduce the operation cost.
At the same time, to achieve these objectives for the EMS, five energy management strategies were proposed. These strategies are aligned with the objectives as follows:
- To extract the maximum power from the PVS whenever it is possible: Under this strategy, the use of RES is maximized, as was established for the first objective.
- If there is an energy surplus, then the energy excess must be preferably stored into the battery bank: the RES in the DC-µG presents as the unique resource capable of achieving an energy surplus; consequently, the storing of this surplus contributes to the first objective. Furthermore, the availability of stored energy in a battery bank aids the DC-µG to successfully respond in the face of energy outages from the main sources. This preventive action contributes to the second objective.
- If there is an energy deficit, then the required energy to be supplied in the grid must be preferably obtained from the MG: since the size of the battery bank might increase the cost of the system, this statement contributes to objective 4.
- Only one of the independent systems (i.e., the PVS, the BESS, or the bidirectional AC/DC PEC) is responsible for regulating the DC bus voltage at once: with this, both the local and secondary controls ease the DC bus regulation, as required by the third objective.
- The load is unknown and variable, and there is no control over it: by assuming an unknown variable load, all the EMS levels are designed for achieve an adequate operation when a change in the load occurs. This statement has an impact on the second objective.
Based on these energy management strategies, an EMS was developed using a Moore FMS; this strategy is like other reports [39,40,41]. As described in Section 1, the EMS has a hierarchical CS with a CC. Particularly, the CS was designed considering the LC of the elements contained in the DC-µG and their OM as both the primary and secondary layers; meanwhile, the FSM occupies the tertiary layer. The FSM has nine states in total, which were defined based on all the operative combinations of the OM of each system connected to the DC-µG. As a result, the outputs defined by each state are control commands that indicate an OM for each system allocated in the DC-µG. The LC of the bidirectional AC/DC PEC determines if the PEC operates either as a rectifier or as inverter, and the FSM takes account of these operative modes for its state transitions, where the corresponding output for the PEC will be defined as connected or disconnected. Table 1 shows the FSM states and the OM outputs for the BESS, the PVS, and the bidirectional AC/DC PEC, which are defined as , , and , respectively.

Table 1.
FSM output table.
Conversely, the inputs for the FSM were defined as the SoC of the battery bank, the current extracted/injected to the DC bus by the PEC of the BESS (), the current extracted/injected to the DC bus by the bidirectional AC/DC PEC (), the DC bus voltage (), the peak voltage of the MG (), and the Boolean variable to indicate the availability of energy in the PV. The interaction between the DC-µG and the EMS through the FSM inputs and the OM can be seen in Figure 1. This interaction was established with inputs and outputs in both digital and analog formats. A set of analog outputs in a range from 0 to 5 V were defined for the variables , , , , and . On the one hand, the and variables were established using a 2-bit digital input for each one to codify their different OM. On the other hand, the variable was defined with a 1-bit digital input because its behavior only corresponds to a connected/disconnected mode. Finally, the was established as a 1-bit digital output. These inputs and outputs were connected to the peripheral nodes of the WSAN; these connections are explained in detailed in Section 4.1.
Since the FSM has 61 possible transitions in total, we preferred not to include its state transition table and diagram to avoid an extensive paper. However, a general explanation on the transitions of the FSM states (see Table 1) is added next:
- Initially, the PVS operates under an MPPT mode (state B). In the meantime, the system evaluates if the DC voltage in the bus is at the preestablished setpoint with a ±5% tolerance. If the DC voltage is in this range, then the demanded energy by the load is equal to the energy delivered by the PVS. On the contrary, there will be either an energy deficit while the value is below the range or a surplus while the value is above the range.
- If the system identifies an energy deficit, then, first, the availability of the MG is verified. When the MG is available, the grid is connected to compensate the energy deficit (states G and H). On the contrary, the unavailability of the MG leads to the algorithm to verify the SoC of the battery bank. If the SoC is above 30%, then the BESS is used to deliver the necessary energy (states F and H). In the case where the MG is not available and the SoC of the battery bank has an adequate level, all the energy sources are disconnected due to their incapability to fulfill the energy required by the load (state A).
- The presence of an energy surplus allows the system to take this surplus to be stored into the BESS while the SoC of the battery bank is below 80% (state D). If the battery bank is charged and the MG is available, then the energy surplus is injected into the MG (state E). Finally, when the battery bank is completely charged but the MG is not available, the PVS is set to operate in voltage control mode (state C). In this mode, the PVS maintains and regulates the bus voltage even if it is not possible to extract the maximum power from the PV.
The two main thresholds that regulate the transitions for the FSM are the SoC of the battery bank and the voltage bus variations in reference to the preestablished setpoint. In the case of the SoC threshold, a range from 30% to 80% was defined; meanwhile, a ±5% threshold was established for the DC voltage bus. To guarantee the power quality for microgrids, a threshold ranging from 0.1% to 7% is a valid parameter for a rapid voltage change [42]. Therefore, based on [42], by setting a ±5% threshold, it is possible to prevent a transition of the FSM during a rapid voltage change event, maintaining the power quality too. Although the SoC could take values in a range between 0% and 100%, a battery works with SoC values from 20% to 80% in reality [43]. For this work, the inferior limit was defined as 30% in order to avoid an over-discharging; however, this limit can take a lower value, i.e., 20%, as suggested by [43].
Before the implementation of the EMS using the IoT, the management system was evaluated with a controller HIL technique. In this evaluation process, the FSM was developed in the PC of the HIL platform, whose results were satisfactory. The communication between the CC and the LC of the DC-µG was established with a TCP/IP protocol and a 100 ms sampling rate. Pre-testing the FSM on the HIL platform ensures that the IoT EMS’s performance is solely dependent on the WSAN implementation.
4. IoT Energy Management System Description
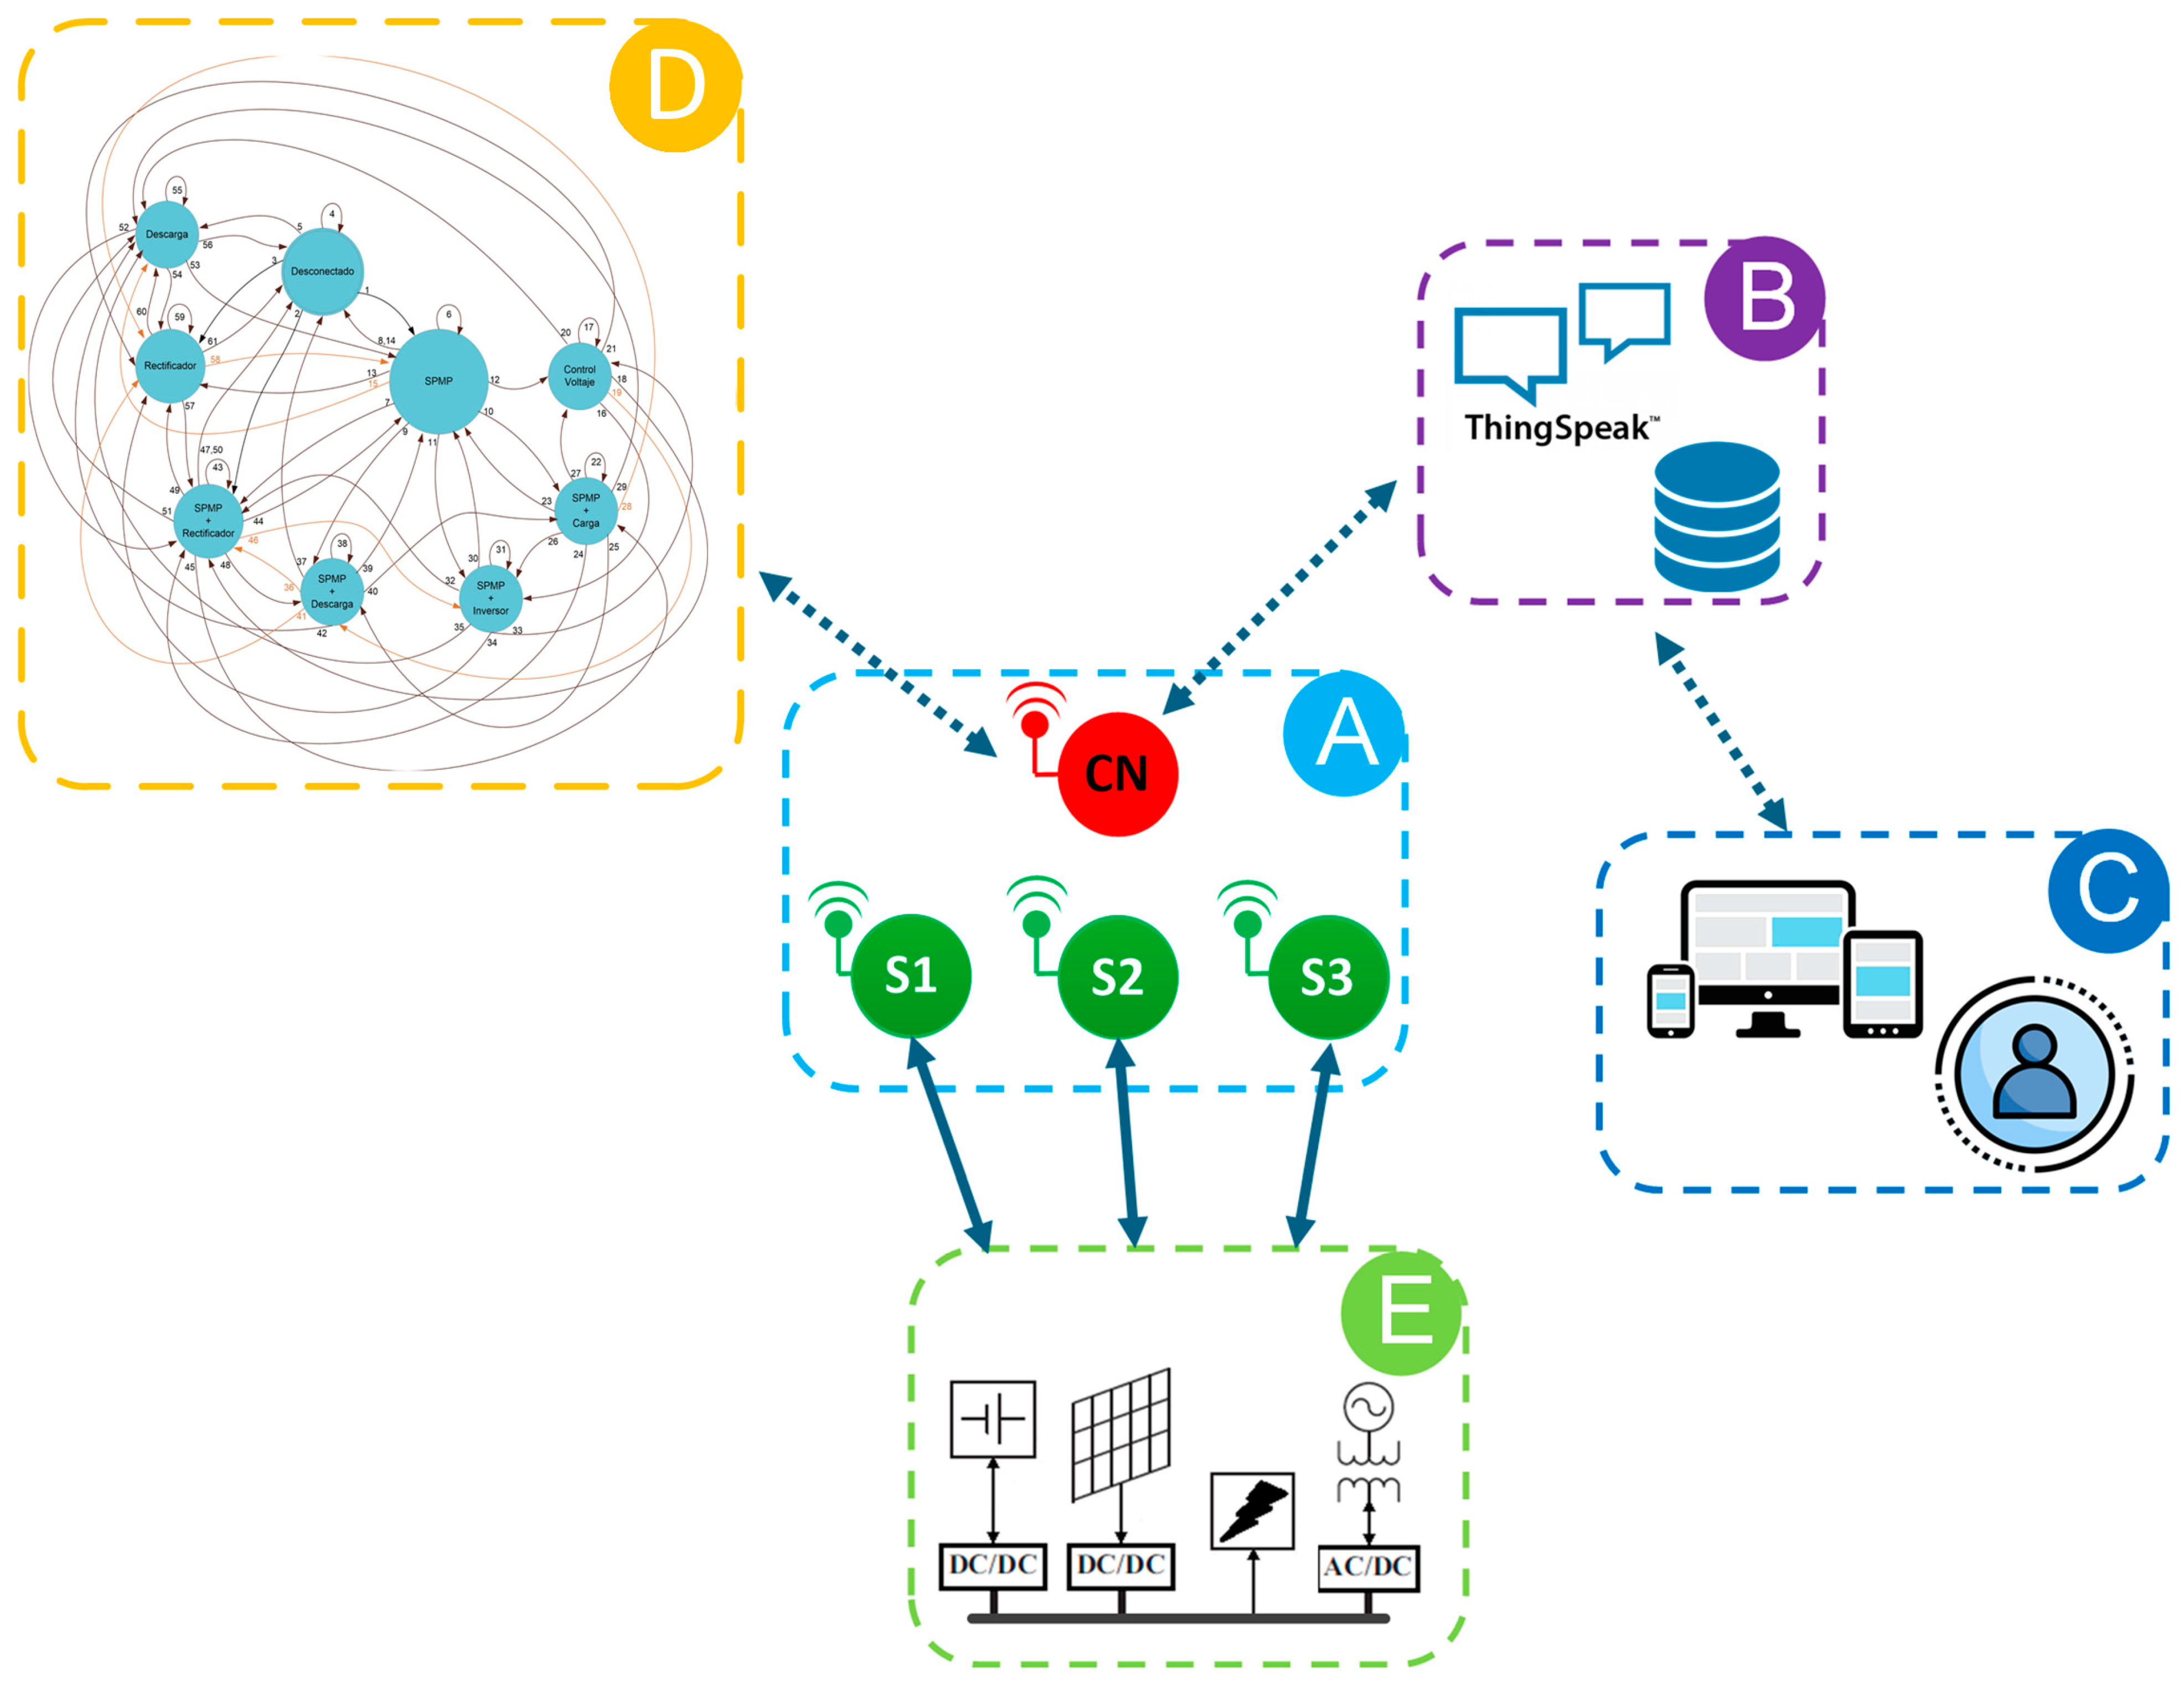
The IoT-EMS-WSAN structure implemented in this work has five elements, which are indicated by the blocks labeled from A to E in Figure 2. The WSAN that monitors and controls the DC-µG is represented by block A. Block B represents a cloud server storing the collected data by the WSAN; in this research, ThingSpeak [44] was used as a cloud server. Additionally, this server has the purpose of linking up the user with the DC-µG through a UWA. The UWA (block C) also allows the user to both remotely monitor and control the DC-µG through the WSAN. Next, block D refers to the designed FSM acting as an EMS to manage the elements of the DC-µG; the execution of the EMS is made in the master node of the WSAN. Finally, the DC-µG is represented by block E. With this IoT-EMS-WSAN, the user not only can remotely monitor the evolution of the DC-µG but also define if the µG operates in a manual or automatic mode. By selecting the manual mode, the user defines the OM for each element of the DC-µG. On the contrary, the automatic mode allows the EMS to dictate the OM for each element of the DC-µG. As blocks D and E are described in Section 3 above, the following sections contain only a detailed description about the characteristics and functionality of blocks A, B, and C.
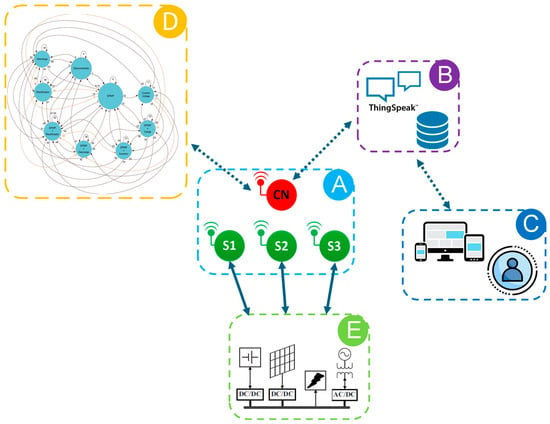
Figure 2.
Structure of the IoT-EMS-WSAN: (A) wireless sensor/actuator network, (B) cloud server, (C) user web app, (D) finite state machine, (E) DC-µG emulated.
4.1. Wireless Sensor/Actuator Network (Block A)
The WSAN architecture is shown in Figure 3. Here, it is shown that the nodes are communicated via Wi-Fi, using a Hypertext Transfer Protocol (HTTP). This network was configured to follow a master–slave model with a star topology. Following this, the WSAN has a master or central node (CN in Figure 2 and Figure 3) and three slave nodes (S1 to S3 in Figure 2 and Figure 3). The nodes S1 to S3 were designed to act as local servers (LSs), to acquire information from the DC-µG through a set of sensors, and to modify the OM of the elements connected to the DC-µG through their LC, and that is why these nodes can be considered as actuators too. In essence, the elements S1, S2, and S3 integrate the primary and secondary layers of the EMS; meanwhile, the central node (CN) occupies the tertiary layer. In this layer, the CN is responsible for executing the EMS and connecting to the cloud server (block B in Figure 2) as a client.
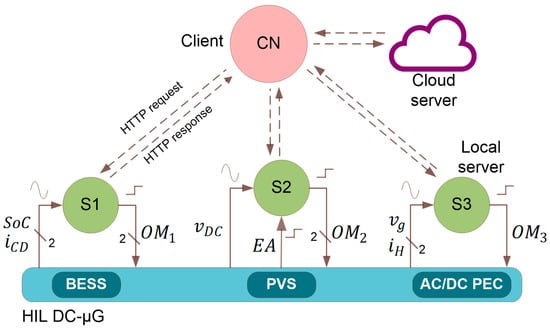
Figure 3.
WSAN architecture.
To recover the measured variables from the DC-µG and to update the OM on each element of the DC-µG, the CN interacts directly with each LS by using HTTP requests. In the case of S1, it is associated with the BESS through two analogic signals and two digital outputs. With the analogic signals, S1 receives information related to the SoC of the battery bank and the extracted/injected current to the bus by the BESS (). The digital outputs allow S1 to modify the operative mode of the BESS. The PVS is monitored by S2 through an analogic input to measure the voltage present in the DC bus. Also, the PVS uses the digital signal to communicate the availability of energy from the PV. Similarly to S1, the operative mode of the PVS is modified with two digital outputs from S2. The final LS, i.e., S3, was connected to the bidirectional AC/DC PEC with a set of two analogic signals and one digital signal. One of the analogic signals is used to report the MG voltage (), while the other corresponds to the extracted/injected current to the bus (). Lastly, the OM of the PEC is modified by S3 with the digital signal. It is important to mention that not all of the LSs compute control actions, because their functions are restricted to measure variables from the DC-µG and to send these measurements to the CN. Later, the LS receives the adequate OM from the CN to be codified, and the OM is communicated to the LC afterwards. The complete communication process, including the order of sequences and the information flow, is described in the following section.
4.1.1. Central Node (Client)
The CN is a key element in the IoT-EMS-WSAN because it serves as a link between the user and the DC-µG. For the most part, this is thanks to its role as an intermediary between the WSAN and the cloud server. For now, the general operation of the CN is illustrated with the flowchart shown in Figure 4, which is described next.
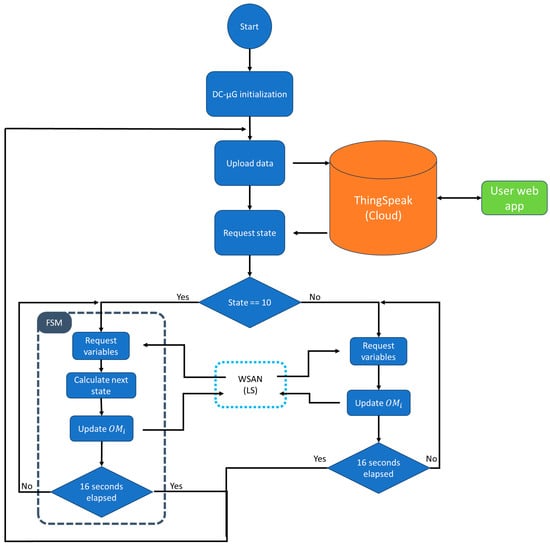
Figure 4.
CN functioning flowchart.
First, the CN initializes a default state in the FSM, where all the systems in the DC-µG are disconnected from the DC bus. Next, a connection is established with the local Wi-Fi network that allocates all the LSs. With a successful connection, the CN performs a set of HTTP GET requests (HGRs), whose content includes the OM, as a parameter of the URL, for each element of the DC-µG. As a result of these requests, the LS leads the DC-µG to the default state. Immediately, the CN performs another HGR, but to ThingSpeak, to receive a mode in which the EMS should operate the DC-µG, i.e., if the µG will be operating either automatically or manually, as defined by the user. This setting is stored in ThingSpeak in a channel called the manual control channel (MCC); this setting derives two different cases.
Thus, in the first case, ThingSpeak will respond to the HGR with the state “10” of the FSM—albeit, the FSM only has 9 states—to operate under an automatic scheme where the FSM determines the OM for the systems in the DC-µG. After selecting the automatic mode, the CN sends an HGR separately to each LS to request for a measurement of its respective variables (, , , , and ). Based on the collected measurements, the CN computes the next state in the FSM to define the corresponding OM for each LS by sending a new HGR separately. Consequently, the DC-µG goes by different operative modes after each LS modifies or maintains the values from its digital outputs. In each cycle, the CN verifies the elapsed time since its last connection with ThingSpeak. If the elapsed time is at least 16 s, then the CN uploads information to the server, referring to a pair of HGRs. Otherwise, the CN keeps a routine of measuring variables from the DC-µG, calculating the next state in the FSM and updating the OM of the µG elements. When the CN is uploading data to ThingSpeak, in the first HGR is sent the established state by the FSM, which is saved in a channel named status channel (SC). The second HGR uploads the measurements made by the WSAN from the DC-µG; these measurements are saved in a six-field channel called the variables channel (VC).
In the second case, which corresponds to a manual operation of the DC-µG, ThingSpeak will respond to the HGR with one of the nine available states in the FSM. These states correspond to the rows ranging from A to I in Table 1. Here, the DC-µG works based on the selected state by the user. This state will be maintained indefinitely unless the user makes a new selection; therefore, the FSM does not intervene in the definition of OM. In a similar way to the automatic mode, the CN performs an HGR on each LS separately to obtain the measurements of the DC-µG to maintain and update the VC.
4.1.2. Slave Wireless Sensor/Actuator Nodes (Local Servers)
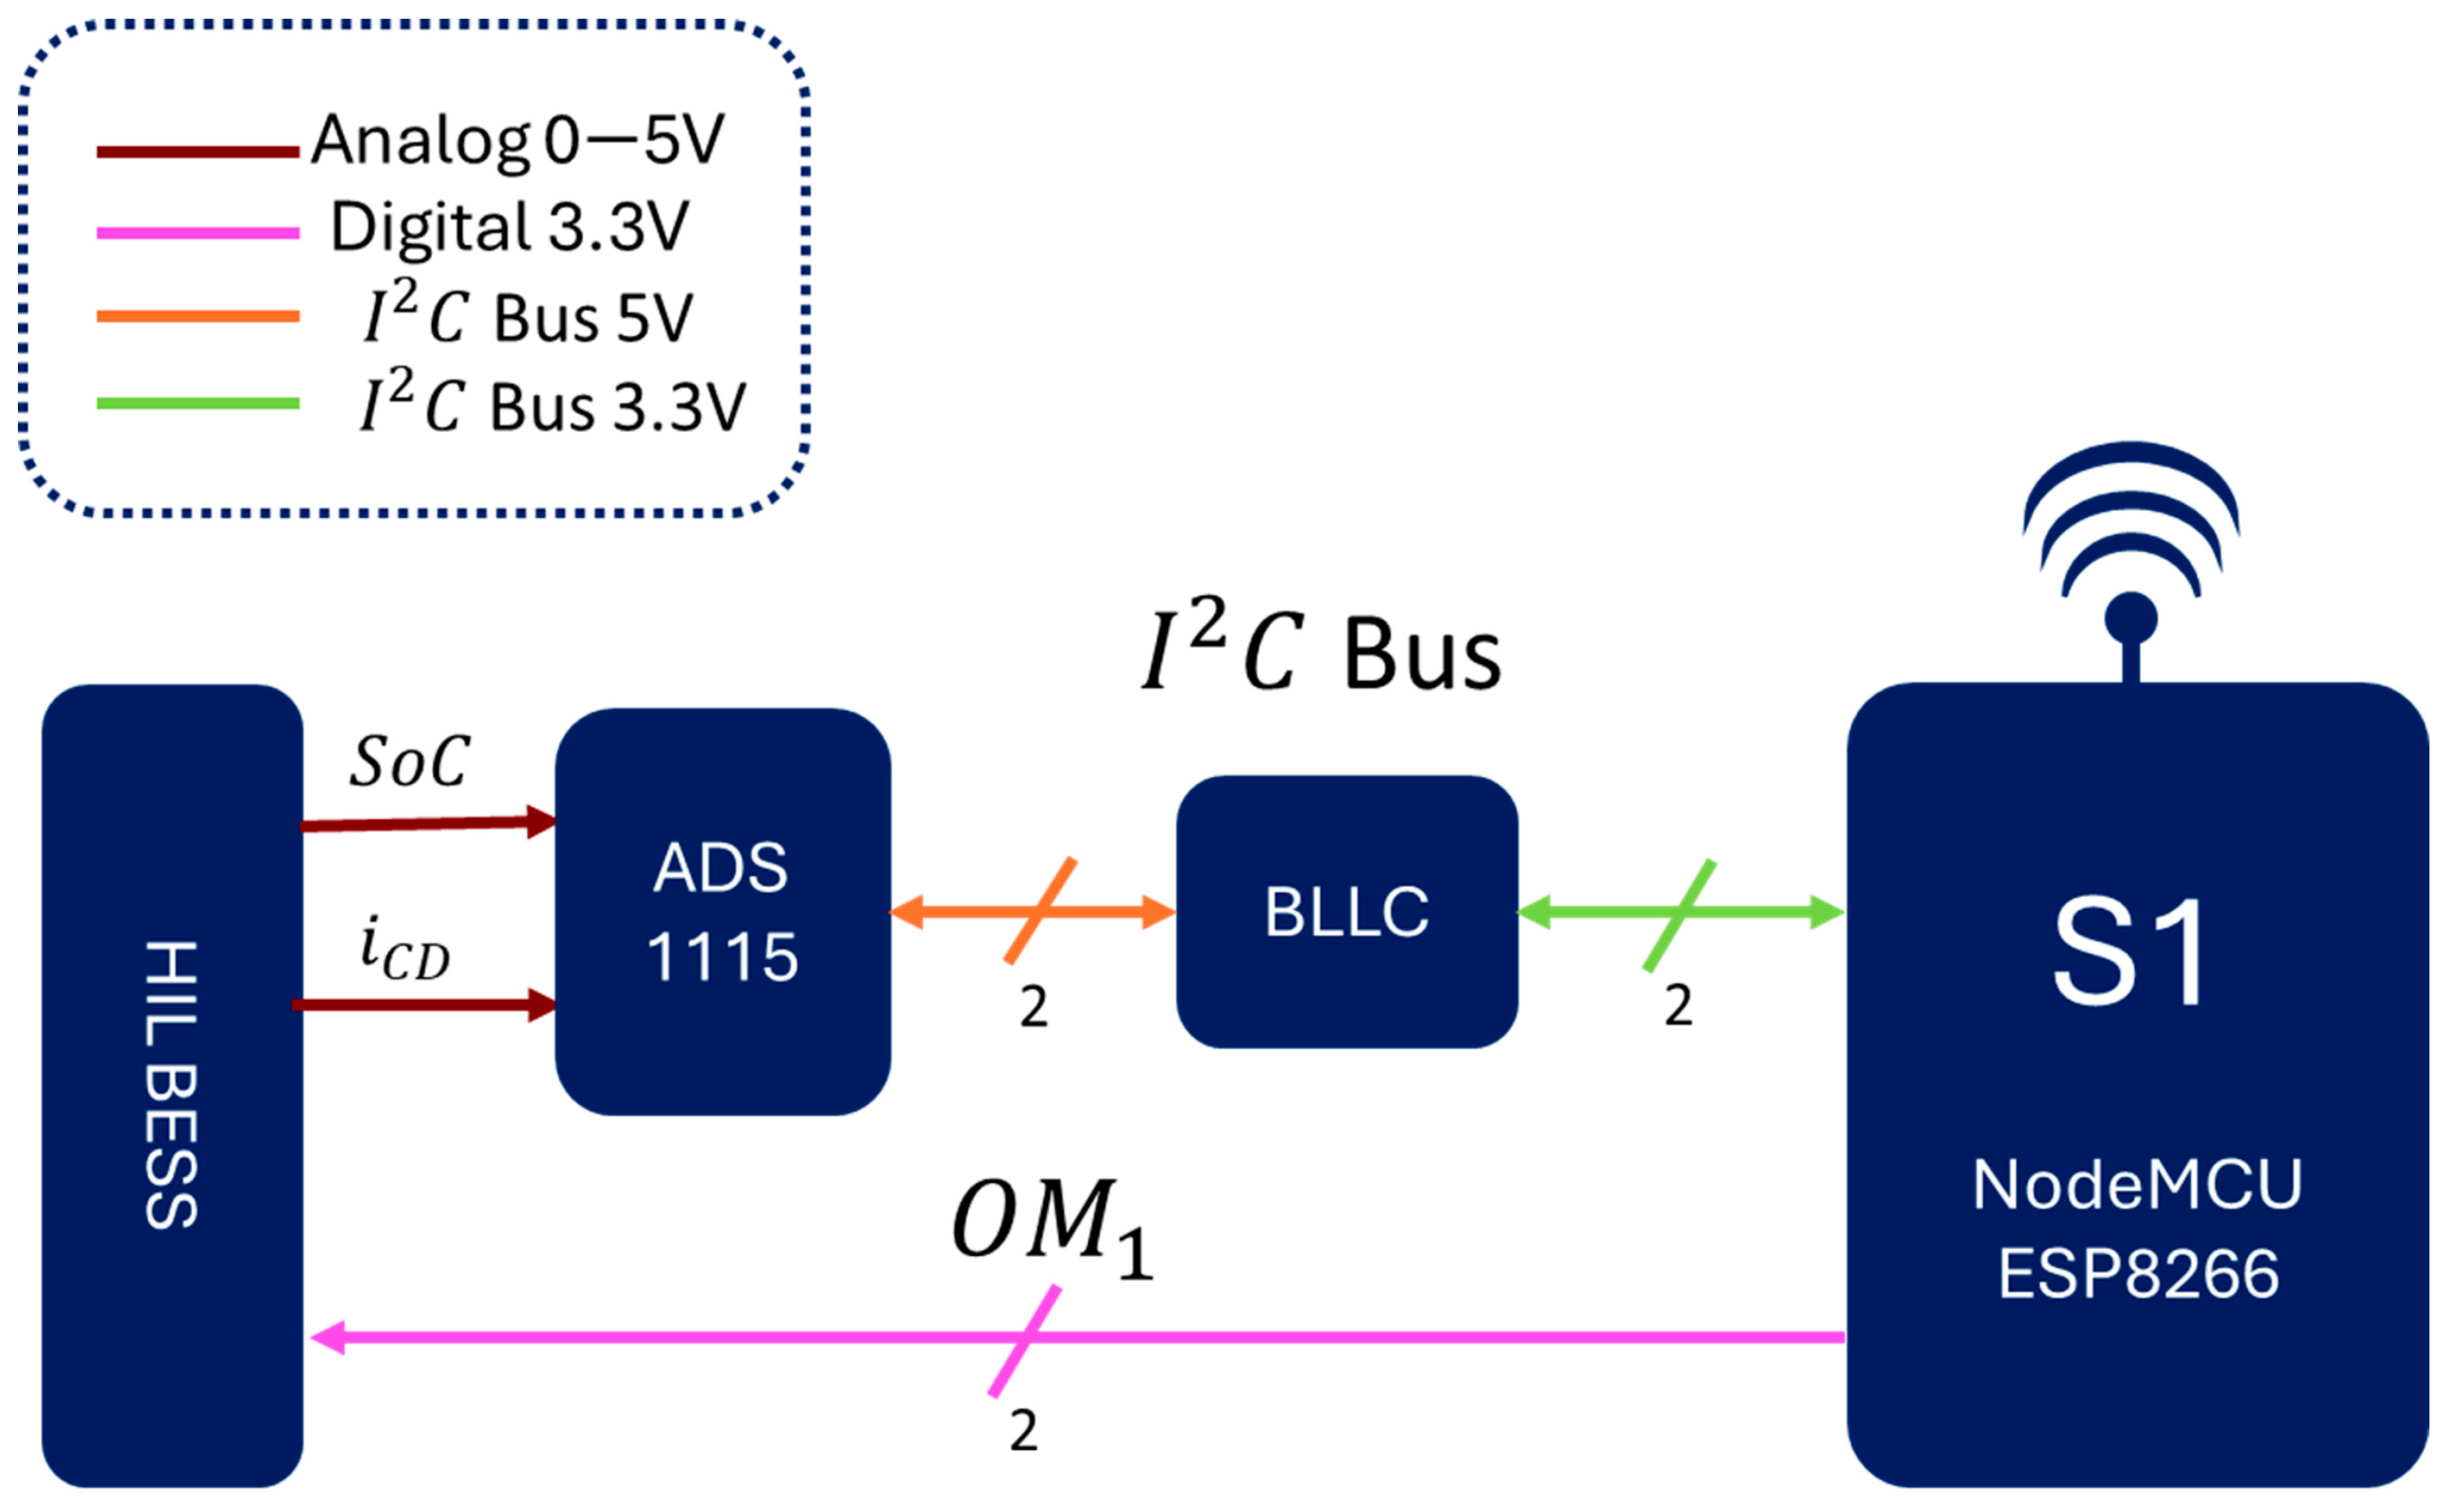
The CN and the set of LSs were created with a NodeMCU ESP8266 development board, which has the capability of connecting to a Wi-Fi network. Particularly, the digital input/outputs of this board work in a range from 0 to 3.3 V, and the board has only one ADC with a conversion range from 0 to 1 V. For these reasons, the use of the board required some adaptions to be coupled to the HIL platform, including the attachment of a bidirectional logic level converter (BLLC) to couple an ADS1115 module (4-channel ADC with a 16-bit resolution). In Figure 5 can be seen an example of the interconnection of these elements for the slave node S1. The ADS1115 can be used to perform the measurement of four single-ended voltage signals or two differential signals; the module works with an I2C communication protocol. Although the LSs are supposed to be WSns too, the LSs used in this work do not include sensors since the HIL platform used to emulate the DC-µG also emulates the sensors.
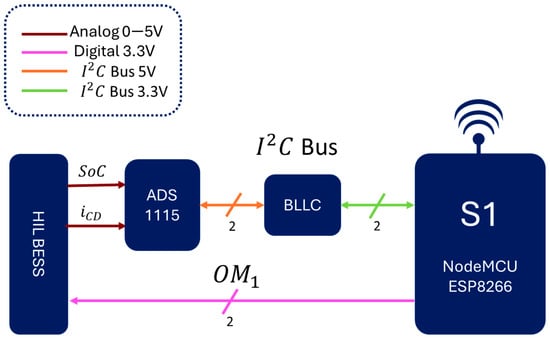
Figure 5.
Example of the interconnection of a slave node with the HIL platform.
As mentioned before, the CN and the LS communicate with each other via the Wi-Fi network and using HTTP. To perform an HGR to the LS, the CN makes use of its IP address. On each cycle executed by the CN for both manual and automatic modes, the LSs receive two HGRs each, the first to request the measured variables from the DC-µG, and the second to update the OM. In total, the HGRs consume around 1200 ms during a single cycle executed by the CN: each LS consumes around 400 ms.
4.2. Cloud Server (Block B)
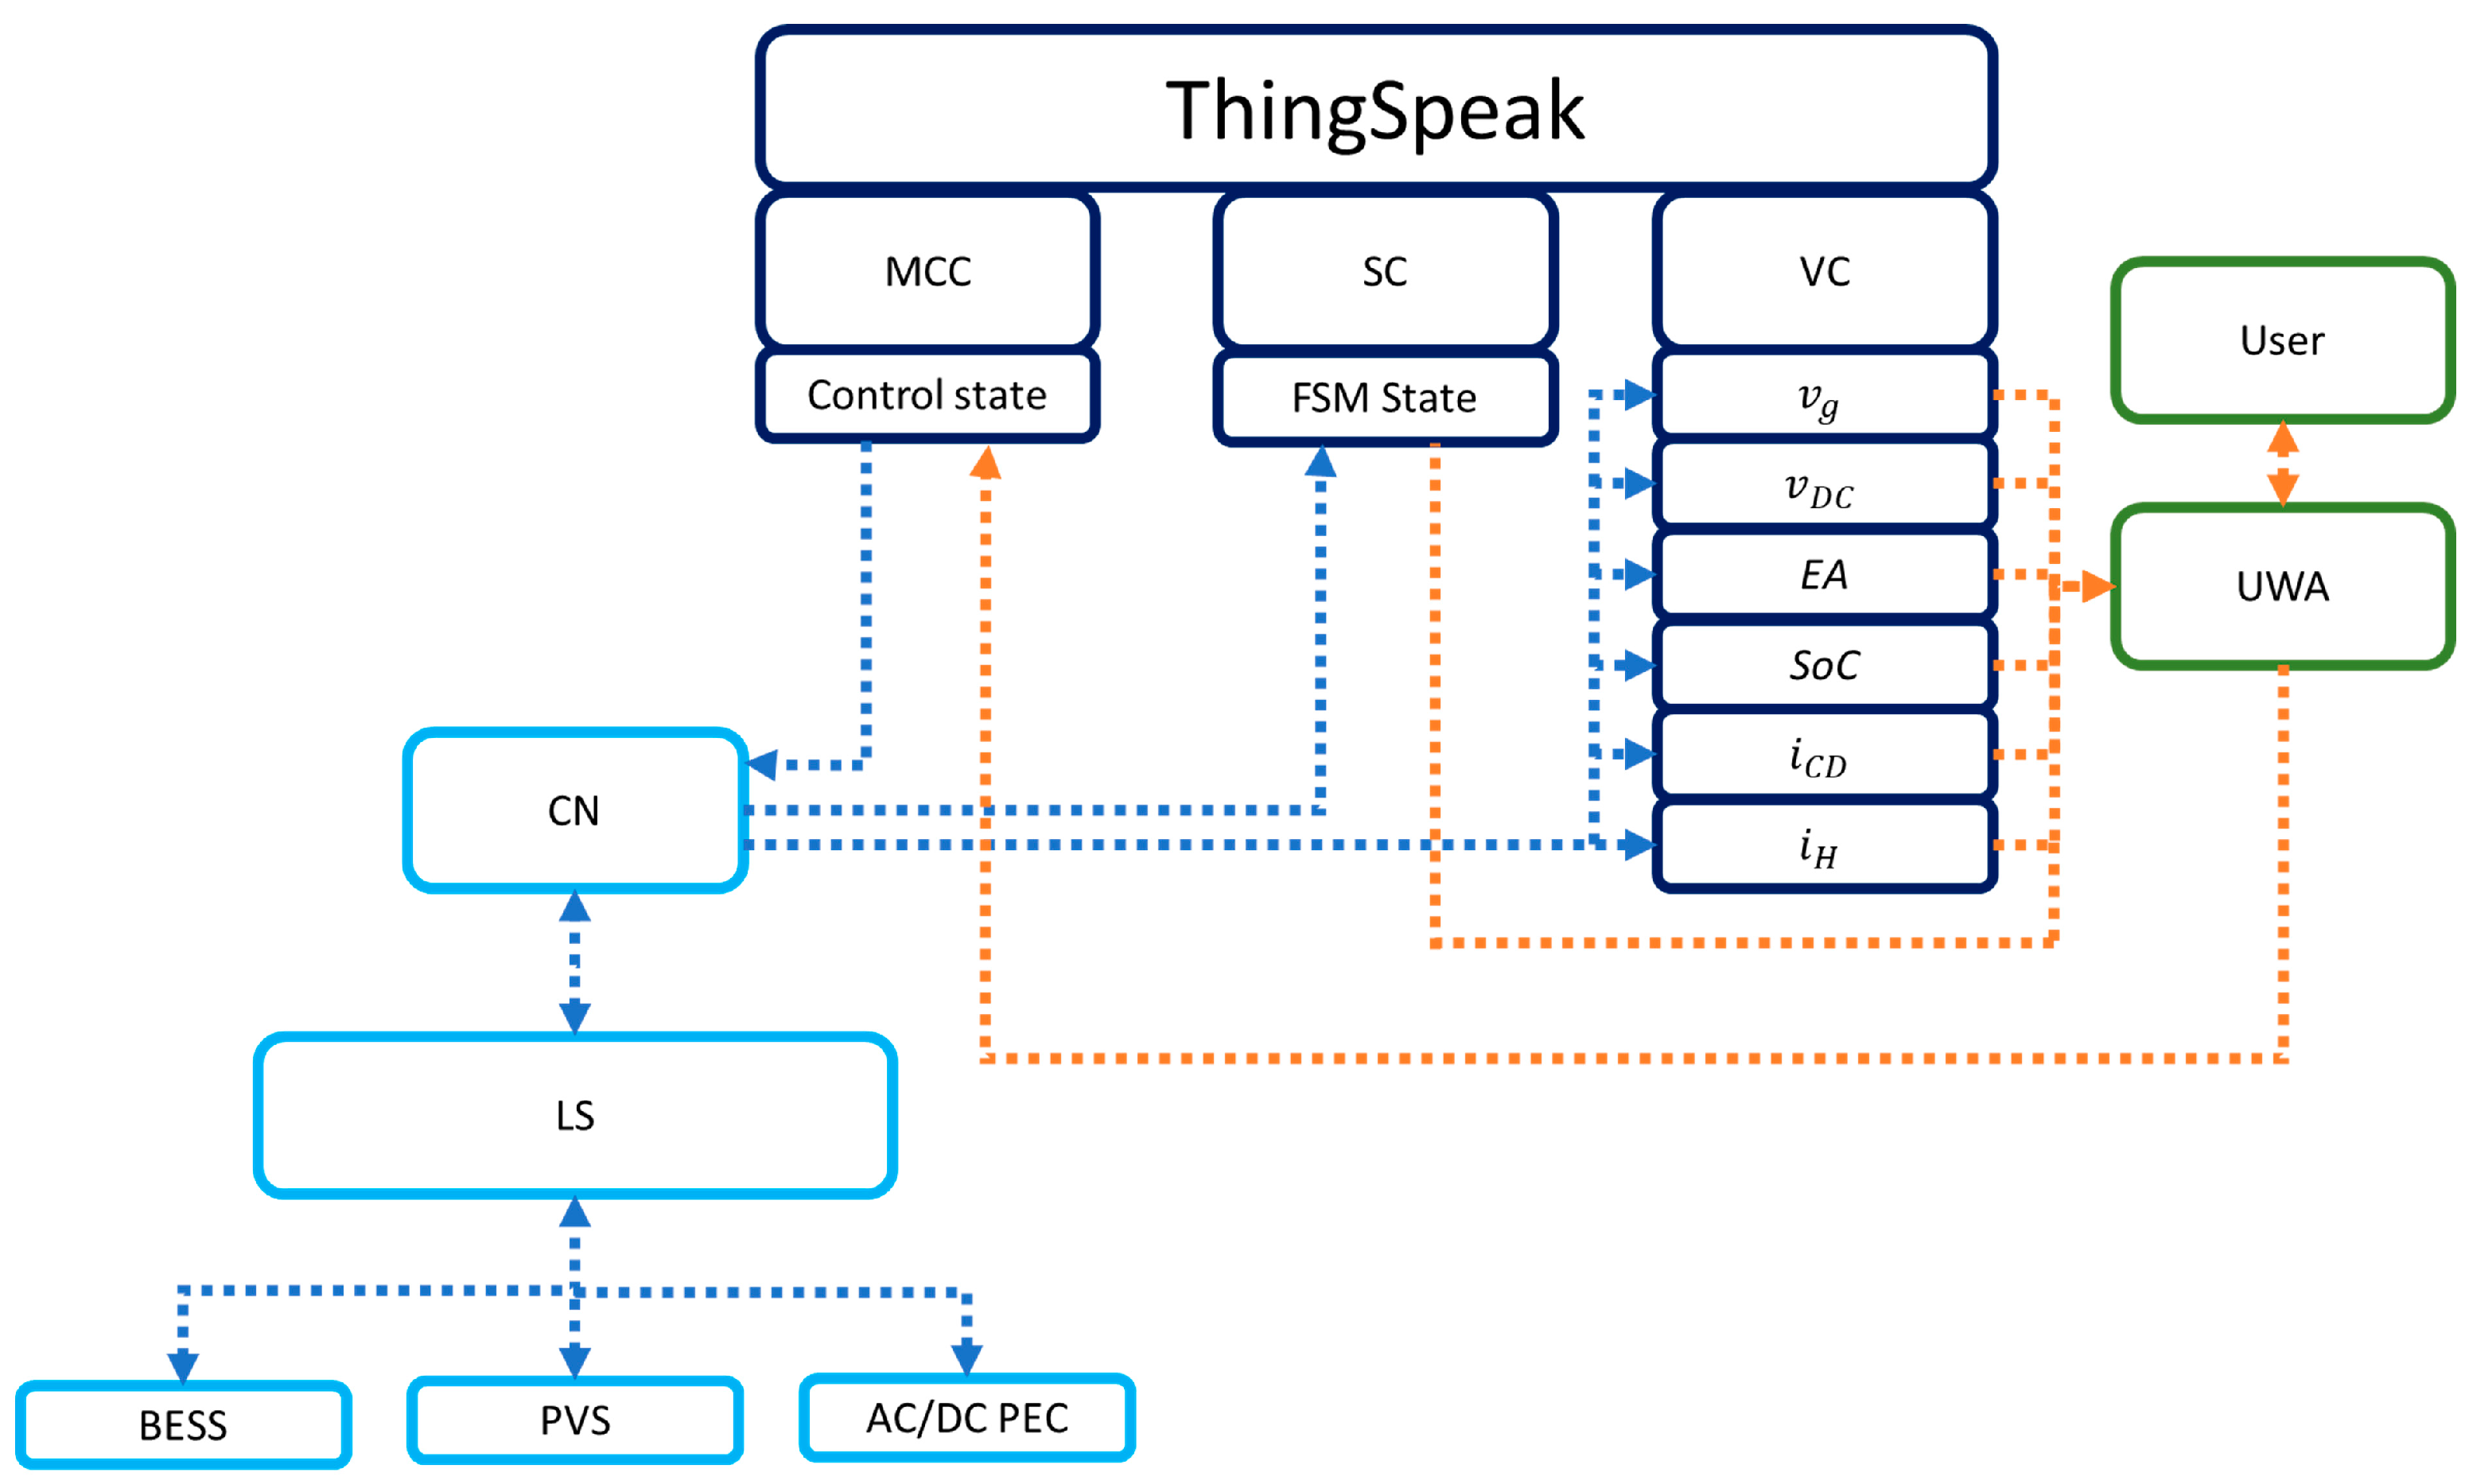
ThingSpeak was selected as the cloud server for this work due to several benefits, including the storing capability and the accessibility to an API, which was used to link bidirectionally with the UWA and the CN. Previously, in Section 4.1.1, we described the implemented structure to store the collected data from the DC-µG, as well as to achieve an interaction between ThingSpeak, the UWA, and the CN. This structure is shown in Figure 6.

Figure 6.
Database structure and the CN–cloud server interaction process.
4.3. User Web App (Block C)
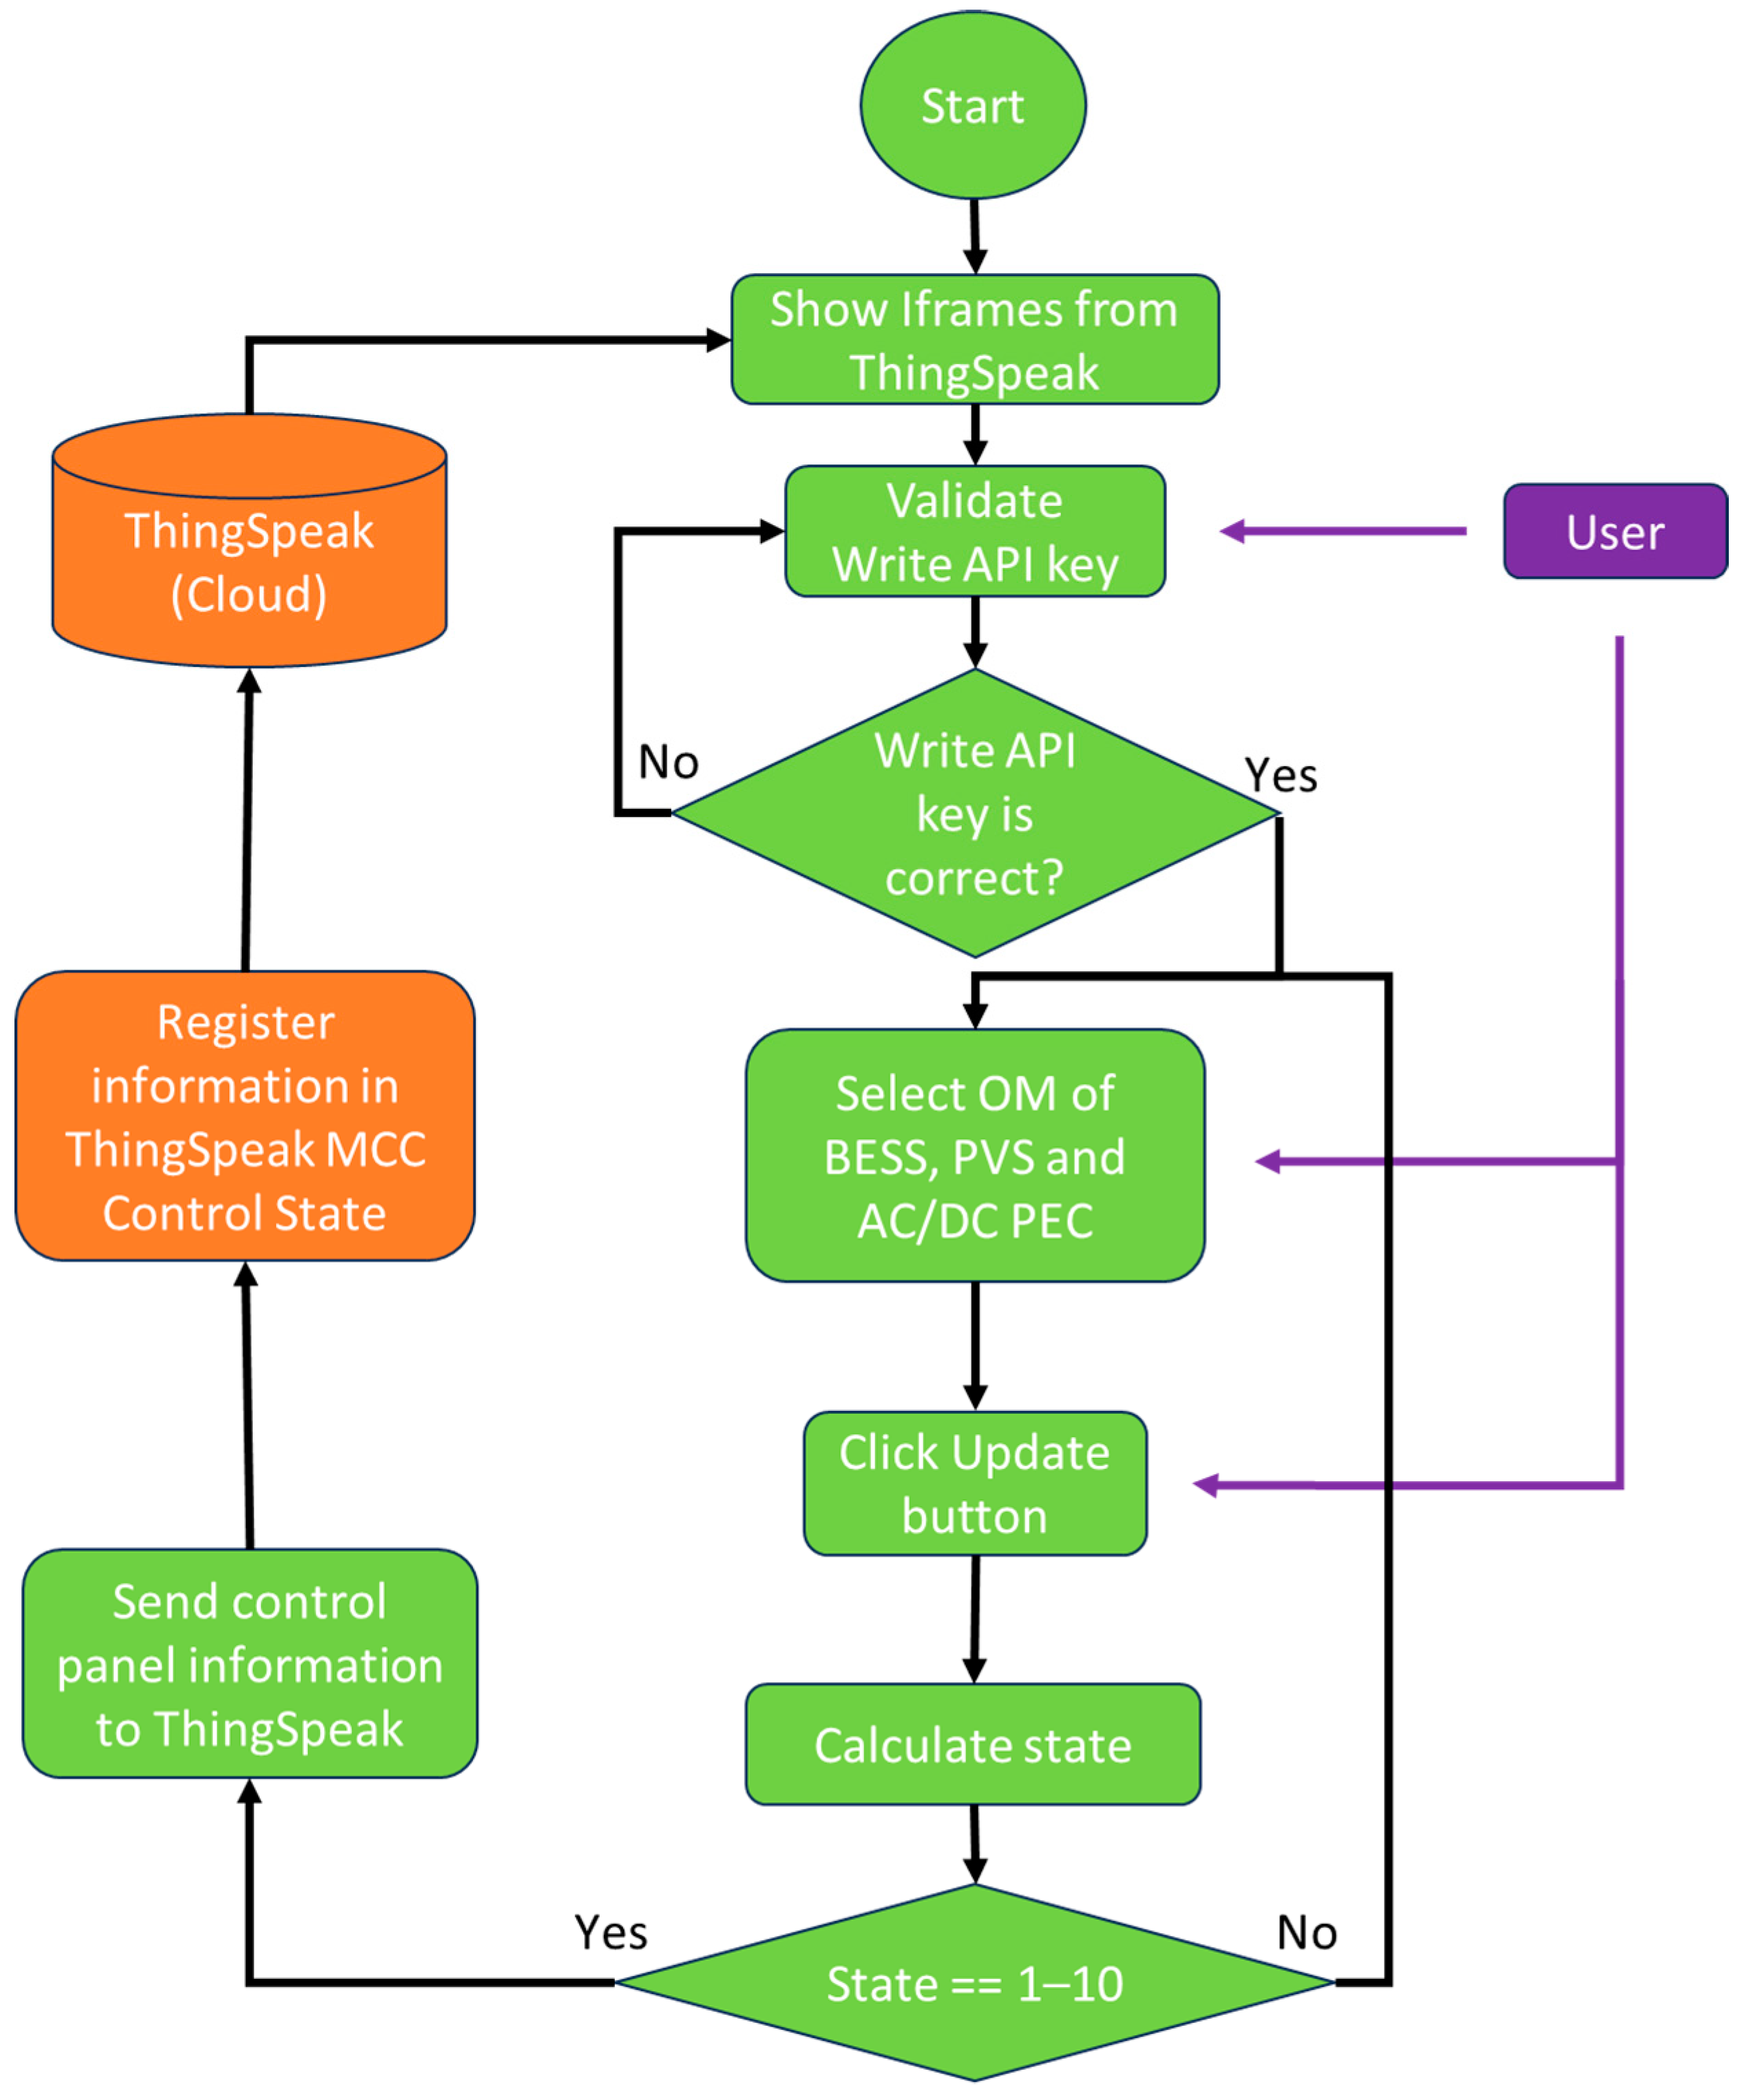
The UWA interface for this work was designed to provide the user with elements of control and indicators. Among the elements of control, a text box was included to introduce a write API key for the MCC. This key adds security to the IoT-based EMS by preventing an improper usage by unauthorized users. Also, the controls include ad hoc drop-down menus for the OM of each element contained in the DC-µG. This setting allows the user to easily select between a manual control or an automatic control. The indicators present the uploaded variables (, , , , and ) to the server in a graphical format, allowing the user to supervise the evolution of the DC-µG to perform a better management of the grid. The flowchart related to the functioning of the UWA, including its interaction with both the cloud server and the user, can be seen in Figure 7. As a first step, the UWA displays the time-series plots of the stored variables in ThingSpeak by using Iframes. Next, the write API key is verified to enable/disable the user controls. When the user has logged in with a valid key and selected an OM for each system with the aid of the menus, the UWA will take these selected OMs as a combination to compare it with a valid state from the FSM (see Table 1). If the combination matches with a valid state of the FSM, then a codified number from 1 to 9 is sent to the MCC in ThingSpeak; otherwise, the UWA does not send any number to ThingSpeak. In the case of an automatic mode selection, the UWA sends the state numbered as 10 to the MCC.

Figure 7.
User Web App flowchart.
5. Results
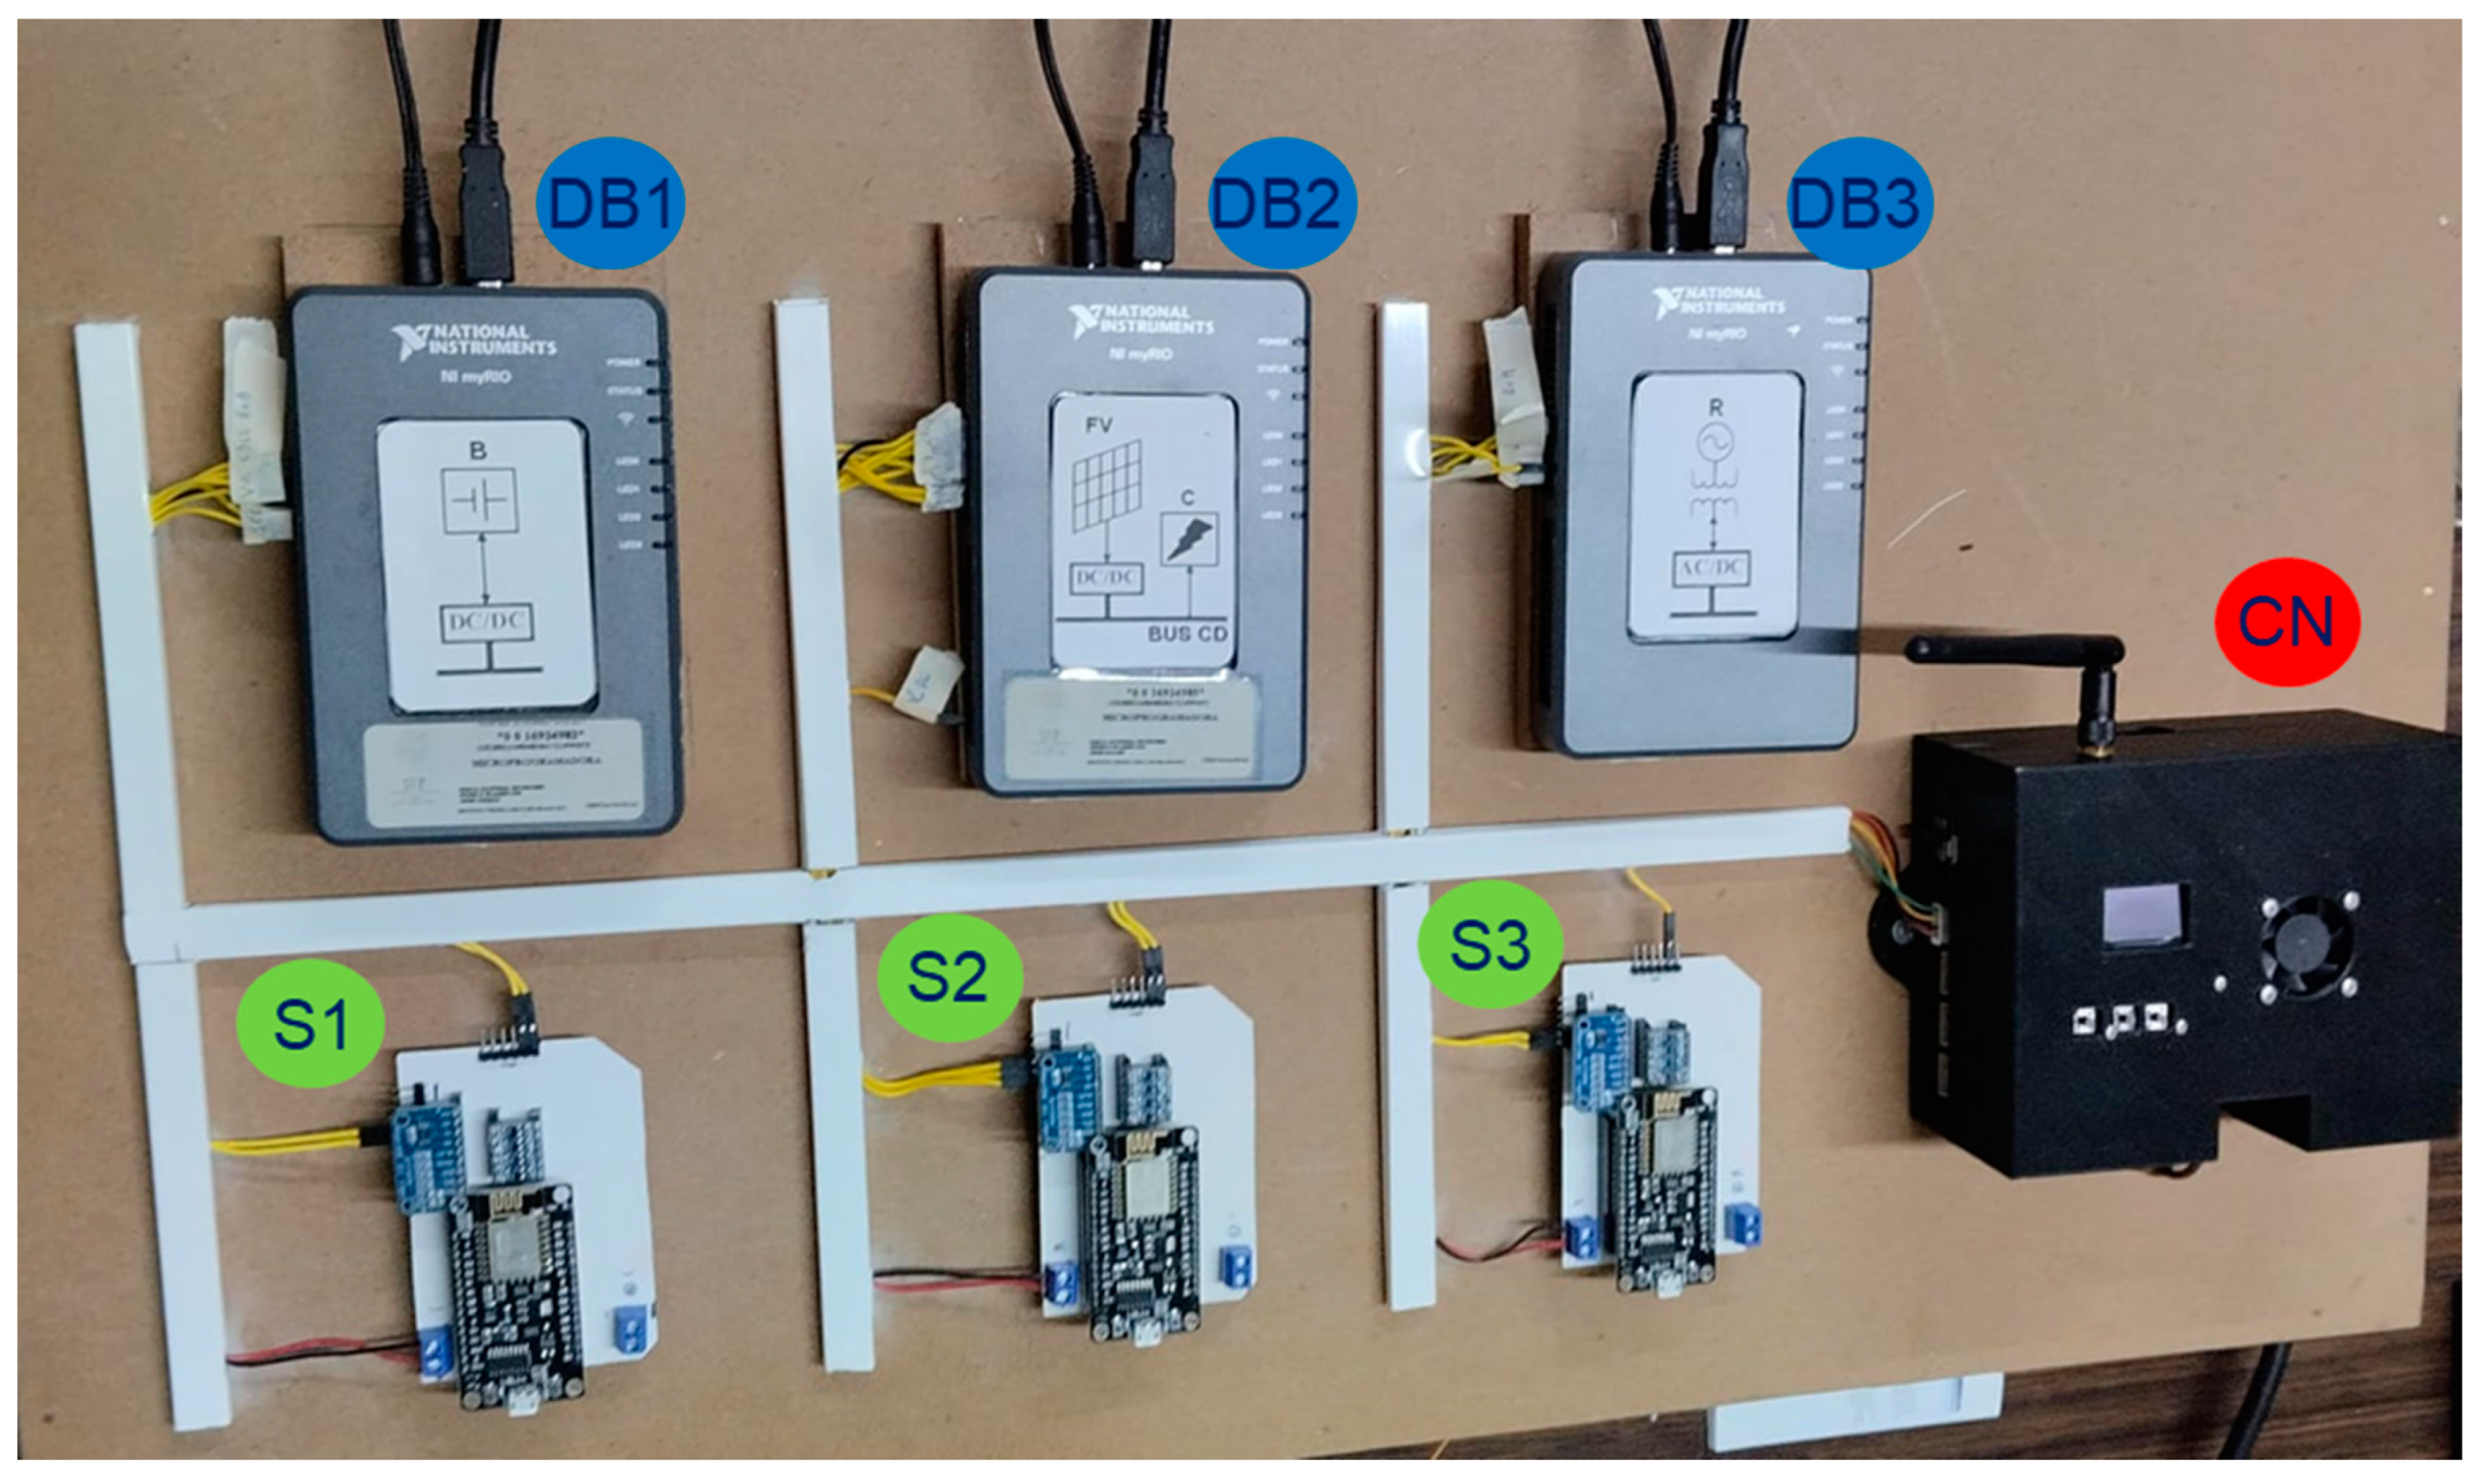
In this section, the reader can find the achieved results in the development and evaluation of the IoT-EMS-WSAN. As shown in Figure 8, the DC-µG HIL was created with the interconnection of three NI MyRIO 1900 development boards (DB1 to DB3); meanwhile, the WSAN consisted of three LSs (S1 to S3) and a CN, which were developed with a set of NodeMCU boards. Each DB not only was responsible for emulating an LC but also for emulating the behavior of the systems allocated in the DC-µG, such as the BESS in the case of DB1, the PVS and the DC bus in the case of DB2, and the bidirectional AC/DC PEC and MG in the case of DB3.
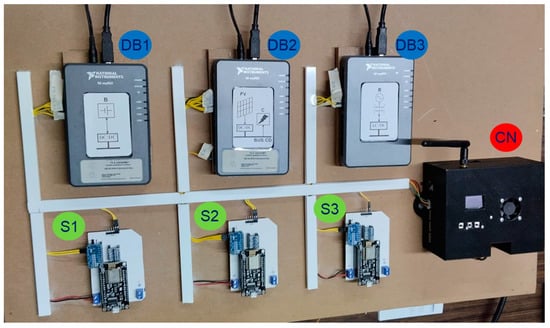
Figure 8.
Implemented WSAN and the DC-µG HIL emulator.
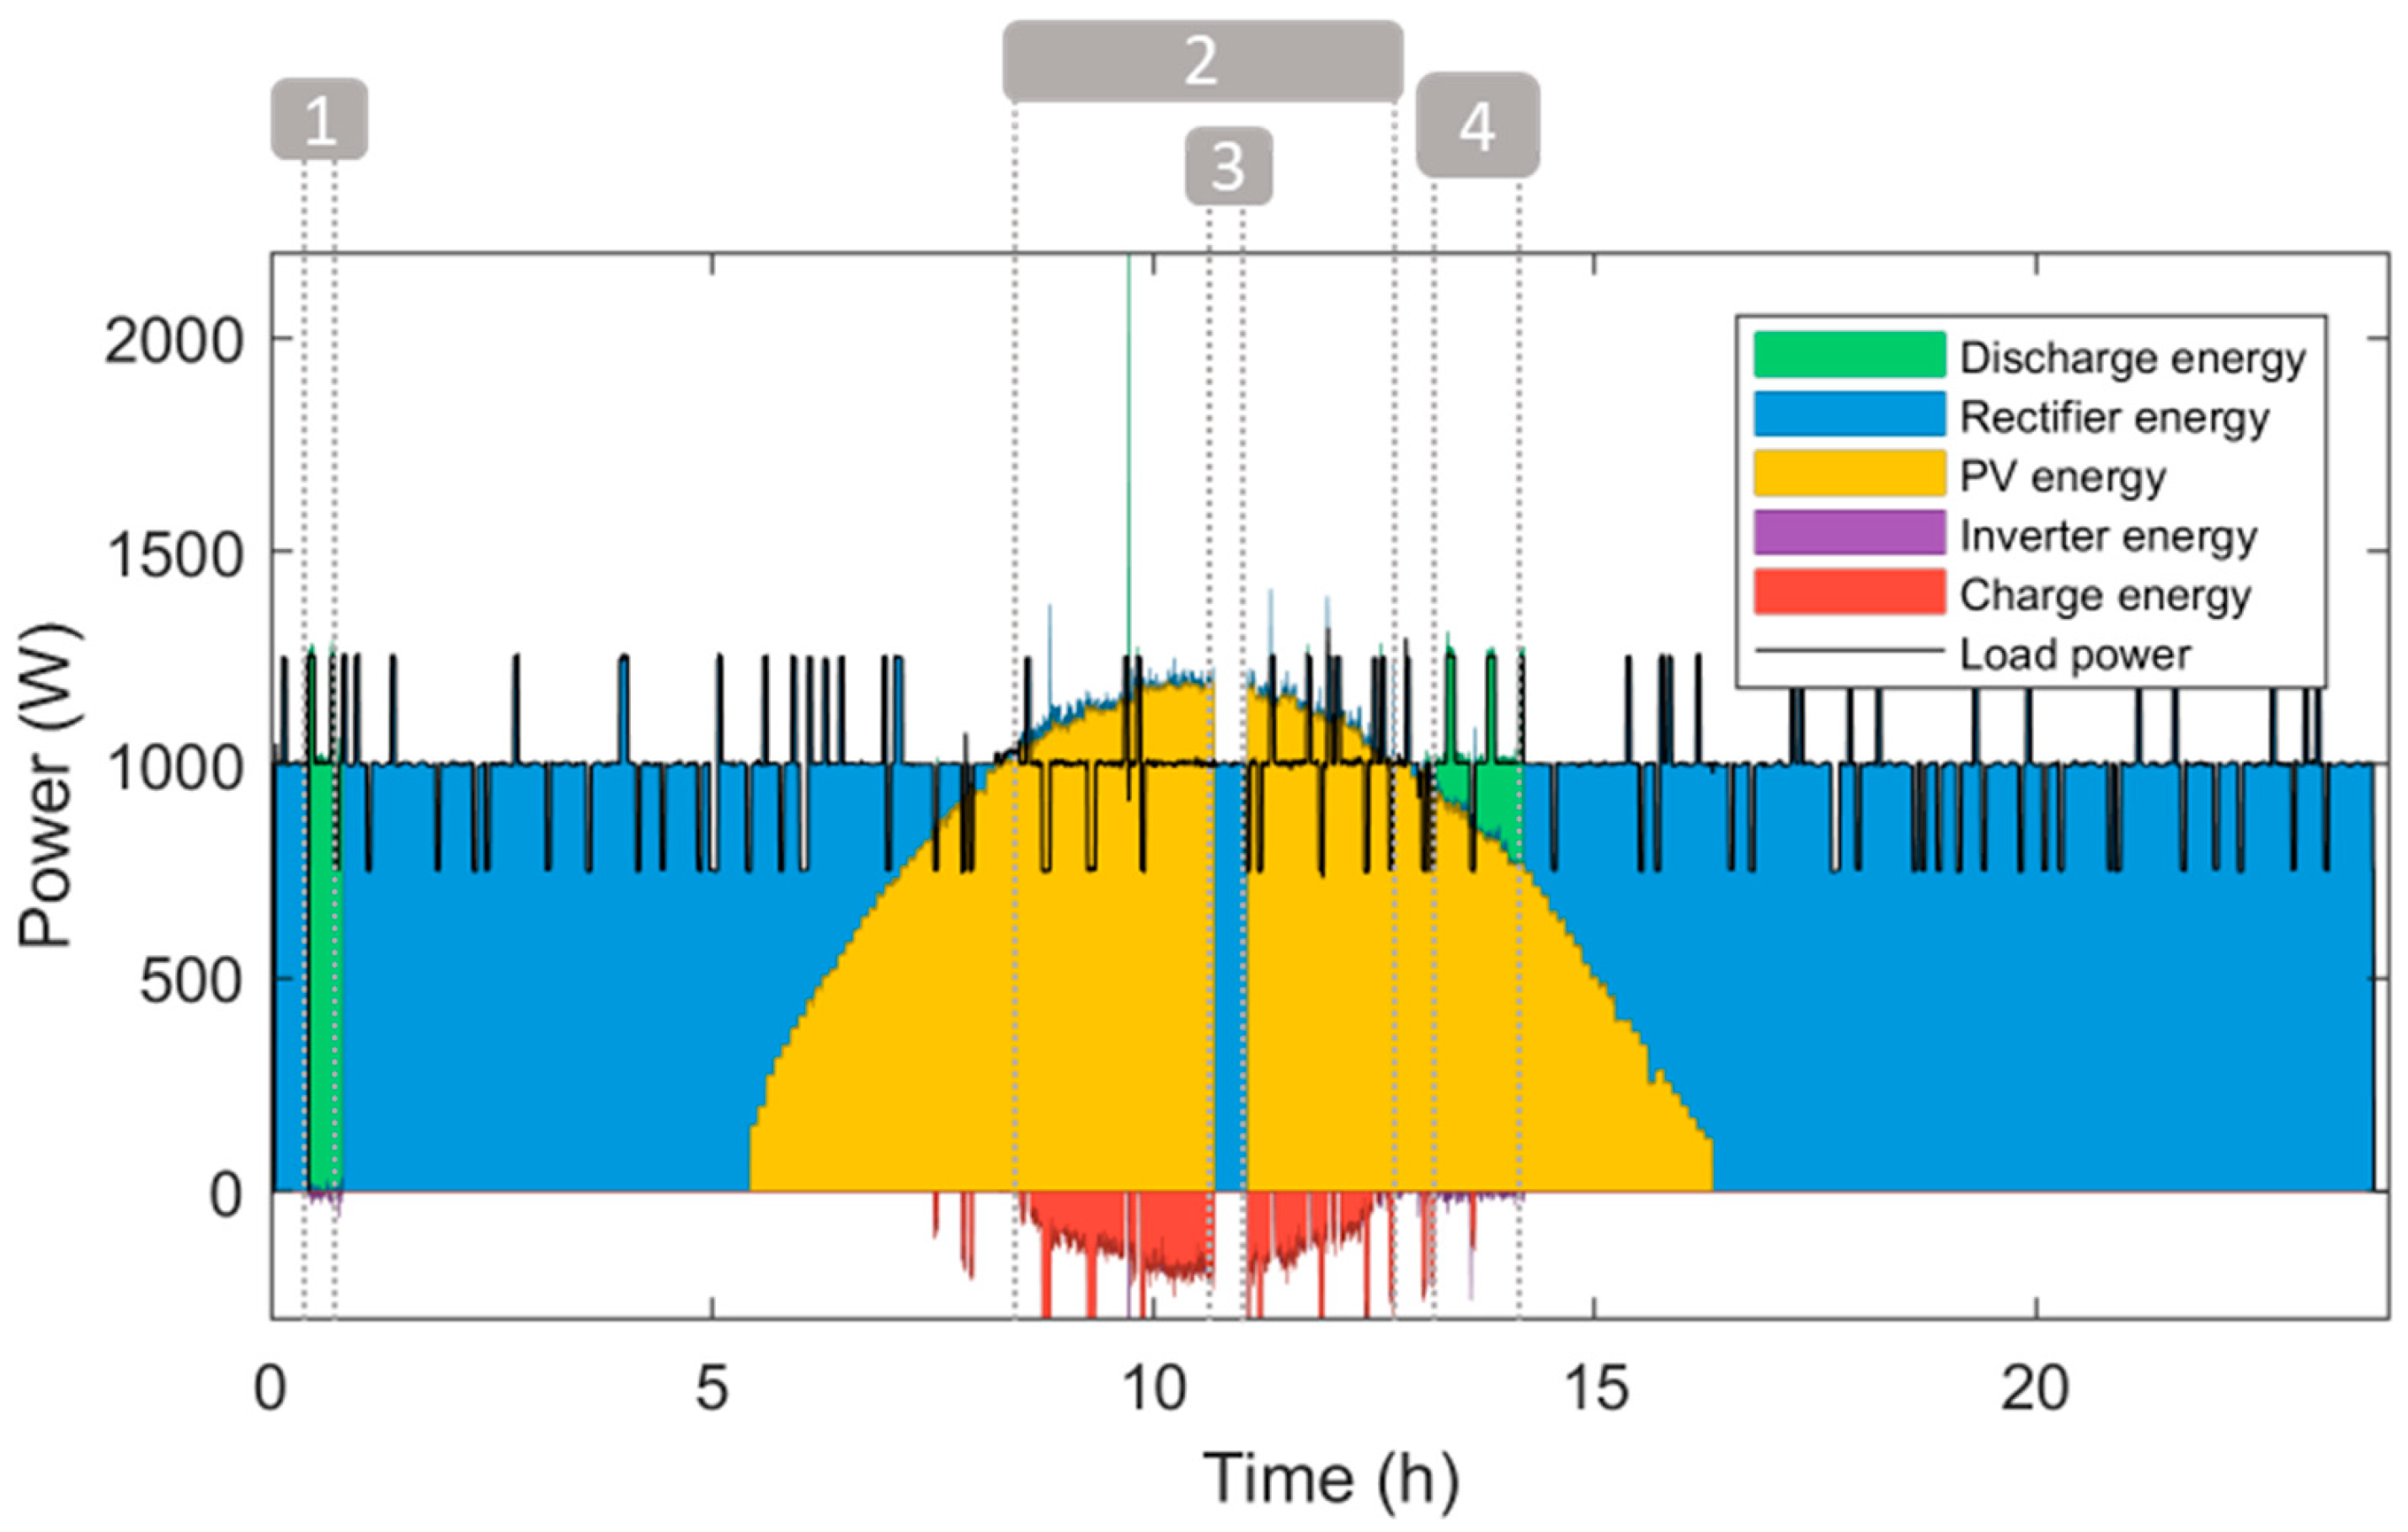
To evaluate the performance of the IoT-EMS-WSAN, the manual mode was validated at first by testing the operative modes of the DC-µG individually. Afterward, an experiment was performed to emulate the behavior of the PV during a clear day, as well as energy outages from both the PV and the MG. The established conditions for this experiment were a CN operating in automatic mode, randomized load values (i.e., the load would demand 0.8, 1, or 1.2 kW), a PV with its maximum power set to 1.2 kW, a 360 V DC bus setpoint, and a battery bank with an initial SoC of 50%. It is important to mention that the HIL emulation latency was accelerated to emulate a 24-hour cycle in only 6 h. The PC of the HIL platform was used to store the measurements from the DC-µG with a 500 ms latency; considering that data are uploaded to ThingSpeak each 16 s, the use of the PC allows to have a high-latency local recording. The response from the energy resources connected to the DC-µG to meet the demanded power by the DC load (black line) can be seen in Figure 9. Also, this figure contains the transferred energy between the elements connected to the DC-µG, i.e., from the battery bank to the DC bus (green area), from the MG to the DC bus (blue area), from the PV to the DC bus (yellow area), from the DC bus to the MG (purple area), and from the DC bus to the battery bank (red area). In particular, the energy transferring from the DC bus to the battery bank appears with negative values, as this process demands power to be transferred from the bus. It is important to mention that, under the conditions established for this experiment, the system did not experience a case in which there was energy transferred from the DC bus to the MG.

Figure 9.
Power and energy response in the DC-µG with the implemented IoT-based WSAN EMS on a clear day.
As shown in Figure 9, the initialization of the DC-µG not only started to cover the energy demanded by the DC load with the MG (AC/DC PEC operating as rectifier), but it also did not include the PV system to satisfy this demand. After this initialization, the DC-µG went through four special operating conditions, which are numbered from 1 to 4 in Figure 9. During the first condition (event 1), an outage was generated from the MG at sample 100, and the EMS responded by setting the BESS to supply the DC load with the stored energy in the battery bank; the event is marked with a change from a blue to a green color in Figure 9. The next condition (event 2) was present from sample 1800 to sample 2800. The event was characterized by an energy surplus delivered by the PVS to satisfy the demand of the DC load. Therefore, the EMS responds by charging the battery bank (BESS set with a charging OM) with this surplus. In fact, this energy surplus delivered by the PVS (yellow area above the load power line in Figure 9) matches the energy used to charge the battery bank in the same period (red area below the 0 W line in Figure 9). While the second event was still present, an outage was induced from the PVS (event 3), which started at sample 2225. To rectify this condition, the EMS not only suspends the charging process for the battery bank, but also takes the required energy from the MG to satisfy the demanded energy by the DC load. Lastly, an outage was induced from the MG at sample 2800 (event 4); here, the BESS accompanied the PVS with the battery bank to satisfy the demanded energy by the DC load.
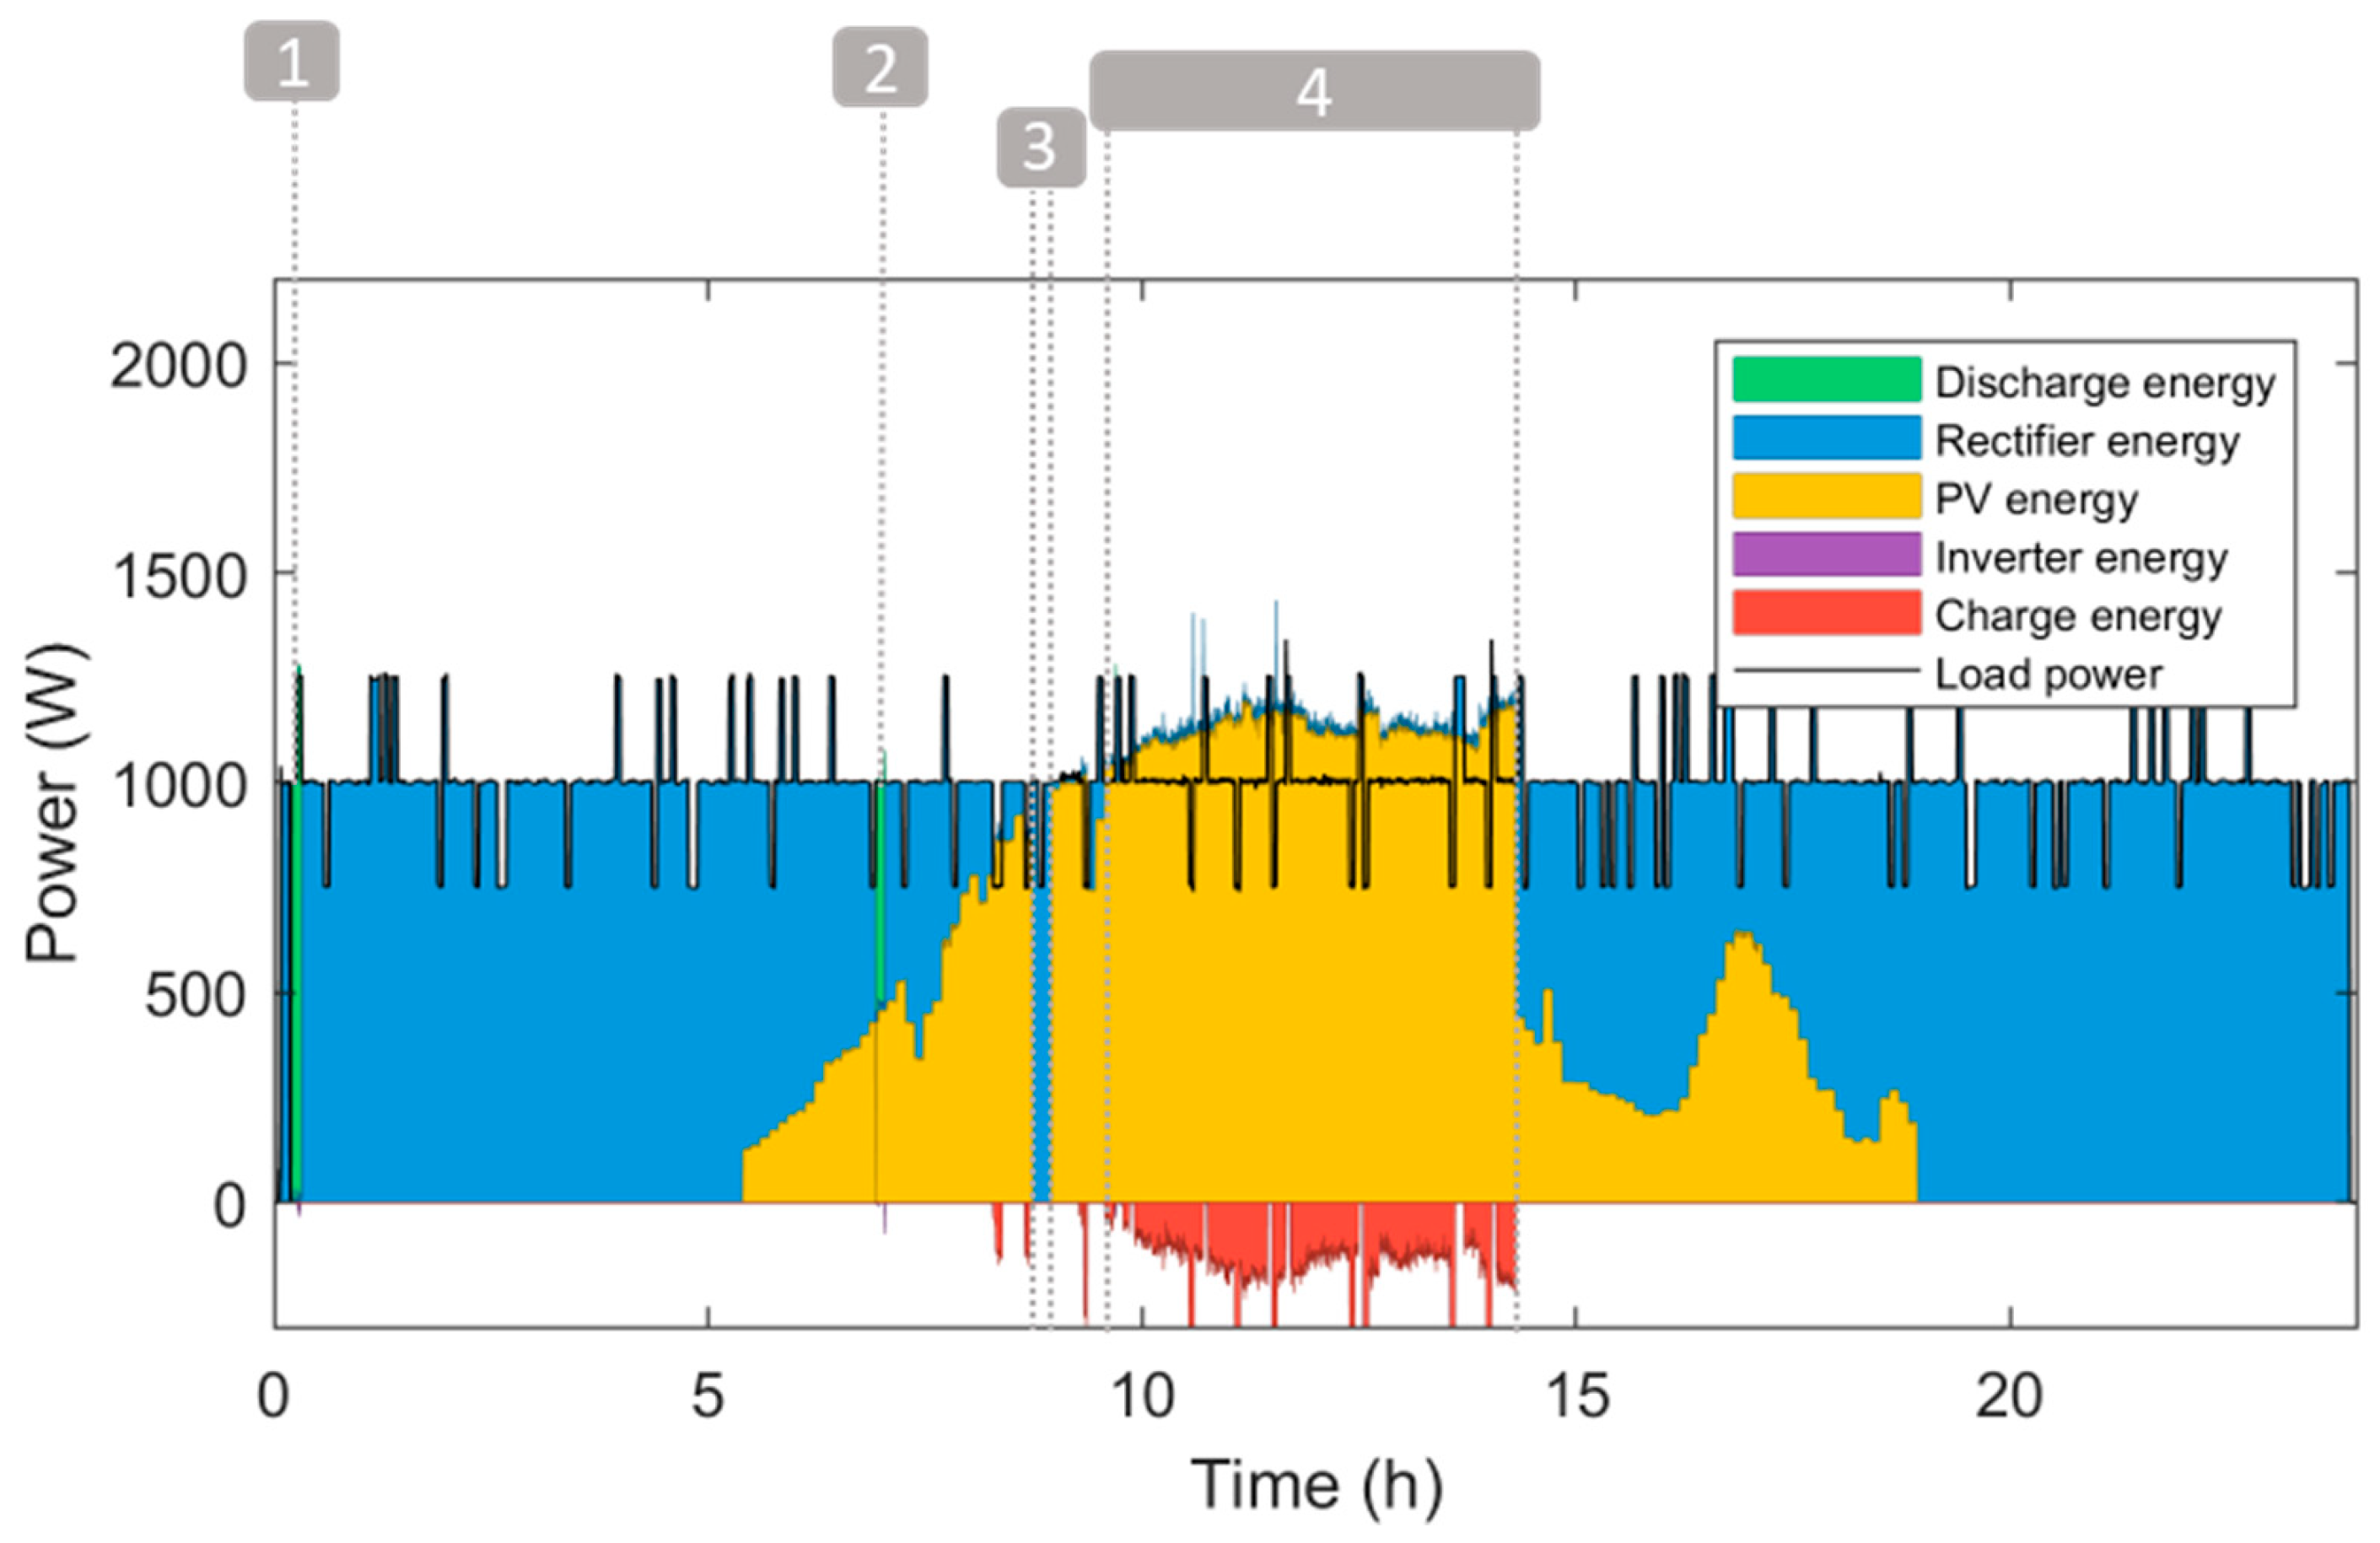
To extend the performance analysis of the IoT-EMS-WSAN, the energy production by the PV system was tested on a partially cloudy day; particularly, this weather condition forces the PVS to present faster changes during its energy production. The results for this experiment are presented in Figure 10. Similarly to the case presented in Figure 9, this experiment also includes an MG outage (events 1 and 2), a PVS outage (event 3), and an energy surplus derived from the PVS production (event 4) that allows us to charge the battery bank.

Figure 10.
Power and energy response in the DC-µG with the implemented IoT-based WSAN EMS on a cloudy day.
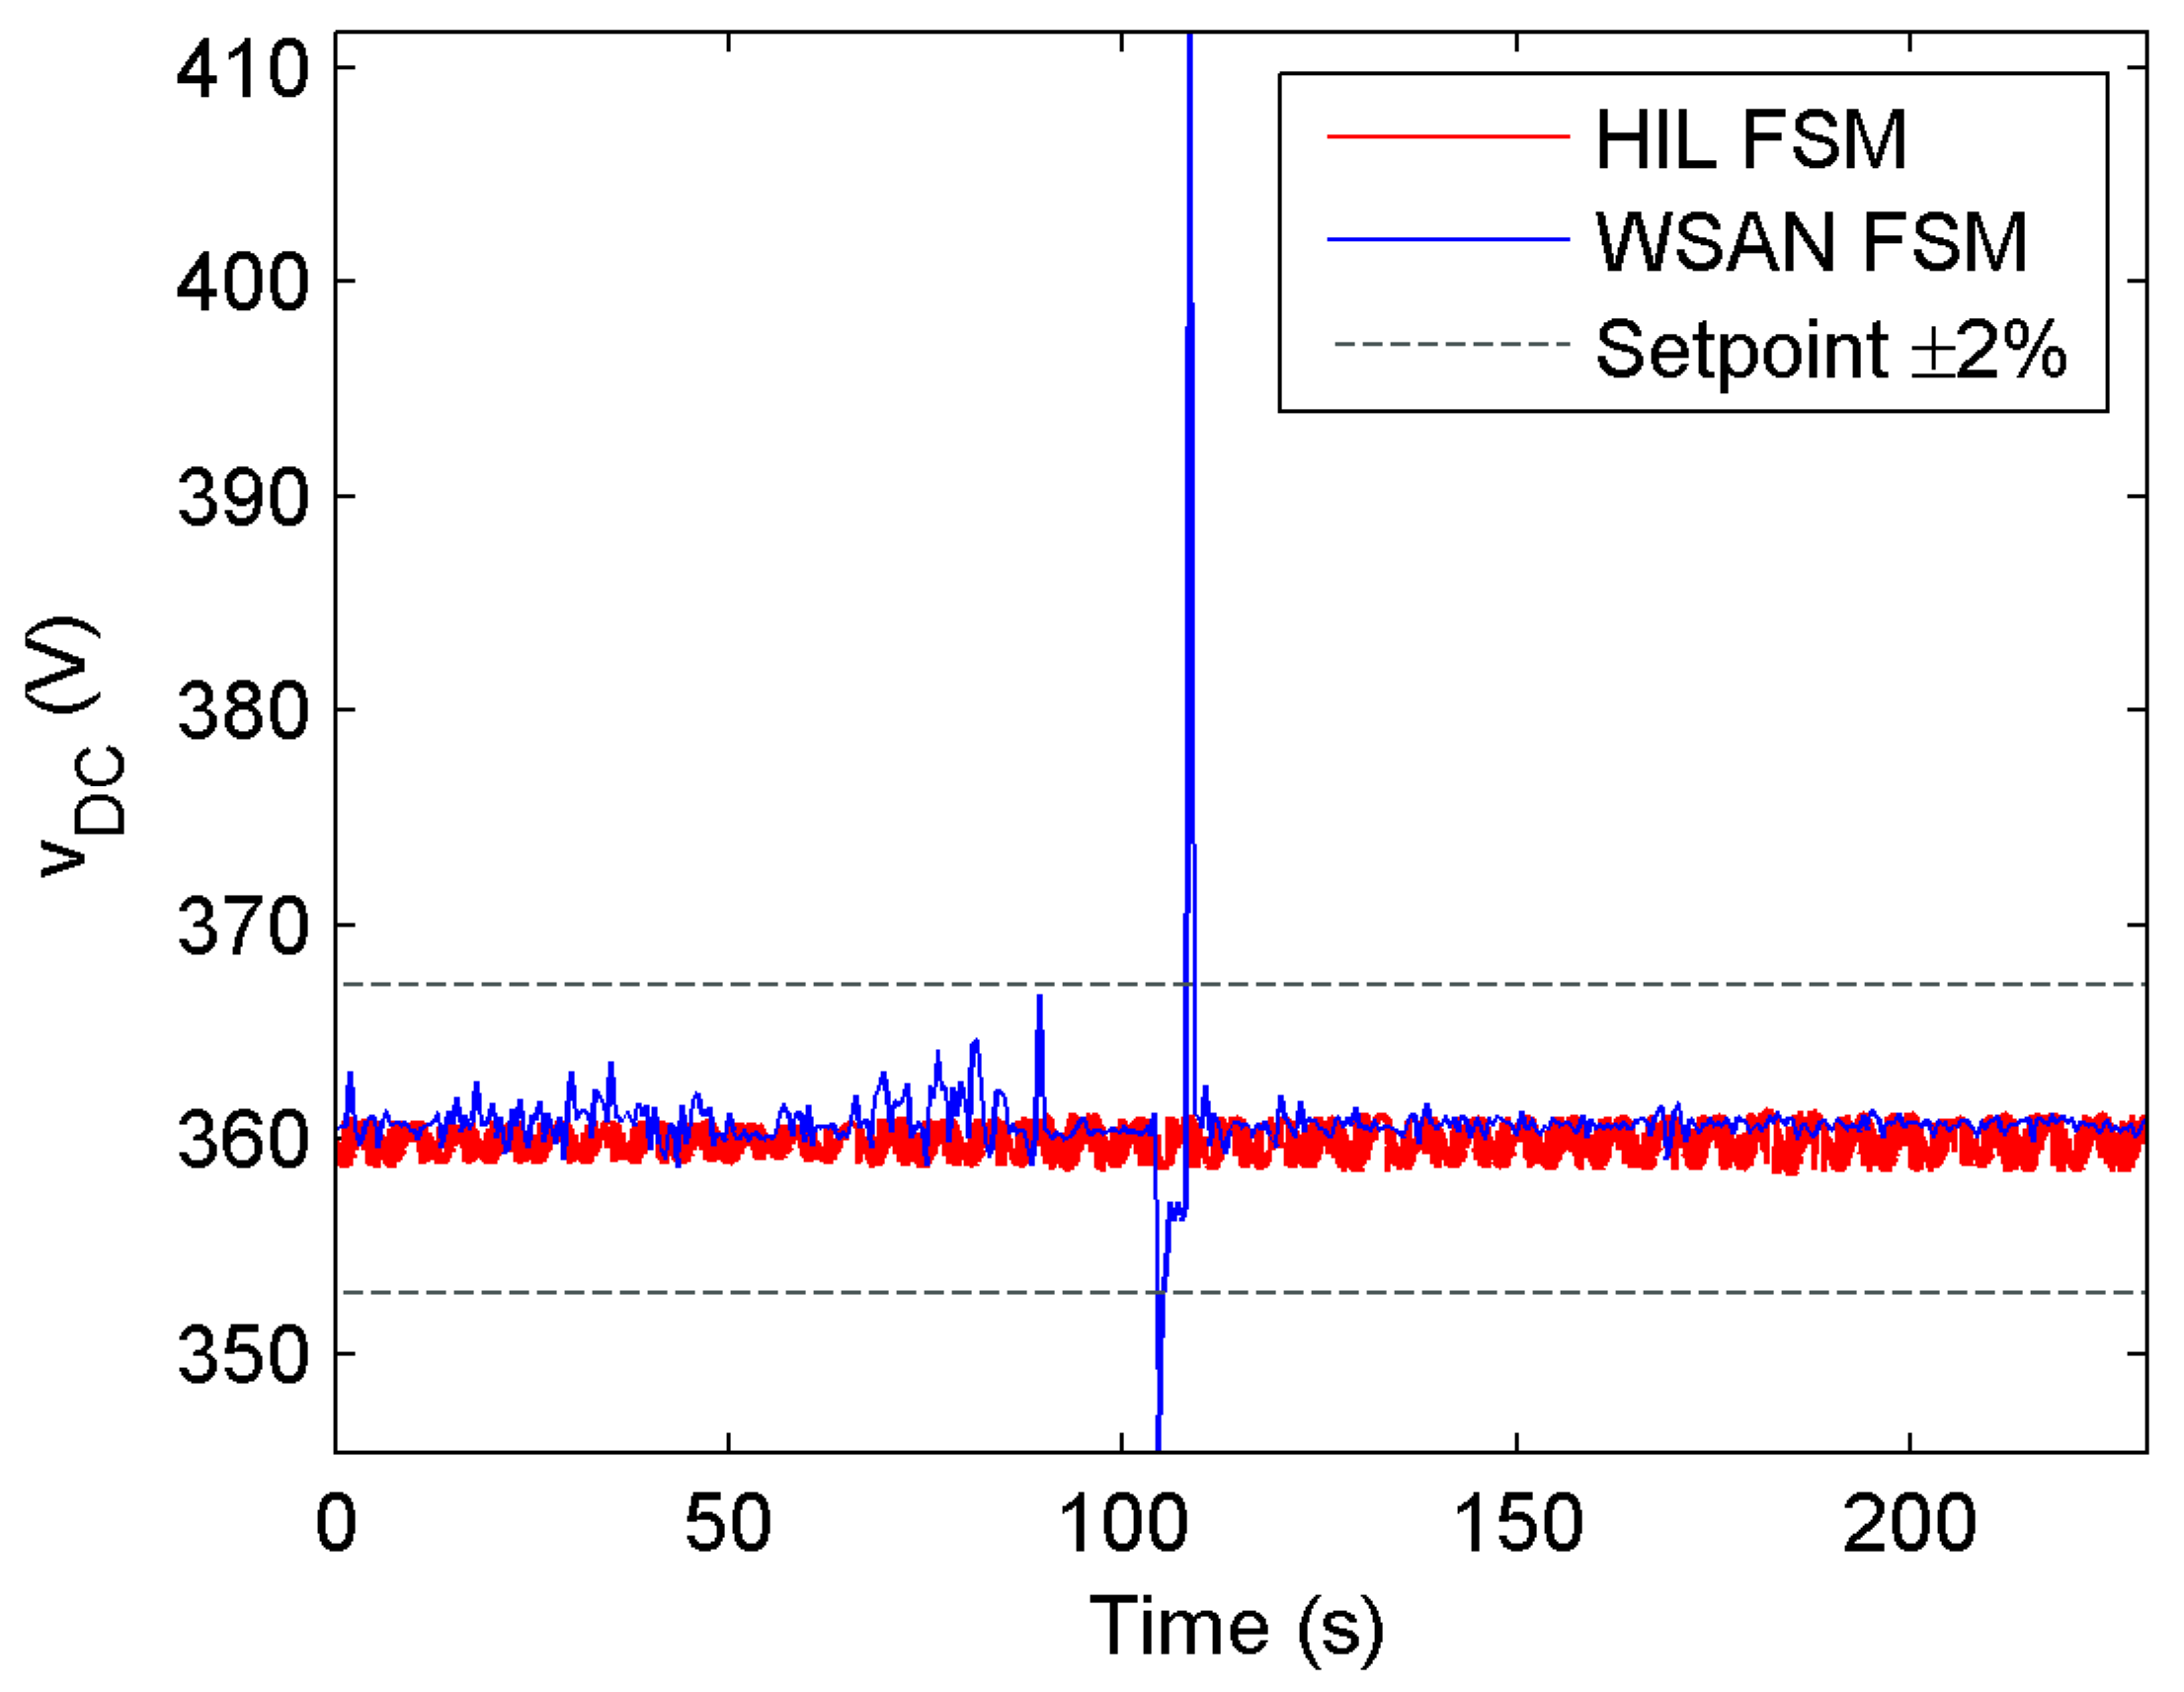
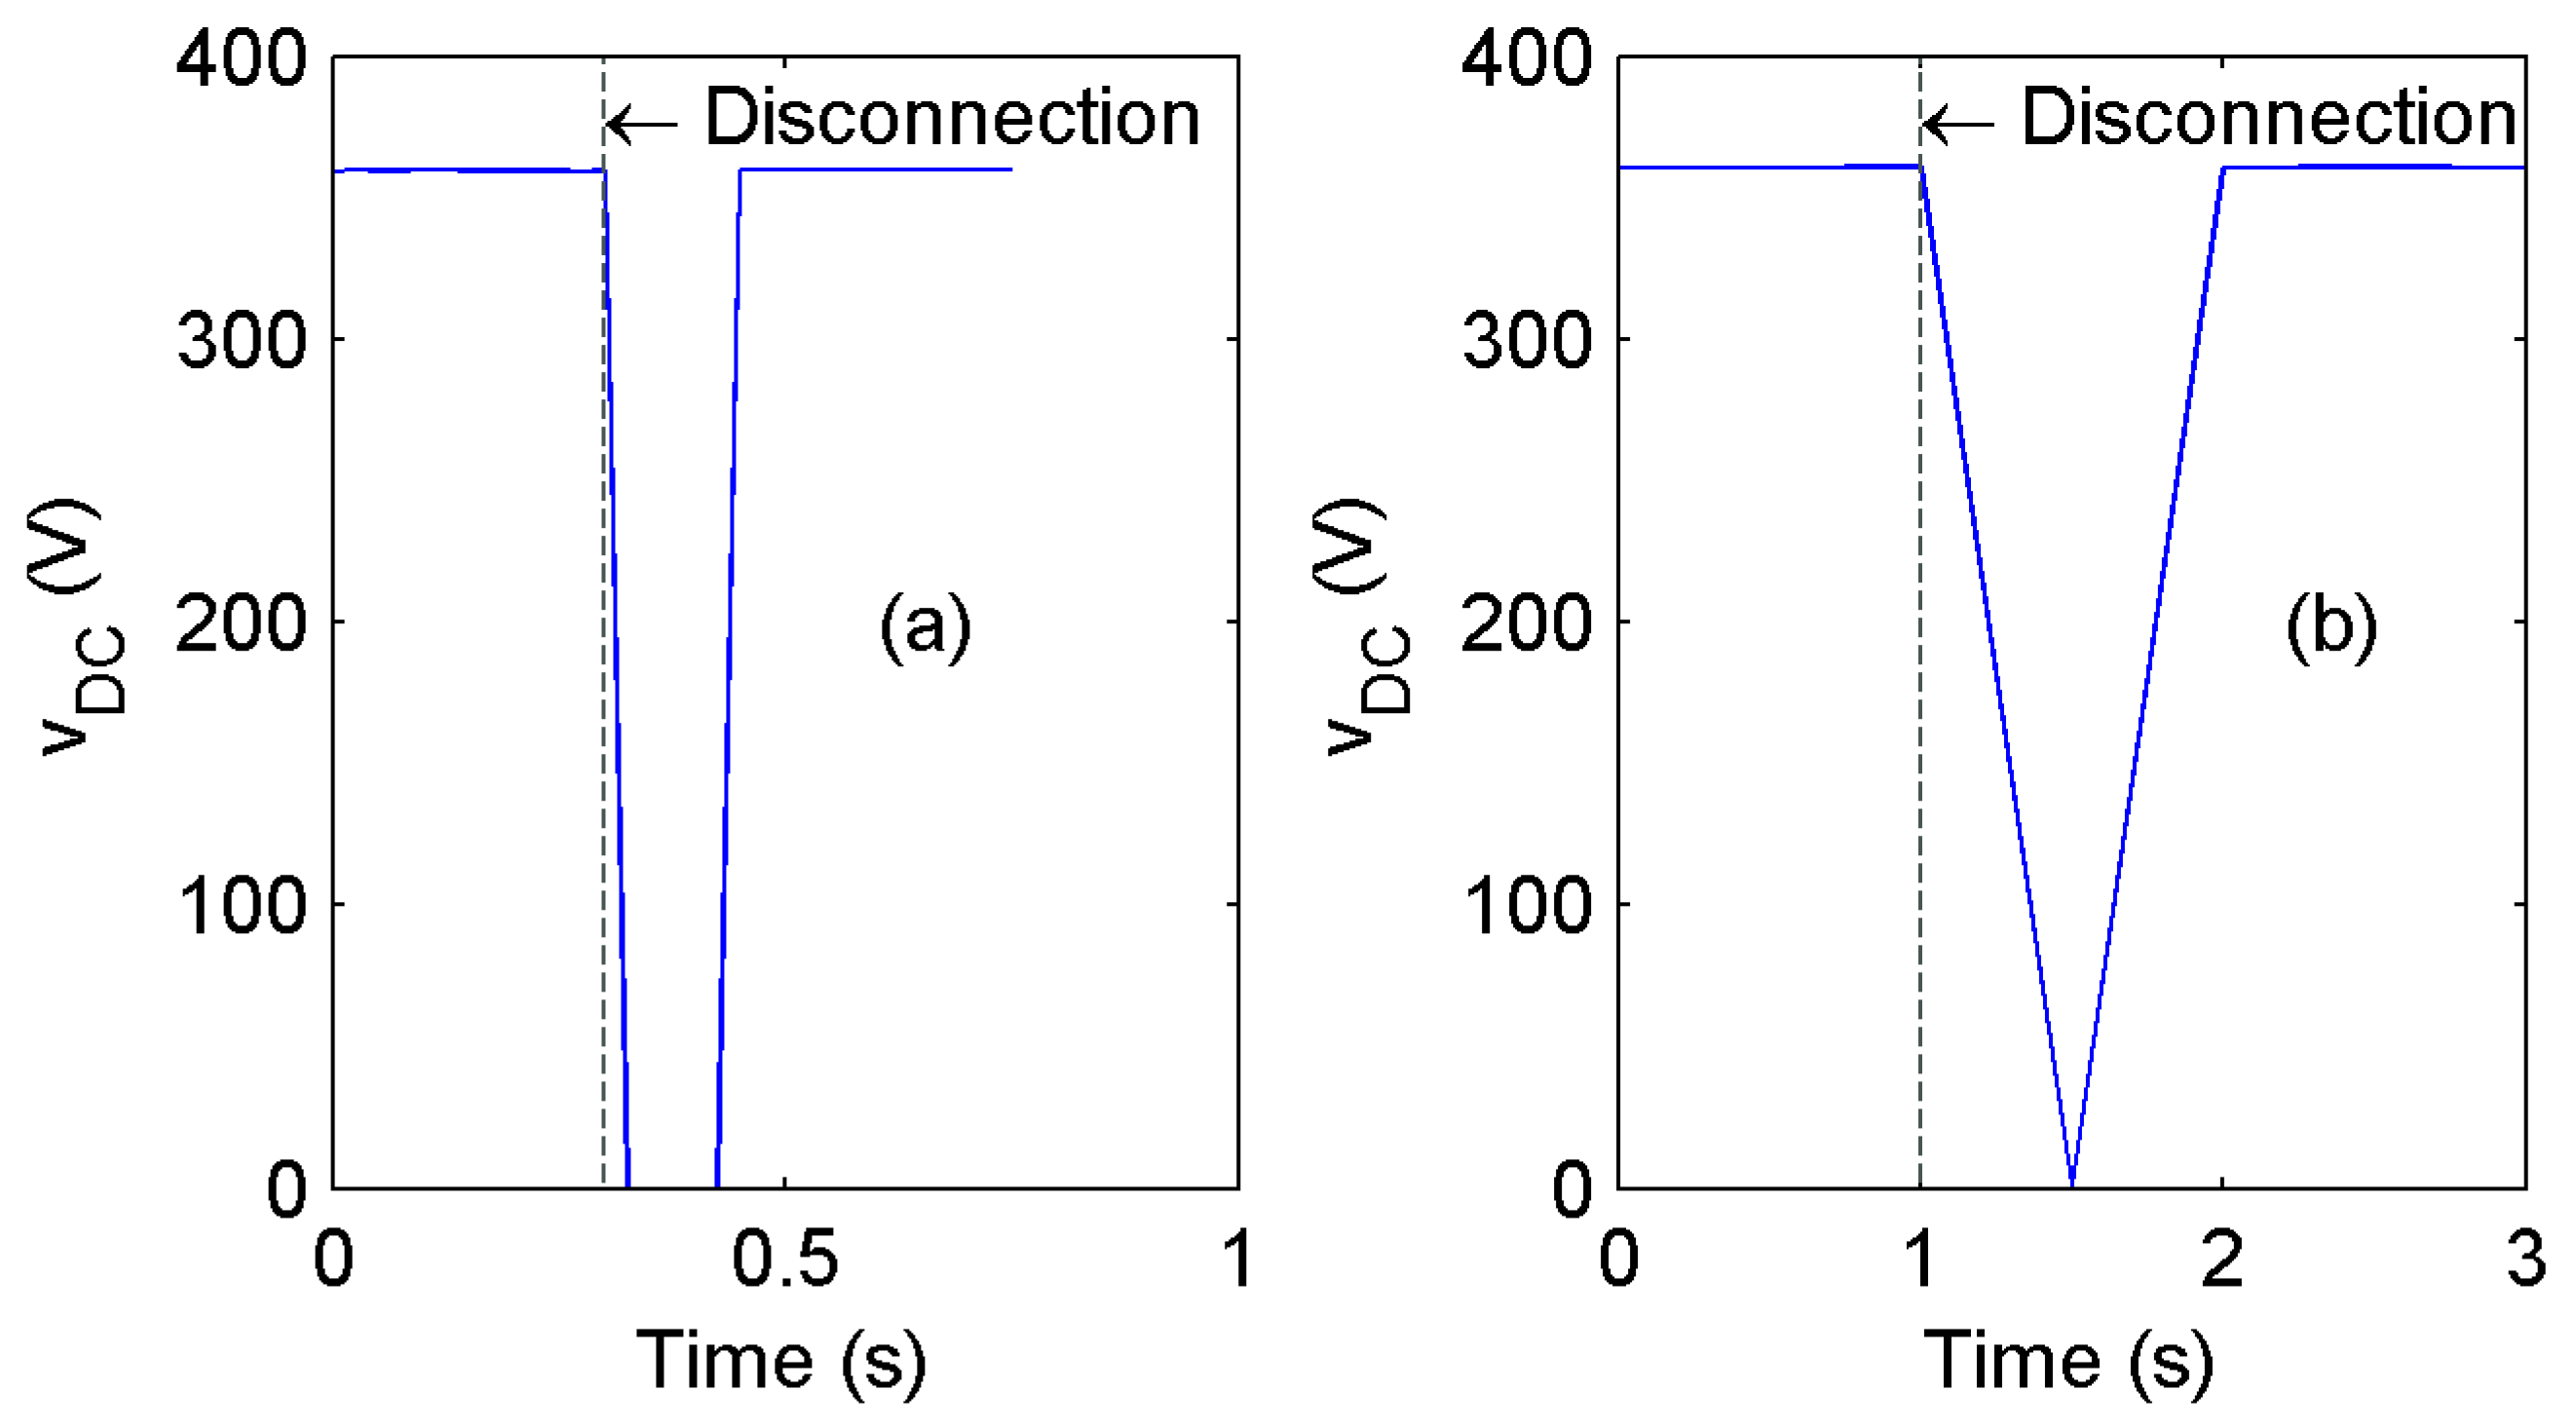
In comparison to the results achieved in the evaluation of the implemented FSM in the HIL platform’s PC, the implemented FSM using a WSAN reported more variations in the DC bus voltage bus () for the same experiment. These variations, as well as the responses emitted by both strategies, can be seen in Figure 11. Here, during a 230 s timelapse, a red line is used to show the voltage of the DC bus () maintained by the implemented FSM in the HIL platform’s PC; meanwhile, a blue line shows the values achieved with the implemented FSM using a WSAN. A pair of dashed lines was drawn in Figure 11 to denote a ±2% band for the 360 V voltage setpoint. At the same time, it was observed an increment in the recovery time for the DC voltage bus in face of an energy outage by different energy resources; this particular response was seen during events 1, 3, and 4 in Figure 9. In Figure 12, it is possible to observe, with detail, the response from the DC voltage bus during event 1, which is shown in Figure 9. On the one hand, the Figure 12a shows the emitted response by the implemented FSM with a PC HIL platform. On the other hand, the response by the implemented FSM with a WSAN is shown in Figure 12b.
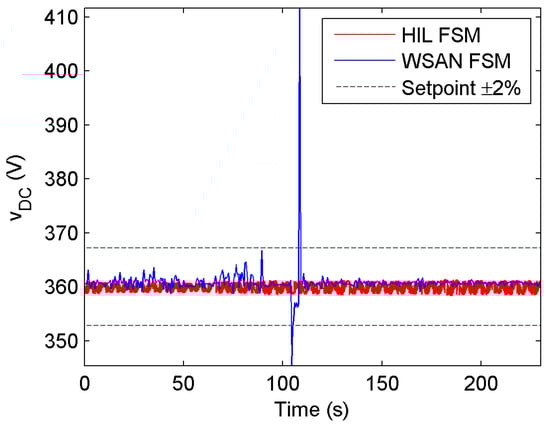
Figure 11.
DC voltage bus response to the implemented HIL and WSAN Finite-State Machines.
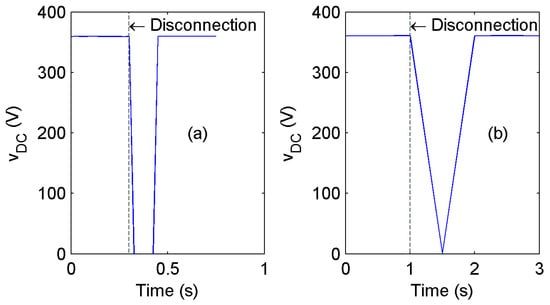
Figure 12.
DC bus voltage response under a source disconnection: (a) with the FSM implemented in the HIL platform PC and (b) with the FSM implemented in the WSAN.
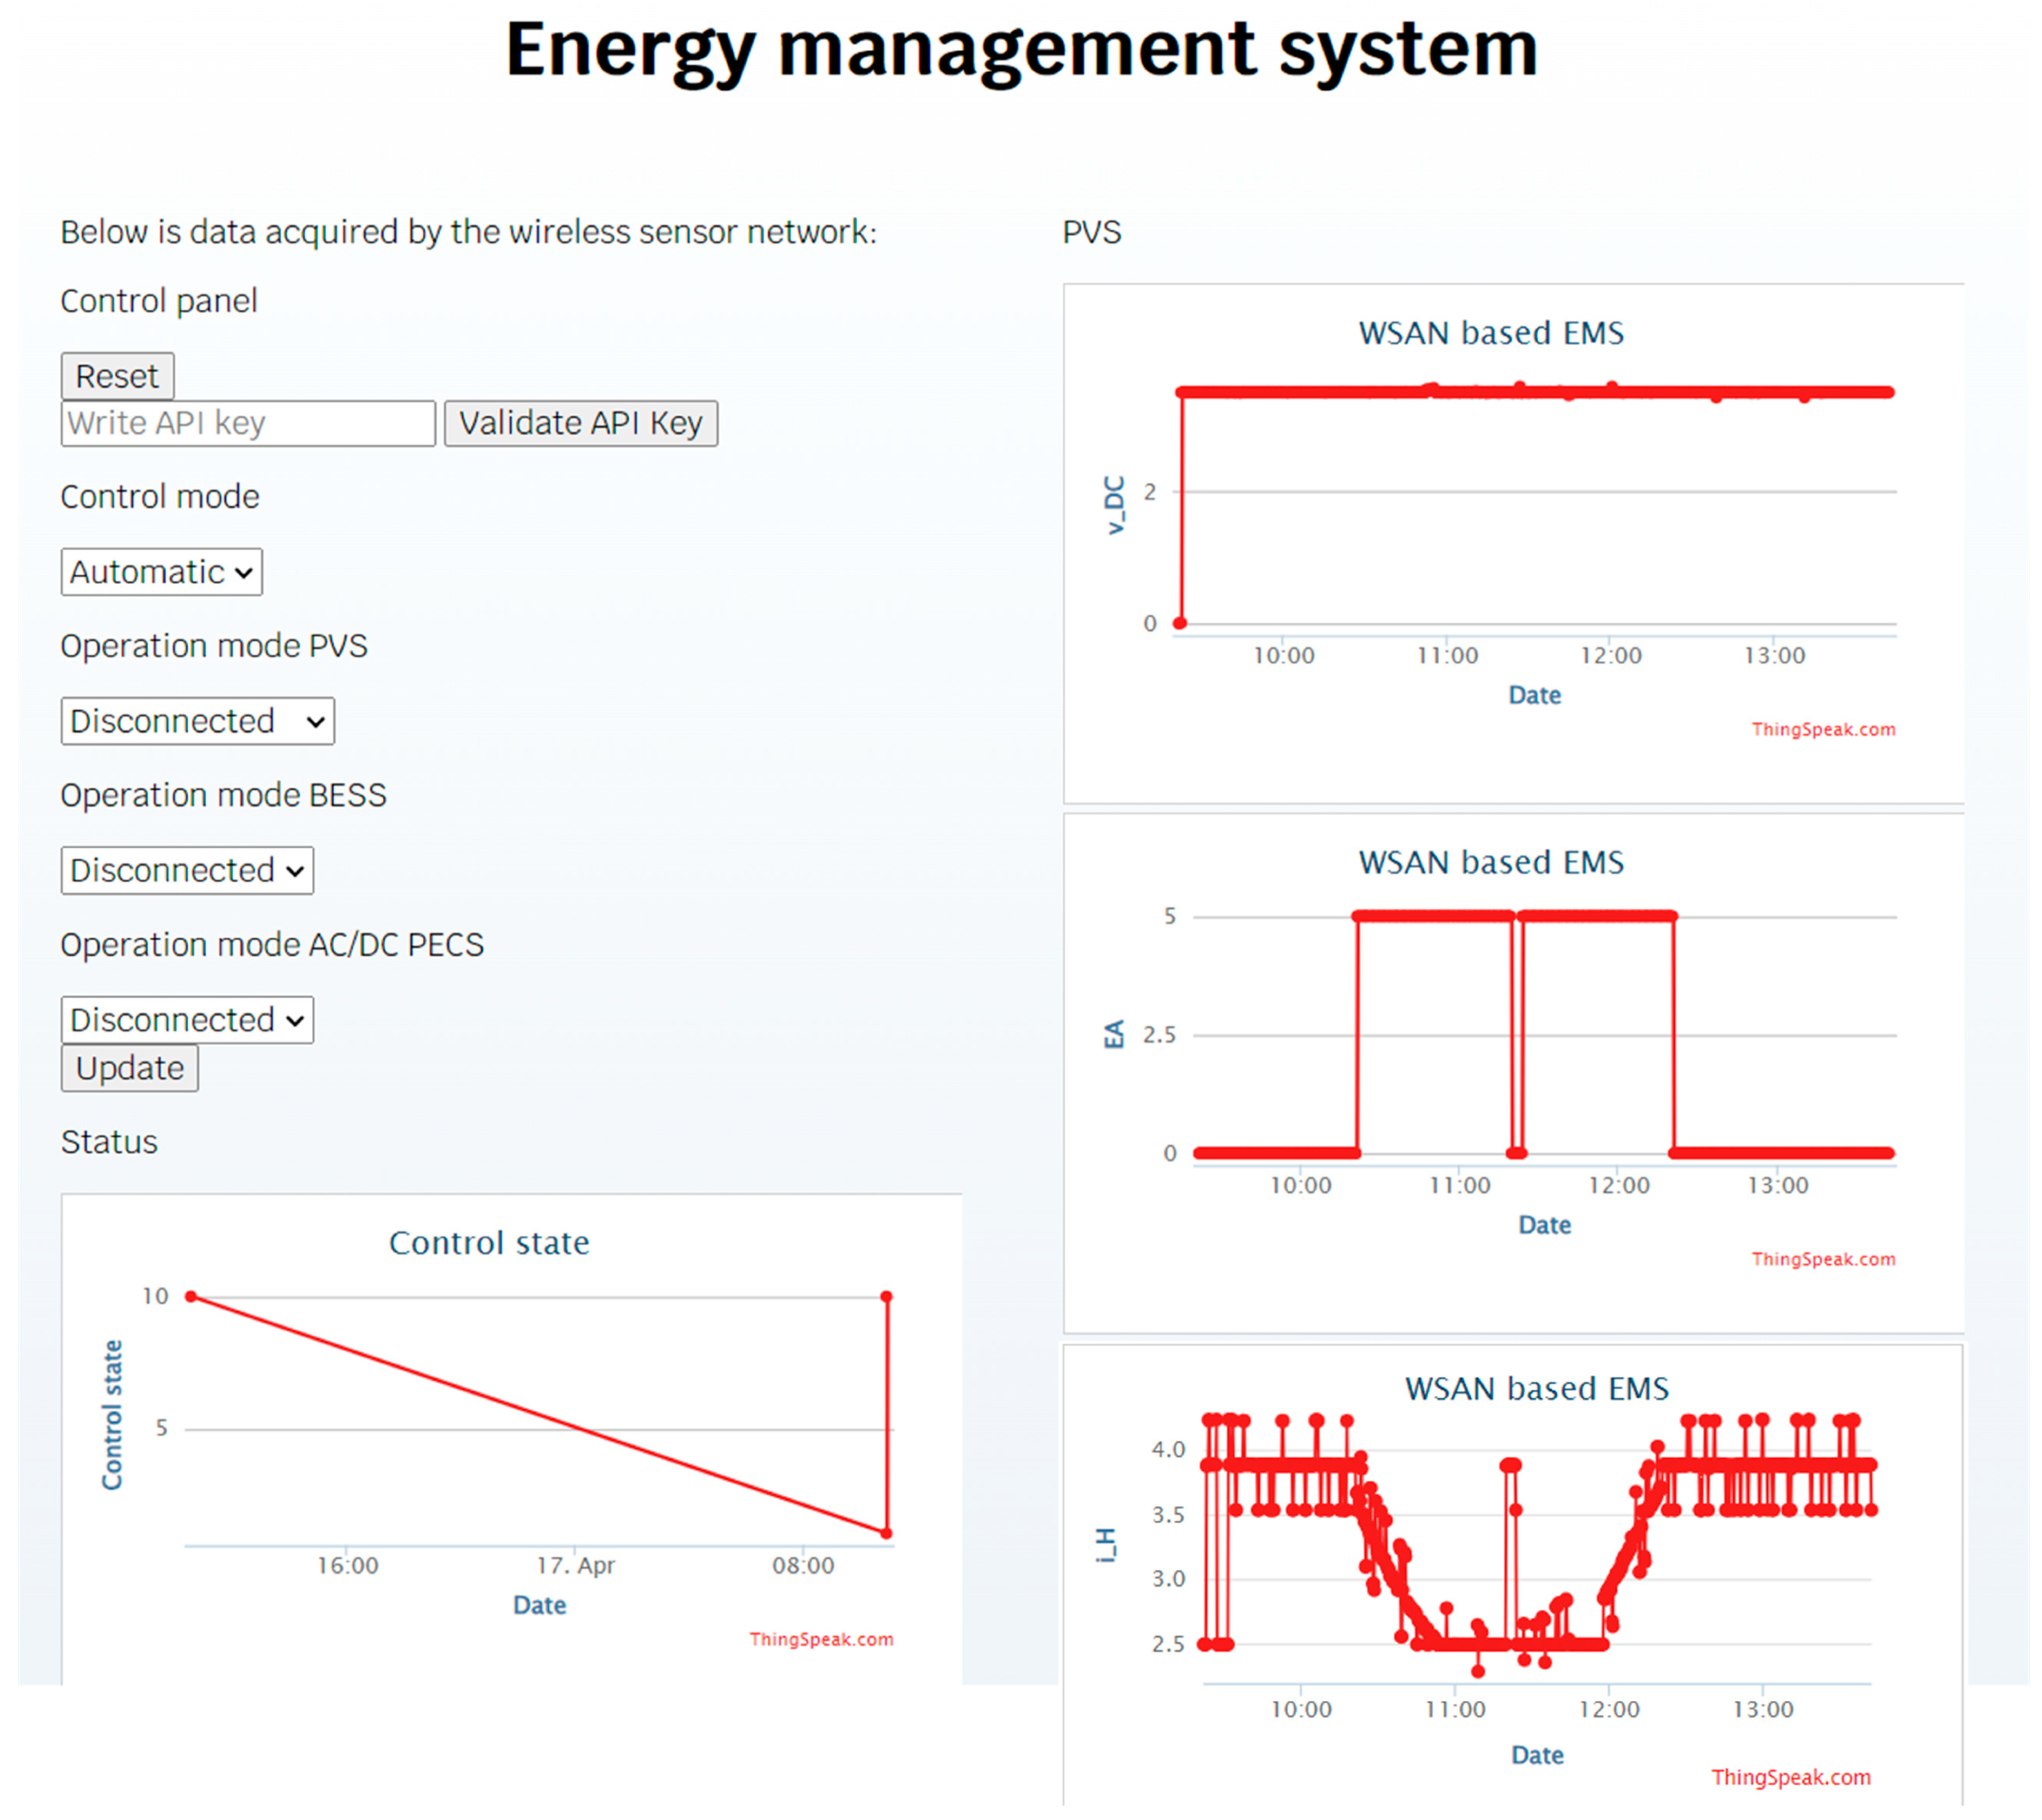
The developed interface for the UWA that was used in this work is shown in Figure 13. This interface contains drop-down menus to select either an automatic or a manual mode, as well as the OM for the different systems contained in the DC-µG. Additionally, the Figure 13 shows some plots contained in the UWA interface. These plots graph the time versus the values and states of variables such as the DC bus voltage (), the logic state of , the control state saved in the MCC, and the injected/extracted current to the DC bus by the bidirectional AC/DC PEC (). The plots of the remaining variables that are not shown in Figure 13 were omitted due to the original size of the screen; however, they are available for their examination in the UWA.
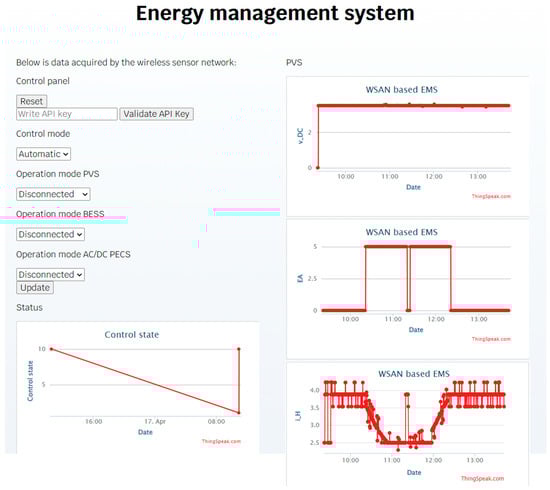
Figure 13.
User Web App interface.
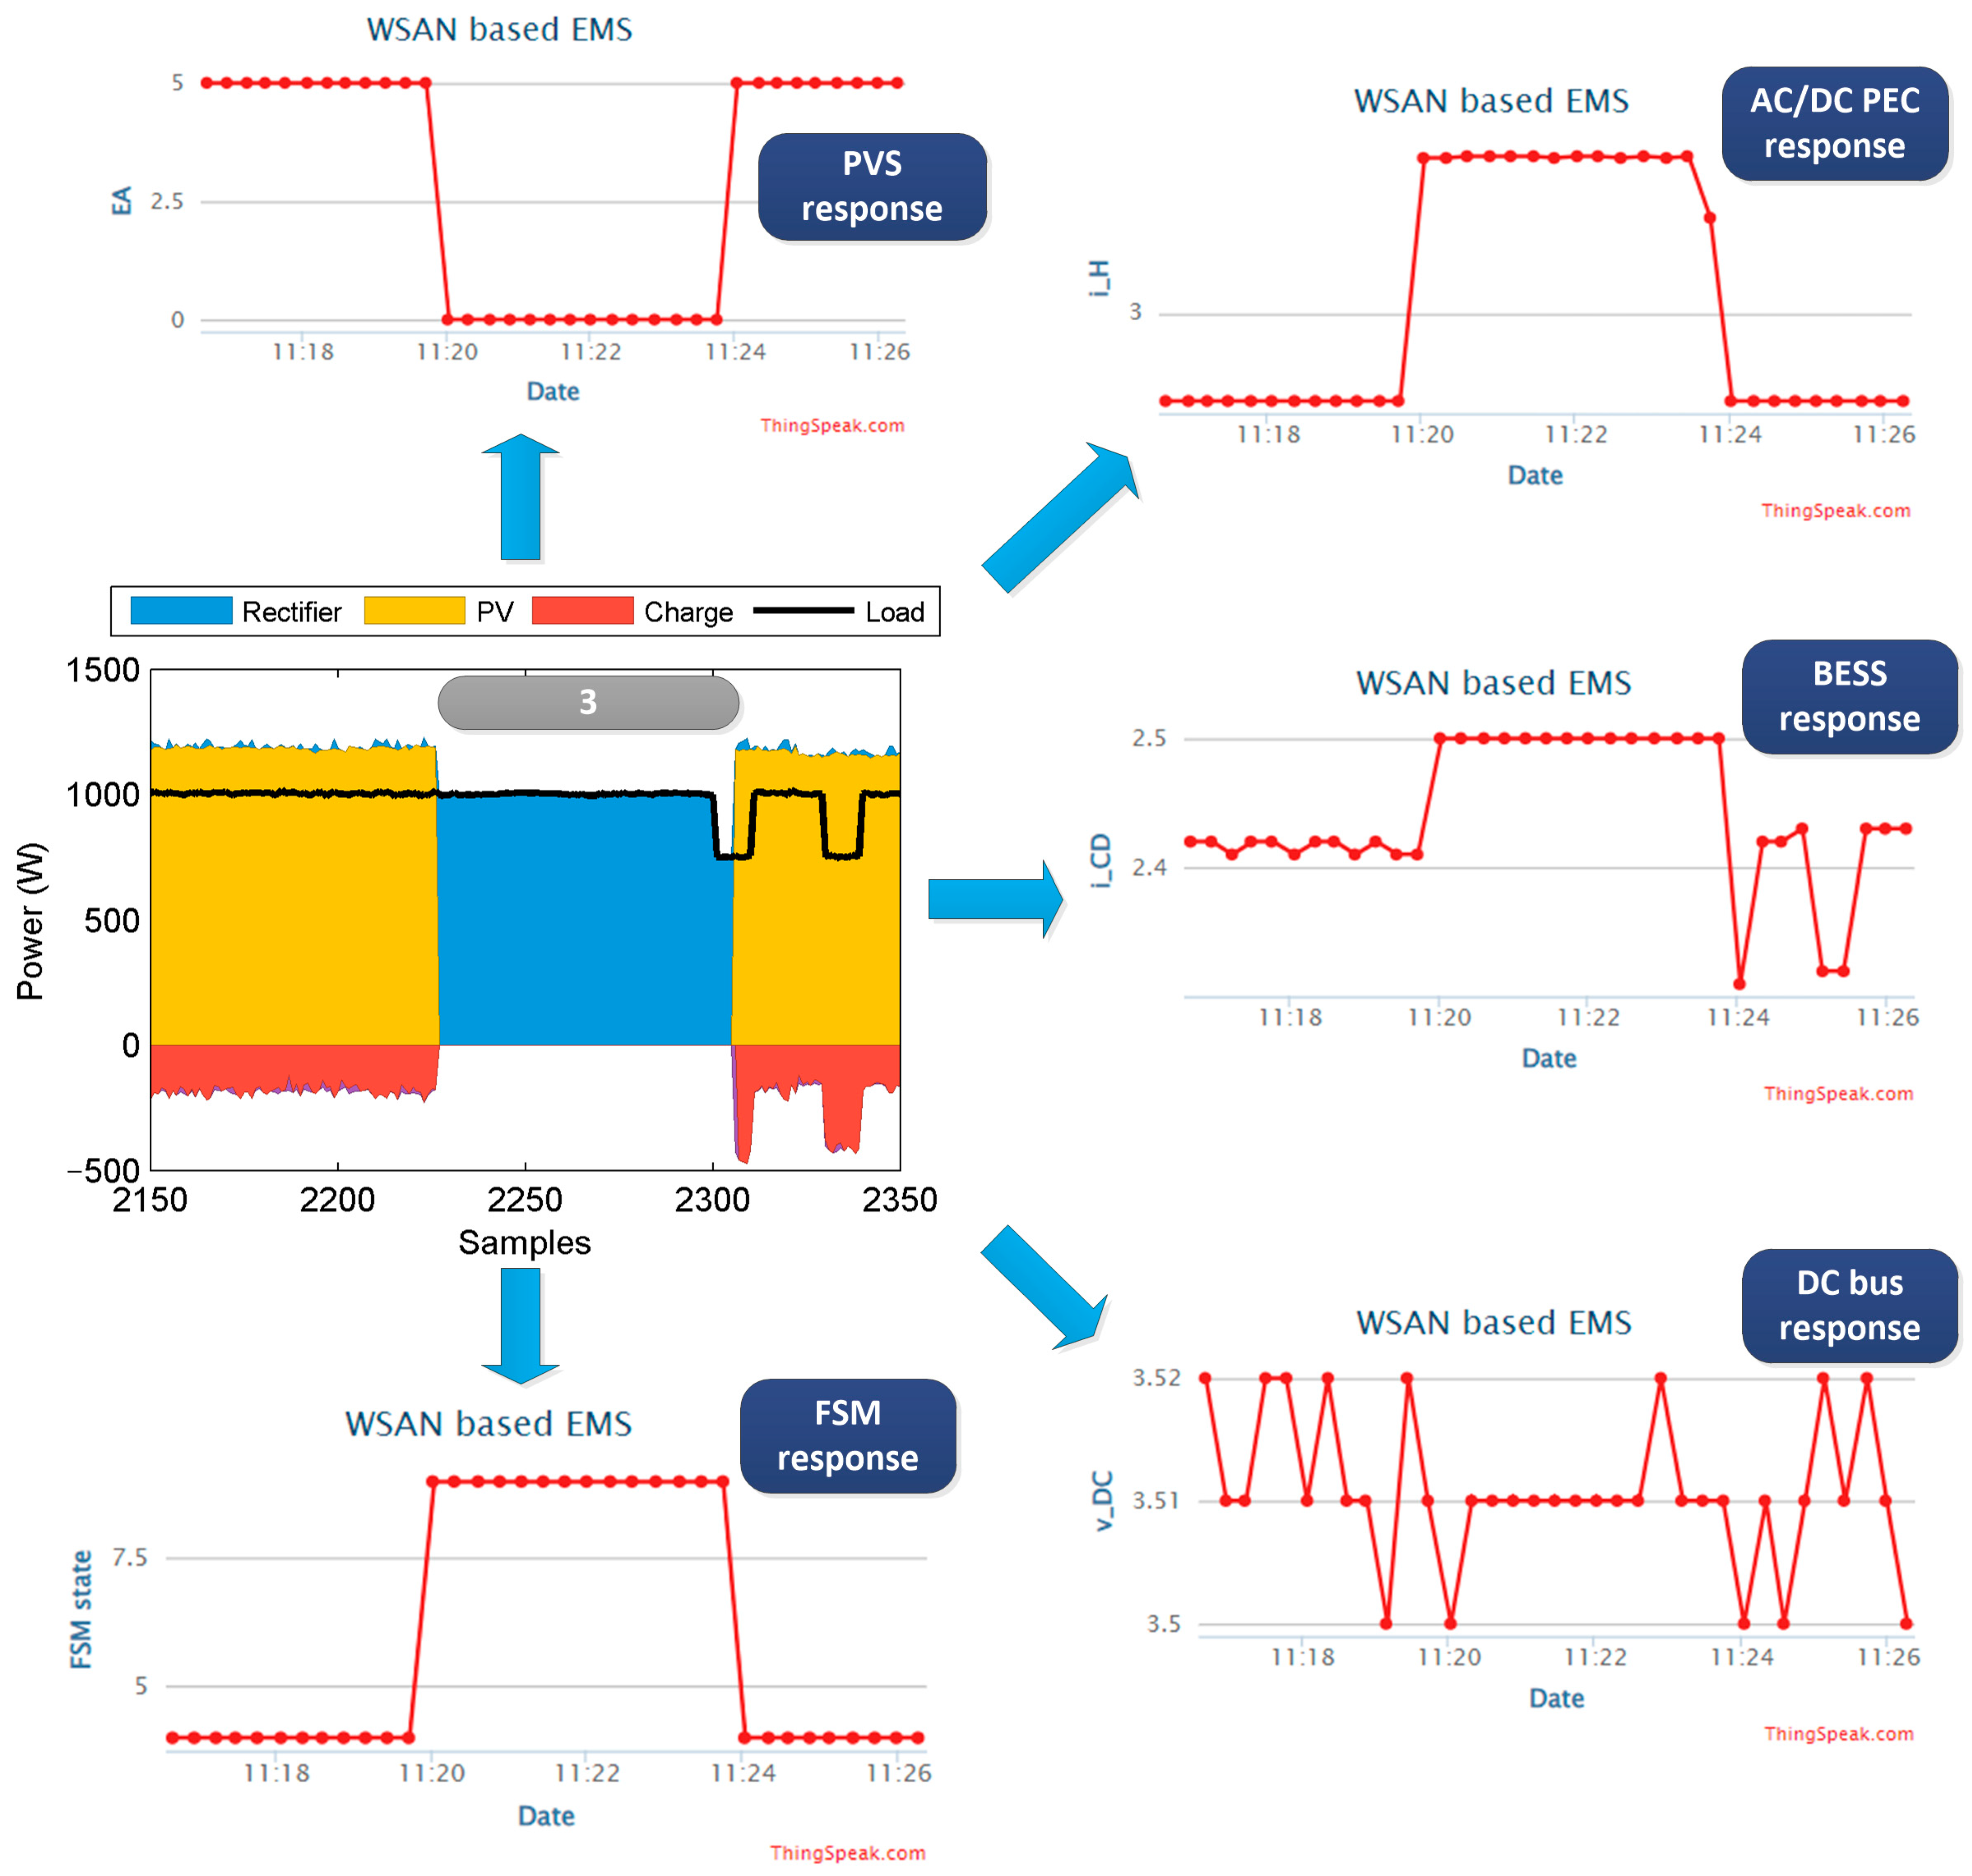
To exemplify the user experience of a monitoring process, Figure 14 shows the visual response from the UWA interface to the PVS outage during event 3, indicated in Figure 9. It is important to mention that the CN uploads to the cloud the values of the measured variables without any type of normalization or scaling. Thus, the operations executed by the CN and all the LSs are reduced to a minimum. For instance, a 0 A value is represented with a 2.5 raw value for both the BESS () and the AC/DC PEC () currents. Similarly, the variable can take a value of either 0 (PV energy unavailable) or 5 (PV energy available); meanwhile, a raw value of 3.51 in the DC bus voltage represents 360 V. In particular, event 3 generated different visual effects in the UWA interface, as shown in Figure 14. These visual effects include the PVS disconnection, represented by changing from 5 to 0 (see top left plot in Figure 14); the increasing of above 2.5 to indicate that the MG is supplying the DC load (top right plot in Figure 14); the change from the fourth to the nineth state in the FSM (left bottom plot in Figure 14); and the variation in the values of and . The plot representing the variations of (middle right plot Figure 14) shows the charging process of the battery bank with values below to 2.5 as the BESS extracts energy from the DC bus due to an energy surplus delivered by the PVS. When the PVS is disconnected from the DC-µG, reaches a value of 2.5 to indicate the disconnection of the BESS. Similarly, a plot is used to represent the evolution of (bottom right plot in Figure 14), whose value is almost constantly maintained at 3.51 (360 V), except while the state of the PVS changes or the DC load is variated.

Figure 14.
Example of a monitoring process using the UWA interface during event 3.
6. Discussion
Based on the responses emitted by the EMS to accomplish the energy supply for the connected load (both in Figure 9 and Figure 10), it is possible to infer that the results demonstrated that the IoT-EMS-WSAN fulfils an adequate energy balance during the DC-µG management.
It is important to recall that, in Section 4.1.2, we mention that the CN was configured to have a 1200 ms execution time, which is 10 times faster than the implemented FSM in the HIL platform’s PC. Consequently, this increased execution time is responsible for variations in the implemented FSM for the WSAN, as observed in Figure 11. Nevertheless, the implemented set of energy management strategies satisfied the energy interchange between the elements of the DC-µG. In addition, these variations were not capable of destabilizing the DC bus, as they were mostly present within a ±2% range around the setpoint. In any case, the implemented FSM for the WSAN not only fulfils the expected performance but also maintains a stable DC bus despite the existing variations.
To manage the disconnection occurrences during the events 1, 2, and 4 shown in Figure 9, the FSM had to change its state. Since the energy source outage derives from an FSM state that regulates the DC voltage bus based on the energy source, the disconnection not only produces a voltage drop in the DC voltage bus; it also interrupts the energy supply for the DC load. Here, the latency of the FSM becomes very important, as the recovery time during a voltage drop will be completely dependent on it. To exemplify this, it is possible to compare the influence of this recovery time between the implemented FSM with the WSAN and the implemented FSM with a PC HIL platform. Here, the FSM with the WSAN required 1 s to recover, being 850 ms slower than the implemented FSM with a PC HIL platform, which only required 150 ms. Based on [42], this increment in the recovery time reflects a lower energy quality by changing from an instantaneous energy interruption (0.3–500 ms) to a momentaneous energy interruption (500 ms–3 s).
The FSM implemented in the WSAN requires an execution time that is relatively large because the CN performs two HGR to each LS by following this sequence:
- The CN initializes the connection with the LS.
- The CN sends a request to the LS to measure its variables.
- The LS responds to the CN with the results from the measuring.
- The CN computes the next state for the FSM, which includes the corresponding update for the OM.
- The CN requests that the LS to update the OM.
- The LS updates the OM.
- The CN and the LS close the connection.
With Figure 14, it was possible to demonstrate that the UWA presents itself as an efficient tool to monitor the DC-µG and its components. Unquestionably, the monitoring process could be improved to offer a better user-friendly environment. To be sure, the plots could include data in a normalized format with an adequate scaling. Additionally, the inclusion of a similar plot to the one shown in Figure 9 could offer the user a continuous monitoring tool with a broader perspective on the contributions made by each component in the DC-µG. These features are considered for a future improvement in the UWA interface. It is important to mention that, as the UWA interface is run in the cloud, the proposed improvements will not influence the actual performance of the other elements such as the WSAN, the CN, or the LS.
7. Conclusions
Certainly, as future work, the communication between the CN and the LS could be improved in two manners. On the one hand, it can be modified to eliminate the connection/disconnection steps by keeping a communication alive. On the other hand, the communication could be reduced to a single HGR by computing the next state based on the measurements from both the actual and the previous interactions. However, the control would be performed while taking account of a delay; therefore, this alternative requires a different control theory approach.
Even though it is possible to use the UWA for identifying critical events, such as an energy outage in the DC-µG, the IoT-EMS-WSAN does not include an alert system to inform the user about these types of events. Therefore, the inclusion of an alert system, via e-mail, for example, is an important feature to be considered as part of a future improvement. Overall, the presented IoT-EMS-WSAN demonstrated to be an effective tool to remotely monitor and control a DC-µG, even when the system has some opportunity areas for its improvement.
In comparison to [28,29,30], the wireless nodes composing the IoT-EMS-WSAN in this work not only takes control actions on the demand side but also in all the elements contained in the DC-µG. Other than simply monitor the elements of a DC-µG, as in [31,32], the developed IoT-EMS-WSAN presents with the advantage of executing control actions on these elements. Additionally, the user has the possibility to decide which control actions are executed by this system, which is an inexistant option in similar studies [29]. An important advantage of this IoT-EMS-WSAN is that the superior level of the EMS is locally executed as an alternative to an external execution on the cloud [33]. Consequently, the system can maintain an effective operation even when there is a connectivity failure with a cloud server. Finally, different from [34], the developed EMS for this work integrates an IoT perspective to offer a monitoring and a remote control over a DC-µG. To sum up, the developed IoT-EMS-WSAN that was presented in this work stands out as a user-friendly system to monitor and to control a DC-µG. On the one hand, the system offers a user-friendly monitoring interface to observe the behavior of all the components interconnected in the DC-µG. On the other hand, the system not only offers a remote control on the DC-µG operation, but it also allows the user to configure the DC-µG for its autonomous operation, or to select an operation mode for each source connected to the DC-µG. Particularly, this manual operation feature extends the tertiary level of the EMS.
By implementing an EMS with a WSAN, the infrastructure for the communication layer in a DC-µG is reduced due to the functionality and viability of the implemented EMS. Consequently, its implementation requires a lower initial investment, reflecting a commercial advantage. However, the interconnected elements in a DC-µG with a WSAN-based EMS are required to have both a wireless communication and local controllers in their designs with capabilities to operate under a WSAN scheme.
At the end, the IoT-EMS-WSAN was validated with a DC-µG that was emulated on a HIL platform, which is a research infrastructure to develop new findings in fields of study such as RES, µG, EMS, and other related topics. Assuredly, the recurrent use of HIL platforms is due to several advantages that include the emulation of a variety of PV generation profiles, an independency from the weather conditions during the experimental stage, an easy adjustment on the dimensioning of a µG (e.g., the number of PV panels, the cell numbers in a battery bank, etc.), the emulation of energy outage from the PVS or the MG, and the reduction in the total time required to perform the experimental stage. Most of these advantages were clearly demonstrated here, and the advantage that stands out is the reduction in the experimental time, as stated previously in the presented results. Lastly, the adaptation of a WSAN in this HIL platform not only improves its capabilities, but it also broadens the opportunities of research in the field. For example, the research presented in this work was focused on validating the functionality and usefulness of an WSAN-based EMS under an IoT paradigm: the complete system was developed as an IoT-EMS-WSAN. The effectiveness of this IoT-EMS-WSAN was evaluated with a comparison versus a local EMS that was implemented in a high-latency wired communication layer. As a result, this comparison not only demonstrated the functionality of the IoT-EMS-WSAN; it also gave rise to the evaluation of other EMS approaches by using the same HIL platform.
Author Contributions
The authors O.A.-R., V.S.-O., J.M.-N., M.S.-M., C.M.-N. and R.D.L.-L. contributed equally to this work. All authors have read and agreed to the published version of the manuscript.
Funding
This research received no external funding.
Institutional Review Board Statement
No applicable.
Informed Consent Statement
No applicable.
Data Availability Statement
The original contributions presented in the study are included in the article; further inquiries can be directed to the corresponding author.
Conflicts of Interest
The authors declare no conflicts of interest.
References
- Muhtadi, A.; Pandit, D.; Nguyen, N.; Mitra, J. Distributed energy resources based microgrid: Review of architecture, control, and reliability. IEEE Trans. Ind. Appl. 2021, 57, 2223–2235. [Google Scholar] [CrossRef]
- Ahmad, S.; Shafiullah, M.; Ahmed, C.B.; Alowaifeer, M. A review of microgrid energy management and control strategies. IEEE Access 2023, 11, 21729–21757. [Google Scholar] [CrossRef]
- Thirunavukkarasu, G.S.; Seyedmahmoudian, M.; Jamei, E.; Horan, B.; Mekhilef, S.; Stojcevski, A. Role of optimization techniques in microgrid energy management systems—A review. Energy Strategy Rev. 2022, 43, 100899. [Google Scholar] [CrossRef]
- Zahraoui, Y.; Alhamrouni, I.; Mekhilef, S.; Basir Khan, M.R.; Seyedmahmoudian, M.; Stojcevski, A.; Horan, B. Energy management system in microgrids: A comprehensive review. Sustainability 2021, 13, 10492. [Google Scholar] [CrossRef]
- Souza Junior, M.E.T.; Freitas, L.C.G. Power electronics for modern sustainable power systems: Distributed generation, microgrids and smart grids—A review. Sustainability 2022, 14, 3597. [Google Scholar] [CrossRef]
- Chandak, S.; Rout, P.K. The implementation framework of a microgrid: A review. Int. J. Energy Res. 2021, 45, 3523–3547. [Google Scholar] [CrossRef]
- Shahgholian, G. A brief review on microgrids: Operation, applications, modeling, and control. Int. Trans. Electr. Energy Syst. 2021, 31, e12885. [Google Scholar] [CrossRef]
- Patnaik, B.; Mishra, M.; Bansal, R.C.; Jena, R.K. AC microgrid protection—A review: Current and future prospective. Appl. Energy 2020, 271, 115210. [Google Scholar] [CrossRef]
- Ullah, Z.; Wang, S.; Lai, J.; Azam, M.; Badshah, F.; Wu, G.; Elkadeem, M.R. Implementation of various control methods for the efficient energy management in hybrid microgrid system. Ain Shams Eng. J. 2023, 14, 101961. [Google Scholar] [CrossRef]
- Chandra, A.; Singh, G.K.; Pant, V. Protection techniques for DC microgrid—A review. Electr. Power Syst. Res. 2020, 187, 106439. [Google Scholar] [CrossRef]
- Arunkumar, A.P.; Kuppusamy, S.; Muthusamy, S.; Pandiyan, S.; Panchal, H.; Nagaiyan, P. An extensive review on energy management system for microgrids. Energy Sources Part A Recovery Util. Environ. Eff. 2022, 44, 4203–4228. [Google Scholar] [CrossRef]
- Vuddanti, S.; Salkuti, S.R. Review of energy management system approaches in microgrids. Energies 2021, 14, 5459. [Google Scholar] [CrossRef]
- Chaudhary, G.; Lamb, J.J.; Burheim, O.S.; Austbø, B. Review of energy storage and energy management system control strategies in microgrids. Energies 2021, 14, 4929. [Google Scholar] [CrossRef]
- Al-Ismail, F.S. DC microgrid planning, operation, and control: A comprehensive review. IEEE Access 2021, 9, 36154–36172. [Google Scholar] [CrossRef]
- Ali, S.; Zheng, Z.; Aillerie, M.; Sawicki, J.P.; Pera, M.C.; Hissel, D. A review of DC Microgrid energy management systems dedicated to residential applications. Energies 2021, 14, 4308. [Google Scholar] [CrossRef]
- Sámano-Ortega, V.; Arzate-Rivas, O.; Martínez-Nolasco, J.; Aguilera-Álvarez, J.; Martínez-Nolasco, C.; Santoyo-Mora, M. Multipurpose Modular Wireless Sensor for Remote Monitoring and IoT Applications. Sensors 2024, 24, 1277. [Google Scholar] [CrossRef] [PubMed]
- Kandris, D.; Nakas, C.; Vomvas, D.; Koulouras, G. Applications of Wireless Sensor Networks: An Up-to-Date Survey. Appl. Syst. Innov. 2020, 3, 14. [Google Scholar] [CrossRef]
- BenSaleh, M.S.; Saida, R.; Kacem, Y.H.; Abid, M. Wireless sensor network design methodologies: A survey. J. Sens. 2020, 2020, 9592836. [Google Scholar] [CrossRef]
- Huanan, Z.; Suping, X.; Jiannan, W. Security and application of wireless sensor network. Procedia Comput. Sci. 2021, 183, 486–492. [Google Scholar] [CrossRef]
- Temene, N.; Sergiou, C.; Georgiou, C.; Vassiliou, V. A survey on mobility in wireless sensor networks. Ad Hoc Netw. 2022, 125, 102726. [Google Scholar] [CrossRef]
- Wang, Z.; Liu, Z.; Liu, L.; Fang, C.; Li, M.; Zhao, J. Joint Optimization of Control Strategy and Energy Consumption for Energy Harvesting WSAN. Entropy 2022, 24, 723. [Google Scholar] [CrossRef] [PubMed]
- Seferagić, A.; Famaey, J.; De Poorter, E.; Hoebeke, J. Survey on Wireless Technology Trade-Offs for the Industrial Internet of Things. Sensors 2020, 20, 488. [Google Scholar] [CrossRef]
- Jurado Perez, L.; Salvachúa, J. Simulation of scalability in cloud-based iot reactive systems leveraged on a wsan simulator and cloud computing technologies. Appl. Sci. 2021, 11, 1804. [Google Scholar] [CrossRef]
- Ahmad, R.; Wazirali, R.; Abu-Ain, T. Machine Learning for Wireless Sensor Networks Security: An Overview of Challenges and Issues. Sensors 2022, 22, 4730. [Google Scholar] [CrossRef]
- Nourildean, S.W.; Hassib, M.D.; Mohammed, Y.A. Internet of things based wireless sensor network: A review. Indones. J. Electr. Eng. Comput. Sci. 2022, 27, 246–261. [Google Scholar] [CrossRef]
- Landaluce, H.; Arjona, L.; Perallos, A.; Falcone, F.; Angulo, I.; Muralter, F. A review of IoT sensing applications and challenges using RFID and wireless sensor networks. Sensors 2020, 20, 2495. [Google Scholar] [CrossRef] [PubMed]
- Diwakar, M.; Sharma, K.; Dhaundiyal, R.; Bawane, S.; Joshi, K.; Singh, P. A review on autonomous remote security and mobile surveillance using internet of things. J. Phys. Conf. Ser. 2021, 1854, 012034. [Google Scholar] [CrossRef]
- Saleem, M.U.; Usman, M.R.; Usman, M.A.; Politis, C. Design, deployment and performance evaluation of an IoT based smart energy management system for demand side management in smart grid. IEEE Access 2022, 10, 15261–15278. [Google Scholar] [CrossRef]
- Pawar, P.; TarunKumar, M. An IoT based Intelligent Smart Energy Management System with accurate forecasting and load strategy for renewable generation. Measurement 2020, 152, 107187. [Google Scholar] [CrossRef]
- Munoz, O.; Ruelas, A.; Rosales, P.; Acuña, A.; Suastegui, A.; Lara, F. Design and Development of an IoT Smart Meter with Load Control for Home Energy Management Systems. Sensors 2022, 22, 7536. [Google Scholar] [CrossRef]
- Gonzalez, I.; Calderón, A.J.; Folgado, F.J. IoT real time system for monitoring lithium-ion battery long-term operation in microgrids. J. Energy Storage 2022, 51, 104596. [Google Scholar] [CrossRef]
- Rani, D.P.; Suresh, D.; Kapula, P.R.; Akram, C.M.; Hemalatha, N.; Soni, P.K. IoT based smart solar energy monitoring systems. Mater. Today Proc. 2023, 80, 3540–3545. [Google Scholar] [CrossRef]
- Ali, W.; Ulasyar, A.; Mehmood, M.U.; Khattak, A.; Imran, K.; Zad, H.S.; Nisar, S. Hierarchical control of microgrid using IoT and machine learning based islanding detection. IEEE Access 2021, 9, 103019–103031. [Google Scholar] [CrossRef]
- Kondoro, A.; Dhaou, I.B.; Tenhunen, H.; Mvungi, N. A low latency secure communication architecture for microgrid control. Energies 2021, 14, 6262. [Google Scholar] [CrossRef]
- Hosseini, E.; Horrillo-Quintero, P.; Carrasco-Gonzalez, D.; García-Triviño, P.; Sarrias-Mena, R.; García-Vázquez, C.A.; Fernández-Ramírez, L.M. Optimal energy management system for grid-connected hybrid power plant and battery integrated into multilevel configuration. Energy 2024, 294, 130765. [Google Scholar] [CrossRef]
- Bhattar, C.L.; Chaudhari, M.A. Centralized Energy Management Scheme for Grid Connected DC Microgrid. IEEE Syst. J. 2023, 17, 3741–3751. [Google Scholar] [CrossRef]
- Krishan, O.; Suhag, S. Power management control strategy for hybrid energy storage system in a grid-independent hybrid renewable energy system: A hardware-in-loop real-time verification. IET Renew. Power Gener. 2020, 14, 454–465. [Google Scholar] [CrossRef]
- Rajput, A.K.; Lather, J.S. Energy management of a DC microgrid with hybrid energy storage system using PI and ANN based hybrid controller. Int. J. Ambient. Energy 2023, 44, 703–718. [Google Scholar] [CrossRef]
- MHilmi; Lystianingrum, V.; Romlie, M.F. Energy Management System Based on Finite State Machine for Battery-Supercapacitor Hybrid Energy Storage System on Standalone Photovoltaic. In Proceedings of the 2024 IEEE 4th International Conference in Power Engineering Applications (ICPEA), Pulau Pinang, Malaysia, 4–5 March 2024; pp. 91–96. [Google Scholar] [CrossRef]
- Pamulapati, T.; Allahham, A.; Walker, S.L.; Giaouris, D. Evolution Operator-based automata control approach for EMS in active buildings. In Proceedings of the 11th International Conference on Power Electronics, Machines and Drives (PEMD), Hybrid Conference, Newcastle, UK, 21–23 June 2022; pp. 775–779. [Google Scholar] [CrossRef]
- Kanouni, B.; Badoud, A.E.; Mekhilef, S.; Bajaj, M.; Zaitsev, I. Advanced efficient energy management strategy based on state machine control for multi-sources PV-PEMFC-batteries system. Sci. Rep. 2024, 14, 7996. [Google Scholar] [CrossRef]
- Sepasi, S.; Talichet, C.; Pramanik, A.S. Power quality in microgrids: A critical review of fundamentals, standards, and case studies. IEEE Access 2023, 11, 108493–108531. [Google Scholar] [CrossRef]
- Wang, Z.; Feng, G.; Zhen, D.; Gu, F.; Ball, A. A review on online state of charge and state of health estimation for lithium-ion batteries in electric vehicles. Energy Rep. 2021, 7, 5141–5161. [Google Scholar] [CrossRef]
- ThingSpeak. Natick, Massachusetts: The MathWorks Inc. Available online: https://thingspeak.com/ (accessed on 12 August 2024).


Disclaimer/Publisher’s Note: The statements, opinions and data contained in all publications are solely those of the individual author(s) and contributor(s) and not of MDPI and/or the editor(s). MDPI and/or the editor(s) disclaim responsibility for any injury to people or property resulting from any ideas, methods, instructions or products referred to in the content. |
© 2024 by the authors. Licensee MDPI, Basel, Switzerland. This article is an open access article distributed under the terms and conditions of the Creative Commons Attribution (CC BY) license (https://creativecommons.org/licenses/by/4.0/).