Article

Resonance-Induced Capacitively Coupled Contactless Conductivity Detection (ReC4D) Unit for Nucleic Acid Amplification Testing

by
Roberto G. Ramírez-Chavarría
*,
Jorge A. Uc-Martín
,
Bryan E. Alvarez-Serna
and
Ramón F. Padilla-Morán
Instituto de Ingeniería, Universidad Nacional Autónoma de México, Av. Universidad 3000, Coyoacán, Ciudad de México 04510, Mexico
*
Author to whom correspondence should be addressed.
Technologies 2025, 13(4), 138; https://doi.org/10.3390/technologies13040138
Submission received: 28 January 2025 / Revised: 25 March 2025 / Accepted: 28 March 2025 / Published: 2 April 2025
(This article belongs to the Special Issue New Technologies for Sensors)

Abstract

:
Nucleic acid amplification (NAA) is a technique that increases the number of copies of a gene, making it possible to detect microorganisms. This technique is often used in clinical tests, biochemical analysis, and environmental assays, to mention only a few. However, developing portable, robust, and low-cost measurement platforms to evaluate NAA products remains a technological challenge. Therefore, in this work, we introduce an attractive unit for detecting and quantifying nucleic acids based on the capacitively coupled contactless conductivity detection ( C 4 D) principle. The proposed unit, Re C 4 D, combines electrical resonance with C 4 D to enhance sensitivity when evaluating an NAA reaction. The Re C 4 D units advantages are twofold: (i) the transducer is electrically isolated to allow its reuse, and (ii) the induced electrical resonance in the Re C 4 D unit minimizes the stray capacitances of the conventional C 4 D assays, which enhances sensitivity, increases the linear operating range, and improves the limit of detection (LoD). Furthermore, we evaluated the proposed device for quantifying different concentrations of SARS-CoV-2 genetic material and compared it with measurements from a conventional C 4 D unit. Thus, we demonstrate that the Re C 4 D unit can measure concentrations of NAA products with an LoD of 0.24 copy μ L and a sensitivity of 5.618 kHz log ( copy μ L ) . These results position the Re C 4 D unit close to the state-of-the-art NAA testing platforms, with the added value of a low cost, robustness, reusability, and affordability.

Graphical Abstract

1. Introduction

Nucleic acid amplification (NAA) is a standard molecular procedure that allows the detection and sequencing of genetic material to detect and identify species of organisms [1]. The basic principle of NAA consists of preparing a solution with small amounts of nucleic acid, which is then subjected to temperature changes together with other reagents that allow its exponential replication [2]. State-of-the-art reports show that NAA procedures are widely implemented due to their high sensitivity, speed, and ability to detect viral diseases or bacterial agents directly [3]. Among NAA techniques, the most well known is the polymerase chain reaction (PCR) [4]. Recently, some prominent methods have also emerged to avoid temperature cycling, such as loop-mediated isothermal amplification (LAMP), strand displacement amplification (SDA), and transcription-mediated amplification (TMA) [5,6].
Despite the maturity and broad capabilities of NAA procedures for detecting microorganisms, specific technological issues still need to be addressed [7]. For example, there may be a lack of accuracy in the results due to external contamination of biological samples (BSs). Furthermore, procedures to control undesirable nucleic acid elements are often lacking when combined with other techniques. Another major challenge is developing new multivariate, rapid, quantitative, portable, highly sensitive, and low-cost clinical diagnostic platforms to integrate with nucleic acid amplification procedures [8,9]. Therefore, optimization, automatization, and integration of new platforms with existing NAA procedures could improve the detection and prevention of diseases and epidemics [10,11].
Existing transduction mechanisms for NAA testing include optical methods such as colorimetric [12], luminescence-based assays [13], piezoelectric sensors [14], surface plasmon resonance methods [15], and electrochemical devices [16]. Optical methods allow quantitative detection of nucleic acids by spectral analysis, usually by adding fluorescent probes to reagent samples [17]. However, this method is limited, requiring complex reagents and sophisticated equipment [18]. Piezoelectric methods rely on changes in the frequency of a resonator to detect targets [19]. Unlike optical methods, they are label-free, easy to operate, offer a sensitive response, have good selectivity, and are easily automated. However, some piezoelectric materials are susceptible to environmental interference, and their use is generally focused on relatively large targets, such as whole bacteria, rather than short sequences such as genetic material. Likewise, surface plasmon resonance-based methods have limited application for ultrasensitive detection due to the difficulty they have in detecting small changes in refractive index [20]. Therefore, metal nanoparticles are added to reagent samples to improve their performance, thus limiting their affordability.
On the other hand, electrochemical methods offer high sensitivity and can detect point targets and single-nucleotide polymorphisms in nucleic acid [21,22]. Therefore, they are commonly used to evaluate and monitor BSs by using contact electrodes. One disadvantage is that, over time, the electrodes can present problems of low reproducibility due to fouling and passivation of the electrodes [23]. Despite this, electrochemical transduction has stood out for its ability to offer a cost-effective alternative for integrating robust, portable, and reliable measurement systems [24,25].
Capacitively coupled contactless conductivity detection ( C 4 D) is an electroanalytical method mainly used to determine ion concentration and conductivity [26]. It usually consists of an array of tubular electrodes placed along the axis of a capillary. These electrodes are galvanically isolated, forming capacitances with the electrolyte solution inside the tube. Hence, the conductivity of a solution is obtained by applying an alternating voltage and measuring the resultant electric current. The main applications of C 4 D include capillary electrophoresis [27], pharmaceutical [28], and food [29]. For example, in Ref. [26] a C 4 D sensor was developed for conductivity detection in millimeter-scale pipes by introducing the series resonance principle, allowing for an efficient implementation of conductivity measurement in pipes with diameters on the order of millimeters. Another C 4 D sensor design is based on the capacitively coupled tubular axial arrangement, employing a pair of coils for inductive coupling [30]. This approach has been proposed for disposable measurement setups, such as those used in clinical applications. The study in Ref. [31] suggests a five-electrode capacitively coupled non-contact conductivity detector (TI C 4 D), which uses a copper mesh between the electrodes for ground shielding to reduce interference from stray capacitance and noise. At a flow rate of 0.5 mL min 1 , a lower limit of detection (LOD) of 3 × 10 10 M is achieved for a 10 3 M KCl solution. Other non-conventional C 4 D configurations based on printed circuit boards (PCBs) [32] and planar electrodes [33] have also been reported, with potential for paper-based analytical systems and wet paper gas absorption detection.
Currently, the main issues with conventional C 4 D detection are its low sensitivity, detection limit, and repeatability due to the stray capacitances in the system. These capacitances are on the order of picofarads (pF) to femtofarads (fF) and can be reduced with integrated designs that add an insulating layer or by reasonably increasing the excitation frequency [34,35]. However, these options may increase the complexity and cost of the system. An attractive alternative to address the issue of stray capacitances is to use the principle of electrical resonance since this method can minimize stray capacitances at the resonance frequency and improve the signal-to-noise ratio compared to conventional C 4 D systems [36].
Although C 4 D technology has demonstrated its potential and versatility, there are sparse reports on detection units to quantify nucleic acids in the microliter-droplet range. Therefore, in this work, we present the Re C 4 D unit, which combines C 4 D detection with electrical resonance to enhance the sensitivity of the conventional method. The combination of electrical resonance with C 4 D detection, to the best of our knowledge, is a scarcely explored idea, and our unit serves as a crucial proof of concept to pave the way for developing new NAA detection units. The proposed unit consists of interdigitated electrodes covered with adhesive tape for capacitive coupling, an external inductor connected in series, and a simple instrumentation system. These features make our unit an attractive alternative for monitoring NAA in resource-limited environments, as it is easy to implement, low-cost, and modular.
The rest of the work is structured as follows. In Section 2, the materials and methods are thoroughly described. The results are presented in Section 3. Finally, Section 4 is devoted to the conclusions.

2. Materials and Methods

2.1. RT-LAMP Reaction Preparation

Biological samples (BSs) were prepared using quantitative synthetic SARS-CoV-2 ribonucleic acid (RNA) standards (VR-3276SD) purchased from American Type Culture Collection (Manassas, VA, USA). To prepare the RT-LAMP assay, the RNA was subjected to reverse transcription and added to the loop-mediated isothermal amplification with a simultaneous reverse-transcription (RT-LAMP) reaction mix, as detailed in Ref. [37]. Finally, the reaction was heated at a constant temperature of 63 °C for 30 min until it reached the endpoint. The preparation of the RT-LAMP reaction and the assay have the following main advantages.
(i)
The RNA can be extracted from any sample or matrix, preventing measurement interference, as all samples are prepared using the same RT-LAMP reaction mix.
(ii)
The RT-LAMP reaction mix contains primers specifically designed for the SARS-CoV-2 N and ORF1ab genes. These primers ensure high selectivity in the RT-LAMP assay, as genetic amplification occurs only when these genes are present.
These advantages, combined with the C 4 D unit, enable measurements with enough sensitivity and selectivity to quantify the genetic amplification products of SARS-CoV-2.

2.2. Electrical Conductivity of Nucleic Acid Amplification Products

Producing an NAA by an RT-LAMP reaction involves first converting RNA into complementary deoxyribonucleic acid (DNA) through a reverse transcription process. Subsequently, the reaction shifts to the isothermic LAMP amplification, during which ions are released and absorbed in the solution depending on the genetic material amplification. The production of these ions changes the conductivity of the BS, allowing the detection of nucleic acids [38]. Following the reverse transcription process, the isothermal reaction can be represented by the following equations [39]:
( DNA ) n 1 + dNTP ( DNA ) n + P 2 O 7 4 + 2 H + ,
P 2 O 7 4 + 2 Mg 2 + Mg 2 P 2 O 7 ,
2 Tris + 2 H + 2 Tris H + .
These reactions demonstrate how double-stranded DNA (dsDNA) synthesis occurs at the expense of primers and deoxynucleotide triphosphate (dNTP) consumption. Furthermore, an insoluble salt is produced, consisting of a magnesium pyrophosphate precipitate ( Mg 2 P 2 O 7 ) and protons ( H + ). The consumption of primers and dNTPs, together with the formed salt, alters the ionic strength of the solution containing the genetic material of the SARS-CoV-2 virus. Our measurement platform exploits these chemical reactions by recording electrical current signals, labeled as i o , which are proportional to the conductivity of the NAA products as a function of the nucleic acid concentration.

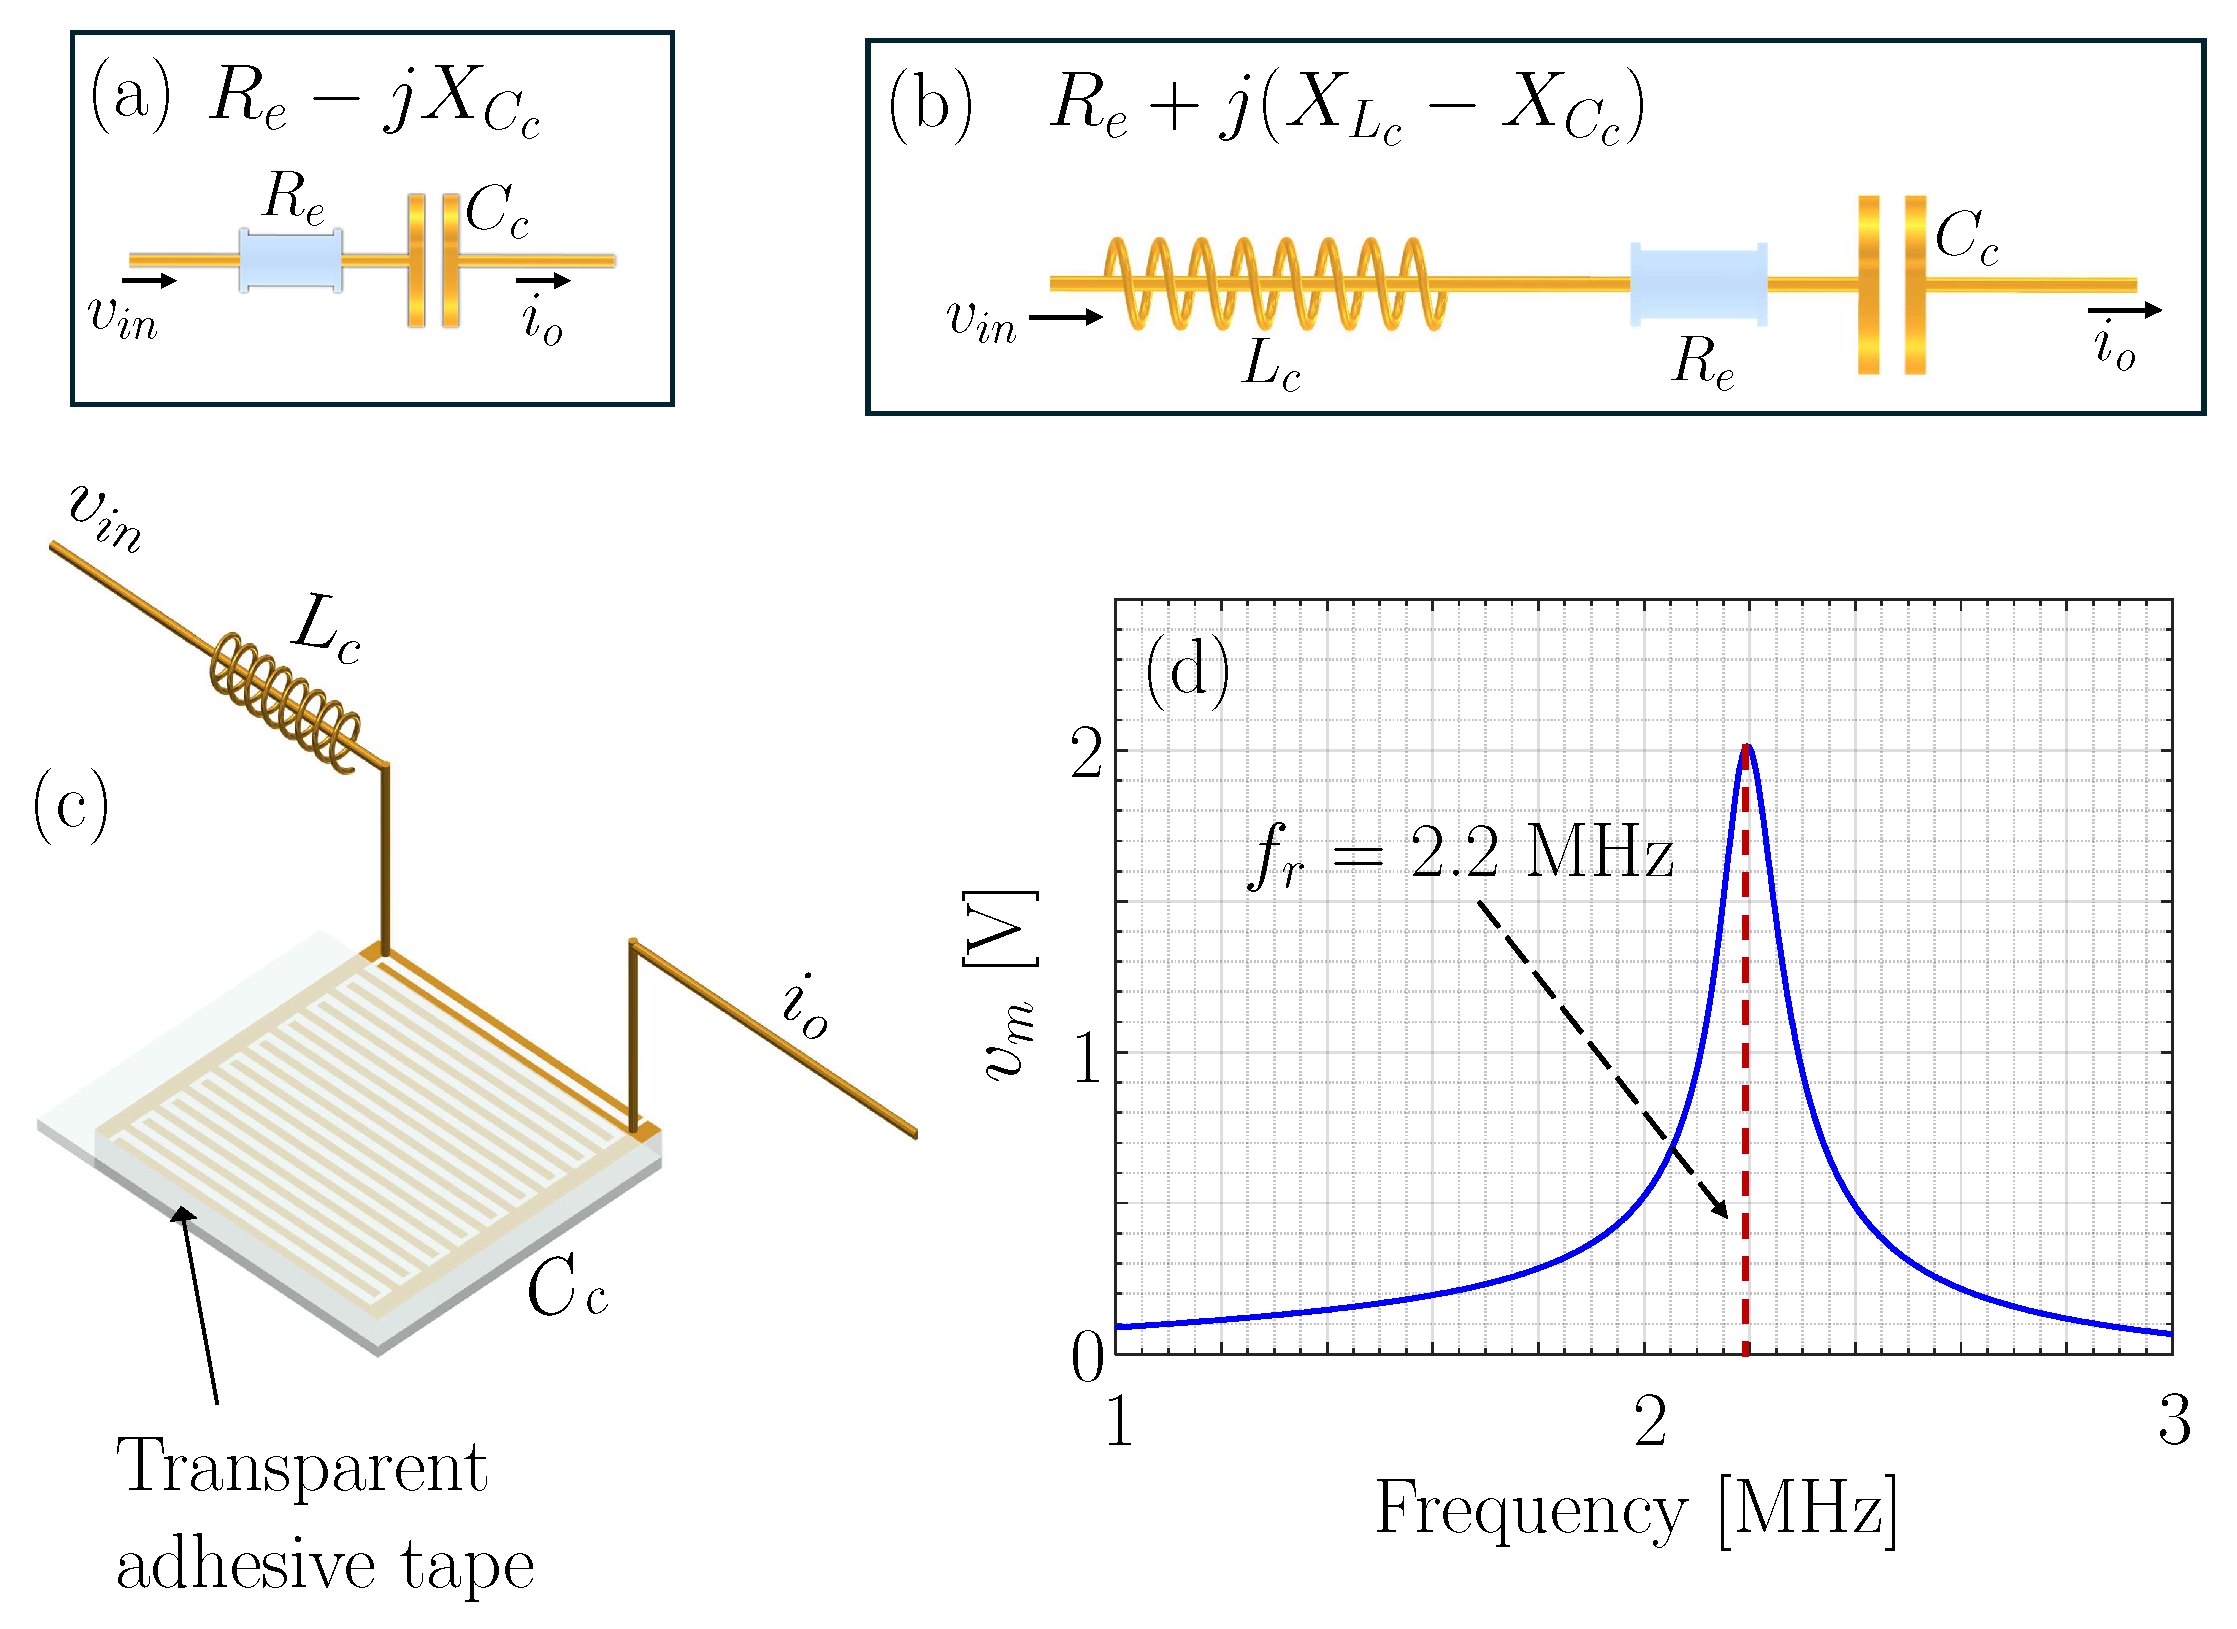
2.3. Operation Principle

The basic idea for implementing a conventional C 4 D detector is to apply an alternating current voltage with a constant amplitude and measure the current flowing through the electrodes to calculate the equivalent impedance. If a C 4 D detector is correctly positioned, the magnitude of its equivalent impedance, | Z e q | , can be represented as in Figure 1a and the following equation [34]:
| Z e q | = R e 2 + 1 2 π f C c 2 ,
where R e is determined by the electrical interaction between the solution and the electrodes and can be defined as R e = K κ , considering that K is the geometric factor of the electrodes and κ is the conductivity of the analyte; meanwhile, C c represents the capacitance formed by the electrodes and the solution in a frequency range from 10 3 to 10 6 Hz. On the other hand, the detector’s response can be analyzed through the relative sensitivity ( RS ) to observe the changes in | Z e q | due to variations in R e using the following expression [40]:
RS = | Z e q | R e = R e R e 2 + 1 2 π f C c 2 .
As defined in Equation (5), the ideal condition is for the RS to be equal to 1. On the other hand, it can be observed in Equation (5) that if the solution’s conductivity is very low ( κ 0) and the operating frequency is sufficiently high ( f ), the response of the conventional C 4 D detector will be dominated by C c , and R e . This behavior highlights the limitations of traditional C 4 D detectors, as their sensitivity depends on both the frequency and the value of C c , which is difficult to control due to its dependence on the detector’s position, stray capacitances, and the experimental setup, thereby compromising the sensitivity, repeatability, and accuracy of the measurements [34].
Therefore, in the Re C 4 D unit, we add an external inductor ( L c ) in series with a conventional C 4 D detector, as shown in Figure 1b. With this inductor, the RS of our unit can be described by
RS = | Z e q | R e = R e R e 2 + 1 2 π f C c + 2 π f L C 2 .
In this expression, one can observe that the response is controlled by C c and L c , which provides greater control over the reproducibility and accuracy of the measurements. With a fixed value of L c , one can reduce the effect of the capacitive component. Furthermore, by adding the inductor, the Re C 4 D unit can reach electrical resonance, which increases sensitivity and allows the | Z e q | , at resonance, to be dominated by κ ; i.e.,
| Z e q | K κ .
Finally, another advantage of adding the inductor is that the Re C 4 D unit can respond as a function of the resonance frequency, which can be calculated as
f r = 1 2 π L c C c ;
even minimal changes in C c would alter the value of f r . This behavior would enhance the sensitivity and limit of detection of the measurements. In summary, our Re C 4 D unit provides better control over the detector’s response than conventional C 4 D detectors. Furthermore, its electrical resonance capability enhances the sensitivity and detection limit of the C 4 D technique.

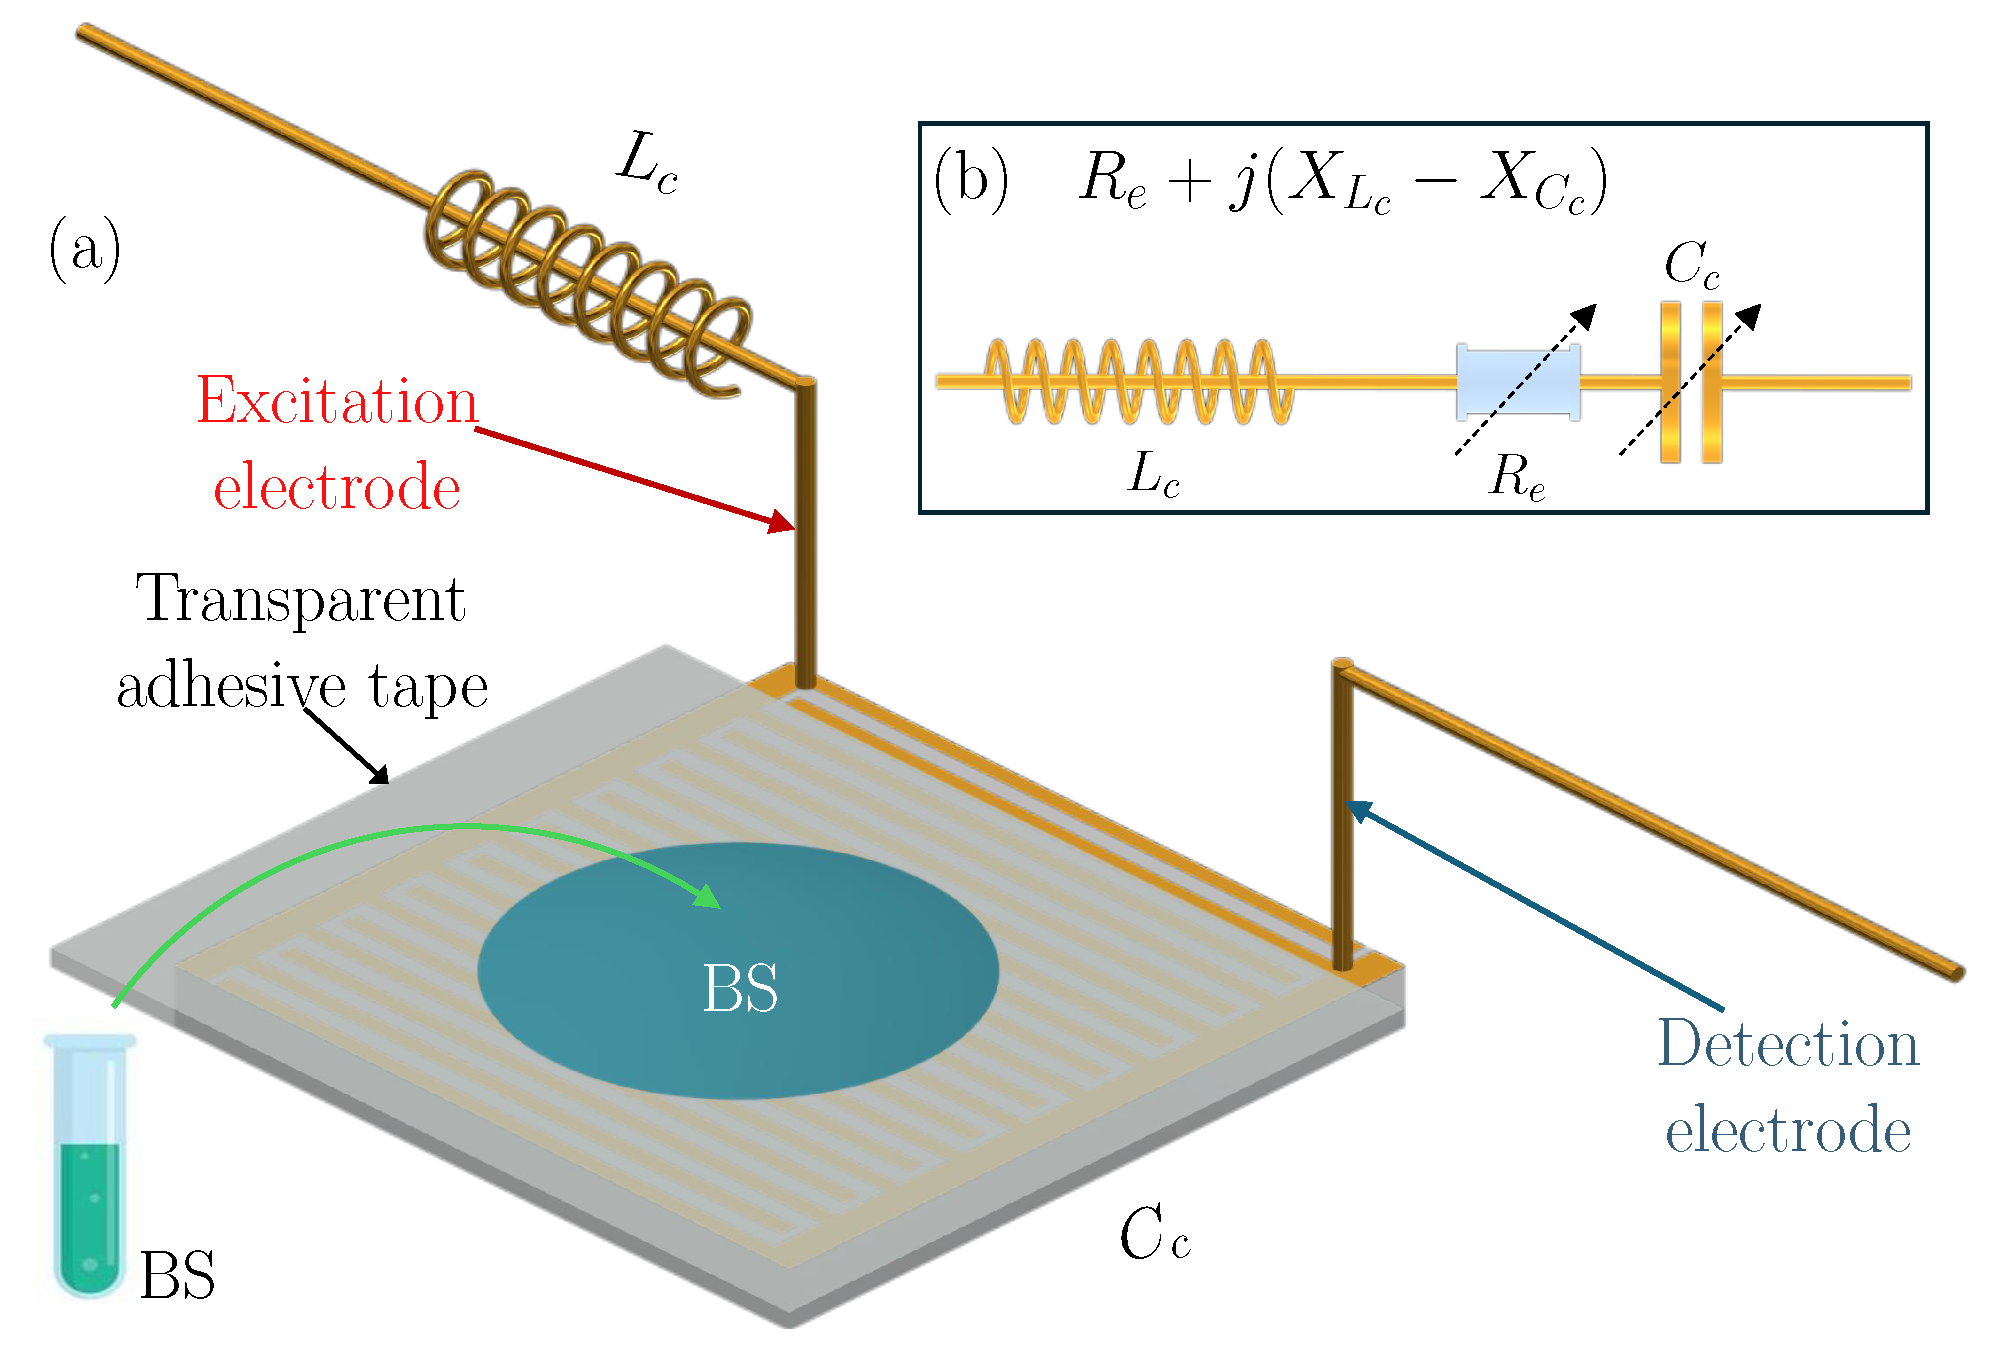
2.4. Resonance-Induced Capacitively Coupled Contactless Conductivity Detection Unit

The Re C 4 D unit was designed around interdigitated electrodes (IDEs), as shown in Figure 1c. The electrodes have a thickness of 70 μ m and are made of an alloy of gold, copper, and nickel deposited over a polyethylene terephthalate (PET) substrate of 5 mm width and 10 mm length. The IDE consists of 30 bands, each 3500 μ m in length and 45 μ m in width, separated by a distance of 55 μ m. A 40 μ m thick transparent adhesive tape made of biaxially oriented polypropylene is placed over the electrodes, serving as an electrical insulator. This insulation allows for successive non-invasive measurements without replacing the electrodes, as they never come into contact with the biological sample, eliminating the problem of contact and contamination. In addition, this allows for rapid change in this dielectric film (adhesive tape). This modification is one of the main advantages of the Re C 4 D unit over conventional C 4 D experimental setups [41,42].
The IDE is a capacitive transducer with an equivalent impedance Z e q = R e { Z e q } + j I m { Z e q } , with j = 1 , where R e { Z e q } is the real component and I m { Z e q } the reactive part. The IDEs have low capacitance, typically on the order of picofarads, which results in high impedance dominated by the reactive component. This characteristic makes it difficult to detect small changes in conductivity represented by the real component. To address this issue, we have added a commercial 470 μ H inductor in series with the electrodes to promote electrical resonance [30]. Figure 1b shows the equivalent circuit, which includes the values for the inductance ( L c ), capacitance ( C c ), and resitor ( R e ) of the unit.
We determined the values of R e and C c for the Re C 4 D unit without the BS, using the Analog Discovery 2 measurement device by Digilent as a network analyzer. Thus, we obtained the values of R e = 802 Ω and C c = 11.2 pF. To calculate the resonance frequency we used Equation (8); with this, we obtained a resonance frequency value of 2.19 MHz, considering the equivalent circuit in Figure 1b and the 470 μ H inductor. The calculated f r value was experimentally validated with a frequency sweep, as shown in Figure 1d. In this plot, it can be observed that the experimental f r is 2.2 MHz. The calculated and experimental resonance frequencies are not identical, as the calculation does not account for the real value of the inductor or parasitic reactances. However, the order of magnitude is similar, allowing us to set the measurement parameters to excite and process the signals from the Re C 4 D unit.

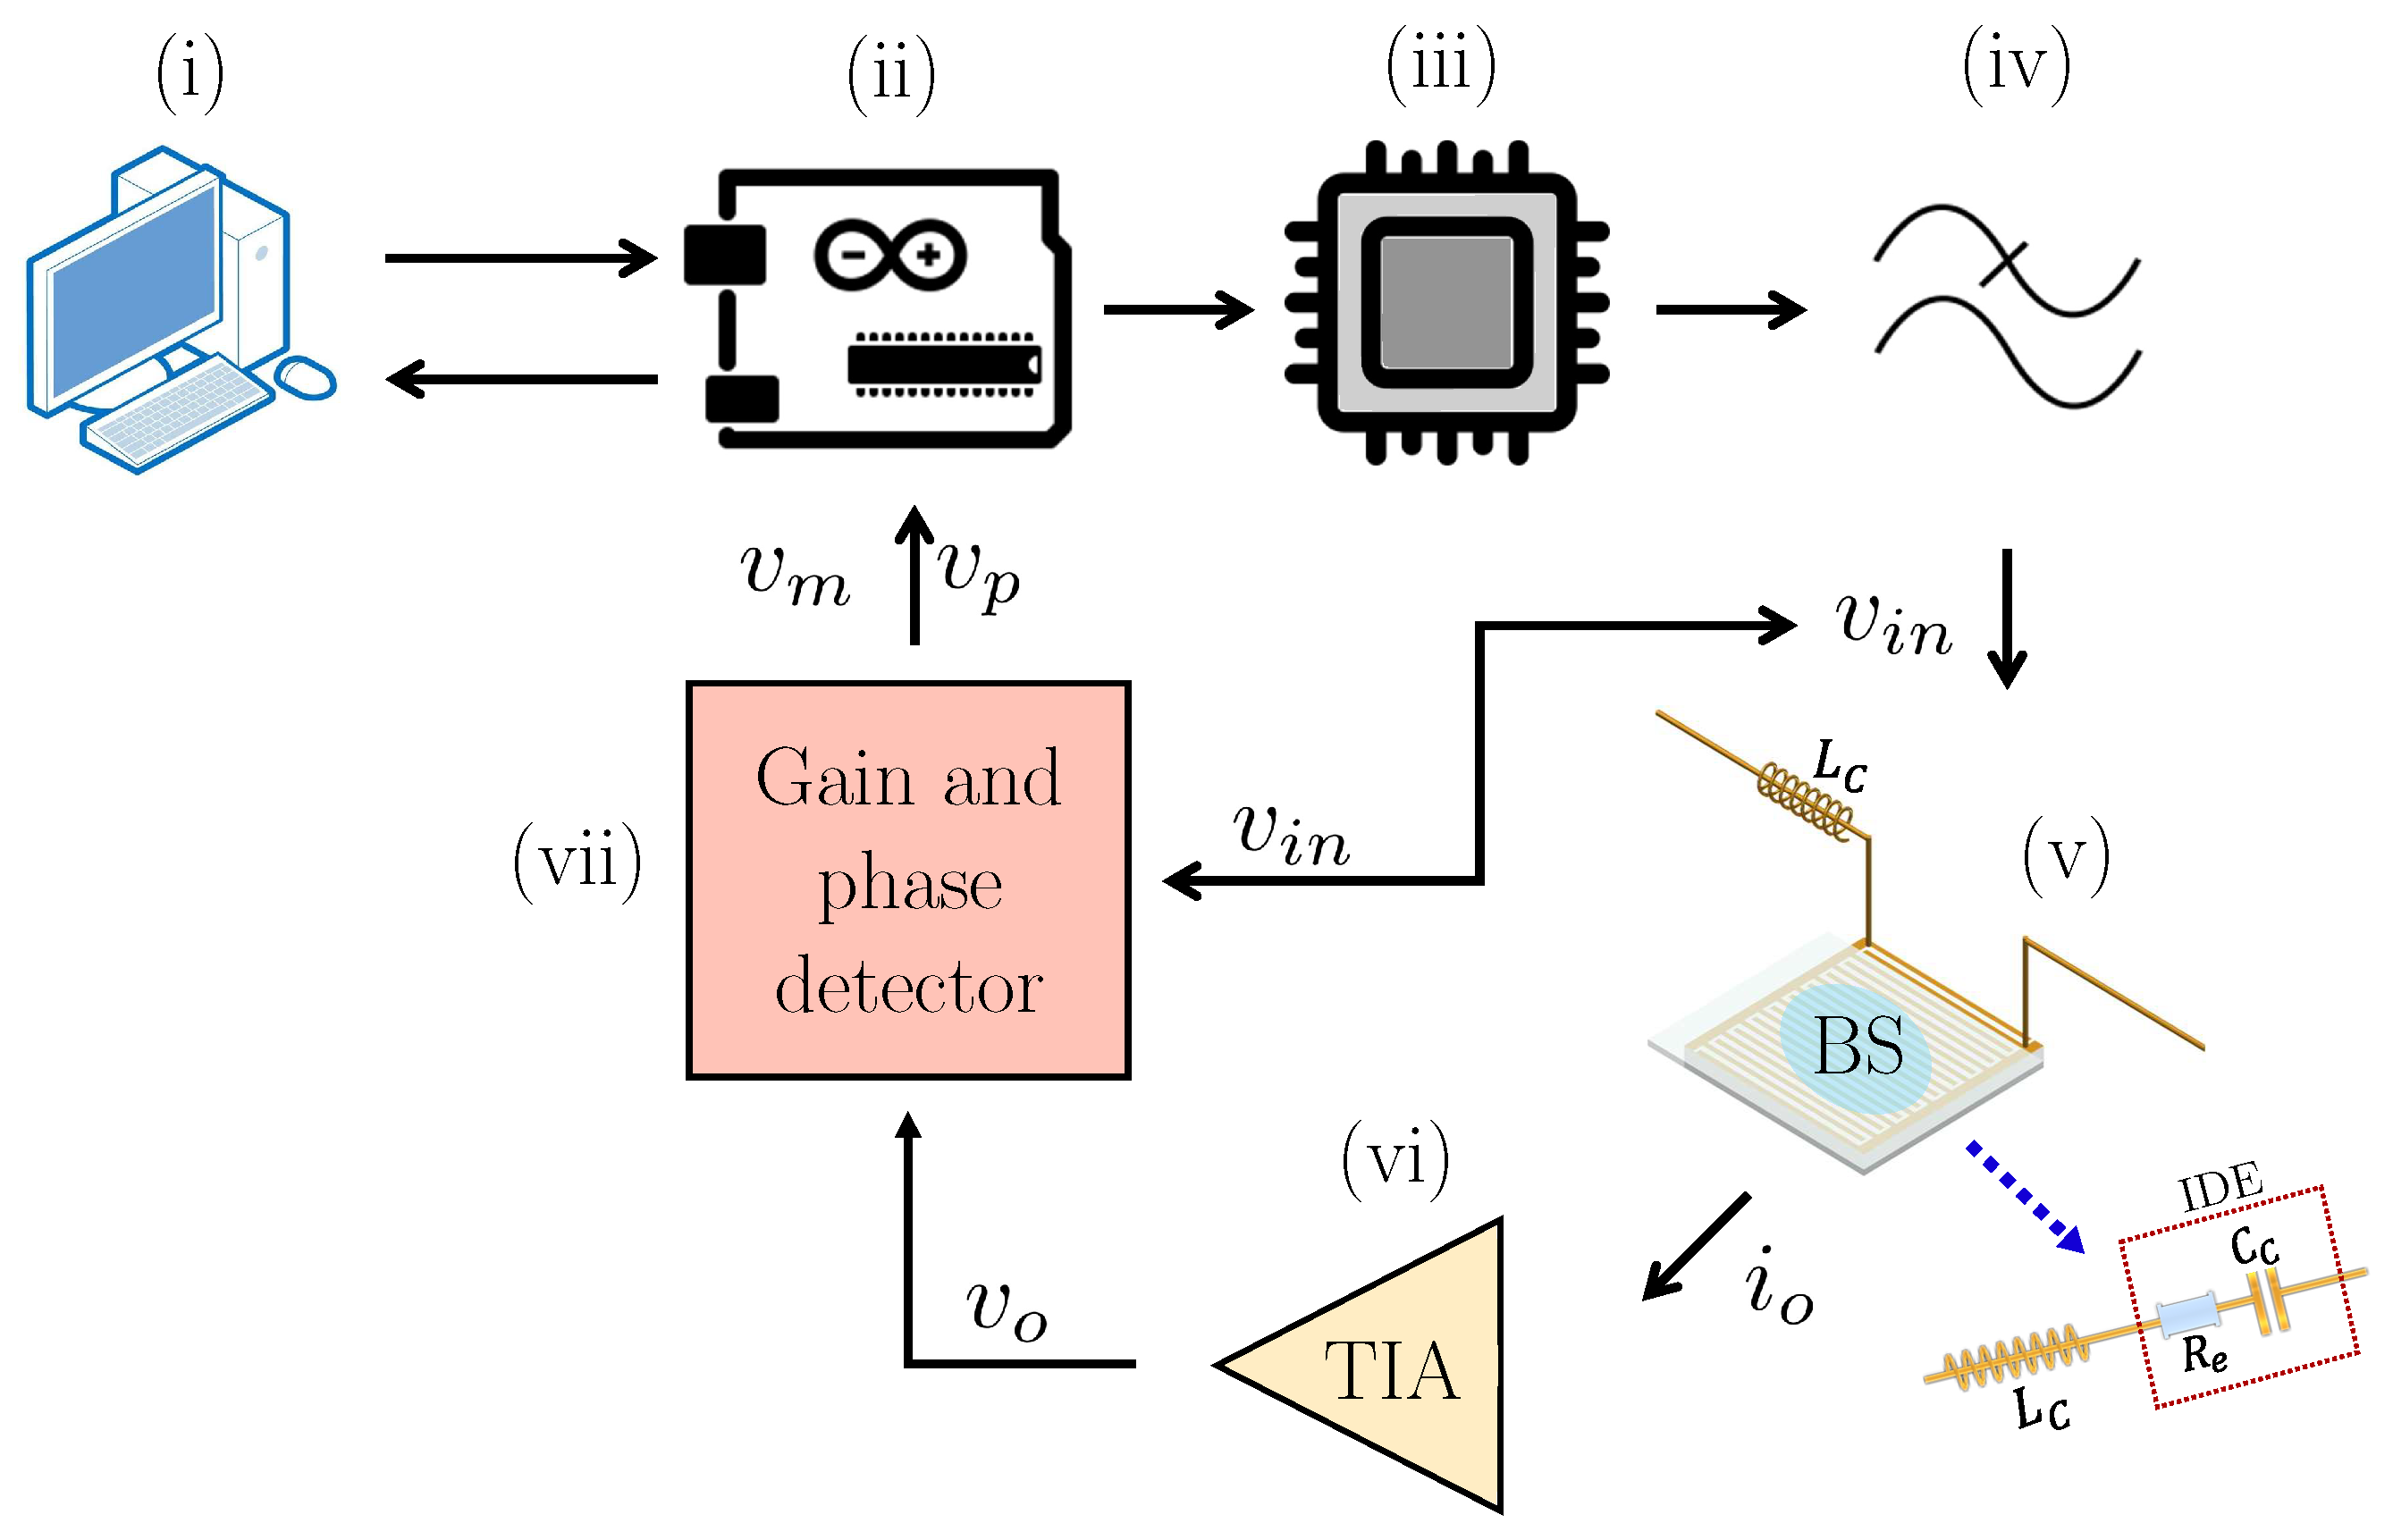
2.5. Measurement Setup

In parallel, a user-friendly and low-cost measurement platform was developed to be coupled with the Re C 4 D unit. This platform consists of seven elements: (i) a personal computer (PC), (ii) an Arduino board, (iii) an AD9834 function generator, (iv) an active low-pass filter, (v) an ReC4D sensor, (vi) a transimpedance amplifier (TIA), and (vii) a gain and phase detector. Figure 2 illustrates a block diagram of the experimental setup.
Firstly, a PC runs custom software to control the measurement platform and monitor real-time results. For this purpose, the PC communicates with an Arduino board for data streaming. The Arduino board controls an AD9834 function generator to generate sinusoidal signals with a maximum frequency of 37.5 MHz and an amplitude of 470 mV pp over a DC offset of 235 mV. Afterward, the offset is removed using an active low-pass filter, which also amplifies the signal to have a final amplitude of v i n = 5 V. This voltage v i n is applied to the Re C 4 D unit, thus establishing a current, i o , that is proportional to the BS conductivity. Hence, the resultant current is measured using a transimpedance amplifier (TIA) to retrieve an output voltage v o , such that i o v o . As a result, the excitation v i n and measured v o voltages enter a gain and phase detector circuit, which computes the magnitude ratio and phase difference between v i n and v o [43]. These relationships are given by the variables v m and ϕ , related to the magnitude and phase, respectively. Finally, these values are sent to the Arduino, which is in charge of data pre-processing and sending the results to the PC.

3. Results

3.1. Measurement Platform Validation

As a first experiment, we conducted a test to validate the performance of the measurement platform under controlled conditions. Two essential conditions were assumed: (i) the Re C 4 D unit operated in resonance mode, and (ii) a hypothetical current measurement range between 5 μ A and 10 μ A was defined to emulate previous C 4 D experiments [32]. We used five commercial resistors with values of R c = {0.5, 0.6, 0.7, 0.8, 0.9, 1} M Ω to cover the current range. Experimentally, for each resistance, R c , five measurements of the output voltage v o were carried out using a TIA feedback resistance of R f = 500 k Ω , and then averaged. Then, the associated current i o was computed using Ohm’s law: i o = v o / R f . The theoretical current values, i t , were also calculated given the input voltage and the nominal resistance values. Hence, the validation test was quantitatively performed using the percentage error (%E) as the comparison metric. Table 1 summarizes the results obtained for the validation experiment. Therein, it is worth noting that the percentage error was less than 6%, confirming the measurement setup’s accuracy for quantifying electrical resistance using affordable instrumentation.
Additionally, we obtained a relationship between the measured current and the values of R c , as shown in Figure 3. The graph displays the solid points representing the averaged measurements from five experiments and the linear fit model, depicted by a solid line. As expected, the current decreases as the value of R c increases, following a linear trend defined by a correlation coefficient ( R 2 ) of 0.941, which indicates high linearity. These results confirm the measurement system’s ability to quantify current within the range of interest.

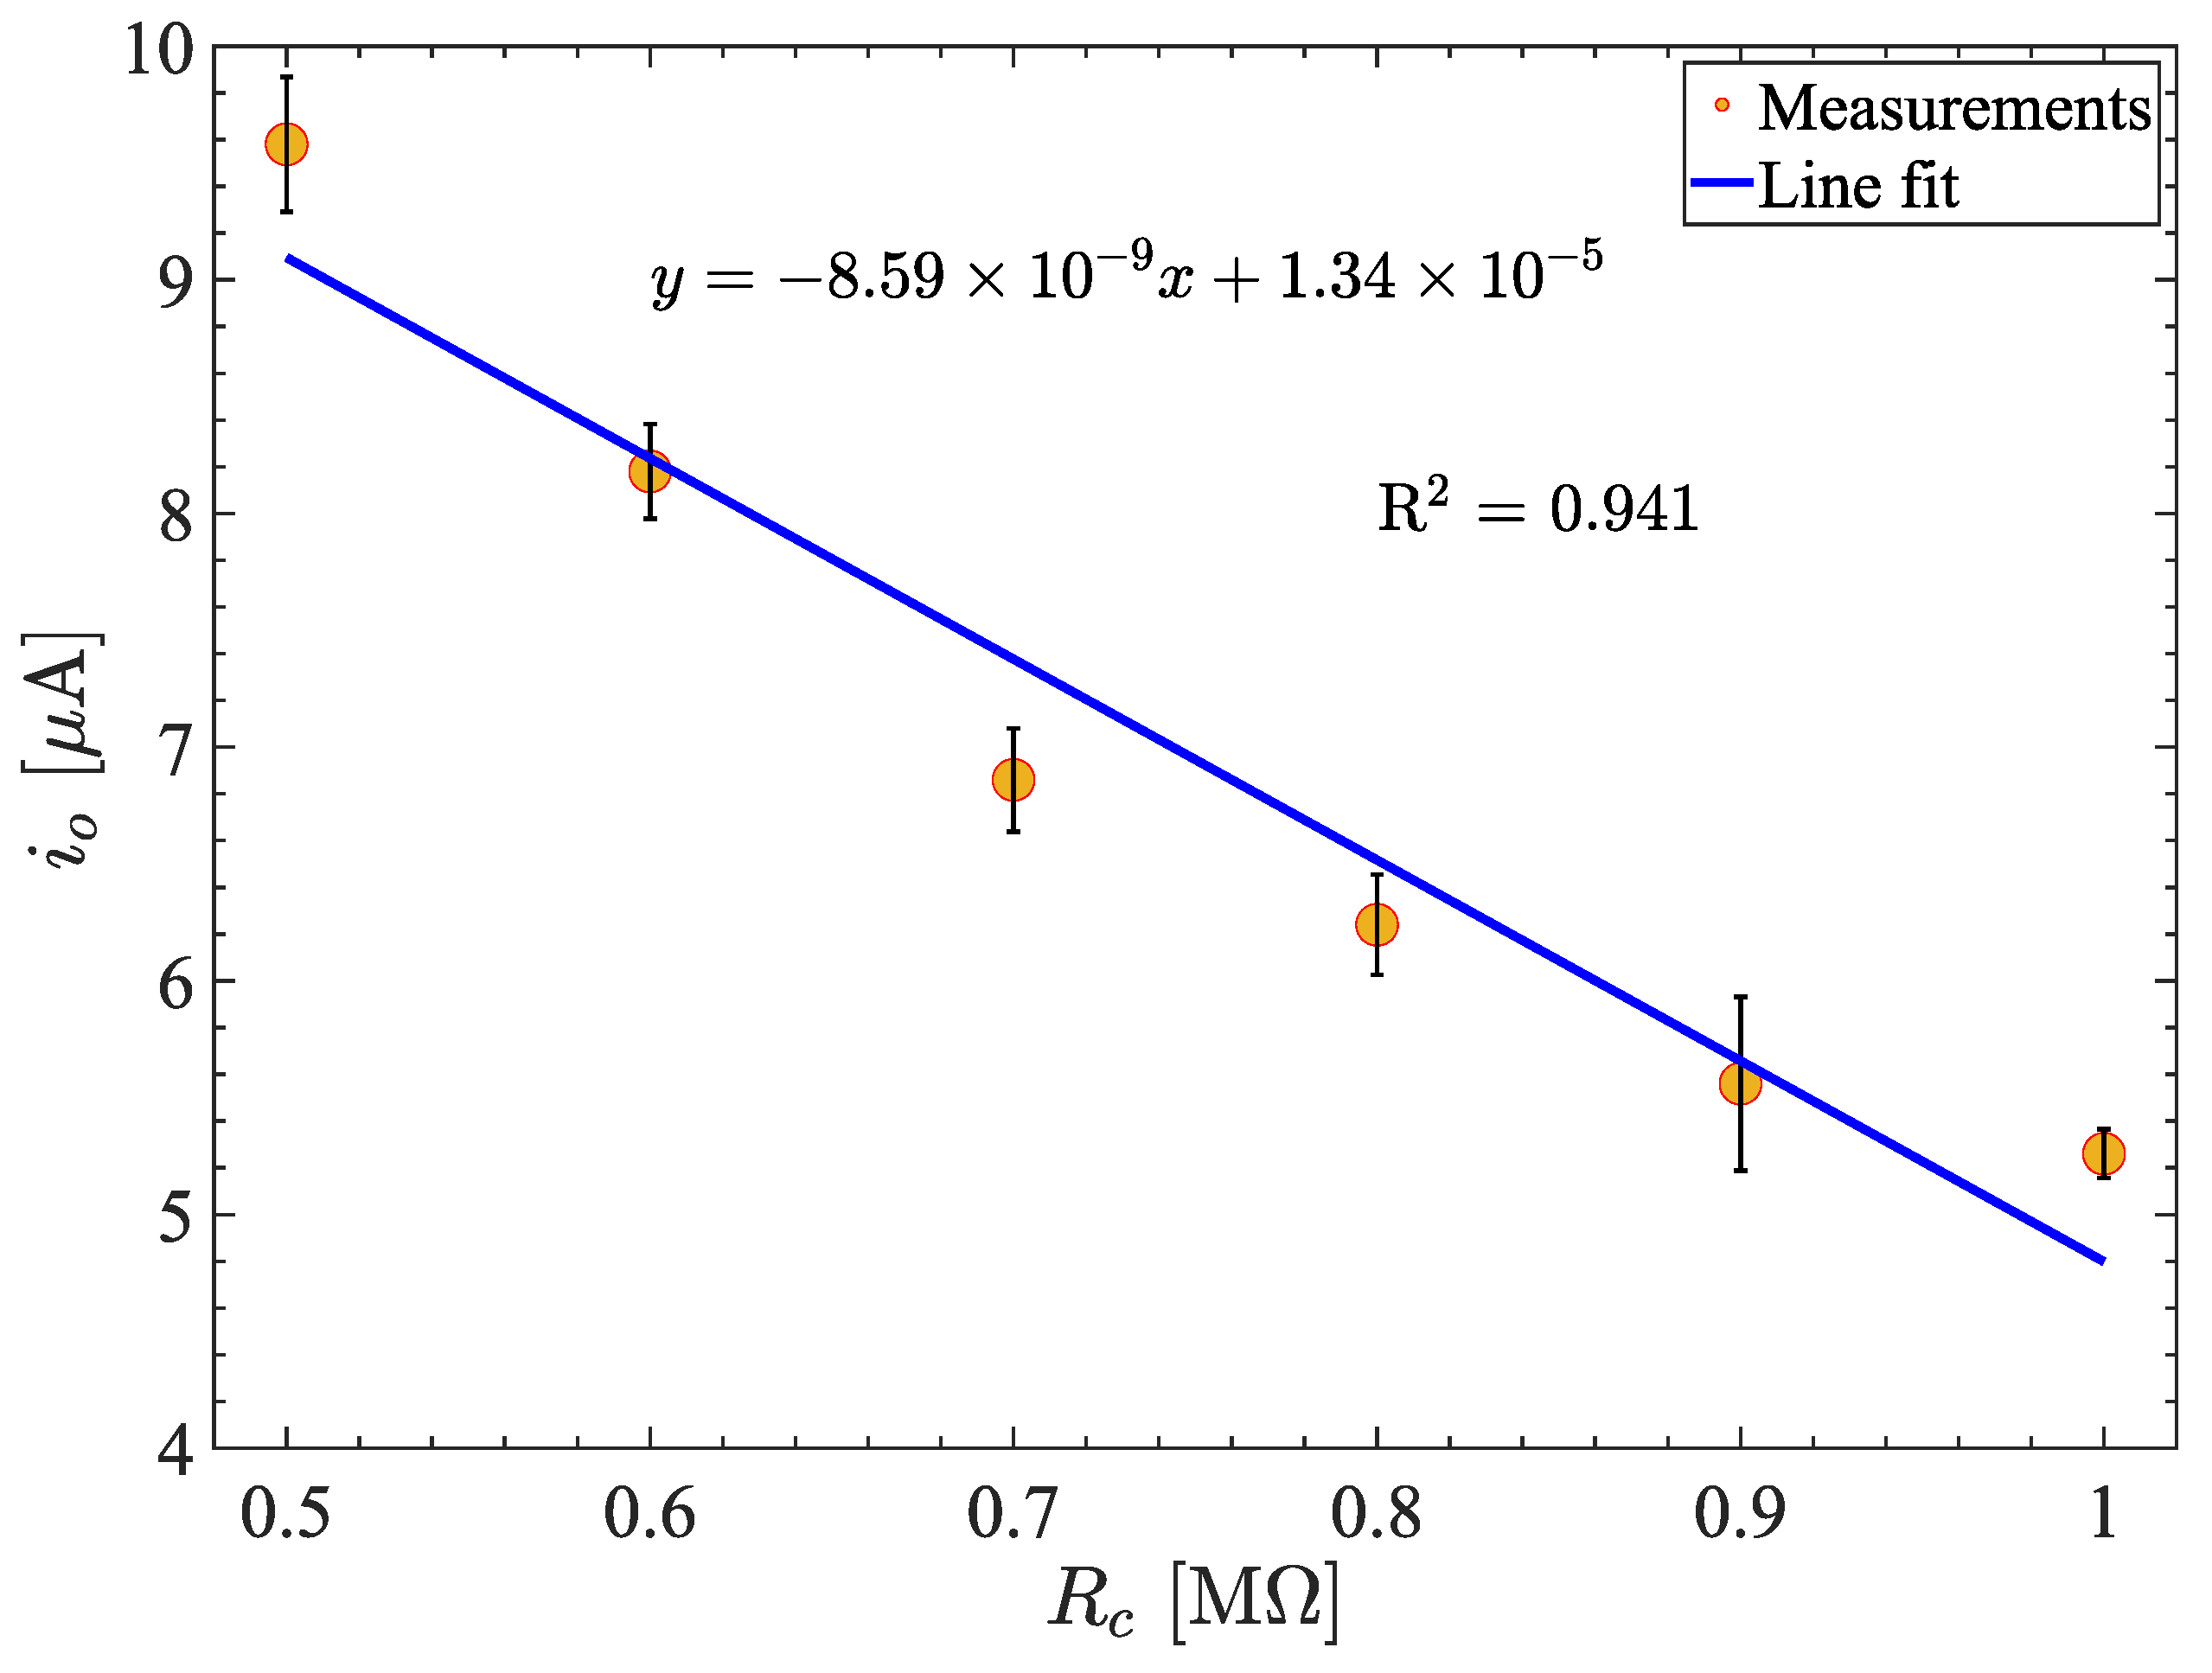
3.2. Measuring the Conductivity of KCl Concentrations

In the second experiment, we evaluated the ability of the Re C 4 D unit to detect conductivity changes in potassium chloride (KCl) solutions with concentrations of 0 M, 0.1 M, 0.2 M, 0.3 M, 0.4 M, and 0.5 M. Experimentally, we deposited a 20 μ L drop of solution onto the Re C 4 D unit, as illustrated in Figure 4a. In this experiment, we expected that the different concentrations of KCl would modify the resistance and reactance values of the equivalent circuit, as shown in Figure 4b, due to changes in the effective conductivity and permittivity. To evaluate the behavior of the Re C 4 D unit with different KCl concentrations, voltage amplitude ( v m ), and phase ( ϕ ) values were obtained over a frequency range from 1.9 MHz to 2.4 MHz, as shown in the diagrams in Figure 5. It is worth noting that this experiment was repeated five times and averaged for each KCl concentration value.
Figure 5a shows the frequency response curves for the magnitude of the voltage, v m , for the different KCl concentrations. There, the voltage amplitude increases with the concentration of KCl. The amplitude value is related to the conductivity of the electrolyte, allowing us to establish a relationship between amplitude and concentration. Interestingly, it is also observed that the resonance frequency shifts from right to left as a function of KCl concentration, which can be attributed to changes in effective conductivity and permittivity [44]. This frequency shift, f r , is calculated as f r = f 0 f i , where f 0 is the resonance frequency of the blank and f i is the resonance frequency obtained with the different concentrations. On the other hand, Figure 5b also shows the behavior of the phase, ϕ , as a function of frequency for the different KCl concentrations, where it can be noted that phase values are more pronounced near the resonance frequency of 2.2 MHz.
Based on the results, we established three calibration curves to quantify the KCl concentration as a function of voltage, resonance frequency, and phase, as shown in the graphs in Figure 6. Figure 6a shows the relationship between voltage v m and KCl concentration, Figure 6b shows the relationship between f r and KCl concentration, and finally Figure 6c presents the calibration curve for quantifying the KCl concentration using ϕ . All three calibration curves show the experimental data (dots) and the best-fitted model (solid line). For the three parameters, it is possible to confirm that the sensor exhibits a highly linear response, given by a determination coefficient greater than 85%. v m and f r increase proportionally to the molar concentration, whereas the relationship is inverse for ϕ . Quantitatively, Table 2 summarizes the retrieved sensitivity for each Re C 4 D unit parameter, indicating that f r and ϕ offer the best results for quantifying the conductivity of KCl-based electrolytes. Nonetheless, it is worth mentioning that the application of the Re C 4 D unit can be extended to measure the electrical conductivity of any electrolyte.

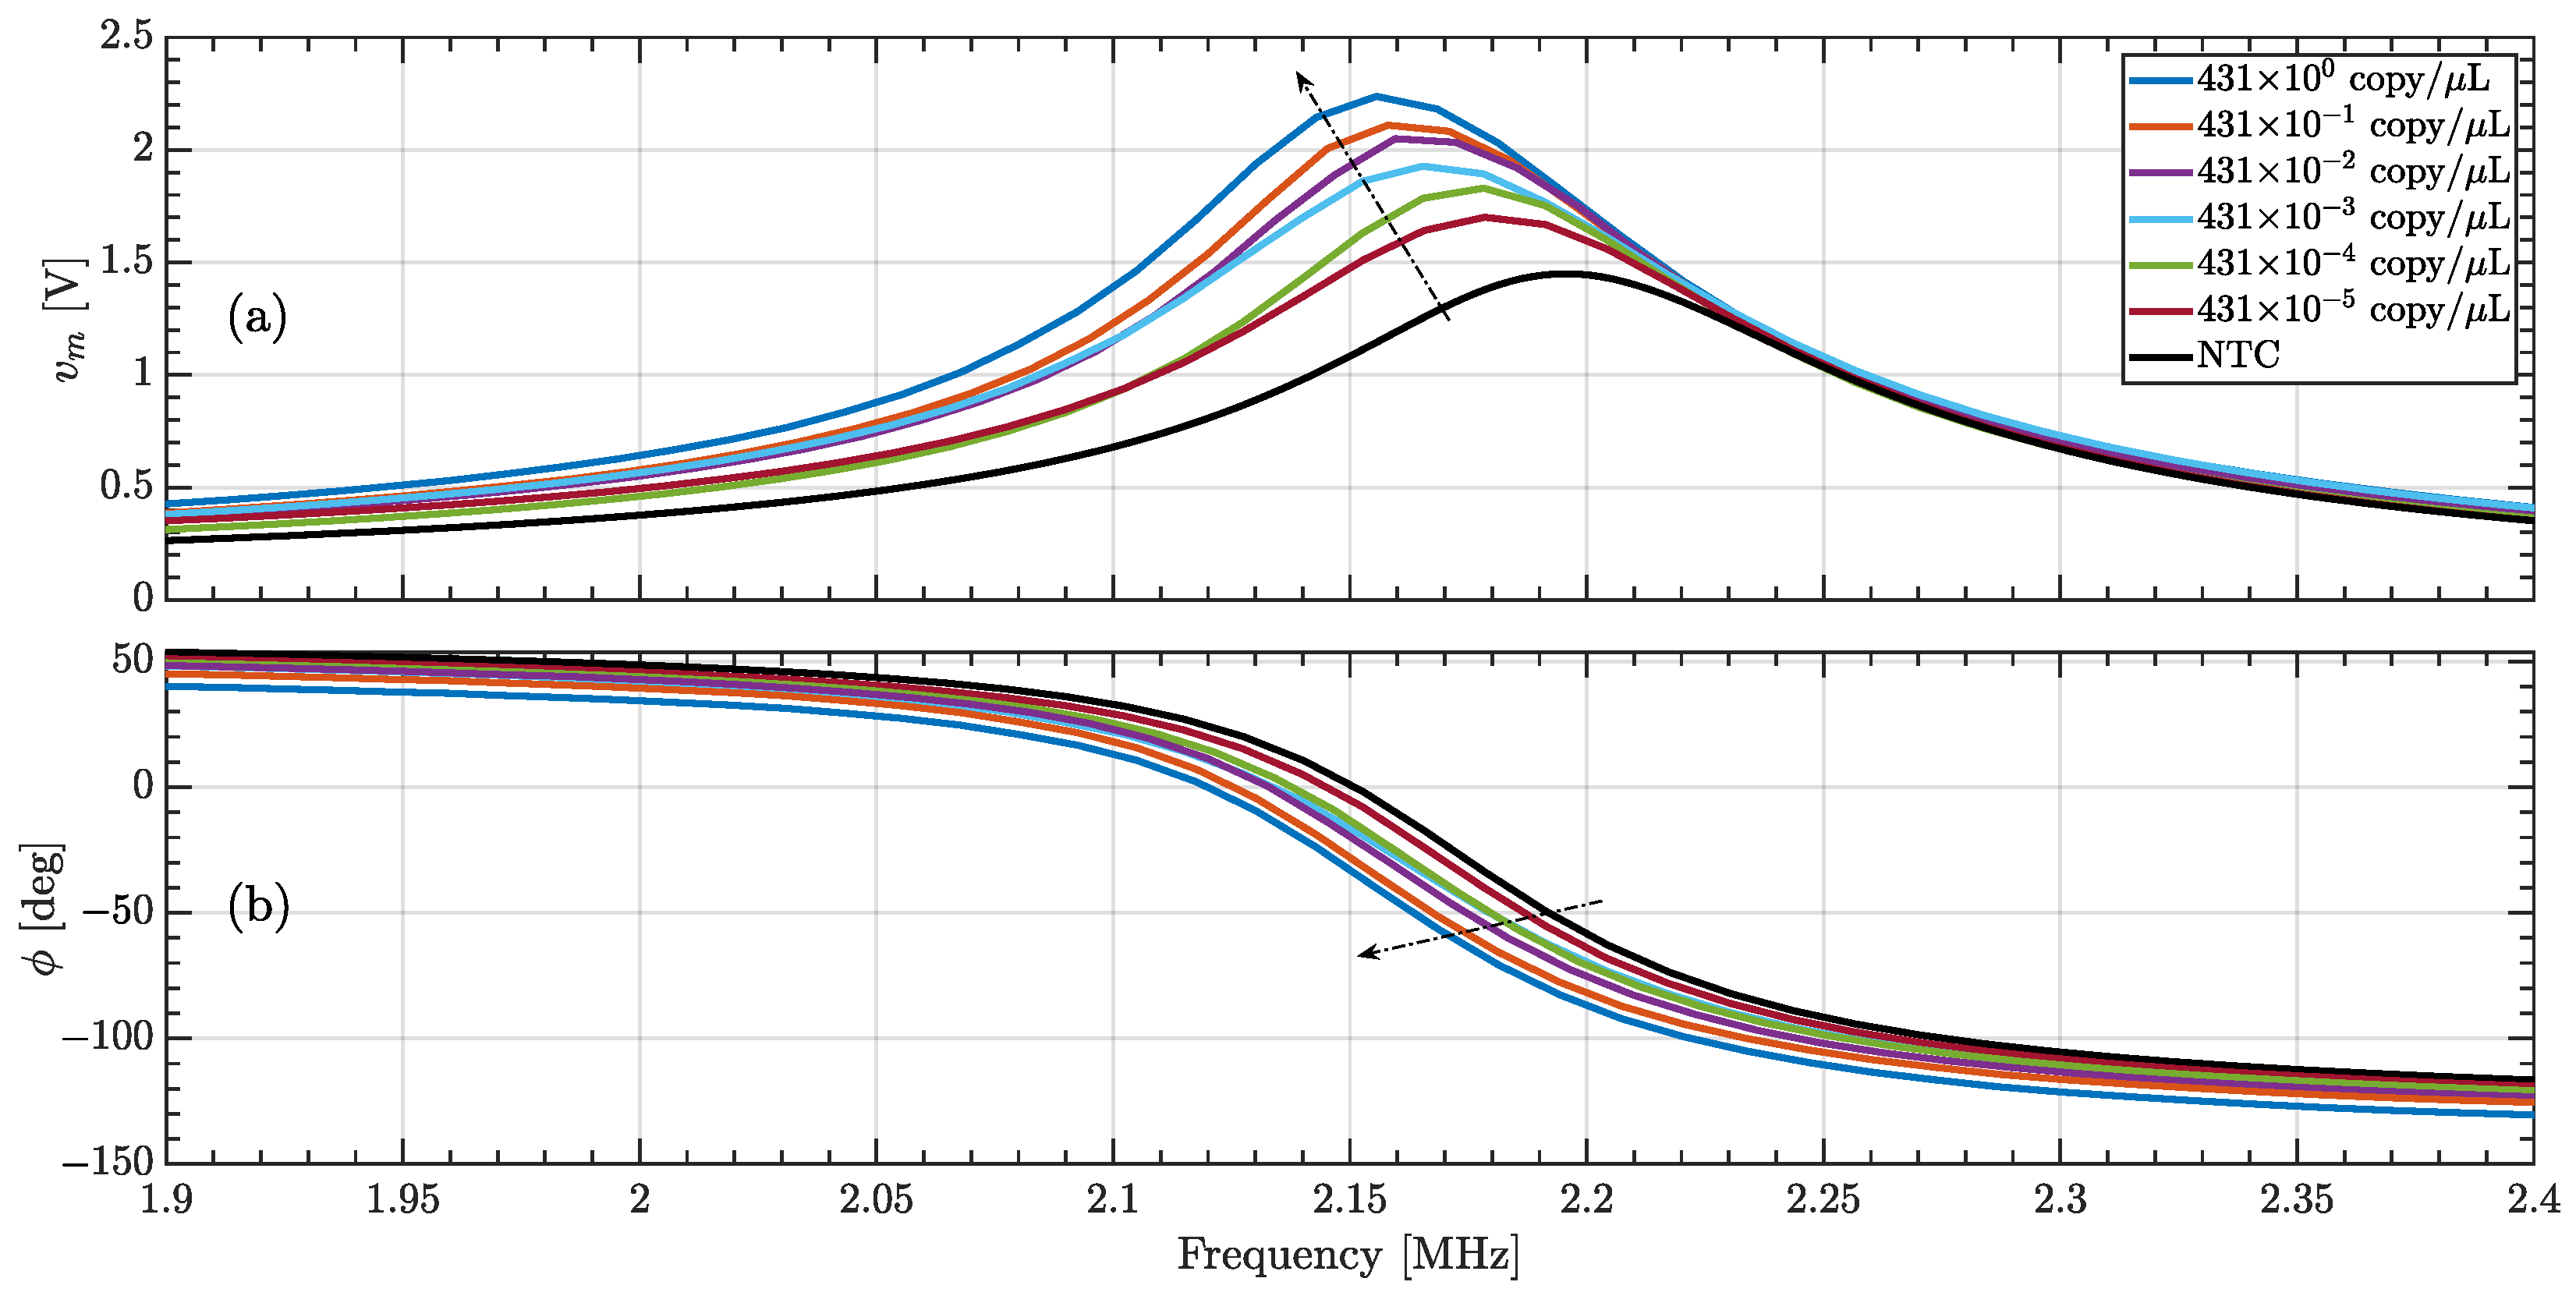
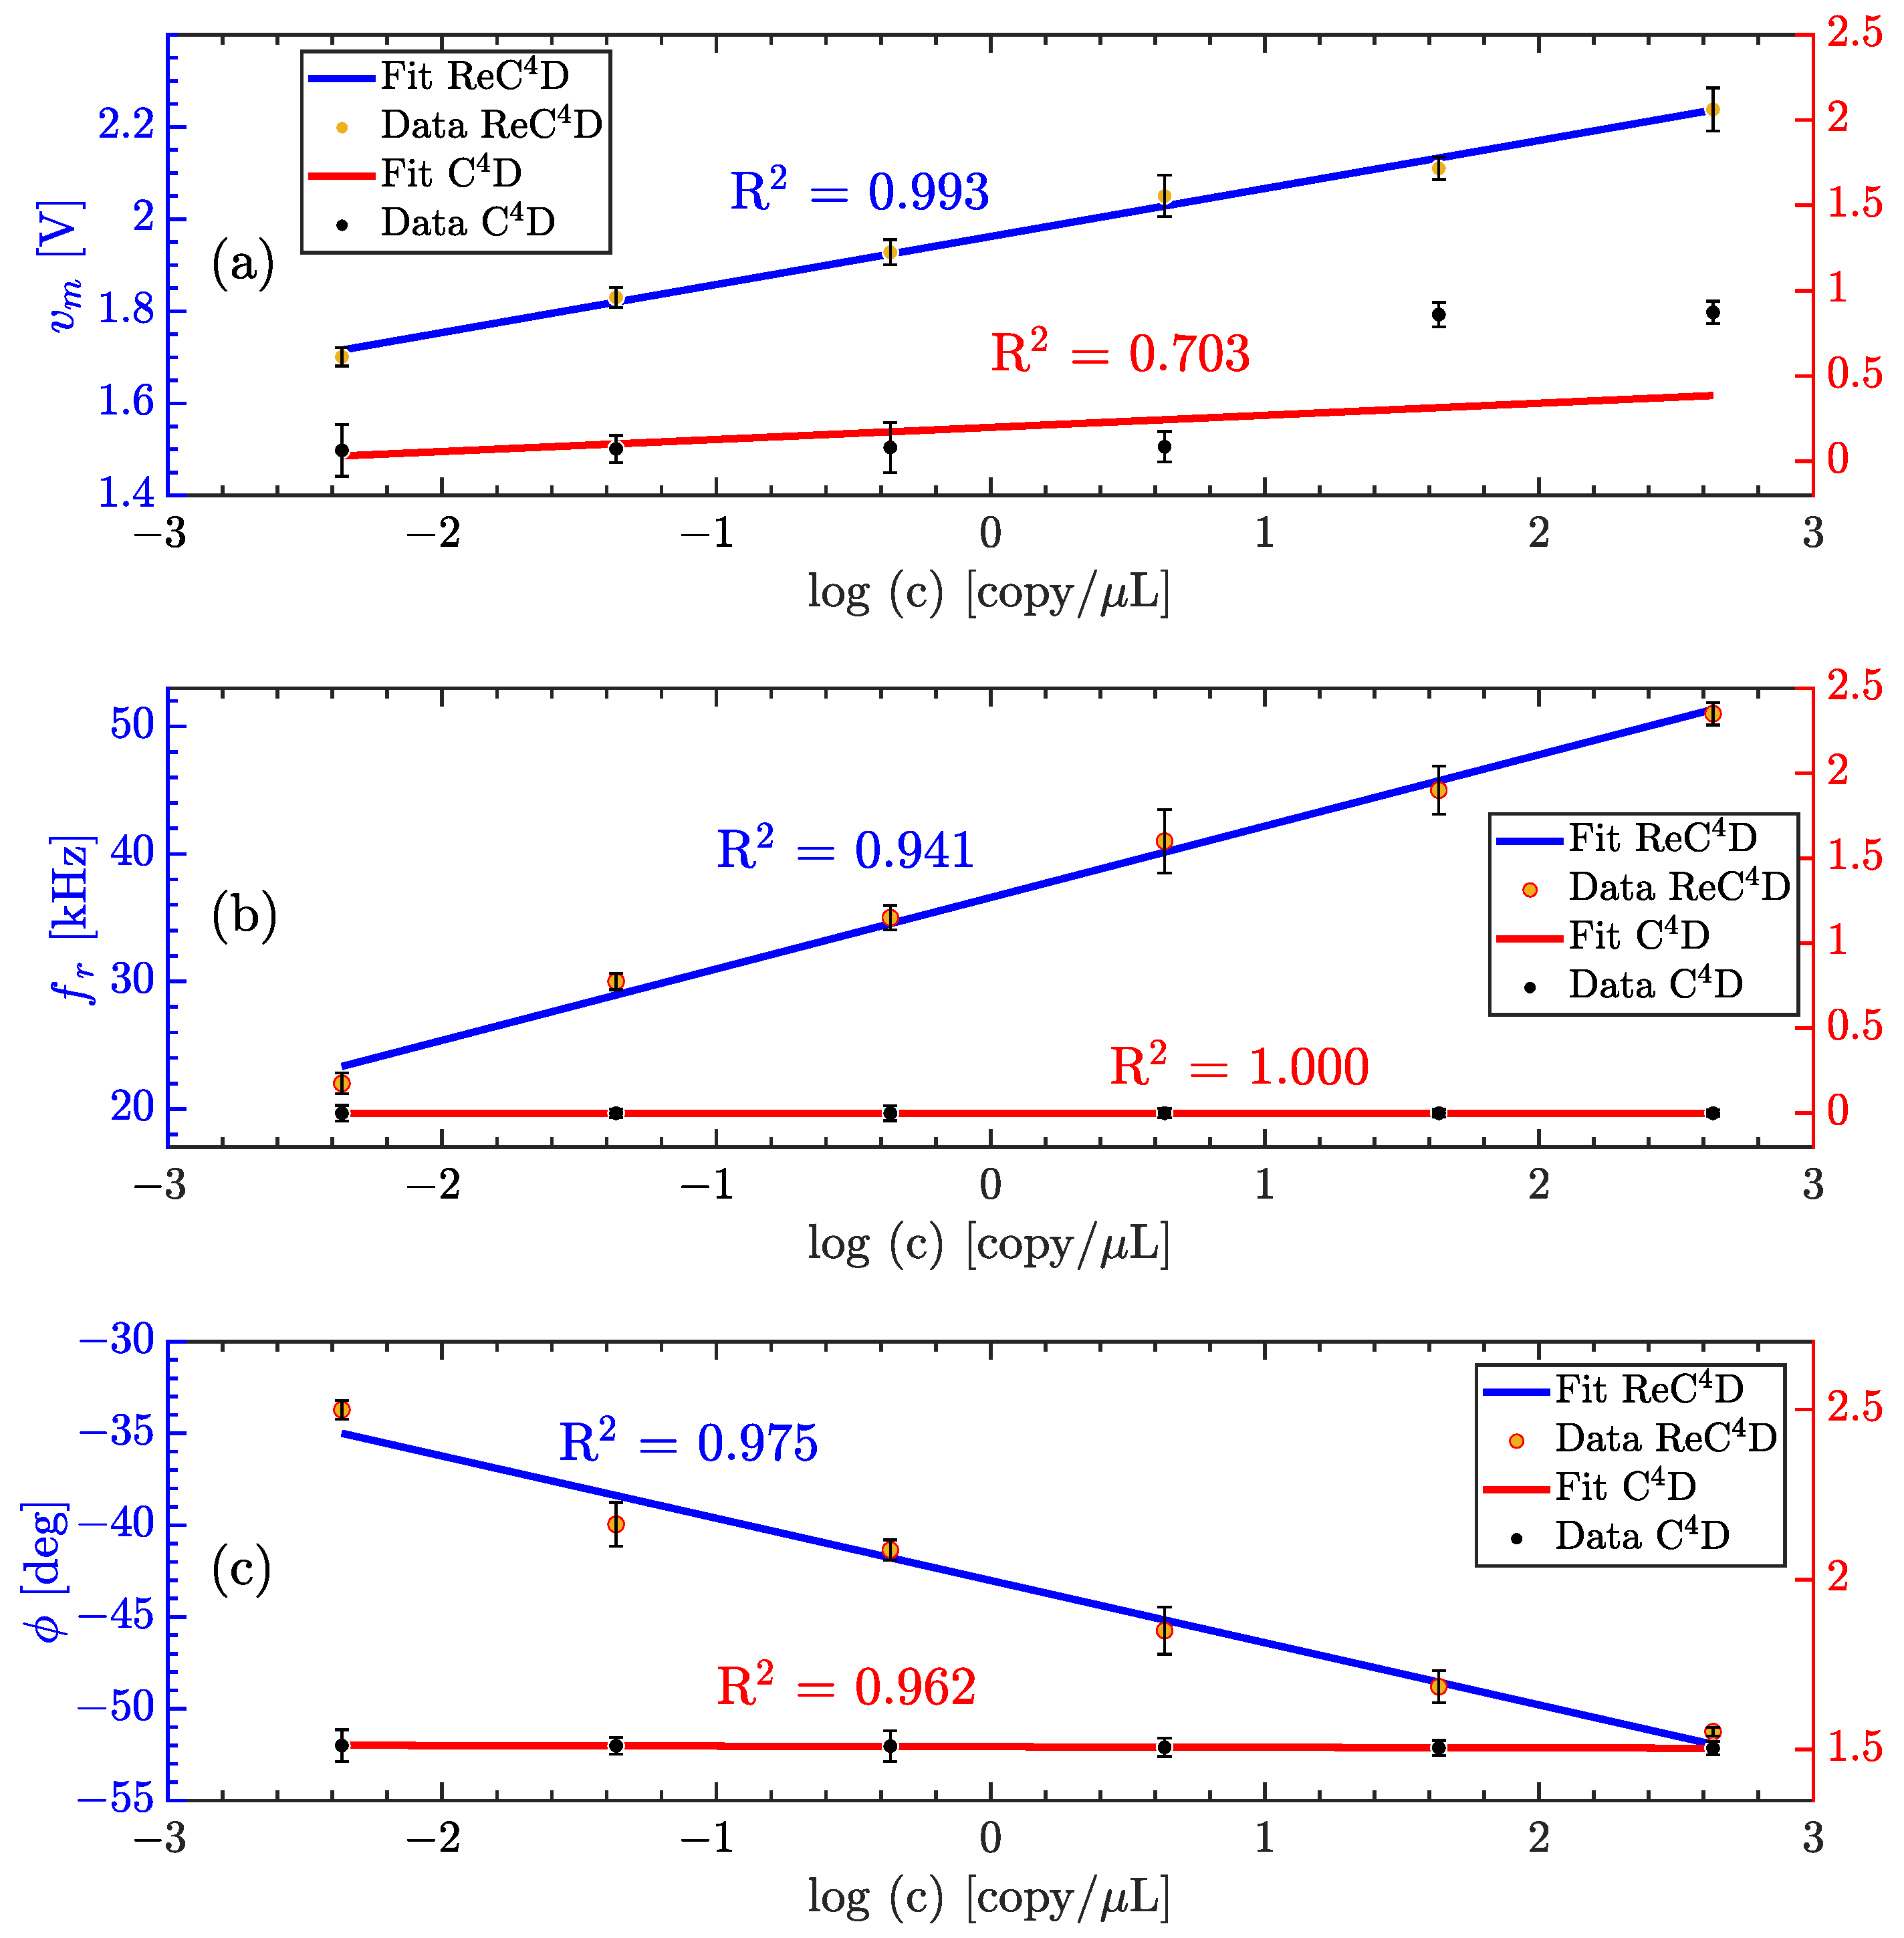
3.3. Quantifying Nucleic Acid Amplification

As the final experiment, the ability of the Re C 4 D unit to quantify the products of an NAA for the genetic material of the SARS-CoV-2 virus using an RT-LAMP reaction was tested. Based on the results from the previous section and those presented in Section 2.2, we aimed to detect changes in the conductivity of the NAA solution through the v m , f r , and ϕ measurements as a function of nucleic acid concentration (c). For this, we characterized the Re C 4 D unit with six concentrations of SARS-CoV-2 genetic material, c = {431 × 10 5 , 431 × 10 4 , 431 × 10 3 , 431 × 10 2 , 431 × 10 1 , 431 × 10 0 } copy μ L , and a negative template control (NTC) sample as a reference. Furthermore, we conducted measurements with the unit without the inductor to compare the performance of the Re C 4 D unit with conventional C 4 D detection. We used 20 μ L of solution for each measurement and performed a frequency sweep from 1.9 MHz to 2.4 MHz, recording 1000 points for each measurement. We made all measurements in triplicate and averaged them.
From Figure 7a, the voltage v m frequency response as a function of nucleic acid concentration (c) can be observed. As expected, changes in the v m value and f r are related to the sample’s conductivity. The v m value increases as c increases, while f r shifts from right to left as the concentration rises. On the other hand, Figure 7b illustrates the phase, ϕ , shift as a function of frequency for the different c values and the NTC sample. Therein, there is also a shift in the phase due to the change in the resonance frequency of the Re C 4 D unit. Therefore, these results confirm that the Re C 4 D unit can quantify the concentration of NAA products using the v m , f r , and ϕ parameters. Additionally, to analyze the performance of the Re C 4 D unit and compare it with that of a conventional C 4 D unit, we obtained the frequency response of v m and ϕ as a function of c, as shown in Section S3 of the Supplementary Material. These results demonstrate that the Re C 4 D unit is characterized by three parameters: v m , f r , and ϕ . In contrast, the conventional C 4 D has only two parameters, v m and ϕ , as there is no electrical resonance. This finding allows us to establish a clear advantage of the Re C 4 D unit over conventional C 4 D assays. However, to thoroughly evaluate the performance of the Re C 4 D unit, we plotted calibration curves for v m , f r , and ϕ as a function of c on a logarithmic scale, as shown in Figure 8. With these calibration curves, we compared the sensitivity and limit of detection (LoD) of the Re C 4 D unit to that of a conventional C 4 D unit.
The experimental data are represented as points; in yellow for Re C 4 D and black for C 4 D. Meanwhile, the solid lines represent the fitting model; in blue for Re C 4 D and red for C 4 D. Finally, the relative standard deviation for the five measurements is represented by vertical bars. In Figure 8a, the directly proportional relationship between v m and the concentration for Re C 4 D and C 4 D is shown, with a determination coefficient ( R 2 ) of 0.993 for Re C 4 D and 0.703 for C 4 D. This result highlights the limitations of C 4 D due to the two highest concentrations exhibiting saturation behavior, which limits the linear detection range. On the other hand, Figure 8b shows the relationship between f r and c on a logarithmic scale with an R 2 of 99%. It is worth mentioning that C 4 D exhibits a constant value for the calibration curve for f r , as there is no electrical resonance. Finally, Figure 8c illustrates the calibration curve for ϕ , which presents an inversely proportional relationship with a linearity close to 98% for Re C 4 D and approximately 97% for C 4 D. The sensitivity and the LoD for each calibration curve are summarized in Table 3 to assess the performance of the Re C 4 D unit and compare it with the C 4 D unit.
The results presented in Table 3 show the performance of the Re C 4 D unit and the C 4 D unit in detecting and quantifying the amplification of SARS-CoV-2 genetic material using different detection parameters within a measurement range of 431 × 10 5 to 431 × 10 0 copy/ μ L. Interestingly, one can notice that the Re C 4 D unit demonstrates a better sensitivity and detection limit compared to the C 4 D unit, especially in f r . These results make sense, as the Re C 4 D unit, by generating electrical resonance, eliminates the stray capacitances of the conventional C 4 D, thereby increasing sensitivity, improving the LoD, and expanding the linear operational range. Additionally, the LoD for the f r is of the same order of magnitude as in similar works [45].
Based on these results, it is essential to emphasize that the proposed Re C 4 D unit is homemade and low-cost compared to commercial analytical instruments where electrical conductivity is the target. For NAA testing, the Re C 4 D unit demonstrated performance comparable to previous studies and commercial fluorometers, as the concentration ranges and detection limit values are similar in magnitude [46]. Moreover, it is worth noting that the Re C 4 D unit does not require markers or labels in biological samples as in conventional devices [47,48]. This characteristic allows its application both for the detection of nucleic acids and for other types of biochemical species since the signal obtained is a function of the substance and the ionic concentration. Therefore, to the best of our knowledge, the versatility of the proposed technique and the modifications introduced concerning the state of the art constitute an innovative sensing platform. However, the practical applicability of the Re C 4 D unit is currently limited to experiments with controlled conditions to avoid cross-contamination of samples. Performing NAA assays outside of a laboratory is crucial to minimize potential sources of sample contamination. For this purpose, an attractive alternative would be to integrate the Re C 4 D unit into fully enclosed environments, such as microfluidic platforms, or to place the sample in sealed containers to prevent cross-contamination from external factors [39,49].

3.4. Performance Comparison with State-of-the-Art Detection Platforms for NAA Products to Detect SARS-CoV-2

The results indicate that the Re C 4 D unit can detect and quantify the products of an RT-LAMP reaction for the ORF1ab and N genes of SARS-CoV-2 under controlled experimental conditions. Our main contribution is offering a new technology for monitoring genetic amplification reactions without contact, with performance similar to other previously reported works. Therefore, it is crucial to compare the performance of our unit with other studies to identify advantages, disadvantages, and future opportunities. Table 4 shows some studies for detecting the SARS-CoV-2 virus using NAA methods and quantifying the products or amplicons. The table includes the detection technology, sample type, NAA method, target, and LoD, as well as some advantages and disadvantages. Some studies do not report detection limits as they are qualitative tests.
In an extensive review of state-of-the-art devices or platforms for detecting NAA products for SARS-CoV-2, the PCR is the gold standard for diagnosis due to its reliability and accuracy; however, it is a technique that limits rapid detection and accessibility in resource-limited environments. Furthermore, PCR amplicon detection assays typically require sophisticated equipment and sample pre-treatment. Therefore, the table presents alternatives both in terms of amplification methods and detection platforms. The main objective is to show that the proposed unit has a comparable detection limit performance to other reported works. Additionally, our unit stands out because it does not require electrodes modified with complex materials or bioreceptors, nor modifications in the RT-LAMP mixture solution. It is important to note that our sensing platform does not try to replace conventional techniques or platforms, as they do not share the same transduction principle. However, it is an attractive alternative for designing accessible, simple, and functional detection platforms.
Finally, based on the advantages and disadvantages of these types of NAA product detection platforms, it is clear that there is a need to expand systems to incorporate simple, one-step amplification methods combined with embedded genetic material extraction methods to develop new portable detection devices or platforms for field measurements or point-of-care testing.

4. Conclusions

We developed an Re C 4 D unit based on capacitively coupled contactless conductivity detection to monitor an NAA process. Unlike other conventional conductivity measurement techniques, this platform avoids electrochemical erosion or polarization at the transduction stage due to the electrical isolation of the sensor electrodes. This design allows for the reuse of the electrodes and the recovery of the biological sample. The non-invasive and portable design, based on electronic modules, allows for affordable signal generation, conditioning, and digitization, facilitating its coupling with NAA procedures to offer accurate quantitative analysis. The most notable innovation is the inclusion of an inductor to promote electrical resonance, which minimizes the stray capacitances of a conventional C 4 D unit and enhances the sensitivity, detection limit, and linear operating range for measuring ionic concentration. The Re C 4 D unit was tested in three experiments, showing an error of less than 6% for the validation case and a high linear response for measuring KCl concentrations. Finally, we conducted an assay to quantify different concentrations of SARS-CoV-2 genetic material using the proposed unit with and without an inductor to demonstrate that the Re C 4 D unit can quantify NAA products with better performance than a conventional C 4 D unit. Additionally, the proposed unit can measure using three different parameters, with resonance frequency yielding the best results, as the limit of detection is 0.24 copy μ L and the sensitivity is 5.618 kHz log ( copy μ L ) . These results are promising and encouraging for the integration of the Re C 4 D unit into enclosed systems to prevent sample contamination from external factors and to develop new NAA assay platforms for resource-limited environments or remote areas. Lastly, the Re C 4 D unit could be coupled with different amplification methods and integrated into real-time measurements for detecting other pathogens.

Supplementary Materials

The following supporting information can be downloaded at: https://www.mdpi.com/article/10.3390/technologies13040138/s1. Figure S1: Reproducibility and repeatability study with five different interdigitated electrodes as a sensor in the unit Re C 4 D. (a) v m response. (b) f r response, and (c) ϕ response. Figure S2: Frequency response plots of the C 4 D for quantifying NNA products. (a) Magnitude-related voltage, v m , and (b) phase ϕ , according to each concentration of NAA products and a negative template control (NTC). Table S1: Approximate Re C 4 D unit manufacturing costs.

Author Contributions

Conceptualization: R.G.R.-C.; investigation: R.G.R.-C. and J.A.U.-M.; methodology: R.G.R.-C., J.A.U.-M., B.E.A.-S. and R.F.P.-M.; resources: R.G.R.-C.; validation: R.G.R.-C., J.A.U.-M., and R.F.P.-M.; software: J.A.U.-M. and R.F.P.-M.; writing—original draft: R.G.R.-C., J.A.U.-M., B.E.A.-S. and R.F.P.-M.; writing—review and editing: R.G.R.-C., J.A.U.-M., B.E.A.-S. and R.F.P.-M.; funding acquisition: R.G.R.-C. All authors have read and agreed to the published version of the manuscript.

Funding

This work was supported by SECTEI-CDMX through project e-SAST number 1564c23 (SECTEI/153/2023). Also, the support of Grupos Interdisciplinarios de Investigación (GII) of the Institute of Engineering, UNAM, is acknowledged.

Institutional Review Board Statement

Not applicable.

Informed Consent Statement

Not applicable.

Data Availability Statement

The original contributions presented in this study are included in the article/Supplementary Materials. Further inquiries can be directed to the corresponding author.

Acknowledgments

B.E.A.S (CVU 1004078) acknowledges SECIHTI for the PhD studies grant.

Conflicts of Interest

The authors declare no conflicts of interest.

References

  1. Shen, C.H. (Ed.) Chapter 9—Amplification of Nucleic Acids. In Diagnostic Molecular Biology; Academic Press: New York, NY, USA, 2019; pp. 215–247. [Google Scholar] [CrossRef]
  2. Fakruddin, M.; Mannan, K.S.B.; Chowdhury, A.; Mazumdar, R.M.; Hossain, M.N.; Islam, S.; Chowdhury, M.A. Nucleic Acid Amplification: Alternative Methods of Polymerase Chain Reaction. J. Pharm. Bioallied Sci. 2013, 5, 245–252. [Google Scholar] [CrossRef] [PubMed]
  3. Wei, Z.; Wang, X.; Feng, H.; Ji, F.; Bai, D.; Dong, X.; Huang, W. Isothermal Nucleic Acid Amplification Technology for Rapid Detection of Virus. Crit. Rev. Biotechnol. 2023, 43, 415–432. [Google Scholar] [CrossRef] [PubMed]
  4. Kubista, M.; Andrade, J.M.; Bengtsson, M.; Forootan, A.; Jonák, J.; Lind, K.; Sindelka, R.; Sjöback, R.; Sjögreen, B.; Strömbom, L.; et al. The real-time polymerase chain reaction. Mol. Asp. Med. 2006, 27, 95–125. [Google Scholar] [CrossRef]
  5. Moon, Y.J.; Lee, S.Y.; Oh, S.W. A Review of Isothermal Amplification Methods and Food-Origin Inhibitors against Detecting Food-Borne Pathogens. Foods 2022, 11, 322. [Google Scholar] [CrossRef] [PubMed]
  6. Huang, W.E.; Lim, B.; Hsu, C.C.; Xiong, D.; Wu, W.; Yu, Y.; Jia, H.; Wang, Y.; Zeng, Y.; Ji, M.; et al. RT-LAMP for Rapid Diagnosis of Coronavirus SARS-CoV-2. Microb. Biotechnol. 2020, 13, 950–961. [Google Scholar] [CrossRef] [PubMed]
  7. Zhou, H. Nucleic Acid Amplification Strategies for Biosensing, Bioimaging, and Biomedicine. In Nucleic Acid Amplification Strategies for Biosensing, Bioimaging and Biomedicine; Zhang, S., Bi, S., Song, X., Eds.; Springer: New York, NY, USA, 2019; pp. 3–14. [Google Scholar] [CrossRef]
  8. Wang, Z.Y.; Li, P.; Cui, L.; Qiu, J.G.; Jiang, B.; Zhang, C.Y. Integration of Nanomaterials with Nucleic Acid Amplification Approaches for Biosensing. TrAC Trends Anal. Chem. 2020, 129, 115959. [Google Scholar] [CrossRef]
  9. Amoah, I.D.; Mthethwa, N.P.; Pillay, L.; Deepnarain, N.; Pillay, K.; Awolusi, O.O.; Kumari, S.; Bux, F. RT-LAMP: A Cheaper, Simpler and Faster Alternative for the Detection of SARS-CoV-2 in Wastewater. Food Environ. Virol. 2021, 13, 447–456. [Google Scholar] [CrossRef]
  10. Mujawar, M.A.; Gohel, H.; Bhardwaj, S.K.; Srinivasan, S.; Hickman, N.; Kaushik, A. Nano-Enabled Biosensing Systems for Intelligent Healthcare: Towards COVID-19 Management. Mater. Today Chem. 2020, 17, 100306. [Google Scholar] [CrossRef]
  11. Pilevar, M.; Kim, K.T.; Lee, W.H. Recent Advances in Biosensors for Detecting Viruses in Water and Wastewater. J. Hazard. Mater. 2021, 410, 124656. [Google Scholar] [CrossRef]
  12. Moon, J.; Kwon, H.J.; Yong, D.; Lee, I.C.; Kim, H.; Kang, H.; Lim, E.K.; Lee, K.S.; Jung, J.; Park, H.G.; et al. Colorimetric Detection of SARS-CoV-2 and Drug-Resistant pH1N1 Using CRISPR/dCas9. ACS Sens. 2020, 5, 4017–4026. [Google Scholar] [CrossRef]
  13. Fan, Z.; Yao, B.; Ding, Y.; Zhao, J.; Xie, M.; Zhang, K. Entropy-Driven Amplified Electrochemiluminescence Biosensor for RdRp Gene of SARS-CoV-2 Detection with Self-Assembled DNA Tetrahedron Scaffolds. Biosens. Bioelectron. 2021, 178, 113015. [Google Scholar] [CrossRef]
  14. Kirimli, C.; Lin, S.; Su, Y.H.; Shih, W.H.; Shih, W.Y. In Situ, Amplification-Free Double-Stranded Mutation Detection at 60 Copies/Ml with Thousand-Fold Wild Type in Urine. Biosens. Bioelectron. 2018, 119, 221–229. [Google Scholar] [CrossRef] [PubMed]
  15. Yang, C.H.; Wu, T.H.; Chang, C.C.; Lo, H.Y.; Liu, H.W.; Huang, N.T.; Lin, C.W. Biosensing Amplification by Hybridization Chain Reaction on Phase-Sensitive Surface Plasmon Resonance. Biosensors 2021, 11, 75. [Google Scholar] [CrossRef] [PubMed]
  16. Peng, Y.; Pan, Y.; Sun, Z.; Li, J.; Yi, Y.; Yang, J.; Li, G. An Electrochemical Biosensor for Sensitive Analysis of the SARS-CoV-2 RNA. Biosens. Bioelectron. 2021, 186, 113309. [Google Scholar] [CrossRef]
  17. Ahmad, M.; Sharma, P.; Kamai, A.; Agrawal, A.; Faruq, M.; Kulshreshtha, A. HRPZyme Assisted Recognition of SARS-CoV-2 Infection by Optical Measurement (HARIOM). Biosens. Bioelectron. 2021, 187, 113280. [Google Scholar] [CrossRef]
  18. Ochmann, S.E.; Vietz, C.; Trofymchuk, K.; Acuna, G.P.; Lalkens, B.; Tinnefeld, P. Optical Nanoantenna for Single Molecule-Based Detection of Zika Virus Nucleic Acids without Molecular Multiplication. Anal. Chem. 2017, 89, 13000–13007. [Google Scholar] [CrossRef]
  19. Han, S.; Soylu, M.C.; Kirimli, C.E.; Wu, W.; Sen, B.; Joshi, S.G.; Emery, C.L.; Au, G.; Niu, X.; Hamilton, R.; et al. Rapid, Label-Free Genetic Detection of Enteropathogens in Stool without Genetic Isolation or Amplification. Biosens. Bioelectron. 2019, 130, 73–80. [Google Scholar] [CrossRef]
  20. Aura, A.M.; D’Agata, R.; Spoto, G. Ultrasensitive Detection of Staphylococcus Aureus and Listeria Monocytogenes Genomic DNA by Nanoparticle-Enhanced Surface Plasmon Resonance Imaging. ChemistrySelect 2017, 2, 7024–7030. [Google Scholar] [CrossRef]
  21. Hajian, R.; Balderston, S.; Tran, T.; deBoer, T.; Etienne, J.; Sandhu, M.; Wauford, N.A.; Chung, J.Y.; Nokes, J.; Athaiya, M.; et al. Detection of Unamplified Target Genes via CRISPR–Cas9 Immobilized on a Graphene Field-Effect Transistor. Nat. Biomed. Eng. 2019, 3, 427–437. [Google Scholar] [CrossRef]
  22. Xie, S.; Chai, Y.; Yuan, Y.; Bai, L.; Yuan, R. Development of an Electrochemical Method for Ochratoxin A Detection Based on Aptamer and Loop-Mediated Isothermal Amplification. Biosens. Bioelectron. 2014, 55, 324–329. [Google Scholar] [CrossRef]
  23. Salm, E.; Zhong, Y.; Reddy, B.J.; Duarte-Guevara, C.; Swaminathan, V.; Liu, Y.S.; Bashir, R. Electrical Detection of Nucleic Acid Amplification Using an On-Chip Quasi-Reference Electrode and a PVC REFET. Anal. Chem. 2014, 86, 6968–6975. [Google Scholar] [CrossRef] [PubMed]
  24. Baranwal, J.; Barse, B.; Gatto, G.; Broncova, G.; Kumar, A. Electrochemical Sensors and Their Applications: A Review. Chemosensors 2022, 10, 363. [Google Scholar] [CrossRef]
  25. Hill, A.; Tait, S.; Baillie, C.; Virdis, B.; McCabe, B. Microbial Electrochemical Sensors for Volatile Fatty Acid Measurement in High Strength Wastewaters: A Review. Biosens. Bioelectron. 2020, 165, 112409. [Google Scholar] [CrossRef]
  26. Huang, Z.; Long, J.; Xu, W.; Ji, H.; Wang, B.; Li, H. Design of capacitively coupled contactless conductivity detection sensor. Flow Meas. Instrum. 2012, 27, 67–70. [Google Scholar] [CrossRef]
  27. Li, L.; Ren, D.D.; Zhang, P.Y.; Song, Y.P.; Li, T.X.; Gao, M.H.; Xu, J.N.; Zhou, L.; Zeng, Z.C.; Pu, Q. Pushing the Limits of Capacitively Coupled Contactless Conductivity Detection for Capillary Electrophoresis. Anal. Chem. 2024, 96, 10356–10364. [Google Scholar] [CrossRef]
  28. Tůma, P.; Sommerová, B.; Šiklová, M. Monitoring of adipose tissue metabolism using microdialysis and capillary electrophoresis with contactless conductivity detection. Talanta 2019, 192, 380–386. [Google Scholar] [CrossRef]
  29. Duong, H.A.; Vu, M.T.; Nguyen, T.D.; Nguyen, M.H.; Mai, T.D. Determination of 10-hydroxy-2-decenoic acid and free amino acids in royal jelly supplements with purpose-made capillary electrophoresis coupled with contactless conductivity detection. J. Food Compos. Anal. 2020, 87, 103422. [Google Scholar] [CrossRef]
  30. Do Quang, L.; Bui, T.T.; Hoang, A.B.; Van, T.P.; Jen, C.P.; Chu Duc, T. Development of a Passive Capacitively Coupled Contactless Conductivity Detection (PC4D) Sensor System for Fluidic Channel Analysis Toward Point-of-Care Applications. IEEE Sens. J. 2019, 19, 6371–6380. [Google Scholar] [CrossRef]
  31. Hu, C.; Xie, B.; Li, H.; Xiao, D. A five-electrode capacitively coupled contactless conductivity detector with a low limit of detection. Anal. Methods 2023, 15, 2253–2261. [Google Scholar] [CrossRef]
  32. Chantipmanee, N.; Sonsa-ard, T.; Fukana, N.; Kotakanok, K.; Mantim, T.; Wilairat, P.; Hauser, P.C.; Nacapricha, D. Contactless conductivity detector from printed circuit board for paper-based analytical systems. Talanta 2020, 206, 120227. [Google Scholar] [CrossRef]
  33. Sonsa-ard, T.; Chantipmanee, N.; Fukana, N.; Hauser, P.C.; Wilairat, P.; Nacapricha, D. Contactless conductivity sensor employing moist paper as absorbent for in-situ detection of generated carbon dioxide gas. Anal. Chim. Acta 2020, 1118, 44–51. [Google Scholar] [CrossRef] [PubMed]
  34. Brito-Neto, J.G.A.; Fracassi da Silva, J.A.; Blanes, L.; do Lago, C.L. Understanding capacitively coupled contactless conductivity detection in capillary and microchip electrophoresis. Part 1. Fundamentals. Electroanalysis 2005, 17, 1198–1206. [Google Scholar] [CrossRef]
  35. Wang, J.; Liu, Y.; He, W.; Chen, Y.; You, H. A novel planar grounded capacitively coupled contactless conductivity detector for microchip electrophoresis. Micromachines 2022, 13, 394. [Google Scholar] [CrossRef]
  36. Kang, Q.; Shen, D.; Li, Q.; Hu, Q.; Dong, J.; Du, J.; Tang, B. Reduction of the impedance of a contactless conductivity detector for microchip capillary electrophoresis: Compensation of the electrode impedance by addition of a series inductance from a piezoelectric quartz crystal. Anal. Chem. 2008, 80, 7826–7832. [Google Scholar] [CrossRef]
  37. Alvarez-Serna, B.E.; Ramírez-Chavarría, R.G.; Castillo-Villanueva, E.; Carrillo-Reyes, J.; Ramírez-Zamora, R.M.; Buitrón, G.; Alvarez-Icaza, L. Label-Free and Portable Field-Effect Sensor for Monitoring RT-LAMP Products to Detect SARS-CoV-2 in Wastewater. Talanta 2023, 253, 124060. [Google Scholar] [CrossRef]
  38. Zhang, X.; Liu, W.; Lu, X.; Justin Gooding, J.; Li, Q.; Qu, K. Monitoring the Progression of Loop-Mediated Isothermal Amplification Using Conductivity. Anal. Biochem. 2014, 466, 16–18. [Google Scholar] [CrossRef] [PubMed]
  39. Zhang, X.; Li, Q.; Jin, X.; Jiang, C.; Lu, Y.; Tavallaie, R.; Gooding, J.J. Quantitative determination of target gene with electrical sensor. Sci. Rep. 2015, 5, 12539. [Google Scholar] [CrossRef] [PubMed]
  40. Vance, J.; Abdou, J.; Delzeit, L. Capacitively-Coupled Contactless Conductivity Detection (C4D) for In-Line Ionic Silver Monitoring. In Proceedings of the 2023 International Conference on Environmental Systems, Rome, Italy, 21–23 September 2023. [Google Scholar]
  41. Coltro, W.K.T.; Lima, R.S.; Segato, T.P.; Carrilho, E.; de Jesus, D.P.; do Lago, C.L.; da Silva, J.A.F. Capacitively Coupled Contactless Conductivity Detection on Microfluidic Systems—Ten Years of Development. Anal. Methods 2012, 4, 25–33. [Google Scholar] [CrossRef]
  42. Hauser, P.C.; Kubáň, P. Capacitively Coupled Contactless Conductivity Detection for Analytical Techniques—Developments from 2018 to 2020. J. Chromatogr. A 2020, 1632, 461616. [Google Scholar] [CrossRef]
  43. Ramírez-Chavarría, R.G.; Sánchez-Pérez, C.; Matatagui, D.; Qureshi, N.; Pérez-García, A.; Hernández-Ruíz, J. Ex-Vivo Biological Tissue Differentiation by the Distribution of Relaxation Times Method Applied to Electrical Impedance Spectroscopy. Electrochim. Acta 2018, 276, 214–222. [Google Scholar] [CrossRef]
  44. Chahbi, M.; Mortadi, A.; Zaim, S.; El Ghyati, N.; Monkade, M.; El Moznine, R. A new approach to investigate the ionic conductivity of NaCl and KCl solutions via impedance spectroscopy. Mater. Today Proc. 2022, 66, 205–211. [Google Scholar] [CrossRef]
  45. Ramírez-Chavarría, R.G.; Castillo-Villanueva, E.; Alvarez-Serna, B.E.; Carrillo-Reyes, J.; Ramírez-Zamora, R.M.; Buitrón, G.; Alvarez-Icaza, L. Loop-mediated isothermal amplification-based electrochemical sensor for detecting SARS-CoV-2 in wastewater samples. J. Environ. Chem. Eng. 2022, 10, 107488. [Google Scholar] [CrossRef] [PubMed]
  46. Jeong, H.; Shin, S.; Hwang, J.; Kim, Y.J.; Choi, S. Open-Source Fluorescence Spectrometer for Noncontact Scientific Research and Education. J. Chem. Educ. 2021, 98, 3493–3501. [Google Scholar] [CrossRef]
  47. Cancelliere, R.; Paialunga, E.; Grattagliano, A.; Micheli, L. Label-free electrochemical immunosensors: A practical guide. TrAC Trends Anal. Chem. 2024, 180, 117949. [Google Scholar] [CrossRef]
  48. Ménard-Moyon, C.; Bianco, A.; Kalantar-Zadeh, K. Two-dimensional material-based biosensors for virus detection. ACS Sens. 2020, 5, 3739–3769. [Google Scholar] [CrossRef]
  49. Wang, Y.; Wang, C.; Zhou, Z.; Si, J.; Li, S.; Zeng, Y.; Deng, Y.; Chen, Z. Advances in simple, rapid, and contamination-free instantaneous nucleic acid devices for pathogen detection. Biosensors 2023, 13, 732. [Google Scholar] [CrossRef]
  50. Ye, H.; Nowak, C.; Liu, Y.; Li, Y.; Zhang, T.; Bleris, L.; Qin, Z. Plasmonic LAMP: Improving the detection specificity and sensitivity for SARS-CoV-2 by plasmonic sensing of isothermally amplified nucleic acids. Small 2022, 18, 2107832. [Google Scholar] [CrossRef]
  51. Liu, D.; Shen, H.; Zhang, Y.; Shen, D.; Zhu, M.; Song, Y.; Zhu, Z.; Yang, C. A microfluidic-integrated lateral flow recombinase polymerase amplification (MI-IF-RPA) assay for rapid COVID-19 detection. Lab Chip 2021, 21, 2019–2026. [Google Scholar] [CrossRef]
  52. Wu, Y.; Dang, H.; Park, S.G.; Chen, L.; Choo, J. SERS-PCR assays of SARS-CoV-2 target genes using Au nanoparticles-internalized Au nanodimple substrates. Biosens Bioelectron. 2022, 197, 113736. [Google Scholar] [CrossRef]
  53. Bel Hadj Ali, I.; Souguir, H.; Melliti, M.; Mohamed, M.V.T.; Ardhaoui, M.; Ayouni, K.; Haddad-Boubaker, S.; Saadi Ben Aoun, Y.; Triki, H.; Guizani, I. Rapid detection of SARS-CoV-2 RNA using a one-step fast multiplex RT-PCR coupled to lateral flow immunoassay. BMC Infec. Dis. 2024, 24, 1417. [Google Scholar] [CrossRef]
  54. Lynch, C.R.; Drummond, R.S.; Jelley, L.; Baker, L.; Smit, E.; Fleming, R.; Billington, C. Optimization and Benchmarking of RT-LAMP-CRISPR-Cas12a for the Detection of SARS-CoV-2 in Saliva. Int. J. Mol. Sci. 2025, 26, 1806. [Google Scholar] [CrossRef] [PubMed]
Figure 1. (a) Equivalent circuit of the conventional C 4 D. (b) Equivalent circuit of the Re C 4 D unit. (c) Illustration of the Re C 4 D unit, consisting of an IDE transducer electrically isolated with adhesive tape, with capacitance C c , and a series inductor L c . (d) Frequency response of the Re C 4 D unit to find the resonance frequency, f r , without a sample.
Technologies 13 00138 g001
Figure 2. Diagram of the experimental setup to evaluate biological samples.
Technologies 13 00138 g002
Figure 3. The electric current values i o obtained, based on nominal values of R c , confirm the successful operation of our bioelectrochemical detection unit.
Technologies 13 00138 g003
Figure 4. (a) Schematic diagram for testing samples using the Re C 4 D unit. (b) Equivalent circuit considering variable capacitance C c and resistance R e , whereas the value of the inductance L c is fixed.
Technologies 13 00138 g004
Figure 5. Frequency response plots of the Re C 4 D for measuring the conductivity of KCl concentrations. (a) Magnitude of the voltage, v m , and (b) phase, ϕ , for each KCl concentration.
Technologies 13 00138 g005
Figure 6. Calibration curves for measuring the conductivity of an electrolyte. (a) Amplitude of the magnitude of the voltage v m , (b) resonance frequency f r , and (c) phase-associated ϕ of the output signal for KCl concentrations in the range from 0 to 0.5 M.
Technologies 13 00138 g006
Figure 7. Frequency response plots of the Re C 4 D for quantifying nucleic acid amplification. (a) Magnitude of the voltage, v m , and (b) phase, ϕ , according to each concentration of NAA products and a negative template control (NTC).
Technologies 13 00138 g007
Figure 8. Calibration curves for quantifying nucleic acid amplification. (a) Magnitude of the magnitude of the voltage v m , (b) resonance frequency f r , and (c) phase-associated ϕ as a function of the concentration of nucleic acids, c, on a logarithmic scale.
Technologies 13 00138 g008
Table 1. Measured and calculated values for the measurement platform validation experiment.
R c [M Ω ] v o [V] i o [ μ A] i t [ μ A]%E
0.54.799.8510.004.22
0.64.098.188.331.79
0.73.436.877.173.85
0.83.126.246.250.09
0.92.785.575.560.23
1.02.635.265.005.21
Table 2. Detection parameters for measuring the conductivity of KCl concentrations.
Detection ParameterSensitivity
v m 0.371 V M
f r 88.060 kHz M
ϕ 80.260 deg M
Table 3. Detection parameter values to quantify the NAA products.
ParameterSensitivity Re C 4 DLoD Re C 4 DSensitivity C 4 DLoD C 4 D
v m 0.071 V log ( copy μ L ) 0.61 copy μ L 0.183 V log ( copy μ L ) 1.66 copy μ L
f r 5.618 kHz log ( copy μ L ) 0.24 copy μ L N/AN/A
ϕ 3.381 deg log ( copy μ L ) 0.41 copy μ L 0.017 deg log ( copy μ L ) 0.83 copy μ L
Table 4. Comparison of SARS-CoV-2 detection technologies based on NAA methods.
Sensing TechnologySampleNAA MethodTargetLODAdvantagesDisadvantagesRef.
Electrochemical
sensor
WastewaterRT-LAMPORF1ab
and
N genes
0.038 pg/ μ LA simple and cost-effective sensor
for resource-limited environments.
The device is capable of monitoring
the reaction time course of RT-LAMP at
low concentrations.
The electrodes are disposable after
each measurement.
The RT-LAMP mix requires methylene
blue as a redox probe to obtain a
diffusion-controlled electrochemical
response.
[45]
Plasmonic sensor
based on gold and
silver alloy nanoshells
SyntheticLAMPN gene10 copies/reactionThe plasmonic sensor-based detection
technique shows better sensitivity and
specificity than the LAMP kits commercially
available.
The NAA method eliminates
non-template amplification contamination.
The sensors are not cost-effective as they
require gold and silver alloy nanoshells.
LAMP method requires
75 min of analysis time.
[50]
Microfluidic-integrated
lateral flow assay
ClinicalRT-RPAN gene1 copy/ μ LThe assay is simple and accessible, as the
genetic material is loaded, then incubated
and mixed on the microfluidic platform.
The microfluidic platform protects the sample
from cross-contamination and allows for
sensitive detection.
It requires approximately 30 minutes of
incubation.
The assay can be used as a complement to
RT-PCR.
[51]
Surface-enhanced
Raman scattering assay
using Au nanodimple substrate
SyntheticRT-PCRE and
RdRP
genes
N.R.The platform reduces the number of cycles needed
to amplify genetic material compared to conventional
RT-PCR amplification.
By reducing the amplification time, the analysis and
diagnostic time is also drastically shortened.
It requires the preparation of a gold substrate
internalized with nanoparticles to shorten the
amplification time, which is not cost-effective
and requires additional processes.
The measurements require Raman spectroscopy
equipment, which is expensive and not easily
accessible in resource-limited environments.
[52]
Lateral flow
immunoassay
based on fluorescein
ClinicalPCRN and
E genes
N.R.The detection method provides an alternative for rapid
PCR amplicon detection for qualitative testing.
The amplification method, coupled with the immunoassay
platform, is more cost-effective than conventional assays.
The primers used in the amplification require
double labeling to enable detection.
It is a qualitative test that requires 1 h and
20 min to deliver results.
[53]
CRISPR-Cas12a
fluorescence detection
SalivaRT-LAMP and RT-RPAN and
E genes
N.R.The amplification and detection method provide results
with performance similar to RT-qPCR in saliva samples.
The optimization of measurements allows for a
relationship between genetic amplification and fluorescence
levels, which can be measured with minimal hardware.
The assay can only provide qualitative results at
different stages of amplification.
The preparation of the mixtures for CRISPR-Cas12a
detection requires specialized preparation to control
stability and make it replicable in resource-limited
environments.
[54]
Resonance-induced
capacitively coupled
contactless conductivity
detection
SyntheticRT-LAMPORF1ab
and
N genes
0.24 copy/ μ LThe RT-LAMP amplification mixture and method do not
require modifications or additional reagents.
The detection method offers a reusable device, as it does
not come into direct contact with the sample, and the sensor
element does not require a bioreceptor or functionalization.
The sample is at risk of contamination from the air
when placed on the sensor surface without any
protection.
The preparation of the RT-LAMP mixture solution
and the experimental conditions must be controlled
by the experimenter to ensure reproducibility.
This
work
RT-PCR: Reverse transcription polymerase chain reaction. RT-RPA: Reverse transcription recombinase polymerase amplification. RT-LAMP: Reverse transcription loop-mediated isothermal amplification. N.R. Not reported.
Disclaimer/Publisher’s Note: The statements, opinions and data contained in all publications are solely those of the individual author(s) and contributor(s) and not of MDPI and/or the editor(s). MDPI and/or the editor(s) disclaim responsibility for any injury to people or property resulting from any ideas, methods, instructions or products referred to in the content.

