
Economic Downturns, Urban Growth and Suburban Fertility in a Mediterranean Context
by
 , , and
Samaneh Sadat Nickayin
1 ,
,
Francesco Chelli
2,
Rosario Turco
3,
Bogdana Nosova
4,
Chara Vavoura
5 and
Luca Salvati
6,* 1
Planning and Design Faculty, Agricultural University of Iceland, Hvanneyri, 311 Borgarbyggð, Iceland
2
Department of Social and Economic Sciences, Polytechnic University of Marche, Piazzale Martelli 8, I-60121 Ancona, Italy
3
Council for Agricultural Research and Economics (CREA), Research Centre for Forestry and Wood (FL), Contrada Li Rocchi Vermicelli, I-87036 Rende, Italy
4
Department of Social Communications, Institute of Journalism, Taras Shevchenko National University of Kyiv, 64/13, Volodymyrska Street, 01601 Kyiv, Ukraine
5
Department of Economics, University of Athens, Sofokleous Street 1, EL-10559 Athens, Greece
6
Department of Methods and Models for Economics, Territory and Finance, Sapienza University of Rome, Via del Castro Laurenziano 9, I-00161 Rome, Italy
*
Author to whom correspondence should be addressed.
Economies 2022, 10(10), 252; https://doi.org/10.3390/economies10100252
Submission received: 12 August 2022
/
Revised: 13 September 2022
/
Accepted: 21 September 2022
/
Published: 12 October 2022
Abstract
:Despite the wealth of micro–macro data on short-term demographic dynamics, the impact of metropolitan growth and economic downturns on local fertility is still under-investigated in advanced economies. Recent studies in low-fertility contexts have assumed suburban birth rates as being systematically higher than urban and rural rates. This assumption (hereafter, known as the ‘suburban fertility hypothesis’) was grounded on stylized facts and spatial regularities that imply a significant role of both macro (contextual) and micro (behavioral) factors positively influencing fertility in suburban locations. To verify such a hypothesis from a macro (contextual) perspective, the present study compares the general fertility rate of urban, suburban, and rural settlements of the Athens’ metropolitan region (Greece) at various observation years between 1860 and 2020. Long-term Athens’ growth represented a sort of ‘quasi-experiment’ for Mediterranean Europe, linking sequential urban stages and distinctive waves of economic expansion and recession. Using multivariate exploratory analysis and global/local econometric models, a dominant ‘rural’ fertility regime was recorded for 1860 and 1884. A characteristic ‘urban’ fertility regime was, instead, found over a relatively long, intermediate period between 1956 and 1990. Higher fertility in suburban settlements (10 km away from downtown Athens, on average) was, finally, observed since 2000. Considering a sufficiently long-time interval, the existence of multiple fertility regimes along the distance gradient has demonstrated how fertility dynamics are intrinsically bonded with metropolitan growth, economic downturns, and social transformations in Mediterranean Europe.

1. Introduction
With population transitions diverging across regions and countries in both affluent societies and emerging economies, demographic structures and dynamics have been increasingly related with economic downturns and social change (Buzar et al. 2005; Angel et al. 2011; Rees et al. 2017; Vitali and Billari 2017). From this perspective, factors shaping regional fertility have been investigated by adopting quantitative approaches, statistical indicators, and refined (econometric) techniques (Gil-Alonso et al. 2016; Lerch 2016; Stockdale 2016). Economic factors (e.g., the intrinsic variability in housing and land prices over regions) that were at the base of fertility divides along metropolitan gradients (Chi and Zhu 2008), together with non-economic forces, including social drivers causing, e.g., downtown gentrification and class segregation in the suburbs (Kabisch and Haase 2011; Wang and Chi 2017; Carbonaro et al. 2018). These factors should be investigated at multiple temporal and spatial levels, outlining the importance of (i) socioeconomic processes affecting urban–suburban–rural population structures and (ii) demographic dynamics impacting fertility rates under defined territorial backgrounds (Toulemon 2004; Reher 2011; Benassi et al. 2020; López-Gay et al. 2020).
With socioeconomic disparities being a common property of regional systems (Azarnert 2019; Ciommi et al. 2019; Maloutas et al. 2019; Salvati and Carlucci 2020), fertility divides have been demonstrated to be more intense when comparing dynamic and accessible districts with more marginal areas. Population aging, poverty, social segregation, limited transport accessibility, and a stagnant job market, accounting for a structurally low fertility, were at the base of such divides (Dyson 2011; Bocquier and Costa 2015; Benassi and Salvati 2020). Although birth rates have been increasingly taken as an indirect measure of local/regional resilience to short- and medium-term exogenous shocks, the role of external—especially non-economic—factors was less frequently studied at the local scale (Feng 2011; Bayona-Carrasco and Gil-Alonso 2012; Evans and Gray 2018). For instance, fertility declines have been associated with a (more or less intense) decrease in marriage rates (Guilmoto and Rajan 2001; Gavalas et al. 2014; Goldstein and Klüsener 2014). From this view, marriage (and childbearing) postponement, cohabitation, new family relations, and smaller households may shape a more heterogeneous distribution of birth rates over space (Adserà 2004; Sobotka 2004; Işik and Pinarcioglu 2006). Assuming socioeconomic diversification is a relevant feature of urban systems (e.g., Carlucci et al. 2017, 2018), a coherent identification of demographically balanced regions—likely more resilient to external shocks—justifies a refined analysis of the mutual relationship between metropolitan cycles, economic downturns, and fertility dynamics (Ogden and Hall 2000; Kulu and Boyle 2009; Ciommi et al. 2018). Metropolitan regions are appropriate spatial domains for the investigation of demographic trends and economic cycles in low-fertility contexts (e.g., Buckley 1998; Liu 2005; Potter et al. 2010; Lerch 2019), especially in Europe (Michielin 2004; Lauf et al. 2012; Kulu 2013; Lesthaeghe and Lopez-Gay 2013). In such contexts, demographic transitions paralleled socioeconomic change, settlement dynamics, social segregation, and rising spatial polarization of activities (Sato and Yamamoto 2005; Lerch 2013; Sabater and Graham 2019). A refined comprehension of fertility dynamics along the metropolitan gradient in advanced economies informs (i) planning measures contributing to a sustainable development of city regions, (ii) policies promoting socio-spatial cohesion, and (iii) specific actions for local development (Galor 2005; Canning 2011; Schneider 2015).
Empirical evidence of long-term studies supports the hypothesis of a slow but generalized shift from a fertility regime dominated by higher birth rates in rural areas toward a more homogeneous spatial regime with systematically higher rates in urban settlements (Rodriguez-Rodriguez 2000; Surkyn and Lesthaeghe 2004; Sobotka et al. 2011). Urban cycles brought a generalized fertility decline—slower in rural areas at the beginning and then progressively more rapid in urban areas, determining sequential rises and declines in population growth rates (e.g., Wachter 2005; Voss 2007; Walford and Kurek 2016). Encompassing—and in most cases paralleling—the first demographic transition (Van de Kaa 1987), this shift was observed over centuries in advanced economies, despite a slightly different timing among countries (Waldorf and Franklin 2002; Thygesen et al. 2005; De Castro 2007; Kulu et al. 2009). More recently, coinciding with the second demographic transition (Adserà 2006), a stable, higher level of fertility in the suburbs was recorded compared with urban and rural areas, suggesting the consolidation of a new spatial regime, referring to as the so-called ‘suburban fertility hypothesis’ (Kulu and Vikat 2007). The traditional antinomy between inner cities and suburbs was at the base of this new regime, with central locations often regarded as ‘children unfriendly’ because of smaller dwellings, fewer green spaces, fewer services for childbearing, air pollution, and a lack of natural amenities (Hank 2002; Kroll and Kabisch 2012; Bocquier and Bree 2018).
Mixing the unique advantage of proximity with upper economic functions, the intrinsic benefits of natural amenities, and larger spaces in detached houses, the inherent socioeconomic transformation of suburbs were often mentioned as possible motivations at the base of the higher fertility levels observed in intermediate locations along the metropolitan gradient (Arapoglou and Sayas 2009; Pison 2011; Doignon et al. 2021). A higher suburban fertility has been specifically reported for several European regions (Haase et al. 2010; Campisi et al. 2020; Egidi and Salvati 2021), and the related territorial context was demonstrated to exert a pivotal effect on local birth rates (Vignoli et al. 2012; Arpino and Tavares 2013; Balbo et al. 2013). However, the ‘suburban fertility hypothesis’—and especially the intrinsic linkage with urban dynamics and economic downturns along a given metropolitan gradient (Bongaarts 2009)—requires additional (empirical) work for specific contexts, particularly for Mediterranean Europe (Caldwell 2006). Our study provides a comparative background to regional demography (Coppola and Di Cesare 2008; Frejka and Sobotka 2008; Georgiadis 2011; Lee and Painter 2013), by studying the long-term shift in the dominant spatial fertility pattern (i.e., from ‘rural’ to ‘urban’ and ‘suburban’ regimes) at the regional scale in metropolitan Athens, basically corresponding with the administrative region of Attica in Central Greece (Figure 1).
Starting from the empirical evidence of an earlier study hypothesizing the relevance of a ‘suburban’ fertility regime in the area for the last two–three decades of urban growth (Halbac-Cotoara-Zamfir et al. 2021), the present work tests the relationship between a general fertility rate and the distance from inner cities in a monocentric model, using metropolitan Athens as a representative—while less investigated—socioeconomic context in Southern Europe. Providing a broaden operational perspective in respect with earlier studies—in terms of enlarged data coverage in both time and space and the statistical methodologies applied to both observational dimensions, the relationship between birth rates and distance from downtown was studied over a relatively long time interval (1860–2020), possibly characterized by the sequential dominance of the three fertility regimes mentioned above. Based on exploratory approaches and econometric techniques (e.g., Ciommi et al. 2019), the analysis of a general fertility rate at different spatial scales provided the appropriate knowledge ground confirming (or confuting) the assumptions formulated earlier in this chapter.
2. Methodology
2.1. Study Area
Demographic dynamics—and especially regional and local fertility—were investigated in the administrative region of Attica (Central Greece) with a focus on the Athens’ Metropolitan Region (AMR). This region was administratively divided into 7 regional units (Figure 2, left) and 115 local authorities (municipal-level, in Greek ‘dimoi’ and ‘koinotites’), encompassing a large portion of mainland Attica that includes Salamina island and excludes other islands of the Saronikos Gulf in the Aegean Sea. Boundaries of the AMR (3025 km2) were defined according with the functional criteria set up in the European Urban Atlas (Salvati and Serra 2016), a GMES (Global Monitoring and Environmental Surveillance) Copernicus Land initiative aimed at delineating metropolitan areas with more than 100,000 resident inhabitants (Panori et al. 2019). A mixed topography ranging from flat districts to steep elevation land characterized the study area (Salvati and Carlucci 2020). Mountain chains (Penteli, Egaleo, Parnitha, Imitos) surrounded the Greater Athens’ area (extending over the flat district named Attica basin (‘Lekanopedio Attikis’ in Greek)). Flat districts with predominantly rural settlements in Thriasio (West Attica) and Messoghia (East Attica) acted as a sink of future exurban development (Maloutas 2007).
Based on census data released by Hellenic Statistical Authority (ELSTAT), resident population in Attica increased from nearly 400 inhabitants/km2 (1951) to a bit less than 1000 inhabitants/km2 (2021), with a spatial divide in population density between the AMR and the rest of Greece, both urban and rural (Maloutas and Ramos Lobato 2015). Based on earlier evidence (Morelli et al. 2014; Rontos et al. 2016; Pili et al. 2017), a monocentric model was assumed for Attica, a region functionally gravitating around downtown Athens (Salvati et al. 2018). Placed in the middle of Attica, the Greater Athens’ area included Athens’ municipality (40 km2) and more than 50 surrounding municipalities at a distance less than 10 km from the capital city (Gkartzios 2013), encompassing a total area of nearly 430 km2 (Egidi and Salvati 2021). Greater Athens displays a relatively high concentration of resident population, ranging from 3000 to 15,000 inhabitants/km2 depending on urban neighborhoods (Chorianopoulos et al. 2014). The remaining part of Attica was divided in suburban municipalities (with population density around 1000 inhabitants/km2, on average) at fringe locations (between 10 km and 20 km from Athens) and strictly rural municipalities (with population density around 250 inhabitants/km2, on average).
2.2. Data and Variables
To delineate an appropriate framework evaluating the intrinsic linkage between birth rates and economic downturns, our study proposed a descriptive analysis of local fertility that assumes past fertility as a factor of present fertility decline (De Castro 2007; Muniz 2009; Burillo et al. 2020). Representing the intimate (demographic) characteristics of the metropolitan gradient under investigation (Cabré 2003; Billari and Kohler 2004; Caltabiano 2008; Salvati et al. 2020) was the final objective of this analysis. Assuming the birth rate observed in neighboring municipalities as a predictor of local fertility (Lerch 2014), we considered three spatial scales homogeneously covering the study area: (i) seven regional units (corresponding to the prefectural NUTS-3 level of the European Nomenclature for Official Statistics, see above) with data covering a time interval between 1991 and 2020; (ii) 12 local districts corresponding to extended municipalities for 1860 and 1884; and (iii) 115 municipalities (‘dimoi’ and ‘koinotites’) corresponding with the LAU-1 level of the nomenclature presented above, for nine time points between 1956 and 2020. Vital statistics at the (i) spatial scale were intended as stable over time and statistically reliable (sensu Salvati et al. 2020), since decadal birth rates calculated over sufficiently large spatial domains (i.e., NUTS-3) reduce the impact of inter-annual temporal variability and assure the robustness of spatial demographic estimates (Campisi et al. 2020). Vital statistics at both (ii) and (iii) spatial scales were considered as more informative for a spatial demographic perspective (sensu Burillo et al. 2020), since they provide disaggregated estimates that may reflect locally differentiated behaviors (Gavalas et al. 2014). Being used largely in regional demography (see De Castro 2007; Muniz 2009; Goldstein et al. 2009; Vitali and Billari 2017; and references therein for a broad discussion on the use of such indices), the birth rate adopted in this study was calculated from ELSTAT data as a generalized (i.e., age-specific) fertility rate based on the number of children to the total number of women of fertile age (15–49 years), i.e., representing what has been called as the ‘general fertility rate’ in the demographic literature (Benassi and Salvati 2019; Salvati 2019; Lamonica et al. 2022). The rate was calculated separately at the desired temporal scale (annual or decadal) and spatial level (local district or municipality).
Despite age-specific fertility rates are clearly preferred in demographic analysis (e.g., Campisi et al. 2020), the use of a general fertility rate can be seen as a compromise (sensu Muniz 2009) between the need for accurate information in the analysis of regional fertility (Burillo et al. 2020) and the limited availability of vital statistics on a subprefectural (i.e., municipal/district) scale, especially—but not exclusively—in more remote investigation years (Egidi and Salvati 2021). Considering separately results at three spatial scales of investigation (prefectures, local districts, municipalities) may reduce further the possible impact of (partial) information lack in some statistical data at lower spatial scales and at more remote observation years (Salvati et al. 2020). For instance, the use of 12 local districts covering the whole study area for both 1860 and 1884 goes in this direction, since they are representative of the actual geography of municipalities in Attica (see also Benassi and Salvati 2020, for further details).
Additionally, although being almost stable over time, some municipal boundaries in the study area underwent minor modifications, especially between the early 1950s and the late 1970s (Salvati and Serra 2016). During that time, local fertility rates for a small number of municipalities (less than five) were estimated considering additional information from ELSTAT (i.e., population/census figures at village scale and maps at submunicipal levels (Egidi and Salvati 2021). When these figures were unavailable, they were ultimately derived from the related demographic rates calculated as the average of the 5 nearest spatial units (Salvati and Carlucci 2020). For a given year and location, all data were derived (i) from digital data collected from the ELSTAT web site or made available after an ad hoc request or (ii) from digitalization of statistical data reported in official publications of the ELSTAT and made available in a specific digital library (www.statistics.gr, accessed on 1 September 2022) or after an ad hoc request (e.g., Salvati and Zambon 2018).
2.3. Data Analysis
The present study adopted a statistical approach based on five analysis’ steps: (i) descriptive statistics and maps of the general fertility rates varying over time in the study area; (ii) a Principal Component Analysis (PCA) exploring spatio-temporal trends in local fertility along the metropolitan gradient in Attica; (iii) spatially implicit econometric models testing the global relationship between the general fertility rate and the distance from the inner city; and (iv) a non-metric Multidimensional Scaling (n-MDS) comparing the econometric outcomes of linear and quadratic specifications over the whole time interval, with the final objective to delineate the latent shift toward different spatial fertility regimes. Finally, (v) spatially explicit regressions were run with the aim of refining the results of global models—verifying the local (linear or quadratic) relationship between general fertility rates and the distance from the inner city.
2.3.1. Descriptive Statistics
Average fertility rates have been computed at three spatial scales (i.e., regional unit, local district, municipality). General fertility rates computed over three decades (1991–2000, 2001–2010, 2011–2020) provided a long-term evaluation of (regional) fertility trends (Lee 2003). Additionally, birth rates calculated at 12 time points, exploiting the available vital statistics in earlier years (1860, 1884, 1956, 1960, 1970, 1980, 1990, 2000, 2008, 2016, 2020), gave a short-term outlook of local fertility patterns in the study area (Gavalas et al. 2014). Maps illustrating the spatial distribution of fertility rates by year and municipality were finally aimed at identifying similarities and differences in fertility levels along the metropolitan gradient between 1956 and 2020. For each municipality, the linear distance from downtown Athens was calculated using polygon centroids derived from a shapefile provided by ELSTAT (Morelli et al. 2014). Municipalities were classified into three distance belts (urban settlements < 10 km from downtown Athens; suburban settlements between 10 km and 20 km from Athens; and, finally, rural settlements > 20 km from Athens). Building on descriptive statistics, a multi-step statistical framework (sensu Ferrara et al. 2016) was subsequently developed, with the aim of providing a comprehensive analysis of local demographic regimes moving from a dominant ‘rural’ fertility pattern to more recent models with higher urban or suburban birth rates.
2.3.2. Principal Component Analysis (PCA)
A Principal Component Analysis (PCA) was applied to a data matrix constituted of 10 (active) variables (general fertility rates at nine time points (1956–2020), augmented with the distance from downtown Athens) made available over 115 observations (municipalities). Given a collection of points in a two-dimensional space, the analysis identifies a best fitting (multivariate) set of (perpendicular) vectors that minimize the average squared distance from a point to the related line (Salvati and Serra 2016). Technically speaking, PCA performs an eigenvalue decomposition of a correlation matrix according with the equation:
where R is a k × k (symmetric and positive) correlation matrix between the k (input) variables (with k = 10 in our case), Γ is the k × k orthogonal matrix of R eigenvectors, and Λ is the diagonal k × k matrix of R eigenvalues, adopting a spectral decomposition of X as
where X is the input (n × k) data matrix (with n corresponding with the number of observations, n = 115 in this case), and Y is the output matrix of principal components.
R = Γ Λ Γ’
Y = Γ’X
The results of a PCA are usually discussed in terms of component coefficients (Pili et al. 2017), distinguishing loadings (i.e., the weight by which each standardized input variable should be multiplied to get the component score) from scores (i.e., the transformed variable values corresponding to a particular data point). In this way, the PCA provides a lower-dimensional representation of input variables, namely a projection of such objects when viewed from the most informative viewpoint (Zambon et al. 2020). The first few components are usually considered in the subsequent analysis with the aim of reducing the dimensionality of the transformed data (Ciommi et al. 2019). Such dimensional reduction is a useful step for visualizing and processing high-dimensional datasets, while still retaining as much of the variance in the dataset as possible (Rontos et al. 2016).
In this study, the PCA was specifically aimed at exploring (latent) spatio-temporal trends in local fertility along the metropolitan gradient. Components with eigenvalues > 1 were selected and analyzed projecting both loadings (i.e., the temporal dimension) and scores (i.e., the spatial dimension) within a unique plot, the so-called biplot (Di Feliciantonio et al. 2018). Being orthogonal by construction, inspection of principal components through biplots allow managing redundancy and multi-collinearity, which constitute a relevant bias to any interpretation model based on quantitative techniques (Duvernoy et al. 2018). As above, municipalities were classified into three distance belts (urban settlements < 10 km from downtown Athens; suburban settlements in between 10 km and 20 km from Athens; and, finally, rural settlements > 20 km from Athens).
2.3.3. Global Econometric Models
An explicit test of the ‘suburban fertility hypothesis’ was carried out, by studying the variability of local birth rates along a distance gradient from downtown Athens through global econometric models. We verified two alternative specifications: (i) a linear model indicating a constant increase (or decrease) in fertility levels along the gradient (i.e., reflecting the dominance of, respectively, a ‘rural’ fertility regime or an ‘urban’ fertility regime) and (ii) a quadratic model indicating the highest value in correspondence with intermediate locations along the gradient (Pili et al. 2017). In line with earlier evidence, the linear model assumed Athens to be a monocentric region (Morelli et al. 2014) and was specified as follows:
where Y is the general fertility rate, x is the distance from downtown Athens (km), and a and b are the regression coefficients, namely slope and intercept.
Y = ax + b
On the contrary, modeling a reverse U-shaped, second-order polynomial model that assumes higher birth rates at suburban locations and lower fertility at urban and rural settlements (Halbac-Cotoara-Zamfir et al. 2021), the quadratic specification was based on the form:
where Y is the general fertility rate, x is the distance from downtown Athens, and a, b, and c are the polynomial (regression) coefficients. For both specifications, input data were log-transformed.
Y = ax2 + bx + c
For each time point (1860–2020), models’ goodness-of-fit was estimated through the adjusted R2 testing against the null hypothesis of a nonsignificant model at p < 0.05 with a Fisher–Snedecor F coefficient. Significance of (linear) regression coefficients against the null hypothesis of zero-coefficients was tested at p < 0.05 using a t statistic (Serra et al. 2014). An index quantifying the goodness-of-fit gains moving from linear to quadratic specifications (i.e., the absolute difference in the adjusted R2 of polynomial and linear regressions by year) was further calculated and tested for significance at p < 0.05 against the null hypothesis of zero gain (i.e., similar R2 of linear and quadratic models). The value of the distance from downtown Athens (km) corresponding with the highest fertility level was finally reported, based on the estimates of the quadratic relationship (when significant). Overall, the sample size corresponded with 12 observations (local districts) for 1860 and 1884 and 115 observations (municipalities) for the remaining time points.
2.3.4. Non-Metric Multidimensional Scaling (n-MDS)
Taken as an alternative to more structured multivariate techniques, such as factor analysis, Multidimensional Scaling (MDS) detects meaningful (latent) dimensions that allow explaining similarities or dissimilarities (i.e., distances) between the investigated objects. MDS attempts to arrange ‘objects’ in a geometrical space with a fixed number of dimensions (e.g., a two-dimensional space), so as to reproduce the observed distances among objects—allowing a latent interpretation of distances in terms of underlying (multivariate) dimensions (Duvernoy et al. 2018). Arriving at a configuration that best approximates the observed distances, MDS checks how well the distances between objects can be reproduced through the new configuration (Ciommi et al. 2019), using a function minimization algorithm that evaluates different configurations, with the aim of maximizing the goodness-of-fit (or minimizing the ‘lack of fit’). Regarded as a common measure evaluating how well a particular configuration reproduces the observed distance matrix (Tenreiro Machado et al. 2011), the raw stress value ϕ of a given configuration was specified as
where dij stands for the reproduced distances, and f(ij) indicates a non-metric, monotone transformation of the observed input data attempting to reproduce the general rank-ordering of distances between the objects in the analysis. The smaller the stress value (i.e., closer to 0), the better the fit of the reproduced distance matrix is to the observed distance matrix (Borg and Groenen 2005).
ϕ = [dij − f(ij)]2
Two non-metric Multidimensional Scaling (n-MDS) exercises, based on Euclidean and Manhattan distance metrics, respectively, were run on the same (input) dataset to compare the econometric outcomes of linear and quadratic specifications over the whole time interval (1860–2020) considered in this study. Fixing a two-dimensional space as the relevant representation (Salvati et al. 2018), ordering stability was tested by comparing outcomes of these two similar metrics—both used widely in the exploratory analysis of socioeconomic phenomena (e.g., Machado et al. 2011). Each n-MDS run elaborated a matrix composed of 7 input variables (regression outcomes) and 11 observations (1860, 1884, 1956, 1960, 1970, 1980, 1990, 2000, 2008, 2016, 2020) that resembles the outcome of the global econometric models estimating the (linear or quadratic) relationship between birth rates and the distance from downtown Athens. The regression outcomes entering the analysis were chosen with the aim of providing a comprehensive picture of the econometric results, considering nonredundant (or slightly redundant) input variables (Rontos et al. 2016). For each investigated year, row variables included (i) intercept (‘Int’), (ii) slope (‘Slope’), and (iii) adjusted-R2 (‘adj-R2’) of linear regressions, as well as (iv–vi) ‘a0’, ‘a1’, and ‘a2’ coefficients of polynomial regressions, augmented with (vii) the gain ratio in the R2 coefficient (‘Gain-R2’) between quadratic and linear models.
Two separate coordinate plots (one for variables, i.e., regression outcomes, and another one for observations, i.e., years) were prepared for both distance metrics (i.e., Euclidean and Manhattan). Starting from the analysis of the regression coefficients, n-MDS runs outlined the evolution of the dominant fertility regime along the distance gradient—i.e., highlighting the latent transition toward different fertility regimes (sensu Zambon et al. 2020); labels were used to indicate the prevailing fertility regime (‘urban’, ‘suburban’, ‘rural’) in each quadrant of the respective n-MDS coordinate plot.
2.3.5. Local Regressions
A refined understanding of the intrinsic regimes of spatial variability in birth rates contributes to identify significant, local deviations from global patterns, informing policy and planning strategies adapted to specific territorial conditions (Serra et al. 2014). Taken as policy-relevant spatial domains, use of administrative districts such as municipalities allows for a comprehensive investigation of context-based interactions that are frequently demised in global (and spatially implicit) interpretative models (Zambon et al. 2019). As a matter of fact, global models underlie spatially uniform relationships and reflect ‘centralized’ policy and planning approaches for a given socioeconomic issue (Cecchini et al. 2019). Based on these premises, our study adopts a spatial econometric approach based on a Geographically Weighted Regression (GWR)—a statistical technique controlling for spatial structures that characterize the local-scale relationship between the dependent variable and one (or more) predictors (Ali et al. 2007). GWRs estimate local regression models for each spatial domain in a given area, accounting for spatial dependence and heterogeneity (Fotheringham et al. 2003). In this case, the analysis was run on 115 municipalities (s) separately for nine time points (1956–2020), testing the following specification:
where Y(s) and X(s) are, respectively, the dependent variable (general fertility rate) and the predictor (distance from downtown Athens) illustrated in Equation (3) above, both measured at location s; B(s) is the column vector of regression coefficients at location s; and e(s) is the random error at location s. Regression parameters were estimated at each location by weighted least squares and are, thus, spatially explicit, i.e., a function of s (Benassi and Salvati 2020). For all runs, input data were log-transformed. A Kernel spline function was adopted to calculate weights for the estimation of local regressions (Zambon et al. 2018). Limitations regarding the use of GWR only arise when drawing conclusions based on a reduced number of sample observations (e.g., Zambon et al. 2020), which is not the case of this study. For each regression, model’s results included (i) a global measure of goodness-of-fit (adjusted R2) and (ii) a spatial distribution of local coefficients (R2, intercept, slope) illustrated through maps of municipalities. Significant slope coefficients were identified considering the results of a t-test (*** p < 0.001, ** 0.001 < p < 0.01; * 0.01 < p < 0.05) computing on coefficient estimate and the relative standard error (Salvati and Benassi 2021). For each investigated year, results of GWR may also test the prevalence of linear or quadratic relationships between fertility levels and the distance from downtown Athens (e.g., Burillo et al. 2020). A spatially homogeneous sign characteristic of the significant slope coefficients (identified as above) indicated the prevalence of a linear relationship (more precisely, positive and negative signs respectively indicate the dominance of a ‘rural’ fertility regime or an ‘urban’ fertility regime). On the contrary, the existence of both positive and negative (local) regression coefficients may indicate the dominance of a quadratic relationship, typical of a ‘suburban fertility’ regime (Zambon et al. 2020).
Y(s) = X(s)B(s) + e(s)
3. Results
3.1. Fertility Rates in Athens: A Descriptive Analysis
Descriptive statistics illustrate a marked spatial variability in birth rates across administrative partitions in the study area, changing (more or less rapidly) over time. Focusing on the last three decades, Table 1 illustrates the spatial distribution of a general fertility rate across NUTS-3 regional units in Attica. The largest change in birth rates was observed in mixed settlements outside the Greater Athens’ area, especially in West Attica and, less intensively, in East Attica. West Attica maintained the highest fertility levels in the area since decades, being less sensitive to economic downturns and social transformations. Noneconomic, local factors were supposed to be particularly important in this case and require further investigation. In both cases (West and East Attica), it is not possible to delineate a direct relationship between suburban fertility and the local context, since these settlements were basically mixed—including medium-density, widely recognized suburban districts and low-density, traditional rural areas. Central Athens was the district with the most stable (and low) birth rates in the study area.
The highest and lowest rates were observed respectively in the 2000s and the 1990s, in correspondence with a short-term economic expansion (culminating with the 2004 Olympic Games) and a more persistent stagnation associated with the late stage of a prolonged fertility decline overpassing the 1970s, the 1980s, and a large part of the 1990s in Greece. Predominant urban settlements (sometimes mixed with rural areas and insular contexts), characteristic of the Piraeus regional unit, showed relatively low and stable birth rates—just slightly higher than Central Athens. Fringe districts (such as Northern, Western, and Southern Athens regional units) positioned in between Central Athens and the surrounding (non-urban) areas, showed a marked spatial variability as far as fertility levels are concerned. Taken together, the empirical analysis of these preliminary results indicates a substantial heterogeneity in birth rates that cannot be explained with factors directly associated with population density and urban agglomeration. In other words, regional units—despite representing well-established statistical domains for spatial analysis—may reveal incoherent, uninformative, or sometimes inconsistent demographic evidence. Such findings justify a refined investigation of fertility dynamics using a more accurate spatial scale—e.g., municipalities.
3.2. Exploratory Analysis of Fertility Rates (1956–2020)
Results of an exploratory, multivariate analysis of the spatial distribution of birth rates in the study area are illustrated in Figure 3, using a biplot projecting birth rates for nine observation years (1956, 1960, 1970, 1980, 1990, 2000, 2008, 2016, 2020), augmented with the mean distance from downtown Athens (‘dAth’). Municipalities were classified in three distance classes from the inner city. A Principal Component Analysis extracted two main axes (out of 10 input variables), explaining 71.2% of the total variance. Axis 1 (54.2%) delineated a typical rural–urban gradient clustering birth rates between 1956 and 1990 along the positive side, as opposed to the distance from downtown Athens (receiving a negative loading). Axis 2 (17.0%) delineated a more subtle ‘suburban divide’, with municipalities experiencing intense suburbanization located at intermediate distances from Athens and receiving systematically positive scores. Birth rates between 2000 and 2020 were positively associated with Axis 2.
Assuming orthogonal components (i.e., positioned at a 90° angle in the biplot) as multivariate independent, fertility dynamics along the urban–rural gradient resulted as independent from more recent dynamics along the urban–suburban gradient. Such dynamics have represented two distinctive spatial fertility regimes—likely reflecting different demographic behaviors and the effect of varying background (socioeconomic) conditions. The biplot finally outlined the position of inner city (<10 km), fringe settlements (10–20 km), and peripheral municipalities (>20 km from downtown). Despite a moderate heterogeneity, central municipalities were concentrated along the positive side of Axis 1, fringe municipalities moved through the positive side of Axis 2 and, finally, more peripheral municipalities were clustered toward the negative side of Axis 1. The results of this exploratory analysis justify a refined investigation of the relationship between general fertility rates and the distance from downtown Athens based on simple econometrics, testing over time (i) the significance of linear or quadratic specifications and (ii) the relevance of a ‘suburban fertility hypothesis’ for the study area. Results of this specific analysis are reported in the following paragraph.
3.3. Global Models Specifying Fertility Rates as a Function of the Distance from Downtown
Considering a broader time interval encompassing more than 150 years, Table 2 illustrates the results of econometric models estimating the relationship between birth rates and the distance from downtown Athens using linear or polynomial specifications. The results for both 1860 and 1884 were based on a small set of municipal geographies (i.e., local districts) covering the entire study area and should, therefore, be taken as preliminary and indicative of more general spatial trends, because of the restricted sample size (n = 12). The administrative structure of municipalities since 1956 (n = 115) was, instead, representative of the main geographical gradients in the study area. Results of the linear (or quadratic) models were significant for all time points investigated, although with a different goodness-of-fit—outlining the importance of the metropolitan gradient shaping local birth rates in the area. Results of a gain index comparing the goodness-of-fit of linear and quadratic specifications documented how the linear model provided the most parsimonious description of the fertility–distance relationship over more than one century (1860–1990). Improvements in the adjusted R2 of the quadratic model were systematically below 10% and statistically insignificant. Adjusted R2 coefficients were in turn largely variable, reaching the highest value in 1980.
Results of the linear specification documented an evident shift in the regression slope between the first two observation times (positive coefficients for 1860 and 1884) and the subsequent times (negative coefficients between 1956 and 1990, persisting afterwards). Positive coefficients demonstrated that local fertility increased with the distance from downtown Athens (i.e., rural fertility surpassed urban fertility in a pre-transitional state). As expected, the regression slope decreased between 1860 and 1884. The more intense (negative) slope was, in turn, observed for 1956. In general, negative coefficients indicated that local fertility decreased with the distance from downtown Athens (i.e., urban fertility surpassed rural fertility in a post-transitional state). The higher (explicative) power of linear specifications also suggests that more complex spatial effects, i.e., along the distance gradient, were negligible—at least up to the early 1990s. Such effects were in turn more evident in the last four observation years (2000, 2008, 2016, 2020); and econometric results delineated a significant gain in the adjusted R2 moving from linear to squared specifications.
The comparative analysis of econometric models’ goodness-of-fit suggests that other factors—in addition to density/distance gradients—can influence local fertility levels in the study area. However, the differential outcomes of econometric models in correspondence with specific years (e.g., 1980 and, in some ways, 2000 and 2016) confirm the impact of the metropolitan gradient on birth rates. The first year (1980) was regarded as the breakpoint of a prolonged stage of compact urbanization and the starting point of an already long suburbanization phase. The second year (2000) included a relatively short time interval encompassing the last economic expansion in Greece. The third year (2016) marked a slow (economic—more than demographic) recovery after a prolonged recession. In line with the ‘suburban fertility hypothesis’, estimation of the distance from downtown Athens corresponding with the highest fertility levels finally indicates a peak progressively moving from fringe districts (average distance: 6.6 km in 2000) to more peripheral areas (average distance: 10.8 km in 2020).
3.4. Non-Metric Multidimensional Scaling Tracing the Evolution of Fertility Regimes
A non-metric Multidimensional Scaling (n-MDS), a non-parametric ordination technique summarizing similarity or dissimilarity in a set of quantities evolving over time, was run on the results of the global econometric models (see Table 2) estimating the (linear or quadratic) relationship between birth rates and the distance from downtown Athens—assuming a monocentric model. For each investigated year, the regression coefficients entering the analysis were chosen with the aim of providing a comprehensive picture of the econometric results considering nonredundant (or slightly redundant) input variables. Basing on the analysis of the regression coefficients, n-MDS outlined the evolution of the dominant fertility regime along the distance gradient—i.e., highlighting the transition from a dominant ‘rural’ fertility regime (1860) to a dominant ‘urban’ one (1956). Ordering stability was tested by comparing two similarity metrics (Euclidean and Manhattan) widely used in the exploratory analysis of socioeconomic phenomena.
We illustrated the results of the analysis by means of two plots representing variables (seven regression coefficients) and observations (11 years) separately, delineating the latent dynamics of the regional system (Figure 4). The first two coordinates of n-MDS accounted for a satisfactory proportion of total inertia (92%), similarly for the Euclidean and Manhattan metrics, displaying a very low stress index (ϕ = 0.03) in both cases. The position of the variables and observations in the plots suggests how the two n-MDS coordinates identified the urban–suburban gradient along Axis 1 and the urban–rural gradient along Axis 2. Since Axis 1 accounted for a proportion of inertia largely higher than Axis 2 (around 90% in both cases), it can be said that the transition from an ‘urban’ fertility regime (1956–1990) to a more recent (2000–2020) ‘suburban’ fertility regime was particularly intense and continuous over time. Although evident from Axis 2, the transition from a regime dominated by ‘rural’ fertility (1860, 1884) to an ‘urban’ fertility regime was likely slower and less intense. The coefficients of the linear model were clearly differentiated along the urban–rural gradient: greater values of the intercept were associated with a ‘rural’ fertility regime, and greater values of the slope were associated with the ‘urban’ regime. On the contrary, the regression coefficients of the quadratic model evolved clearly with the urban–suburban gradient. More precisely, a0 coefficients increased with the dominance of the ‘urban’ fertility regime, while the a1 coefficients and, consequently, the gain in R2 moving from linear to quadratic specification (which, in turn, demonstrates the validity of the suburban fertility hypothesis) were associated with a dominant ‘suburban’ fertility regime.
3.5. Local Regressions Estimating the Relationship between Fertility and the Metropolitan Gradient
Assuming a monocentric model for Athens’ long-term urban expansion, the relationship between local birth rates and the average distance from the inner city was explored at the municipal scale, testing the significance of linear or quadratic forms with the use of Geographically Weighted Regressions (GWRs). The models’ outcomes referring to three paradigmatic observation times (1956, 1990, 2016; in accordance with the empirical results illustrated above) were reported in Figure 5; the left and right panels, respectively, represented local R2 and slope coefficients. Global R2 declined with time (1956: 0.27; 1990: 0.20; 2016: 0.12), confirming the role of exogenous factors influencing local birth rates in the study area. Spatially explicit models—such as the GWRs—were able to capture and describe the latent (territorial) heterogeneity in fertility levels, which were made more evident in recent years, in correspondence with late stages of suburbanization and the end of the second demographic transition in the study area.
In the first observation year (1956), local R2 increased rapidly moving from central to peripheral locations in Attica (Figure 5). The highest values (usually > 0.4) were observed in northern Attica municipalities, forming a rural and marginal district 30–40 km far from Athens. The local regression slopes were negative and significant all over the study area. The intensity and significance of local slopes increased moving from peripheral districts to central locations, confirming the importance of the ‘urban–rural’ fertility divide. At that year, birth rates responded more rapidly to the distance gradient at central locations and less rapidly in fringe locations or even in peripheral, rural places. In the second observation year (1990), local R2 was higher in peripheral locations, while decreasing moderately in central locations. The local regression slopes were negative and significant all over the study area, apart from a small district in southeastern Attica. The intensity and significance of local slopes increased, when moving from peripheral districts to central locations. In the third observation year (2016), local R2 was relatively low everywhere, apart from a few municipalities in West Attica (totalizing goodness-of-fit coefficients higher than 0.2). Interestingly, two clusters of municipalities were identified with statistically significant coefficients and, respectively, positive and negative slopes. Positive coefficients were observed in strictly urban municipalities located within the Greater Athens’ basin. Negative coefficients were recorded in northern and West Attica—corresponding with rural and peripheral locations in the metropolitan areas. Intermediate locations—corresponding with suburban contexts—had insignificant slope coefficients.
The empirical results of local regressions confirm the existence of a polynomial (reverse-U shaped) relationship between local fertility and the distance from downtown Athens for 2016; fertility in urban settlements and rural areas responded, respectively, with positive and negative elasticity to the increasing distance from downtown. In line with the results of global regressions, local regressions also confirmed the validity of linear models for earlier observation years, at least up to the late 1990s. Slopes coefficients were systematically negative, supporting the hypothesis of higher urban fertility between 1956 and 1990.
4. Discussion
Assuming mixed evidence on the counter- or procyclical nature of fertility dynamics in Southern Europe (Butler 2004; Kalwij 2010; Zaidi and Morgan 2017), our study refines this interpretative framework with a specific investigation of local birth rates in Greece. By providing an original interpretation of the close interconnection between metropolitan cycles and sequential economic downturns (Remoundou et al. 2016; Salvati 2016; Bagavos et al. 2018), demographic transitions were explained as a sequence of (regional) fertility shifts from a ‘rural’ regime characteristic of the early stages of the first demographic transition to a model with dominant urban fertility—typical of later stages of the first demographic transition—moving, finally, toward higher suburban fertility (Oinonen 2004; Billari et al. 2007; De Beer and Deerenberg 2007). This shift reflects, at the same time, important socioeconomic transformations, underlying a slow change in the lifestyles and consumption of urban and rural populations that may depict the latent evolution of metropolises (Reher 2004; Garcia 2010; Pérez 2010).
Such exercise also provided, for more recent times, an empirical test of the ‘contextual hypothesis’ at the base of higher fertility levels at suburban locations (e.g., Halbac-Cotoara-Zamfir et al. 2021), verifying the significant role of local (socioeconomic) conditions at the base of systematically higher birth rates in suburbs (Oueslati et al. 2015). In accordance with earlier evidence (e.g., Egidi and Salvati 2021), the spatial variability of fertility levels may constitute an indicator of urban development, representing the evolutionary interaction of demographic dynamics with social change, business/housing cycles, and economic downturns at large (Bernardi 2005; Gkartzios and Scott 2015; Maloutas and Ramos Lobato 2015).
Results of the multistep analysis’ framework adopted here provided a complete representation of the dominant fertility regime in Attica—identifying a precise timing that links demographic transition, urban cycles, and economic dynamics (e.g., Salvati 2016). Our study specifically documented the progressive shift from a (pre-transition) spatial regime dominated by higher ‘rural’ fertility (1860–1884), to a transitional regime with a characteristic ‘urban’ fertility regime (1956–1990). During the long urbanization stage in Athens started with the unification of the Greek state (approximately since the 1830s), birth rates increased in urban settlements, slowly reducing in rural areas (Rontos et al. 2016). Differential fertility rates in urban and rural municipalities between 1884 and 1956 highlighted the enlarging polarization in dynamic/affluent neighborhoods and economically disadvantaged/marginal neighborhoods (Gavalas et al. 2014). These results confirm that fertility trends in the study area reflect different sensitivities to economic expansion and stagnation (e.g., Tragaki and Bagavos 2014, 2019), going beyond the effects of income and wealth accumulation—and responding to a geographical gradient based on social segregation, accessibility, and concentration of upper functions (Dijkstra et al. 2015). Although these dimensions have fueled substantial divides in fertility levels (Muniz 2009), the role of individual preferences cannot be demised and requires a specific investigation distinguishing rural from urban and suburban districts (Vitali and Billari 2017), despite the limited availability of coherent statistical data for earlier time points (e.g., Campisi et al. 2020).
The intrinsic coherence of our observed trends with the ‘suburban fertility hypothesis’ was more evident in the last two decades, namely between 2000 and 2020, although with some differences found in the local context during the two phases of economic expansion and recession. These results are in line with what was observed in Greece (Halbac-Cotoara-Zamfir et al. 2021) and in other Mediterranean countries (e.g., Spain: Burillo et al. 2020; Italy: Salvati et al. 2020). These findings are also in line with earlier evidence collected for other European contexts and at different spatial scales (e.g., Kohler et al. 2002; Morgan 2003; Kreyenfeld 2010; Goldstein et al. 2013; Salvati et al. 2013). While suburban–urban fertility divides were relatively mild before the 1990s, demographic heterogeneity in urban, suburban, and rural settlements increased substantially in the last three decades, giving further evidence to the ‘suburban fertility hypothesis’ (Caltabiano et al. 2009; Kreyenfeld et al. 2012; Cherlin et al. 2013).
From this perspective, the inherent stability of birth rates over three subperiods (declining slightly during 1991–2000, increasing until the crisis of 2008–2009, then decreasing again from 2010 onward) should be reconnected with the heterogeneous pattern observed at the municipal scale (e.g., Zambon and Salvati 2019). Differential outcomes across spatial scales (e.g., from regional to local) indicate the urgent need of reinforcing the provision of reliable official statistics at disaggregated territorial levels that cover sufficiently long time intervals (e.g., Burillo et al. 2020). For instance, local fertility in some districts, such as Western and Southern Athens, was less coherent with the general trend observed in other districts of Greater Athens and requires a deeper analysis of the intimate sources of local heterogeneity in fertility behaviors (sensu Vitali and Billari 2017; Campisi et al. 2020; Rodrigo-Comino et al. 2021). This pattern seems to be poorly explained by the different socioeconomic composition of neighborhoods, which are more affluent in Southern Athens—mostly residential settlements along the sea coast—and relatively more disadvantaged in Western Athens, a regional unit that includes a well-established industrial settlement placed in-between Athens and Piraeus (Maloutas 2007; Rontos et al. 2016; Panori et al. 2019). Additionally, the weak fertility response to economic downturns in low-fertility districts seems to be associated with a very complex interplay of ‘structural’ and ‘contextual’ factors (e.g., Di Feliciantonio et al. 2018), led by persistent unemployment, poverty, aging, and urban shrinkage and a progressive depopulation of rural areas—indirectly reducing the childbearing propensity of the remaining young families (Chorianopoulos et al. 2014; Tragaki and Bagavos 2014; Rontos and Salvati 2020; Zambon et al. 2020). Following Halbac-Cotoara-Zamfir et al. (2021), “a refined investigation of social forces and economic mechanisms that underlie the differential fertility of peri-urban industrial areas and residential (non-industrial) suburban districts is needed in a changing metropolitan context, such as Athens”. Investigations based on integrated micro–macro data and field surveys will provide a particularly novel contribution in this research direction (e.g., Michielin 2004; Gavalas et al. 2014; Tragaki and Bagavos 2019).
In this regard, a specific focus on the ethnic composition of Athens’ districts seems to be appropriate, considering that the last three decades witnessed a significant influx of non-Western immigrants to Greece (Salvati and Benassi 2021). Assuming fertility levels among non-European immigrant groups are higher than those characteristic of native populations in the host country (e.g., Fernandez and Fogli 2009; Azarnert 2010; Wilson 2019), differential immigrants’ fertility could explain the low birth rates typical of rural areas (with a low density of non-native population), while only partially justifying the higher suburban fertility, in respect to urban settlements with the highest density of the non-native population in Greece (Salvati and Benassi 2021). However, some suburban municipalities with high density of resident immigrants, such as Thriasio plain in the prefecture of West Attica, have experienced systematically high birth rates in the last decades (Egidi and Salvati 2021), confirming—at least indirectly—the differential contribution of native and foreign population to aggregate fertility levels. However, it should also be noted how this contribution was reduced with the huge decline of immigrant inflows driven by the 2008–2009 recession (Rontos and Salvati 2020). Additionally, despite a temporary recovery in the late 2010s, it is reasonable to suppose a further decrease in 2020 and 2021 because of the COVID-19 pandemic. The role of non-Western immigrants in spatially differentiated fertility recovery between 2000 and 2010 and the consequent reduction in the following decade should be more clearly addressed using micro data from administrative registers and (official statistic) sampling surveys—when available—and the new population census held in 2021 (e.g., Salvati and Serra 2016). Unfortunately, statistical information derived from population registers and sampling surveys in Greece is partial (Salvati and Benassi 2021) and does not allow a specific investigation of this issue at a detailed spatial scale, in contrast with other Mediterranean contexts (Benassi et al. 2020).
A specific focus on education issues, considering, e.g., the so-called ‘educational white flight’, could represent a relevant dimension of further investigation. This process implies a spatial pattern that distinguishes urban-dense settlements (where the native population usually prefers to send their children to expensive private schools) from more segregated suburban settlements, where the student population in public schools is almost entirely native and where people show much lower interest in private education (Azarnert 2014). As private education is more expensive, the private school choice may coincide with a lower fertility choice (Lankford and Wyckoff 2006). This socioeconomic process—typical of urban and suburban contexts in the United States—seems to be less intense in the European context and particularly heterogeneous—or even absent—in Mediterranean agglomerations (Maloutas et al. 2019), where an evident social mix was characteristic of both downtown and suburban neighborhoods (Maloutas 2007; Di Feliciantonio and Salvati 2015; Panori et al. 2019).
Being unsatisfactorily explained with the different socioeconomic composition of neighborhoods and selected micro-scale determinants traditionally associated with differential demographic dynamics across regions (e.g., Vitali and Billari 2017), our results, when taken all together, justify a deeper analysis of the intimate sources of local heterogeneity in fertility behaviors at both the local and metropolitan levels of investigation (Boyle 2003; Lesthaeghe and Neidert 2006; Williamson and Norman 2011). Integration of micro–macro data and comparative approaches across spatial and temporal scales will definitely contribute to such deserving issue in spatial demography (Bongaarts and Watkins 1996; Caldwell and Schindlmayr 2003; Campisi et al. 2020). A specific analysis of the social composition of urban, suburban, and rural settlements— also focusing on immigrant populations—seems to be particularly appropriate in these regards when new or updated statistics and indicators become available. Some preliminary evidence (e.g., Hondroyiannis and Papapetrou 2002; Arapoglou and Sayas 2009; Kaika 2012) depicts a fragmented and less predictable social-context characteristic of Southern European regions and cities. From such perspectives, noneconomic forces could be better understood when explaining the low fertility rates typical of rural areas (first) and urban settlements (later on) along with the first demographic transition and the shift toward a spatial model dominated by suburban fertility along with the second demographic transition.
5. Conclusions
Accounting together for territorial heterogeneity and socioeconomic change, the spatial analysis of fertility rates sheds light on the intimate mechanisms regulating local fertility in metropolitan regions and delineates new opportunities for regional development policy. In a low-fertility context, policies promoting a spatially balanced (and socially cohesive) metropolitan development should consider specific economic measures supporting families (e.g., those under the poverty line) and counteracting the negative impact of recession. A comprehensive knowledge of the socioeconomic profile of urban, suburban, and rural settlements displaying distinctive fertility trends, forms the appropriate knowledge base for such policies—in turn, contributing to urban sustainability and metropolitan resilience to external shocks. While being increasingly associated with lifestyle changes, future studies should clarify the role of fertility decrease in suburban locations as an indicator of the progressive decline of some typical forms of urban growth—including sprawl. Fertility patterns may reflect—sometimes better than economic indicators—inequality trends in metropolitan regions, informing strategies toward more cohesive and sustainable cities.
Author Contributions
Conceptualization, L.S. and F.C.; methodology, C.V. and S.S.N.; software, B.N. and R.T.; validation, C.V. and B.N.; formal analysis, L.S. and F.C.; investigation, B.N.; resources, S.S.N.; data curation, C.V.; writing—original draft preparation, L.S. and S.S.N.; writing—review and editing, F.C. and C.V.; visualization, B.N. and R.T.; supervision, R.T.; project administration, B.N. All authors have read and agreed to the published version of the manuscript.
Funding
This research received no external funding.
Institutional Review Board Statement
Not applicable.
Informed Consent Statement
Not applicable.
Data Availability Statement
The data presented in this study are available on request from the corresponding author.
Conflicts of Interest
The authors declare no conflict of interest.
References
- Adserà, Alicia. 2004. Changing fertility rates in developed countries. The impact of labor market institutions. Journal of Population Economics 17: 17–43. [Google Scholar] [CrossRef]
- Adserà, Alicia. 2006. An economic analysis of the gap between desired and actual fertility: The case of Spain. Review of Economics of the Household 4: 75–95. [Google Scholar] [CrossRef]
- Ali, Kamar, Mark D. Partridge, and M. Rose Olfert. 2007. Can geographically weighted regressions improve regional analysis and policy making? International Regional Science Review 30: 300–29. [Google Scholar] [CrossRef]
- Angel, Shlomo, Jason Parent, Daniel L. Civco, Alexander Blei, and David Potere. 2011. The dimensions of global urban expansion: Estimates and projections for all countries, 2000–2050. Progress in Planning 75: 53–107. [Google Scholar] [CrossRef]
- Arapoglou, Vasilis P., and John Sayas. 2009. New facets of urban segregation in southern Europe—gender, migration and social class change in Athens. European Urban and Regional Studies 16: 345–62. [Google Scholar] [CrossRef]
- Arpino, Bruno, and Lara Patrício Tavares. 2013. Fertility and values in Italy and Spain: A look at regional differences within the European context. Population Review 52: 62–86. [Google Scholar]
- Azarnert, Leonid V. 2010. Immigration, fertility, and human capital: A model of economic decline of the West. European Journal of Political Economy 26: 431–40. [Google Scholar] [CrossRef] [Green Version]
- Azarnert, Leonid V. 2014. Integrated public education, fertility and human capital. Education Economics 22: 166–80. [Google Scholar] [CrossRef] [Green Version]
- Azarnert, Leonid V. 2019. Migration, congestion and growth. Macroeconomic Dynamics 23: 3035–64. [Google Scholar] [CrossRef] [Green Version]
- Bagavos, Christos, Georgia Verropoulou, and Cleon Tsimbos. 2018. Assessing the contribution of foreign women to period fertility in Greece, 2004–2012. Population 73: 115–30. [Google Scholar]
- Balbo, Nicoletta, Francesco C. Billari, and Melinda Mills. 2013. Fertility in advanced societies: A review of research. European Journal of Population 29: 1–38. [Google Scholar] [CrossRef] [PubMed] [Green Version]
- Bayona-Carrasco, Jordi, and Fernando Gil-Alonso. 2012. Suburbanisation and international immigration: The case of the Barcelona Metropolitan Region (1998–2009). Tijdschrift voor Economische en Sociale Geographie 103: 312–29. [Google Scholar] [CrossRef]
- Benassi, Federico, and Luca Salvati. 2019. Economic downturns and compositional effects in regional population structures by age: A multi-temporal analysis in Greek regions, 1981–2017. Quality & Quantity 53: 2611–33. [Google Scholar]
- Benassi, Federico, and Luca Salvati. 2020. Urban cycles and long-term population trends in a Southern European city: A demographic outlook. Applied Spatial Analysis and Policy 13: 777–803. [Google Scholar] [CrossRef]
- Benassi, Federico, Ricardo Iglesias-Pascual, and Luca Salvati. 2020. Residential segregation and social diversification: Exploring spatial settlement patterns of foreign population in Southern European cities. Habitat International 101: 102200. [Google Scholar] [CrossRef]
- Bernardi, Fabrizio. 2005. Public policies and low fertility: Rationales for public intervention and a diagnosis for the Spanish case. Journal of European Social Policy 15: 123–38. [Google Scholar] [CrossRef]
- Billari, Francesco C., Hans Peter Kohler, Gunnar Andersson, and Hans Lundström. 2007. Approaching the limit: Long-term trends in late and very late fertility. Population and Development Review 33: 149–70. [Google Scholar] [CrossRef]
- Billari, Francesco, and Hans Peter Kohler. 2004. Patterns of low and lowest-low fertility in Europe. Population Studies 58: 161–76. [Google Scholar] [CrossRef]
- Bocquier, Philippe, and Rafael Costa. 2015. Which transition comes first? Urban and demographic transitions in Belgium and Sweden. Demographic Research 33: 1297–332. [Google Scholar] [CrossRef] [Green Version]
- Bocquier, Philippe, and Sandra Bree. 2018. A regional perspective on the economic determinants of urban transition in 19th-century France. Demographic Research 38: 1535–76. [Google Scholar] [CrossRef] [Green Version]
- Bongaarts, John, and Susan Cotts Watkins. 1996. Social Interactions and Contemporary Fertility Transitions. Population and Development Review 22: 639–82. [Google Scholar] [CrossRef]
- Bongaarts, John. 2009. Human population growth and the demographic transition. Philosophical Transactions of the Royal Society B: Biological Sciences 364: 2985–90. [Google Scholar] [CrossRef] [PubMed] [Green Version]
- Borg, Ingwer, and Patrick J. Groenen. 2005. Modern Multidimensional Scaling: Theory and Applications. Berlin: Springer Science & Business Media. [Google Scholar]
- Boyle, Paul. 2003. Population geography: Does geography matter in fertility research? Progress in Human Geography 27: 615–26. [Google Scholar] [CrossRef]
- Buckley, Cynthia. 1998. Rural/urban differentials in demographic processes: The Central Asian states. Population Research and Policy Review 17: 71–89. [Google Scholar] [CrossRef]
- Burillo, Pilar, Luca Salvati, Stephen A. Matthews, and Federico Benassi. 2020. Local-Scale Fertility Variations in a Low-Fertility Country: Evidence from Spain (2002–2017). Canadian Studies in Population 47: 279–95. [Google Scholar] [CrossRef]
- Butler, Declan. 2004. The fertility riddle. Nature 432: 38–39. [Google Scholar] [CrossRef]
- Buzar, Stefan, Philip E. Ogden, and Ray Hall. 2005. Households matter: The quiet demography of urban transformation. Progress in Human Geography 29: 413–36. [Google Scholar] [CrossRef]
- Cabré, Anna. 2003. Facts and Factors on Low Fertility in Southern Europe. The Case of Spain. Journal of Population and Social Security (Population) 2003: 309–21. [Google Scholar]
- Caldwell, John C. 2006. Demographic Transition Theory. Berlin: Springer. [Google Scholar]
- Caldwell, John C., and Thomas Schindlmayr. 2003. Explanations of the fertility crisis in modern societies: A search for commonalities. Population Studies 57: 241–63. [Google Scholar] [CrossRef]
- Caltabiano, Marcantonio, Maria Castiglioni, and Alessandro Rosina. 2009. Lowest-low fertility: Signs of a recovery in Italy? Demographic Research 21: 681–718. [Google Scholar] [CrossRef] [Green Version]
- Caltabiano, Marcantonio. 2008. Has the fertility decline come to an end in the different regions of Italy? New insights from a cohort approach. Population 63: 157–72. [Google Scholar] [CrossRef]
- Campisi, Nicholas, Hill Kulu, Julia Mikolai, Sebastian Klüsener, and Mikko Myrskylä. 2020. Spatial variation in fertility across Europe: Patterns and determinants. Population, Space and Place 26: e2308. [Google Scholar] [CrossRef]
- Canning, David. 2011. The causes and consequences of demographic transition. Population Studies 65: 353–61. [Google Scholar] [CrossRef] [PubMed]
- Carbonaro, Gianni, Eugenio Leanza, Philip McCann, and Francesca Medda. 2018. Demographic decline, population aging, and modern financial approaches to urban policy. International Regional Science Review 41: 210–32. [Google Scholar] [CrossRef]
- Carlucci, Margherita, Efstathios Grigoriadis, Kostas Rontos, and Luca Salvati. 2017. Revisiting a hegemonic concept: Long-term ‘Mediterranean urbanization’in between city re-polarization and metropolitan decline. Applied Spatial Analysis and Policy 10: 347–62. [Google Scholar] [CrossRef]
- Carlucci, Margherita, Francesco M. Chelli, and Luca Salvati. 2018. Toward a new cycle: Short-term population dynamics, gentrification, and re-urbanization of Milan (Italy). Sustainability 10: 3014. [Google Scholar]
- Cecchini, Massimo, Ilaria Zambon, Antonella Pontrandolfi, Rosario Turco, Andrea Colantoni, Anastasios Mavrakis, and Luca Salvati. 2019. Urban sprawl and the ‘olive’ landscape: Sustainable land management for ‘crisis’ cities. GeoJournal 84: 237–55. [Google Scholar] [CrossRef]
- Cherlin, Andrew, Erin Cumberworth, S. Philip Morgan, and Christopher Wimer. 2013. The effects of the Great Recession on family structure and fertility. The Annals of the American Academy of Political and Social Science 650: 214–23. [Google Scholar] [CrossRef]
- Chi, Guangqing, and Jun Zhu. 2008. Spatial regression models for demographic analysis. Population Research and Policy Review 27: 17–42. [Google Scholar] [CrossRef]
- Chorianopoulos, Ioannis, Georgios Tsilimigkas, Sotirios Koukoulas, and Thomas Balatsos. 2014. The shift to competitiveness and a new phase of sprawl in the Mediterranean city: Enterprises guiding growth in Messoghia–Athens. Cities 39: 133–43. [Google Scholar] [CrossRef]
- Ciommi, Mariateresa, Francesco M. Chelli, and Luca Salvati. 2019. Integrating parametric and non-parametric multivariate analysis of urban growth and commuting patterns in a European metropolitan area. Quality and Quantity 53: 957–79. [Google Scholar] [CrossRef]
- Ciommi, Mariateresa, Francesco M. Chelli, Margherita Carlucci, and Luca Salvati. 2018. Urban growth and demographic dynamics in southern Europe: Toward a new statistical approach to regional science. Sustainability 10: 2765. [Google Scholar] [CrossRef] [Green Version]
- Coppola, Lucia, and Mariachiara Di Cesare. 2008. How fertility and union stability interact in shaping new family patterns in Italy and Spain. Demographic Research 18: 117–44. [Google Scholar] [CrossRef] [Green Version]
- De Beer, Joop, and Ingeborg Deerenberg. 2007. An explanatory model for projecting regional fertility differences in the Netherlands. Population Research and Policy Review 26: 511–28. [Google Scholar] [CrossRef] [Green Version]
- De Castro, Marcia Caldas. 2007. Spatial demography: An opportunity to improve policy making at diverse decision levels. Population Research and Policy Review 26: 477–509. [Google Scholar] [CrossRef]
- Di Feliciantonio, Cesare, and Luca Salvati. 2015. ‘Southern’ Alternatives of Urban Diffusion: Investigating Settlement Characteristics and Socio-Economic Patterns in Three Mediterranean Regions. Tijdschrift voor Economische en Sociale Geografie 106: 453–70. [Google Scholar] [CrossRef]
- Di Feliciantonio, Cesare, Luca Salvati, Efthymia Sarantakou, and Kostas Rontos. 2018. Class diversification, economic growth and urban sprawl: Evidences from a pre-crisis European city. Quality & Quantity 52: 1501–22. [Google Scholar]
- Dijkstra, Lewis, Enrique Garcilazo, and Philip McCann. 2015. The effects of the global financial crisis on European regions and cities. Journal of Economic Geography 15: 935–49. [Google Scholar] [CrossRef]
- Doignon, Yoann, Elena Ambrosetti, and Sara Miccoli. 2021. The spatial diffusion of fertility decline in Egypt (1950–2006). Genus 77: 1–30. [Google Scholar] [CrossRef]
- Duvernoy, Isabelle, Ilaria Zambon, Adele Sateriano, and Luca Salvati. 2018. Pictures from the other side of the fringe: Urban growth and peri-urban agriculture in a post-industrial city (Toulouse, France). Journal of Rural Studies 57: 25–35. [Google Scholar] [CrossRef]
- Dyson, Tim. 2011. The role of the demographic transition in the process of urbanization. Population and Development Review 37: 34–54. [Google Scholar] [CrossRef]
- Egidi, Gianluca, and Luca Salvati. 2021. Changes over time in the spatial structure of fertility rates as a dynamic indicator of urban transformations. Quality & Quantity 55: 151–72. [Google Scholar]
- Evans, Ann, and Edith Gray. 2018. Modelling Variation in Fertility Rates Using Geographically Weighted Regression. Spatial Demography 6: 121–40. [Google Scholar] [CrossRef] [Green Version]
- Feng, Wang. 2011. The future of a demographic overachiever: Long-term implications of the demographic transition in China. Population and Development Review 37: 173–90. [Google Scholar] [CrossRef] [PubMed]
- Fernandez, Raquel, and Alessandra Fogli. 2009. Culture: An empirical investigation of beliefs, work, and fertility. American Economic Journal: Macroeconomics 1: 146–77. [Google Scholar] [CrossRef] [Green Version]
- Ferrara, Agostino, Claire Kelly, Geoff A. Wilson, Angelo Nolè, Giuseppe Mancino, Sofia Bajocco, and Luca Salvati. 2016. Shaping the role of ‘fast’ and ‘slow’ drivers of change in forest-shrubland socio-ecological systems. Journal of Environmental Management 169: 155–66. [Google Scholar] [CrossRef] [Green Version]
- Fotheringham, Alexander S., Chris Brunsdon, and Martin Charlton. 2003. Geographically Weighted Regression: The Analysis of Spatially Varying Relationships. London: Wiley. [Google Scholar]
- Frejka, Tomas, and Tomáš Sobotka. 2008. Fertility in Europe: Diverse, delayed and below replacement. Demographic Research 19: 15–46. [Google Scholar] [CrossRef]
- Galor, Oded. 2005. The demographic transition and the emergence of sustained economic growth. Journal of the European Economic Association 3: 494–504. [Google Scholar] [CrossRef]
- Garcia, Marisol. 2010. The breakdown of the Spanish urban growth model: Social and territorial effects of the global crisis. International Journal of Urban and Regional Research 34: 967–80. [Google Scholar] [CrossRef] [Green Version]
- Gavalas, Vasilis S., Kostas Rontos, and Luca Salvati. 2014. Who becomes an unwed mother in Greece? Socio-demographic and geographical aspects of an emerging phenomenon. Population, Space, and Place 20: 250–63. [Google Scholar] [CrossRef]
- Georgiadis, Katerina. 2011. Fertile debates: A comparative account of low fertility in the British and Greek national press. European Journal of Population 27: 243–62. [Google Scholar] [CrossRef] [Green Version]
- Gil-Alonso, Fernando, Jordi Bayona-i-Carrasco, and Isabel Pujadas-i-Rúbies. 2016. From boom to crash: Spanish urban areas in a decade of change (2001–2011). European Urban and Regional Studies 23: 198–216. [Google Scholar] [CrossRef]
- Gkartzios, Menelaos, and Karen Scott. 2015. A cultural panic in the province? Counterurban mobilities, creativity, and crisis in Greece. Population, Space and Place 21: 843–55. [Google Scholar] [CrossRef] [Green Version]
- Gkartzios, Menelaos. 2013. ‘Leaving Athens’: Narratives of counterurbanisation in times of crisis. Journal of Rural Studies 32: 158–67. [Google Scholar] [CrossRef]
- Goldstein, Joshua R., and Sebastian Klüsener. 2014. Spatial analysis of the causes of the fertility decline in Prussia. Population and Development Review 40: 497–525. [Google Scholar] [CrossRef]
- Goldstein, Joshua R., Tomáš Sobotka, and Aliva Jasilioniene. 2009. The end of lowest-low fertility? Population and Development Review 35: 663–700. [Google Scholar] [CrossRef]
- Goldstein, Joshua, Michaela Kreyenfeld, Aliva Jasilioniene, and Deniz Karaman Örsal. 2013. Fertility reactions to the “Great Recession” in Europe: Recent evidence from order-specific data. Demographic Research 29: 85–104. [Google Scholar] [CrossRef]
- Guilmoto, Christophe Z., and S. Irudaya Rajan. 2001. Spatial patterns of fertility transition in Indian districts. Population and Development Review 27: 713–38. [Google Scholar] [CrossRef]
- Haase, Annegret, Sigrun Kabisch, Annett Steinführer, Stefan Bouzarovski, Ray Hall, and Philip Ogden. 2010. Spaces of reurbanisation: Exploring the demographic dimension of inner-city residential change in a European setting. Population, Space and Place 16: 443–63. [Google Scholar] [CrossRef]
- Halbac-Cotoara-Zamfir, Rares, Gianluca Egidi, Rosanna Salvia, Luca Salvati, Adele Sateriano, and Antonio Gimenez-Morera. 2021. Recession, Local Fertility, and Urban Sustainability: Results of a Quasi-Experiment in Greece, 1991–2018. Sustainability 13: 1052. [Google Scholar] [CrossRef]
- Hank, Karsten. 2002. Regional social contexts and individual fertility decisions: A multilevel analysis of first and second births in western Germany. European Journal of Population 18: 281–99. [Google Scholar] [CrossRef]
- Hondroyiannis, George, and Evangelia Papapetrou. 2002. Demographic transition and economic growth: Empirical evidence from Greece. Journal of Population Economics 15: 221–42. [Google Scholar] [CrossRef]
- Işik, Oğuz, and M. Melih Pinarcioglu. 2006. Geographies of a silent transition: A geographically weighted regression approach to regional fertility differences in Turkey. European Journal of Population 22: 399–421. [Google Scholar] [CrossRef]
- Kabisch, Nadja, and Dagmar Haase. 2011. Diversifying European agglomerations: Evidence of urban population trends for the 21st century. Population, Space and Place 17: 236–53. [Google Scholar] [CrossRef]
- Kaika, Maria. 2012. The economic crisis seen from the everyday: Europe’s nouveau poor and the global affective implications of a ‘local’ debt crisis. City 16: 422–30. [Google Scholar] [CrossRef]
- Kalwij, Adriaan. 2010. The impact of family policy expenditure on fertility in Western Europe. Demography 47: 503–19. [Google Scholar] [CrossRef]
- Kohler, Hans Peter, Francesco C. Billari, and José Antonio Ortega. 2002. The emergence of lowest-low fertility in Europe during the 1990s. Population and Development Review 28: 641–80. [Google Scholar] [CrossRef]
- Kreyenfeld, Michaela, Gunnar Andersson, and Ariane Pailhé. 2012. Economic uncertainty and family dynamics in Europe: Introduction. Demographic Research 27: 835–52. [Google Scholar] [CrossRef] [Green Version]
- Kreyenfeld, Michaela. 2010. Uncertainties in female employment careers and the postponement of parenthood in Germany. European Sociological Review 26: 351–66. [Google Scholar] [CrossRef] [Green Version]
- Kroll, Franziska, and Nadja Kabisch. 2012. The relation of diverging urban growth processes and demographic change along an urban-rural gradient. Population, Space and Place 18: 260–76. [Google Scholar] [CrossRef]
- Kulu, Hill, and Andres Vikat. 2007. Fertility differences by housing type: The effect of housing conditions or of selective moves? Demographic Research 17: 775–802. [Google Scholar] [CrossRef] [Green Version]
- Kulu, Hill, and Paul J. Boyle. 2009. High fertility in city suburbs: Compositional or contextual effects? European Journal of Population 25: 157–74. [Google Scholar] [CrossRef] [Green Version]
- Kulu, Hill, Paul J. Boyle, and Gunnar Anderson. 2009. High suburban fertility: Evidence from four Northern European countries. Demographic Research 31: 915–44. [Google Scholar] [CrossRef] [Green Version]
- Kulu, Hill. 2013. Why do fertility levels vary between urban and rural areas? Regional Studies 47: 895–912. [Google Scholar] [CrossRef]
- Lamonica, Giuseppe Ricciardo, Gloria Polinesi, and Luca Salvati. 2022. Sprawl or Segregation? Local Fertility as a Proxy of Socio-spatial Disparities Under Sequential Economic Downturns. Social Indicators Research. [Google Scholar] [CrossRef]
- Lankford, Hamilton, and James Wyckoff. 2006. The effect of school choice and residential location on the racial segregation of students. In Advances in Applied Microeconomics. Edited by Timothy Gronberg and Dennis Jensen. Amsterdam: Emerald, vol. 14, pp. 185–239. [Google Scholar]
- Lauf, Steffen, Dagmar Haase, Ralf Seppelt, and Nina Schwarz. 2012. Simulating demography and housing demand in an urban region under scenarios of growth and shrinkage. Environment and Planning B: Planning and Design 39: 229–46. [Google Scholar] [CrossRef]
- Lee, Kwan Ok, and Gary Painter. 2013. What happens to household formation in a recession? Journal of Urban Economics 76: 93–109. [Google Scholar] [CrossRef] [Green Version]
- Lee, Ronald. 2003. The demographic transition: Three centuries of fundamental change. Journal of Economic Perspectives 17: 167–90. [Google Scholar] [CrossRef] [Green Version]
- Lerch, Mathias. 2013. Fertility decline during Albania’s societal crisis and its subsequent consolidation. European Journal of Population 29: 195–220. [Google Scholar] [CrossRef]
- Lerch, Mathias. 2014. The role of migration in the urban transition: A demonstration from Albania. Demography 51: 1527–50. [Google Scholar] [CrossRef] [Green Version]
- Lerch, Mathias. 2016. Internal and international migration across the urban hierarchy in Albania. Population Research and Policy Review 35: 851–76. [Google Scholar] [CrossRef] [Green Version]
- Lerch, Mathias. 2019. Regional variations in the rural-urban fertility gradients in global South. PLoS ONE 14: e0219624. [Google Scholar] [CrossRef] [Green Version]
- Lesthaeghe, Ron J., and Lisa Neidert. 2006. The second demographic transition in the United States: Exception or textbook example? Population and Development Review 32: 669–98. [Google Scholar] [CrossRef]
- Lesthaeghe, Ron, and Antonio Lopez-Gay. 2013. Spatial continuities and discontinuities in two successive demographic transitions: Spain and Belgium, 1880–2010. Demographic Research 28: 77–136. [Google Scholar] [CrossRef] [Green Version]
- Liu, Lee. 2005. Fertility trends in China’s more developed urban districts: The case of four cities. Population, Space and Place 11: 411–24. [Google Scholar] [CrossRef]
- López-Gay, Antonio, Andrea Andújar-Llosa, and Luca Salvati. 2020. Residential Mobility, Gentrification and Neighborhood Change in Spanish Cities: A Post-Crisis Perspective. Spatial Demography 8: 351–78. [Google Scholar] [CrossRef]
- Machado, J. Tenreiro, Gonçalo Monteiro Duarte, and Fernando B. Duarte. 2011. Identifying economic periods and crisis with the multidimensional scaling. Nonlinear Dynamics 63: 611–22. [Google Scholar] [CrossRef]
- Maloutas, Thomas, and Isabel Ramos Lobato. 2015. Education and social reproduction: Educational mechanisms and residential segregation in Athens and Dortmund. Local Economy 30: 800–17. [Google Scholar] [CrossRef]
- Maloutas, Thomas, Stavros Nikiforos Spyrellis, and Antoinetta Capella. 2019. Residential segregation and educational performance. The case of Athens. Urban Studies 56: 3143–61. [Google Scholar] [CrossRef]
- Maloutas, Thomas. 2007. Middle class education strategies and residential segregation in Athens. Journal of Education Policy 22: 49–68. [Google Scholar] [CrossRef]
- Michielin, Francesca. 2004. Lowest low fertility in an urban context: The role of migration in Turin, Italy. Population, Space and Place 10: 331–47. [Google Scholar] [CrossRef]
- Morelli, Vittorio Gargiulo, Kostas Rontos, and Luca Salvati. 2014. Between suburbanisation and re-urbanisation: Revisiting the urban life cycle in a Mediterranean compact city. Urban Research & Practice 7: 74–88. [Google Scholar]
- Morgan, S. Philip. 2003. Is low fertility a twenty-first-century demographic crisis? Demography 40: 589–603. [Google Scholar] [CrossRef] [PubMed]
- Muniz, Jeronimo O. 2009. Spatial dependence and heterogeneity in ten years of fertility decline in Brazil. Population Review 48: 32–65. [Google Scholar]
- Ogden, Philip E., and Ray Hall. 2000. Households, reurbanisation and the rise of living alone in the principal French cities 1975–90. Urban Studies 37: 367–90. [Google Scholar] [CrossRef]
- Oinonen, Eriikka. 2004. Starting the first family. Changes in patterns of family formation and demographic trends in Finland and Spain. European Societies 6: 319–46. [Google Scholar] [CrossRef]
- Oueslati, Walid, Seraphim Alvanides, and Guy Garrod. 2015. Determinants of urban sprawl in European cities. Urban Studies 52: 1594–614. [Google Scholar] [CrossRef] [Green Version]
- Panori, Anastasia, Yannis Psycharis, and Dimitris Ballas. 2019. Spatial segregation and migration in the city of Athens: Investigating the evolution of urban socio-spatial immigrant structures. Population Space and Place 25: e2209. [Google Scholar]
- Pérez, Jesús M. González. 2010. The real estate and economic crisis: An opportunity for urban return and rehabilitation policies in Spain. Sustainability 2: 1571–601. [Google Scholar] [CrossRef] [Green Version]
- Pili, Silvia, Efstathios Grigoriadis, Margherita Carlucci, Matteo Clemente, and Luca Salvati. 2017. Towards sustainable growth? A multi-criteria assessment of (changing) urban forms. Ecological Indicators 76: 71–80. [Google Scholar] [CrossRef]
- Pison, Gilles. 2011. Two children per woman in France in 2010: Is French fertility immune to economic crisis? Population & Societies 476: 1. [Google Scholar]
- Potter, Joseph E., Carl P. Schmertmann, Renato M. Assunção, and Suzana M. Cavenaghi. 2010. Mapping the timing, pace, and scale of the fertility transition in Brazil. Population and Development Review 36: 283–307. [Google Scholar] [CrossRef] [Green Version]
- Rees, Philip, Martin Bell, Marek Kupiszewski, Dorota Kupiszewska, Philipp Ueffing, Aude Bernard, Elin Charles Edwards, and John Stillwell. 2017. The impact of internal migration on population redistribution: An international comparison. Population, Space and Place 23: e2036. [Google Scholar] [CrossRef]
- Reher, David S. 2004. The demographic transition revisited as a global process. Population, Space and Place 10: 19–41. [Google Scholar] [CrossRef]
- Reher, David S. 2011. Economic and social implications of the demographic transition. Population and Development Review 37: 11–33. [Google Scholar] [CrossRef]
- Remoundou, Kyriaki, Menelaos Gkartzios, and Guy Garrod. 2016. Conceptualizing mobility in times of crisis: Towards crisis-led counterurbanization? Regional Studies 50: 1663–74. [Google Scholar] [CrossRef] [Green Version]
- Rodrigo-Comino, Jesús, Gianluca Egidi, Adele Sateriano, Stefano Poponi, Enrico Maria Mosconi, and Antonio Gimenez Morera. 2021. Suburban fertility and metropolitan cycles: Insights from European cities. Sustainability 13: 2181. [Google Scholar] [CrossRef]
- Rodriguez-Rodriguez, Vincente. 2000. The seven demographic Spains. Inter-municipal contrasts in age structure: Fertility and migration are the determining factors. Espace, Populations, Sociétés 18: 425–35. [Google Scholar]
- Rontos, Kostas, and Luca Salvati. 2020. Space Matters? Exploring Gender Differentials in the Age at Marriage, Greece (1980–2017). Social Sciences 9: 59. [Google Scholar] [CrossRef] [Green Version]
- Rontos, Kostas, Efstathios Grigoriadis, Adele Sateriano, Maria Syrmali, Ioannis Vavouras, and Luca Salvati. 2016. Lost in Protest, Found in Segregation: Divided Cities in the Light of the 2015 ‘Oki’ Referendum in Greece. City, Culture and Society 7: 139–48. [Google Scholar] [CrossRef]
- Sabater, Albert, and Elspeth Graham. 2019. International migration and fertility variation in Spain during the economic recession: A spatial Durbin approach. Applied Spatial Analysis and Policy 12: 515–46. [Google Scholar] [CrossRef] [Green Version]
- Salvati, Luca. 2019. Bridging the divide: Demographic dynamics and urban–rural polarities during economic expansion and recession in Greece. Population, Space and Place 25: e2267. [Google Scholar]
- Salvati, Luca, Agostino Ferrara, and Francesco M. Chelli. 2018. Long-term growth and metropolitan spatial structures: An analysis of factors influencing urban patch size under different economic cycles. Geografisk Tidsskrift-Danish Journal of Geography 118: 56–71. [Google Scholar] [CrossRef]
- Salvati, Luca, and Federico Benassi. 2021. Salvati, Luca, and Federico Benassi. 2021. Rise (and decline) of European migrants in Greece: Exploring spatial determinants of residential mobility (1988–2017), with special focus on older ages. Journal of International Migration and Integration 22: 599–613. [Google Scholar] [CrossRef]
- Salvati, Luca, and Ilaria Zambon. 2018. Does residential mobility anticipate urban growth? The importance of the local socioeconomic context in a European Metropolitan Region. Population Review 57: 23–46. [Google Scholar] [CrossRef]
- Salvati, Luca, and Margherita Carlucci. 2020. Shaping dimensions of urban complexity: The role of economic structure and socio-demographic local contexts. Social Indicators Research 147: 263–85. [Google Scholar] [CrossRef]
- Salvati, Luca, and Pere Serra. 2016. Estimating rapidity of change in complex urban systems: A multidimensional, local-scale approach. Geographical Analysis 48: 132–56. [Google Scholar] [CrossRef]
- Salvati, Luca, Federico Benassi, Sara Miccoli, Hamidreza Rabiei-Dastjerdi, and Stephen A. Matthews. 2020. Spatial variability of total fertility rate and crude birth rate in a low-fertility country: Patterns and trends in regional and local scale heterogeneity across Italy, 2002–2018. Applied Geography 124: 102321. [Google Scholar] [CrossRef]
- Salvati, Luca, Marco Zitti, and Adele Sateriano. 2013. Changes in city vertical profile as an indicator of sprawl: Evidence from a Mediterranean urban region. Habitat International 38: 119–25. [Google Scholar] [CrossRef]
- Salvati, Luca. 2016. The dark side of the crisis: Disparities in per-capita income (2000–2012) and the urban-rural gradient in Greece. Tijdschrift voor Economische en Sociale Geografie 107: 628–41. [Google Scholar] [CrossRef]
- Sato, Yasuhiro, and Kazuhiro Yamamoto. 2005. Population concentration, urbanization, and demographic transition. Journal of Urban Economics 58: 45–61. [Google Scholar] [CrossRef]
- Schneider, Daniel. 2015. The Great Recession, fertility, and uncertainty: Evidence from the United States. Journal of Marriage and Family 77: 1144–56. [Google Scholar] [CrossRef]
- Serra, Pere, Ana Vera, Antoni Francesc Tulla, and Luca Salvati. 2014. Beyond urban–rural dichotomy: Exploring socioeconomic and land-use processes of change in Spain (1991–2011). Applied Geography 55: 71–81. [Google Scholar] [CrossRef]
- Sobotka, Tomáš, Vegard Skirbekk, and Dimiter Philipov. 2011. Economic recession and fertility in the developed world. Population and Development Review 37: 267–306. [Google Scholar] [CrossRef] [PubMed]
- Sobotka, Tomáš. 2004. Postponement of childbearing and low fertility in Europe. Amsterdam: Dutch University Press. [Google Scholar]
- Stockdale, Aileen. 2016. Contemporary and ‘messy’ rural in-migration processes: Comparing counterurban and lateral rural migration. Population, Space and Place 22: 599–616. [Google Scholar] [CrossRef] [Green Version]
- Surkyn, Johan, and Ron Lesthaeghe. 2004. Value orientations and the second demographic transition (SDT) in Northern, Western and Southern Europe: An update. Demographic Research 3: 45–86. [Google Scholar] [CrossRef]
- Tenreiro Machado, J., Fernando B. Duarte, and Gonçalo Monteiro Duarte. 2011. Analysis of financial data series using fractional Fourier transform and multidimensional scaling. Nonlinear Dynamics 65: 235–45. [Google Scholar] [CrossRef] [Green Version]
- Thygesen, Lau Caspar, Lisbeth B. Knudsen, and Niels Keiding. 2005. Modelling regional variation of first-time births in Denmark 1980–1894 by an age-period-cohort model. Demographic Research 13: 573–90. [Google Scholar] [CrossRef]
- Toulemon, Laurent. 2004. Fertility among immigrant women: New data a new approach. Population and Societies 400: 1–4. [Google Scholar]
- Tragaki, Alexandra, and Christos Bagavos. 2014. Male fertility in Greece: Trends and differentials by educational level and employment status. Demographic Research 31: 137–60. [Google Scholar] [CrossRef] [Green Version]
- Tragaki, Alexandra, and Christos Bagavos. 2019. Fertility variations in the recession context: The case of Greece. Genus 75: 18. [Google Scholar] [CrossRef] [Green Version]
- Van de Kaa, Dirk J. 1987. Europe’s second demographic transition. Population Bulletin 42: 1–59. [Google Scholar]
- Vignoli, Daniele, Sven Drefahl, and Gustavo De Santis. 2012. Whose job instability affects the likelihood of becoming a parent in Italy? A tale of two partners. Demographic Research 26: 41–62. [Google Scholar] [CrossRef] [Green Version]
- Vitali, Agnese, and Francesco C. Billari. 2017. Changing determinants of low fertility and diffusion: A spatial analysis for Italy. Population, Space and Place 23: e1998. [Google Scholar] [CrossRef] [Green Version]
- Voss, Paul R. 2007. Demography as a spatial social science. Population Research and Policy Review 26: 457–76. [Google Scholar] [CrossRef]
- Wachter, Kenneth W. 2005. Spatial demography. Proceedings of the National Academy of Sciences 102: 15299–300. [Google Scholar] [CrossRef] [Green Version]
- Waldorf, Brigitte, and Rachel Franklin. 2002. Spatial dimensions of the Easterlin hypothesis: Fertility variations in Italy. Journal of Regional Science 42: 549–78. [Google Scholar] [CrossRef]
- Walford, Nigel, and Slavomir Kurek. 2016. Outworking of the Second Demographic Transition: National Trends and Regional Patterns of Fertility Change in Poland, and England and Wales, 2002–2012. Population, Space and Place 22: 508–25. [Google Scholar] [CrossRef] [Green Version]
- Wang, Donghui, and Guangqing Chi. 2017. Different Places, Different Stories: A Study of Spatial Heterogeneity of County-Level Fertility in China. Demographic Research 37: 493. [Google Scholar] [CrossRef] [PubMed] [Green Version]
- Williamson, Lee, and Paul Norman. 2011. Developing strategies for deriving small population fertility rates. Journal of Population Research 28: 129–48. [Google Scholar] [CrossRef] [Green Version]
- Wilson, Ben. 2019. The intergenerational assimilation of completed fertility: Comparing the convergence of different origin groups. International Migration Review 53: 429–57. [Google Scholar] [CrossRef]
- Zaidi, Batool, and Philip Morgan. 2017. The second demographic transition theory: A Review and Appraisal. Annual Review of Sociology 43: 473–92. [Google Scholar] [CrossRef] [Green Version]
- Zambon, Ilaria, and Luca Salvati. 2019. Metropolitan growth, urban cycles and housing in a Mediterranean country, 1910s–2010s. Cities 95: 102412. [Google Scholar] [CrossRef]
- Zambon, Ilaria, Andrea Colantoni, and Luca Salvati. 2019. Horizontal vs vertical growth: Understanding latent patterns of urban expansion in large metropolitan regions. Science of the Total Environment 654: 778–85. [Google Scholar] [CrossRef] [PubMed]
- Zambon, Ilaria, Anna Benedetti, Carlotta Ferrara, and Luca Salvati. 2018. Soil matters? A multivariate analysis of socioeconomic constraints to urban expansion in Mediterranean Europe. Ecological Economics 146: 173–83. [Google Scholar] [CrossRef]
- Zambon, Ilaria, Kostas Rontos, Cecilia Reynaud, and Luca Salvati. 2020. Toward an unwanted dividend? Fertility decline and the North–South divide in Italy, 1952–2018. Quality & Quantity 54: 169–87. [Google Scholar]
Figure 1.
A graphical representation of the relationship between local birth rates and distance from inner city: three hypotheses were illustrated in the middle panel considering both linear (continuous line) and non-linear (dashed line) assumptions (left: a predominantly ‘rural’ fertility regime; middle: a predominantly ‘urban’ fertility regime; right: ‘suburban fertility hypothesis’); the outcome of these assumptions was related with population dynamics along a standard metropolitan cycle from urbanization to re-urbanization (reproduced in the upper panel) and a demographic transition from high fertility and mortality to low fertility and mortality (reproduced in the lower panel).
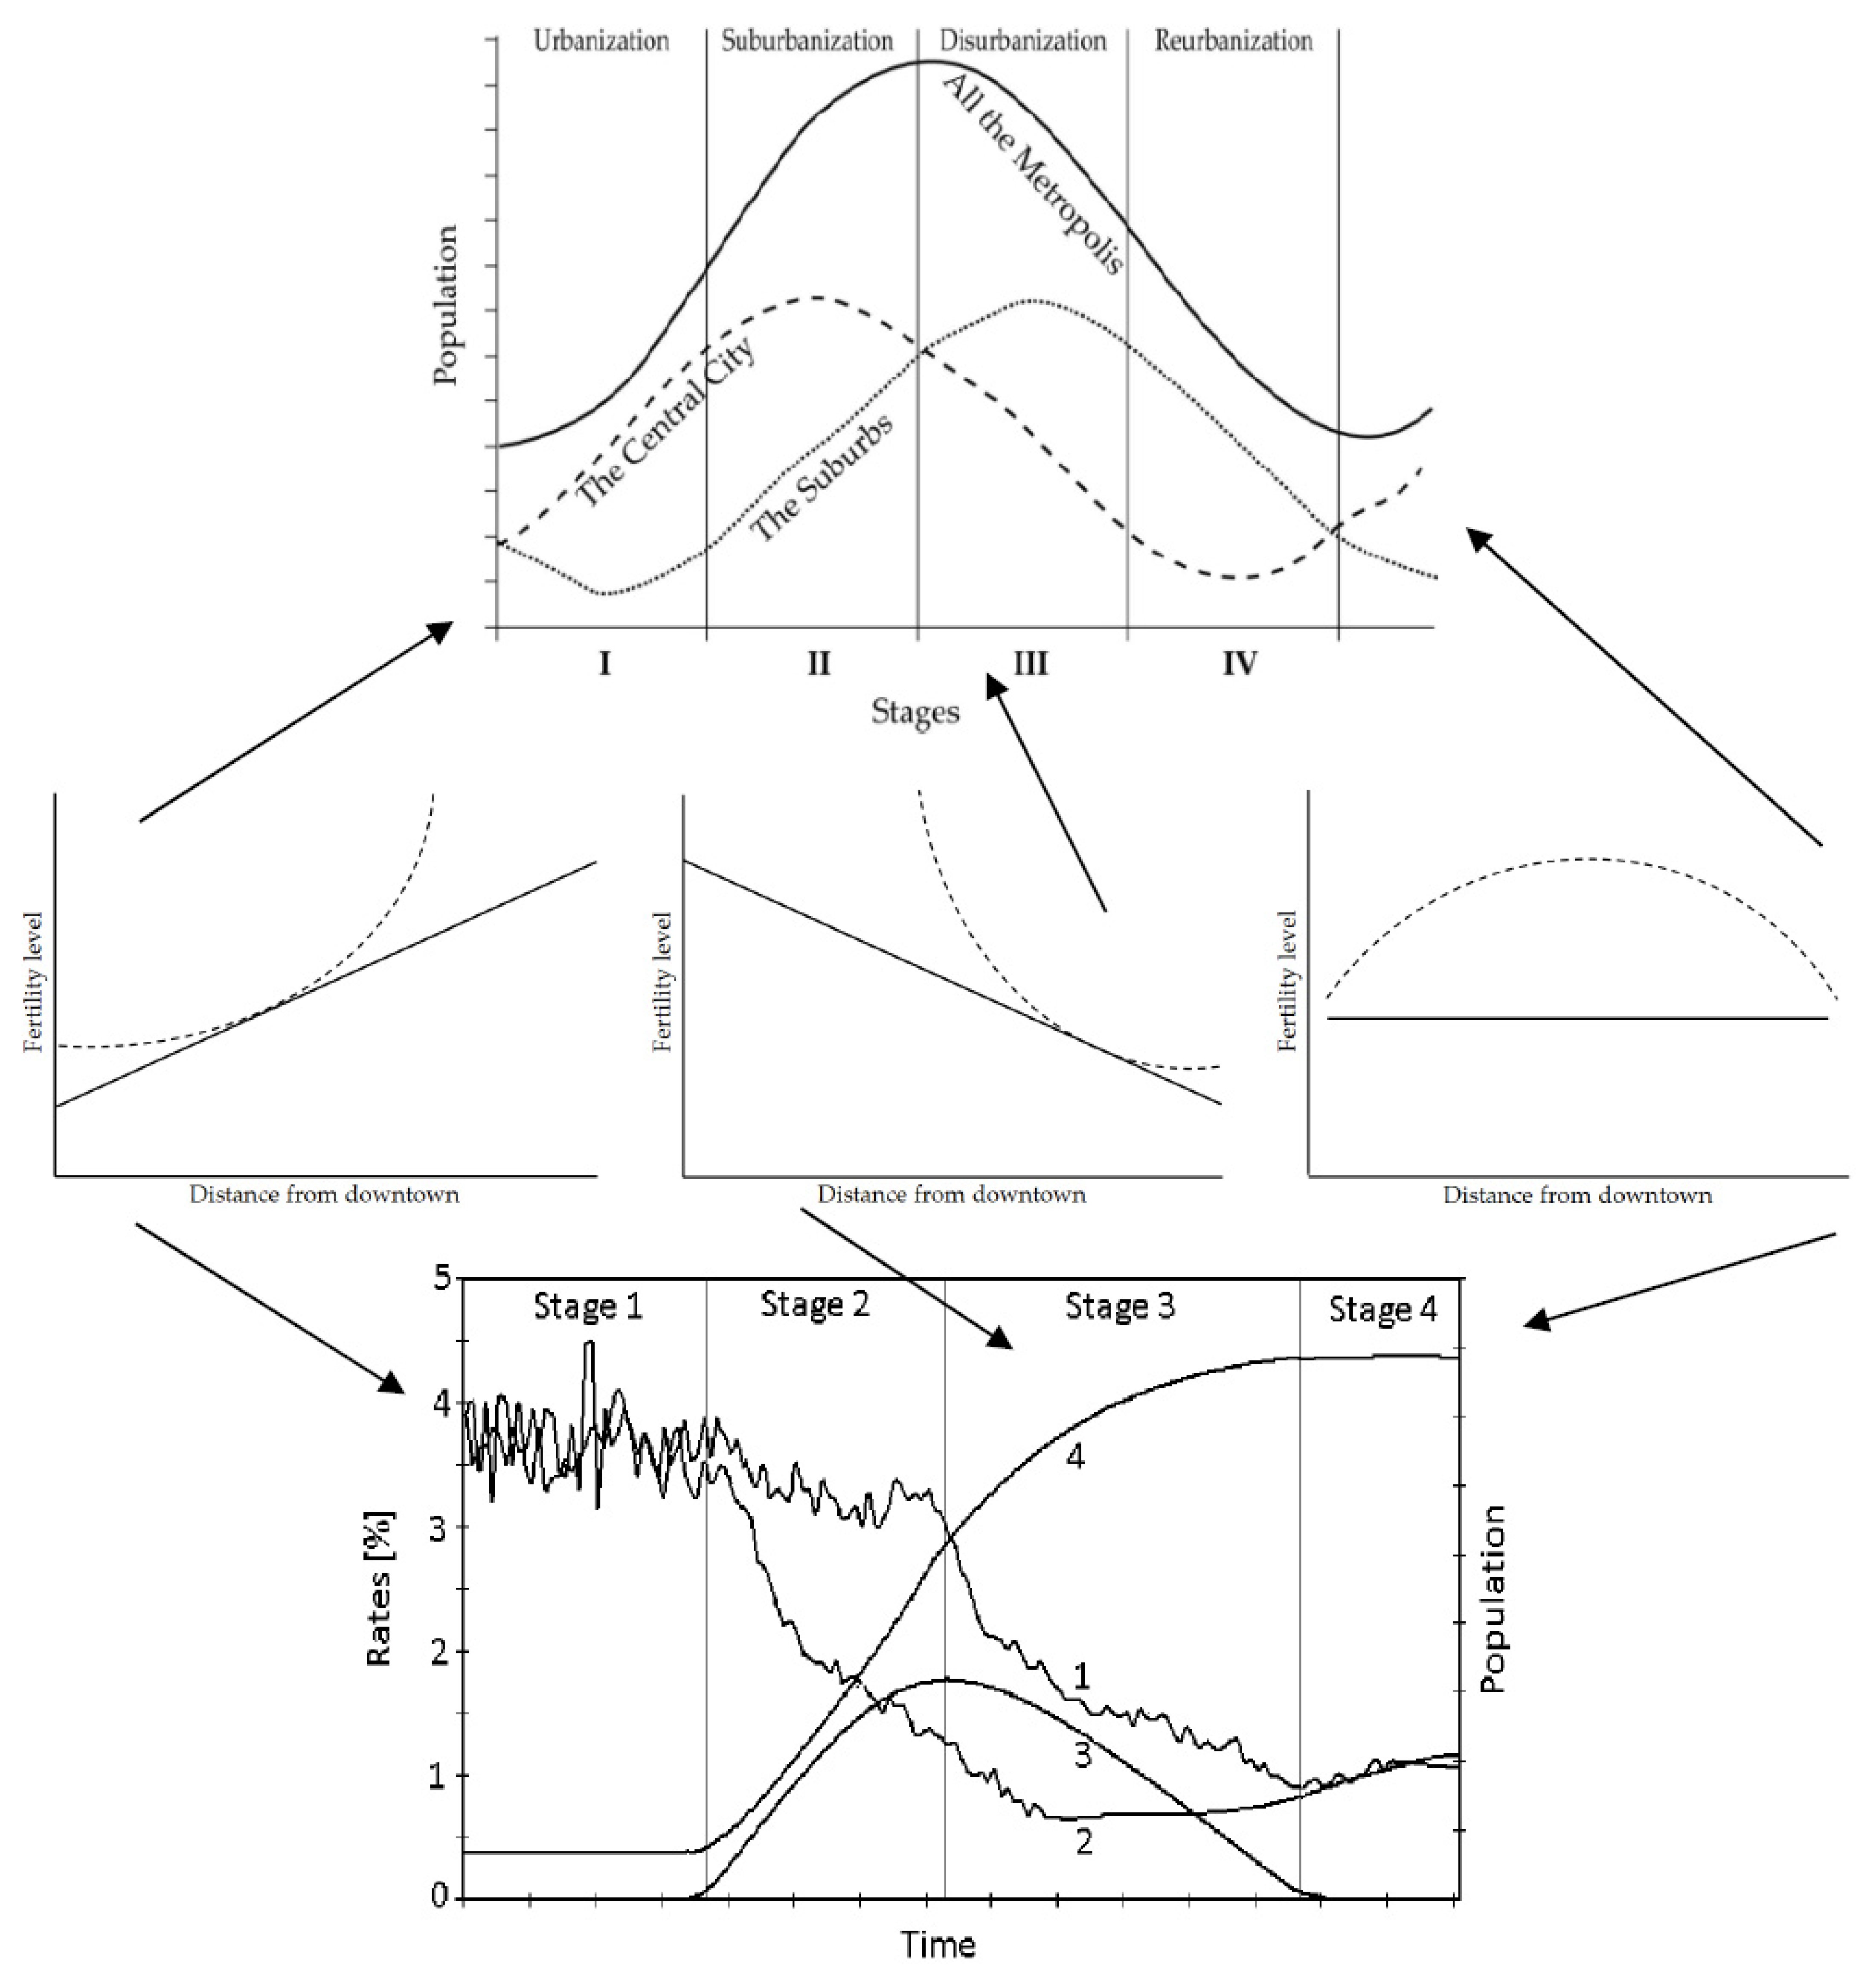
Figure 2.
Position of Attica in Greece (upper left) and a map of regional districts administering Attica (lower left); gross birth rate in 1956 (middle) and 2020 (right) in the municipalities of the region.
Figure 2.
Position of Attica in Greece (upper left) and a map of regional districts administering Attica (lower left); gross birth rate in 1956 (middle) and 2020 (right) in the municipalities of the region.

Figure 3.
(Upper panel) A biplot of a Principal Component Analysis of gross birth rates in the study area by year (1956, 1960, 1970, 1980, 1990, 2000, 2008, 2016, and 2020), augmented with the distance (dAth) from downtown Athens (i.e. specifying a purely mono-centric model). Scores represented the observation municipalities further classified into one of three distance belts from downtown Athens (+: <10 km; x: 10–20 km; ●: >20 km). The left insert indicates the main dimensions of variability (urban, suburban, rural) in the municipal sample; the arrow indicates the shift from urban to suburban fertility regimes. (Lower panel) Classification of urban, suburban, and rural municipalities in the biplot (see above).
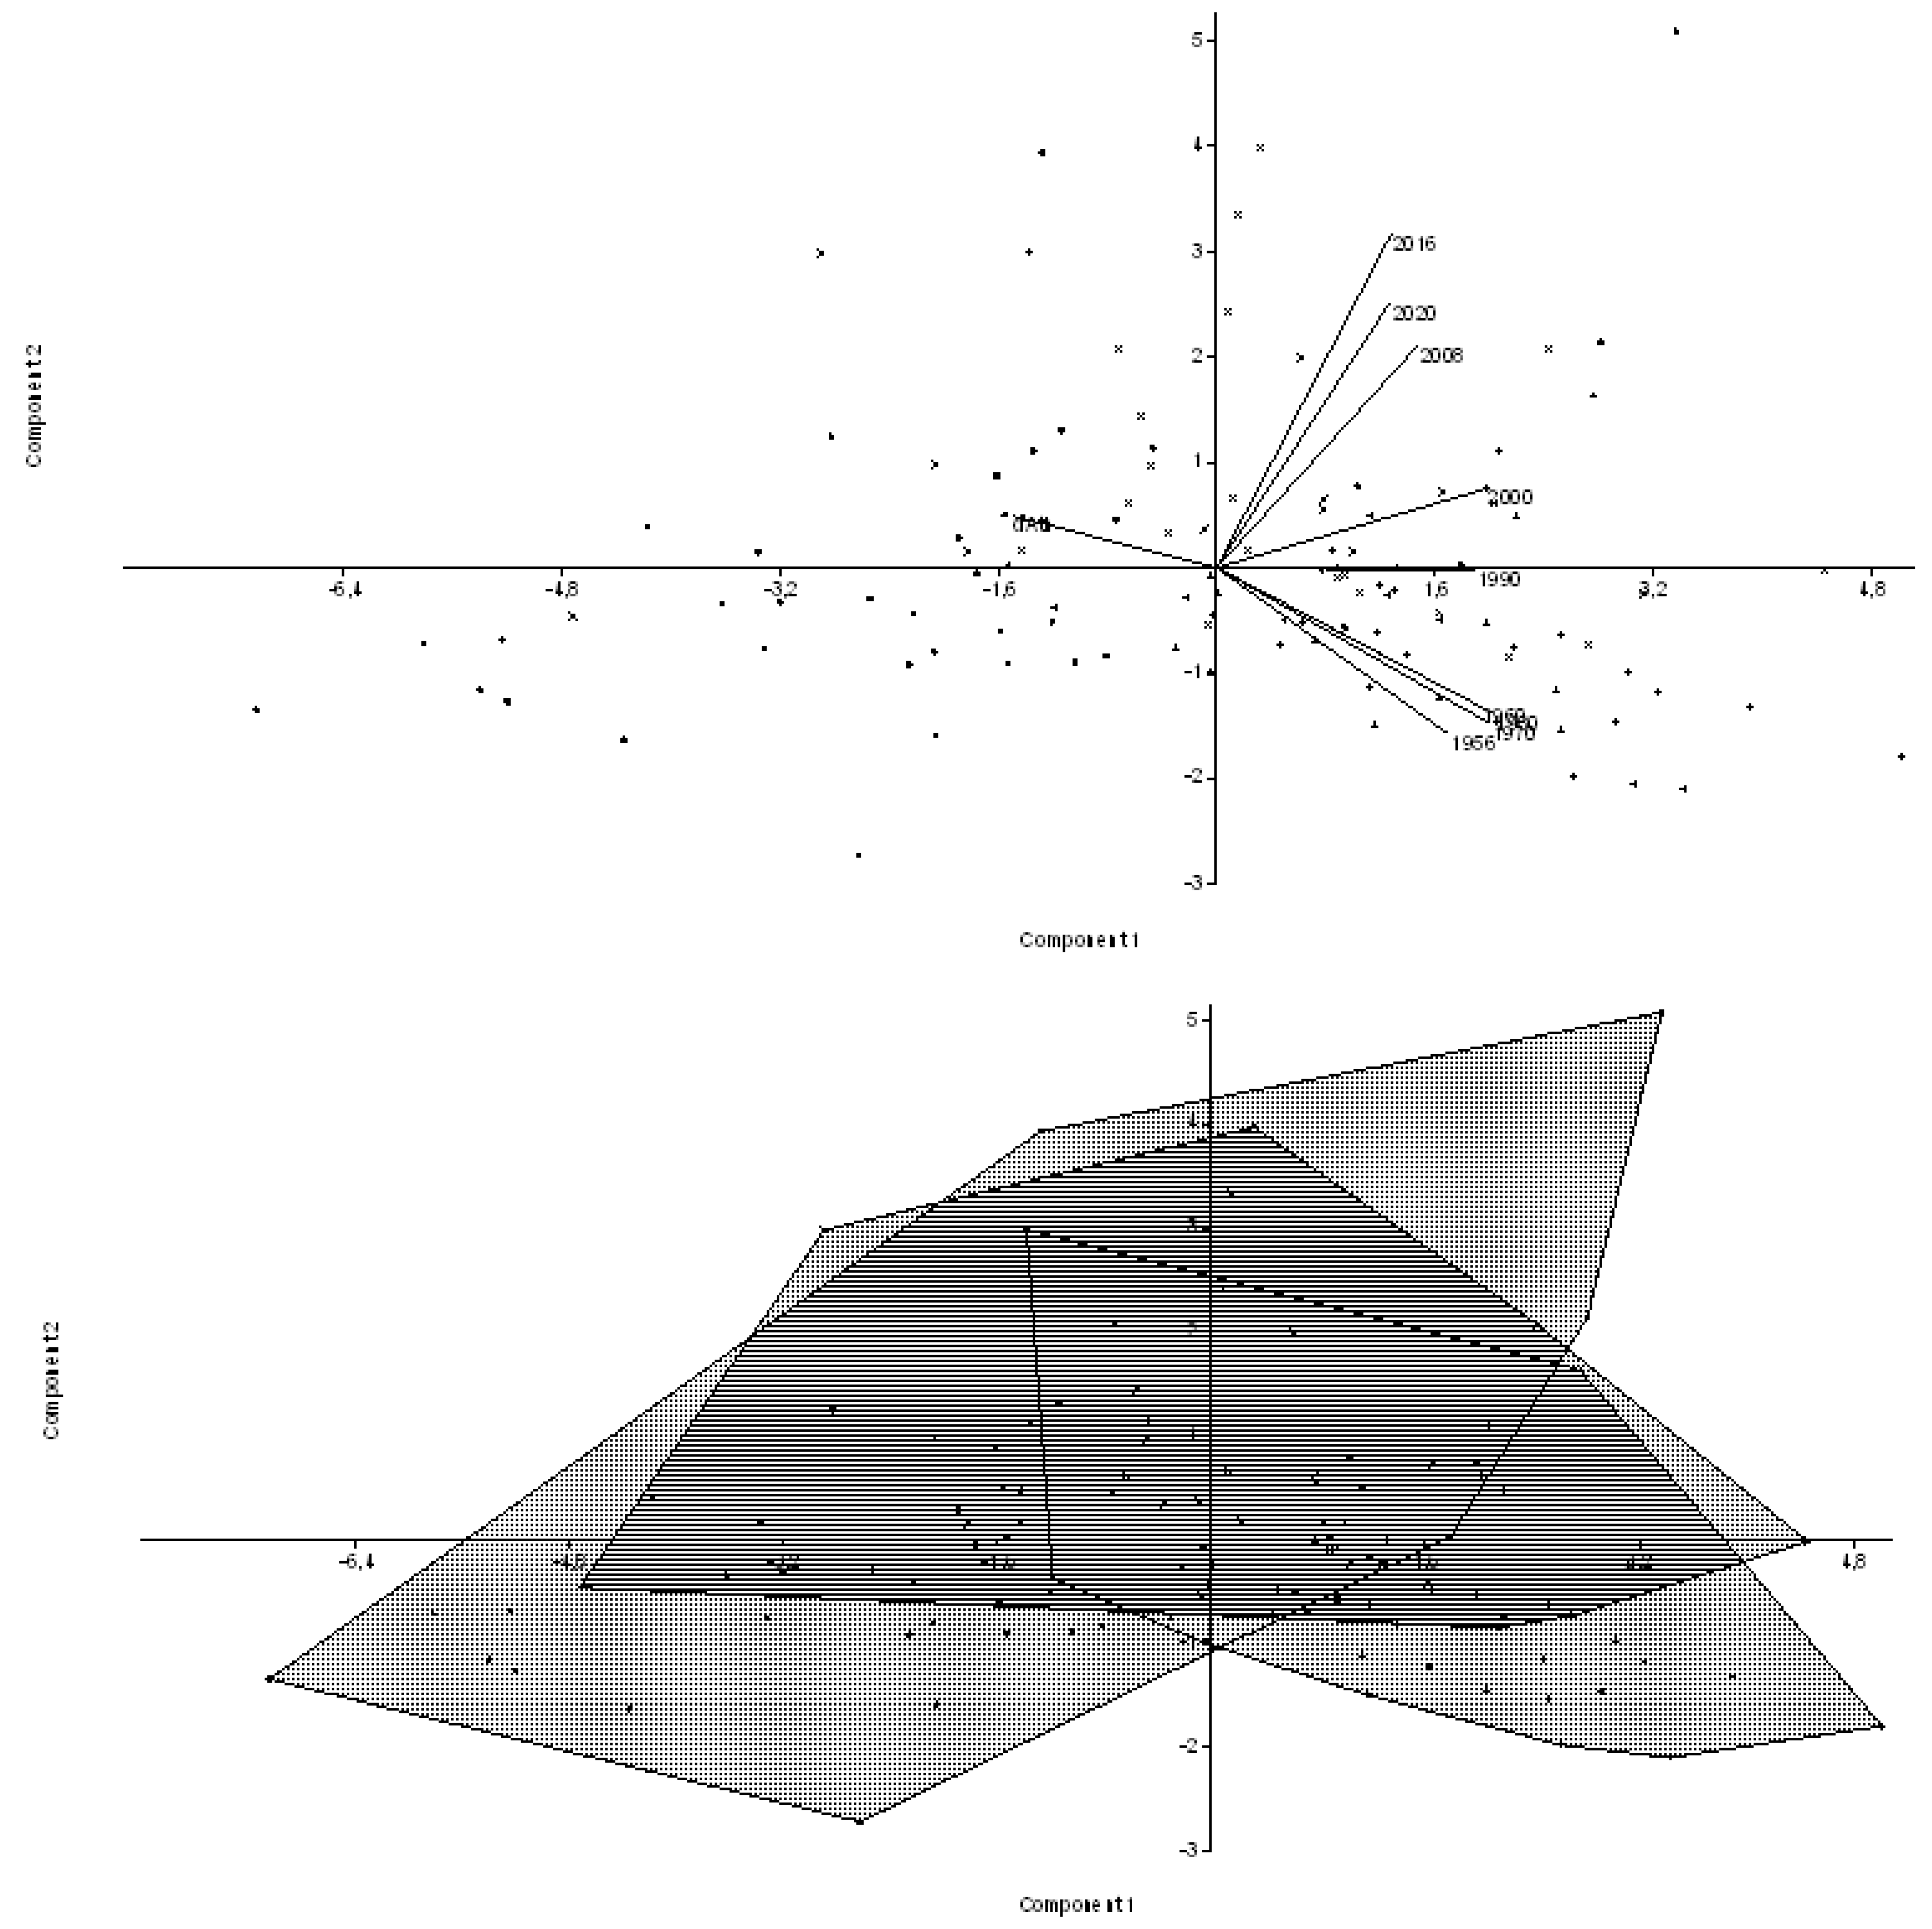
Figure 4.
Results of a non-metric Multi-Dimensional Scaling (n-MDS) run on the matrix summarizing the results of (global) linear and polynomial econometric models (Table 2) by year (1860–2020); Left panels: Euclidean distance; right panels: Manhattan distance; upper panels: coordinate plots of column’s variables (years); lower panels: coordinate plots of row’s variables (statistical coefficients of econometric models); row’s variables include intercepts (‘Int’), slopes (‘Slope’), and adjusted-R2 (adj-R2) of linear regressions by year, as well as coefficients (a0, a1 and a2) of polynomial regressions, augmented with the gain ratio in the R2 coefficient between polynomial and linear models; labels indicate the prevailing fertility regime (urban, suburban, rural) in each n-MDS quadrant.
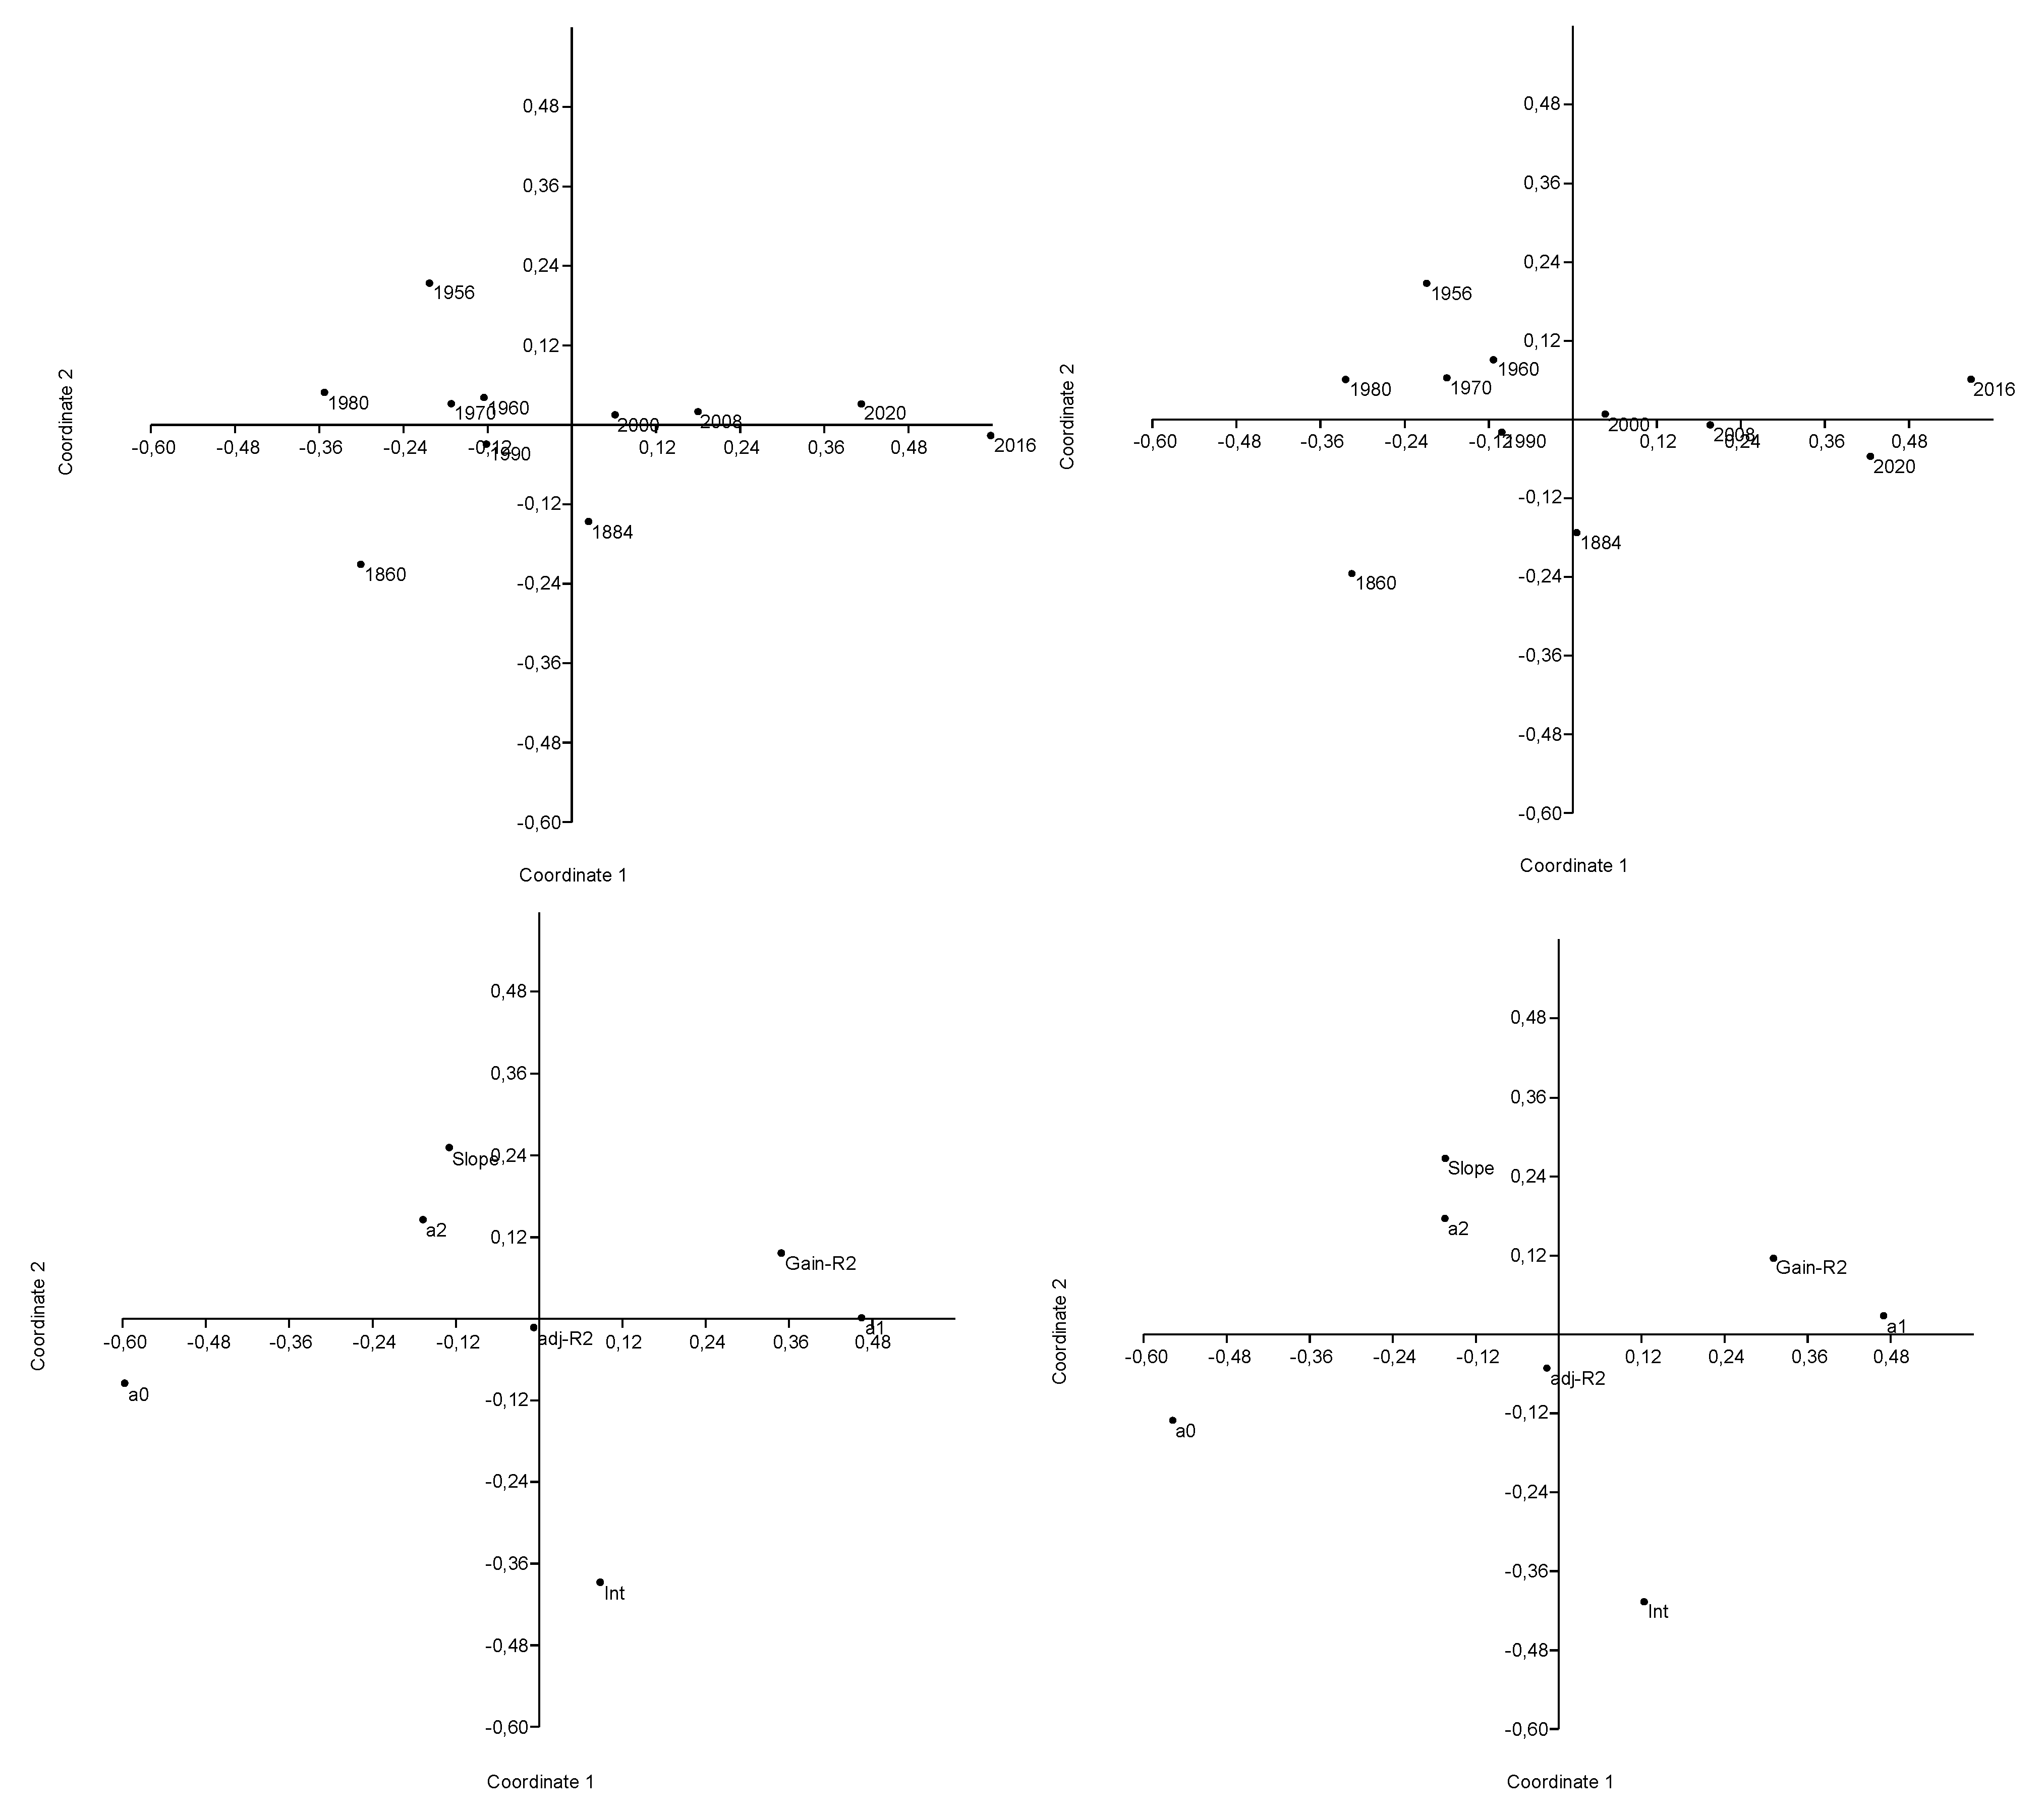
Figure 5.
Results of a Geographically Weighted Regression between gross birth rate and distance from downtown Athens (left: local R2; right: local regression slope; significance at various probability levels was indicated with different colors based on usual inference, i.e. t-test on coefficient and standard error, * 0.01 < p < 0.05; ** 0.001 < p < 0.01; *** p < 0.001).


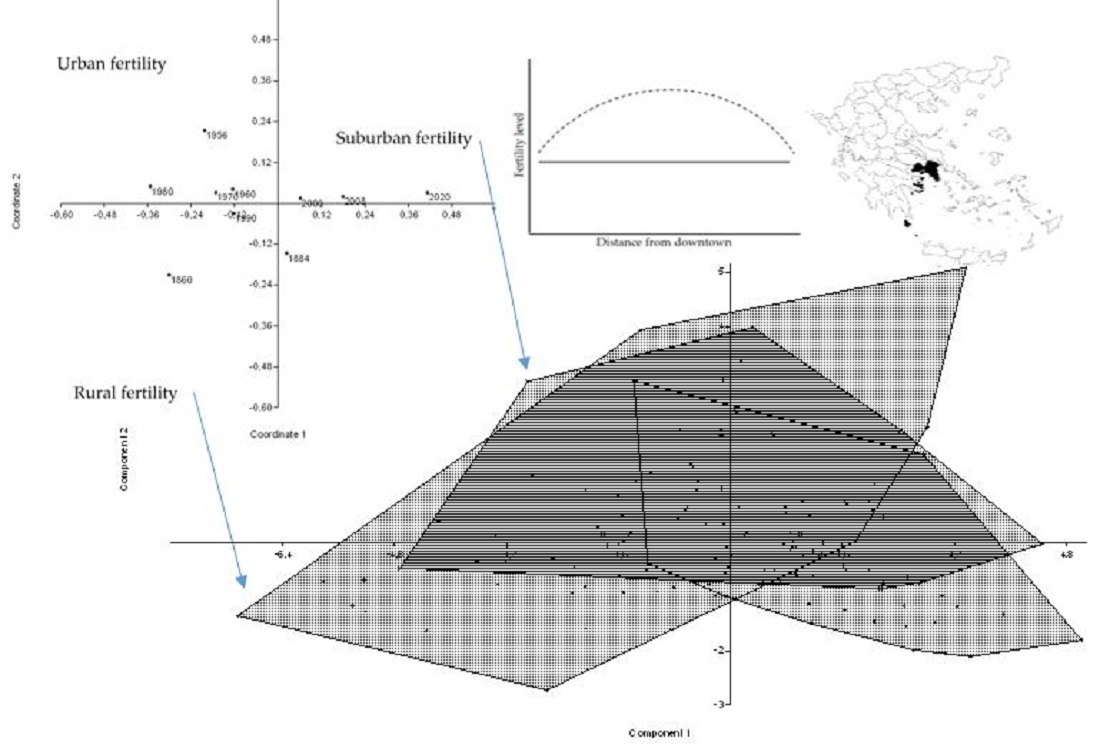
Table 1.
Spatial distribution of gross birth rate by regional unit (NUTS-3 level) of Attica with selected characteristics (* compact urban settlements; ** dominant urban with some rural settlements; *** fringe settlements in Greater Athens; **** mixed suburban and rural settlements) based on Eurostat vital statistics.
| Regional Unit | 1991–2000 | 2001–2010 | 2011–2020 |
|---|---|---|---|
| Central Athens * | 1.21 | 1.28 | 1.26 |
| Piraeus ** | 1.33 | 1.39 | 1.32 |
| Northern Athens *** | 1.39 | 1.47 | 1.42 |
| Western Athens *** | 1.55 | 1.54 | 1.34 |
| Southern Athens *** | 1.37 | 1.37 | 1.29 |
| Eastern Attica **** | 1.38 | 1.63 | 1.52 |
| Western Attica **** | 1.81 | 1.97 | 1.86 |
Table 2.
Econometric models (both linear and quadratic specifications) estimating the global relationship between a gross birth rate at the municipal scale and the distance from downtown Athens; coefficient estimates and adjusted R2 were reported in the table (significance of R2 and regression coefficients against the null hypothesis of zero-coefficients was tested at ** p < 0.001 or * 0.001 < p < 0.05), together with an index of goodness-of-fit gain between models († indicates significant gains tested at p < 0.05 against the null hypothesis of similar R2 between linear and non-linear models); the estimated distance from downtown (km) with the highest fertility level was also reported, based on the estimated squared model (n = 12 for 1860 and 1884 and n = 115 for the remaining observation years).
| Year | Linear | Quadratic | Gain | ||||||
|---|---|---|---|---|---|---|---|---|---|
| a0 | a1 | Adj-R2 | a0 | a1 | a2 | Adj-R2 | R2 | Max (km) | |
| 1860 | 0.028 | 0.348 * | 0.422 * | 0.740 | −0.321 | 0.136 | 0.466 * | 0.104 | - |
| 1884 | 0.408 * | 0.296 * | 0.401 * | −0.212 | 0.878 | −0.118 | 0.444 * | 0.107 | - |
| 1956 | 1.635 * | −0.480 ** | 0.286 ** | 0.542 | 0.445 | −0.181 | 0.305 ** | 0.066 | - |
| 1960 | 0.984 * | −0.283 * | 0.200 * | 0.186 | 0.393 | −0.132 | 0.220 * | 0.100 | - |
| 1970 | 0.983 * | −0.286 ** | 0.243 * | 0.357 | 0.244 | −0.103 | 0.258 * | 0.062 | - |
| 1980 | 1.072 ** | −0.339 ** | 0.321 ** | 0.887 | −0.183 | −0.030 | 0.322 ** | 0.003 | - |
| 1990 | 0.479 * | −0.233 * | 0.178 * | 0.058 | 0.124 | −0.070 | 0.186 * | 0.045 | - |
| 2000 | 0.525 * | −0.258 * | 0.263 * | −0.520 | 0.626 | −0.173 | 0.318 ** | 0.209 † | 6.6 |
| 2008 | 0.477 | −0.187 | 0.093 | −0.834 | 0.923 | −0.217 | 0.153 * | 0.645 † | 8.7 |
| 2016 | 0.380 | −0.216 | 0.104 | −1.981 | 1.782 | −0.390 | 0.264 * | 1.538 † | 10.4 |
| 2020 | 0.148 | −0.190 | 0.084 | −1.520 | 1.239 | −0.281 | 0.186 * | 1.214 † | 10.8 |
Publisher’s Note: MDPI stays neutral with regard to jurisdictional claims in published maps and institutional affiliations. |
© 2022 by the authors. Licensee MDPI, Basel, Switzerland. This article is an open access article distributed under the terms and conditions of the Creative Commons Attribution (CC BY) license (https://creativecommons.org/licenses/by/4.0/).
Share and Cite
MDPI and ACS Style
Nickayin, S.S.; Chelli, F.; Turco, R.; Nosova, B.; Vavoura, C.; Salvati, L. Economic Downturns, Urban Growth and Suburban Fertility in a Mediterranean Context. Economies 2022, 10, 252. https://doi.org/10.3390/economies10100252
AMA Style
Nickayin SS, Chelli F, Turco R, Nosova B, Vavoura C, Salvati L. Economic Downturns, Urban Growth and Suburban Fertility in a Mediterranean Context. Economies. 2022; 10(10):252. https://doi.org/10.3390/economies10100252
Chicago/Turabian StyleNickayin, Samaneh Sadat, Francesco Chelli, Rosario Turco, Bogdana Nosova, Chara Vavoura, and Luca Salvati. 2022. "Economic Downturns, Urban Growth and Suburban Fertility in a Mediterranean Context" Economies 10, no. 10: 252. https://doi.org/10.3390/economies10100252
Note that from the first issue of 2016, this journal uses article numbers instead of page numbers. See further details here.