1. Introduction
Privatization has become a hot issue in Indonesia since the 1997 monetary crisis due to the pressure from the International Monetary Fund that the Indonesian government divest some of its strategic state-owned enterprises (henceforth SOE). The pattern of Indonesian privatization from the 1990s revealed that the Indonesian government tends to prefer, as its privatization model, the internal reform, liberalization, and deregulation of its state-owned enterprises to relinquishing them to private ownership (
Thoha 1993). Up until 2020, the Indonesian government had chosen to partially privatize SOEs by retaining the majority (more than 50%) of the SOE’s shareholding structure to remain in Indonesia. This decision would impair improvements to the enterprises’ performances due to the government’s great influence through the majority of shares it was still retaining (
Boubakri et al. 2005).
In addition, the Indonesian government was inclined to perform deregulation and subsidy reduction instead of relinquishing its shares of the SOE (
Pangestu and Habir 1989). Since 1990, deregulations have been passed and the government only subsidizes ten SOEs, namely PT Krakatau Steel (Steel Industry), IPTN (aircraft industry), PT PAL (ship construction), PT PINDAD (weapon industry), PT INKA (trains), PT INTI (telecommunication), LEN-LIPI (electronics), PT Dahana (explosives), PT Bharata and Boma Bisma Indra (machineries) (
Thoha 1993). A number of limited privatization initiatives were also done in the form of SOEs’ asset and stock sales. For example, 70% of the stocks of PT Intirub, which produces tires, were sold to PT Bimantara Citra in April 1990. In 1991, PT Semen Gresik sold its shares through an initial public offering on the Indonesian Stock Exchange, which was later followed by PT Timah in 1995, PT Antam in 1997, and PT Telkom in 1997 selling their shares, respectively. Up until 2020, there have been 28 SOEs along with their subsidiary companies listed on the Indonesian Stock Exchange (BEI).
Partial privatization appears to be less problematic in Indonesia, as evidently proven by some SOEs’ smooth stock sales through the IPO in the stock market without any significant negative response from the society (
Nahadi and Suzuki 2012). This was in contrast with the situation when Indosat was sold to a foreign corporate buyer in 2002. Since the general public was not even concerned with the shareholding composition in the go-public SOEs, the government could have more freedom to sell or buy back stocks in the market whenever it is necessary to support certain economic policies. Partial, instead of full, privatization is more likely to be implemented in Indonesia because the Indonesian government has to anticipate the political pressure that prevents it from selling out its SOEs and demands that it retain majority control over the privatized companies by retaining more than 50% shares. The full privatization on Indosat in 2002 had attracted a huge public outcry at that time for which the Indonesian government learned a hard lesson.
In addition to being tasked for producing revenues like other private companies, Indonesian state-owned enterprises also become the government’s legs and arms in running the economy. According to law number 19 of 2003 on state-owned enterprises, some important duties, unrelated to the profit making objectives, have also been assigned to Indonesian SOEs, which include helping to open extensive job vacancies, assisting the government in providing products not made available by private sectors, helping develop small and medium enterprises (Indonesian “UMKM”), serving as the government apparatus in managing the economy, and so on. These additional state-assigned tasks would certainly affect SOEs’ performances in fulfilling the general corporate objective, namely making maximum profits. Although SOEs have tasks assigned by the government, they are also financially backed by the government, so their company financial position may not be significantly affected even when economic turbulence occurs. In support of those additional state-assigned tasks, the government also issued various regulations whose regulatory scheme for SOEs is different from the ones issued for private companies.
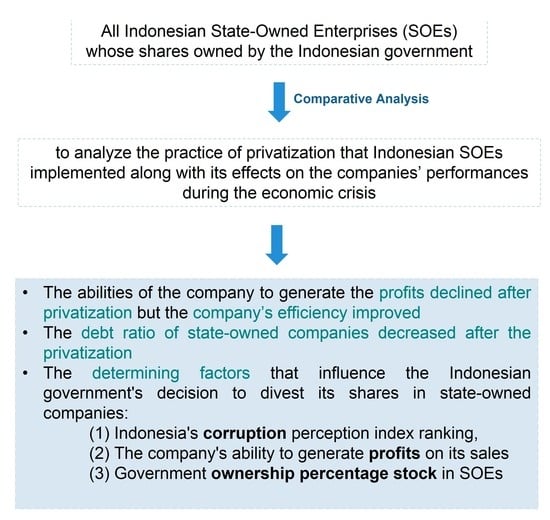
This research was conducted to analyze the practice of privatization that Indonesian SOEs implemented along with its effects on the companies’ performances during the economic crisis. First of all, a comparative analysis of the privatized companies’ performances before and after the privatization was done. An analysis of long-term and short-term corporate performance after the privatization was conducted. Performances before and during the economic crises were also compared and analyzed. Determinants encouraging the Indonesian government to relinquish its shares on SOEs were identified. Lastly, the analysis on the impact of the economic crisis on SOE privatization conducted in this study was never performed in previous studies and would become the major contribution of this study.
In addition to presenting the analysis on the impact of economic crisis on SOE privatization, this study also compared the Indonesian SOEs’ short-term and long-term performances. Privatized companies’ long-term performance was rarely investigated. Most studies on privatization were done on the companies’ short-term performance in order to understand the effect of privatization on company performance (
Radić et al. 2021), where the average period of time being analyzed was two or three years before and after the privatization. In fact, some studies found that there are expenditures requiring a longer period of financing to reach efficiency. For example, a research and development fund that results in innovation and corporate financial efficiency in their production process requires a relatively long period of time to be in effect (
Munari and Oriani 2005). Likewise, internal resistance against the privatization, which the company’s labor union commonly held, would undergo changes in the long run (
Ross 2008). Consequently, this study presumes that the short-term and the long-term performances of privatized companies would result in different outcomes where the long-term performance would empirically be much better than the short-term performance.
This paper consists of five sections where section two presents a literature review on related studies. Section three unfolds methods of data collection and analysis. Then, the presentation of the results of this study over the privatization determinants in Indonesia and a number of comparative analyses are presented in section four. Lastly, section five isthe conclusion and further discussion on the results found in this study.
The research questions from this paper are: (1) Can the privatization of SOE in Indonesia improve the financial performance of these SOE companies? (2) Is there a difference between short-term and long-term performance after the privatization of SOE in Indonesia? (3) Has the economic crisis that occurred several times in Indonesia affected the performance of the privatized SOEs? (4) What determinants influence the Indonesian government’s decision to release or retain its shares in SOE?
2. Literature Review
Previous studies reviewed in this section concern corporate privatization by focusing on comparisons of corporate performance before and after privatization, determinants of privatization in some countries, motivation for privatization, research on outcomes of the privatization, short-term and long-term implications of privatization, and other topics related to privatization. Studies on the impact of the economic crisis on the general performance of companies as well as on privatized enterprises were reviewed. Recent studies on the impact of the COVID-19 pandemic on countries’ economies, which also affected corporate performance in those countries, are also highlighted.
Many studies (e.g.,
Megginson et al. 1994;
Boubakri and Cosset 1998) have been conducted on the performance of privatized companies around the world.
Megginson et al. (
1994) compared the performance of 61 firms before and after they were privatized between 1961 and 1989. The privatization resulted in the increase of those firms’ profit, productivity, efficiency, and capital expenditures even though the employment situation did not change. Similarly, with results showing that profit, efficiency, capital expenditures, and the number of jobs significantly increased due to the privatization while their leverage appeared to decline,
Boubakri and Cosset (
1998) compared the performances of 79 companies from 14 developing countries before and after their privatization in the course of 1980–1992.
Radić et al. (
2021) arranged a comprehensive review and completed state-of-the-art research on privatization that allows future researchers to define gaps on the topic. They discovered that not all privatization resulted in a more efficient operation for SOEs as generally indicated by the micro economy theorists (
Milhaupt and Pargendler 2017;
Vickers and Yarrow 1991). Some privatizations were motivated by the need to pay foreign or domestic debts (
Ramamurti 1992), while others were driven by political interests and the need to enrich particular elite groups that could financially contribute to the political party currently in power for the next election. The latter happens mostly in many developing countries where ideological biases were clearly conspicuous in such transactions (
Munir and Naqvi 2017).
When examining the outcomes of privatization, in order to isolate the impact of ownership transfer and other related effects, most studies are inclined to explore organizational implications such as performance, innovation, or job number soon after the privatization (
Megginson and Netter 2001). Research on the performance of privatized companies commonly took data from two to three years prior to and after the privatization (
Estrin et al. 2009;
Megginson and Netter 2001;
Munir and Naqvi 2017). Similarly, studies that explore the mediating process of privatization generally focused on events that happen during or soon (two to four years) after the privatization (
Czaban and Whitley 2000;
Soulsby and Clark 1996). Since these studies focused on the implication of privatization on short-term performance, an examination of the privatized companies’ long-term performance is a potential that can be performed. Some previous studies indicated that the impact of privatization is not directly realized in a short period of time. Some new conditions will surface in a relatively long time. For example, a study on the impact of privatization on innovation has pointed out that the transfer of ownership might have not resulted in direct impacts on the research and development sector but this sector’s performance will begin to improve in a relatively longer period of time (
Munari and Oriani 2005). Likewise, members of the organization tend to accept the internal change caused by the privatization over an extended period of time (
MacKenzie 2008;
Ross 2008), in an exploratory study on the mediating process that has made this occurrence unfold, despite some resistance in the early time of privatization. Therefore, investigating the longitudinal effect on privatization will allow the researchers to potentially discover different outcomes as compared to most contemporary studies done on the impact of privatization on the short-term performance.
In another respect, (
Radić et al. 2021) presented previous research on the result of privatization, strongly emphasizing the financial performance and operation. This particularly highlighted the transitional impact on the company instead of the more general constituent. Most studies in the past set aside the wider perspectives, such as public interest, by focusing solely on efficiency or profitability of the companies (
Jupe and Funnell 2015;
Kentikelenis and Babb 2019;
Munir and Naqvi 2017).
In relation to the COVID-19 pandemic,
Radić et al. (
2021) argued that previous researchers needed to reconsider their analysis on the implications of privatization. They need to examine the impact of privatization on the endurance of the entire system when dealing with the crisis. Some questions should be asked: How different do public versus private service providers respond to the systemic emergencies pushing them to temporarily sacrifice profit for the communal welfare? On what conditions can privatized services be resumed under the government’s control? What challenges and opportunities will the private sectors face? and many more.
Aifuwa et al. (
2020) exposed their empirical study on the impact of economic crisis on corporate performance by sending a questionnaire to the owners of private companies in Nigeria. They discovered that the COVID-19 pandemic negatively affected their companies’ performances and recommended that the government assist private companies through support programs. In the meantime, a qualitative study conducted by
Al-Shammari and Al-Saidi (
2020) in Kuwait found various impacts of the COVID-19 pandemic on corporate performances. Whereas up to this date there has not been any research on the impact of the economic crisis on corporate performance, which influences government decisions in implementing privatization, Al-Shammari discovered that the negative effect of the pandemic on corporate performance could be minimized by means of new government regulations that aim at improving the performance of companies.
With regard to the determinant of privatization,
Boubakri et al. (
2015) analyzed 406 data samples of companies from 44 countries to figure out any factors influencing governmental decisions in committing full privatization. This research also intended to detect the reasons governments retain the remaining shares of companies that previously have been partially privatized between 1995–2009. This study also discovered 168 out of 406 companies were fully privatized, and it took an average of seven years for the governments to relinquish all their shares of the privatized SOEs. By using the Cox proportional hazard model, Boubakri et al. demonstrated that such slow share relinquishment occurred in countries with people tending to be collectivists, with high political constraints, and obstacles from the states’ own regulations on labor protection. On the firm level, full privatization produced a significantly positive impact on the performance. The latter finding supported previous studies’ arguments that governments must relinquish all their shares from SOEs so that the companies can fully achieve their business objectives.
In responding to
Boubakri et al.’s (
2015) study,
Chang and Boontham (
2017) investigated 118 firms in Asian-developing countries which were privatized during 1998–2008. They proved that political constraints had negative effects on the government decisions in performing privatization. Another statistically influential factor is the government’s ideology. Governments with the left-wing ideology inclined to retain their stakes in SOEs, and, likewise, the people’s culture of collectivism also produced negative influences on the privatization.
On the corporate level,
Chang and Boontham (
2017) found factors that influenced the decision for privatization, namely profitability and company size. The bigger the size of a company and the more profitable it is, the more likely the government is to retain their shares. Negatively influential factors on the firm-level variables included government ownership level and the number of employees. The bigger percentage the government ownership on the company shares, the bigger constraints the government faced to relinquish the rest of their stakes in privatized SOEs.
In the medium-term, there was only one factor left that negatively influenced the government ownership relinquishment, i.e., the level of government ownership itself (
Chang and Boontham 2017). In the long-term, government ideology and company’s debts were the only factors that significantly influenced the decision for privatization. Government ideology correlated negatively with the privatization decision while company debts positively correlated.
Additionally, other determinants that define the decision of government from 10 countries to retain their remaining stakes in SOEs include checks, collectivism, left-wing ideology government, GDP, company size, the government ownership percentage, and the number of employees (
Chang and Boontham 2017). It was only 10% government ownership that remained significant in the medium-term, while the company debt and government left-wing ideology was 5% influential on the significance level in the long term.
Boubakri et al. (
2015) or
Chang and Boontham (
2017) equally emphasized the inclusion of the economic crisis influence as a defining variable in determining performance of the privatized firm or of the government decision to perform privatization or relinquish its stock in the already privatized companies. As far as the SOE privatization is concerned, several global-scale economic crises took place and affected many countries in the world, as well as the operations of many firms and SOEs. Consequently, in the future, more studies that include economic crises as free variables and examine their impact on firm performance, as well as their influence on government decisions for privatization are called for, and this study attempts to answer the call.
Furthermore, an empirical study on SOE privatization in Indonesia was done by
Nahadi and Suzuki (
2012) by taking data from 15 companies during 1991–2007. The 214 data collected had proven that partial privatization in Indonesia made way for improving the observed companies’ performance. This research was timely done because of a global economic crisis that affected the Indonesian economy occurred so that the government decision in privatizing SOEs, and the performance of those state-owned companies, may have been possibly influenced as well. Recently, another economic crisis that took place in 2020 due to the COVID-19 pandemic gave more academic reasons to observe the influence of these economic crises on the privatized firms’ financial performance and the government’s decision to relinquish its stakes in SOEs. The economic crisis becomes an undeniable factor influencing the company performance and including it as a research variable has become an investigative point of interest (
Chang and Boontham 2017).
Another area of research on privatization is organizational change and performance, which explained the differences between the type of ownership and changes in the organizational objectives of privatized companies (
Yonnedi 2010). Evidence suggested that there is an essential harmony between organizational objectives, design elements, and resources among the observed companies. This may also mean that there are significant influences from the transfer of ownership upon the firm performance in Indonesia. Nevertheless, this research was based on perspectives from managers of state-owned and private companies instead of analyzing the companies’ financial performances.
To fill in the gap,
Khajar et al. (
2019) conducted a study that analyzed Indonesian SOEs’ financial performance by applying Return of Equity (ROE) and Return on Assets (ROA) as measures of corporate profitability while the Net Profit Margin (NPM) was used to measure efficiency. As the result, ROA and NPM underwent a significant decline post-privatization. This result contradicted findings of
Nahadi and Suzuki (
2012), where corporate performance was improved post-privatization.
Nonetheless, all previous empirical studies on privatization in Indonesia have produced no certain conclusion. Some identified gaps, which include pre- and post-privatization corporate performance analysis, short- and long-term privatization performance analysis, and SOEs performance during the economic crisis, will have to be addressed. This study is intended to contribute the analyses on these aspects, along with the analysis of determinant variables that influence the government decision to retain or relinquish its stocks in Indonesian SOEs.
Theories that have contributed the most to this research are the agency theory (
Jensen and Meckling 1976) and the privatization theory (
Boycko et al. 1996). According to
Jensen and Meckling (
1976), agency theory is a contract between the manager and the owner. For this contractual relationship to work smoothly, the owner will delegate decision-making authority to the manager. In this case, they were making employees assist managers in making decisions. Decisions to expand the business may be driven by the managers’ desire to expand their divisions to gain greater responsibility and compensation. This conflict is called agency conflict.
Meanwhile, according to the theory of privatization by
Boycko et al. (
1996), politicians face political obstacles when choosing company efficiency over political interests to employ more workers in SOE, to reduce unemployment, and increase re-election. The unions within SOE also tend to hinder company restructuring. Therefore, privatizing political barriers to make companies operate efficiently and restructuring companies to pursue efficiency will be easier.
3. Methodology
3.1. Comparative Analysis
The population of this study constitutes all Indonesian SOEs whose shares are owned by the Indonesian government up until today. The government has divested its share in some SOEs through privatization and others are still fully state-owned. In addition, there are a few SOEs the government has fully relinquished to private ownership. Moreover, financial data and annual reports from these SOEs between 1996 and 2020 were examined in this study. Corporate performance analyses were divided into short- and long-term durations. There are two parts to the analysis in this study: a comparative analysis and the analysis of privatization determinants.
For every sample company in this study, essential financial ratios as key performance indicators are theoretically compared. They consist of the ratio of profitability, which include earnings before interest and tax to sales (ROS), earnings before interest and tax to equity (ROE), earnings before interest and tax to assets (ROA), and ratios that describe operational efficiency with two parameters, namely sales efficiency (SALESEFF) and income efficiency (INEFF). Sale efficiency is measured by dividing the company’s total sale with the number of employees, while INEFF is calculated from income before interest and tax (EBIT) and the number of employees. Then, the employment level is calculated by the total number of employees (EMPL), and a company’s ability to manage debts is computed by using the total debt to total assets (LEVERAGE) (
Omran 2004).
Corporate performances two years before and after privatization are compared. Then, the first- and second-year performances post-privatization are also compared with the third- and fourth-year performances. Comparing these four years of post-privatization is intended to understand the differences between the short-term and the long-term performances of the privatized firms. For these comparisons, nine SOEs that have complete financial data are selected as SOE sample data.
To measure the impact of the economic crisis on corporate performance, the corporate performance of one year before the crisis is compared with the performance in the year of crisis. The year of economic crisis in this study is set between 1997 to 1998, 2008, and 2020. The period of 1997–1998 was initially the time that the monetary crisis occurred in Indonesia, which then turned into a major economic crisis. The year 2008 marked the global economic crisis that affected the economy of many countries in the world, including Indonesia. Lastly, the year 2020 was the time when the world faced the COVID-19 pandemic as a global health crisis, which turned into a global economic crisis due to the implementation of human mobility restriction around the world.
A performance comparison is conducted statistically by means of a paired t-test. Then, the Wilcoxon sign rank, a non-parametric test of statistics, is also used in this study when the data were not normally distributed. A normality test on the research samples was performed using the Shapiro-Wilk W test. However, the latter test result will not be presented in this article.
The first step of this research is the Shapiro-Wilks test to test whether the financial performance of the modeled company is normally distributed. When the results show that the data are not normally distributed, a non-parametric statistical test called the Wilcoxon signed-rank test will be used to see if there are significant differences between the companies tested. This study also uses a proportion test to determine whether the proportion (P) of firms experiencing a change in a specific direction is more significant than expected by chance. The paired t-test and the independent t-test were carried out in this study, if the data were normally distributed. A comparative analysis was then carried out by comparing the differences in company performance after and before the privatization.
The Wilcoxon signed test is a nonparametric test used to measure the differences between two groups of paired data on an ordinal or interval scale, but the data is not normally distributed. This test is also known as the match pair test. The basis for decision-making in the Wilcoxon signed test is as follows:
When the Asym.sig two-tailed probability value < 0.05, there is an average difference;
When the Asym.sig two-tailed probability value > 0.05, there is no average difference.
The Wilcoxon signed test can be calculated with the formulation:
The paired-sample t-test is often referred to as the paired-sample t-test. The t-test for paired sample data compares the means of two variables for a single sample group. This test calculates the difference between the values of two variables for each case, and tests whether the average difference is zero.
A paired t-test generally tests the difference between two observations. Tests like this are carried out on subjects tested for situations before and after the process or subjects who are paired or similar.
The independent t-test is a comparative test to find out whether there is a significant difference in the mean or mean between the two independent groups with interval/ratio data scales. The two independent groups referred to here are two unpaired groups, meaning that the data sources come from different subjects. The assumptions that must be fulfilled in this independent t-test are:
Interval/ratio data scale;
Data groups are independent or unpaired;
Data per group is usually distributed;
There are no outliers for each group;
The variance between groups is the same or homogeneous.
To perform an unpaired
t-test is done with the formulation:
Xi = average score/value group i
= number of respondents group i
Si2 = group i score variance
To enrich the analysis and discussion in this study, the FESPET multidimensional framework compiled by
Clifton and Díaz-Fuentes (
2022) is included as a tool for further analysis. The financial, environmental, social, political economy, and technological (FESPET) framework are shown in
Table 1.
3.2. Analysis of Determinants of Privatization
This analysis is aimed at identifying variables that illustrate reasons or factors influencing the government’s decision to relinquish its stakes in SOEs. To analyze the determinants of the government’s decision for divestment, after initial privatization state (IPO), this study includes the SPEED, which is measured by the average yearly decrease in the percentage of residual government ownership in each period. Data from 2006 to 2020 were used for this analysis and are later separated into five-year periods.
Chang and Boontham’s (
2017) model of analysis is adopted and adjusted in this study in order to perform this privatization determinant analysis in accordance with the Indonesian context as follows (1):
Transparency International’s Corruption Perception Index (CPI), which is annually published, is applied in order to examine its influence on the government divestment decision on the partially privatized SOEs (CORRUPTION). The survey for this index has been regularly conducted in Indonesia since 1995. CPI scores start from 0 to 100, where the higher score indicates the cleaner the surveyed country from corruption. The CPI score comes from 13 global surveys, expert assessments, and well-known businessmen (
Transparency International 2022).
Furthermore, government debt level (DEBT) is also included in this research as an independent variable that determines the privatization decision. In addition to examining privatized SOEs, this study is also counting stock turn in the stock market as a determinant variable. The proxy for measuring the independent variable is the central government debt to GDP ratio. Several previous studies detected that the higher the government debt level, the stronger the pressure to conduct privatization (
La Porta et al. 1999;
Roland 2001). These previous studies had also demonstrated that strong stock exchange tends to encourage government to divest its remaining shares in privatized SOEs (
Dewenter and Malatesta 1997,
2001;
Megginson et al. 2004).
Another determinant variable for the privatization decision constitutes competition in the domestic market. To measure and illustrate the level of this domestic competition in the domestic market in the surveyed country, a proxy of the economic freedom index (EFI) is used, where EFI scores were acquired from global surveys conducted in some countries, including Indonesia. These EFI measures had also been used in previous studies where the success rate of privatization was also calculated through domestic competition measurement by means of an EFI proxy (
Shah 2003). Significantly higher EFI scores present more pressure on the competition through the provision of free institutions and also encourage the government to relinquish its stakes in available SOEs (
Chang and Boontham 2017).
The next independent variable to be analyzed is the foreign direct investment (FDI). Previous studies unfolded a positive relation between the FDI and privatization (
Banerji et al. 2001). Bigger foreign investments will not only require improvements on the institution and the investment climate but also demand protection upon private rights (
Perotti and van Oijen 2001). Thus, the growing FDI is expected to motivate governments to conduct full privatization (
Chang and Boontham 2017). Additionally, the GDP variable is computed by using the natural logarithm of the GDP per capita (LGDPC) as a proxy.
Other than those country-level determinants considered by the privatization decision makers, the firm-level determinants are also added in this research model. They are variables indicating profitability, which are measured from the return on sales (ROS), company size (SIZE) which is computed by the logarithm of total asset, level of debt (LEVERAGE) which is calculated from the company’s total debt divided with the total asset, and asset growth (ASSETGROWTH) which is measured from the growth of company’s total asset. All these independent variables have been used in previous research to measure the government decision’s in divesting its remaining shares in privatized SOEs (
Boubakri et al. 2015;
Guedhami and Pittman 2006).
Moreover, the percentage-level of shares owned by the government (STATEOWN) is also included as an independent variable as well as the government control level (CONTROL) as a dummy variable, where the number 1 indicates that the government ownership of the existing SOEs is more than 50% and the number 0 means the other way around. The next independent variable is the number of employees (EMPLOYEES) from every privatized SOE. The bigger a company is, the more profitable it is. Therefore, the faster it can grow, the lower its debt is, and thus the bigger percentage of ownership the government retains, and the more employees it hires, the slower the government is to relinquish its shares from the company. All these variables were used in
Chang and Boontham’s (
2017) study.
Finally, the economic crisis (CRISIS) is included as a new independent variable where its influence is analyzed against the dependent variable (SPEED). Some economic crises have affected the Indonesian economy and become an influential factor for the government to divest its stakes in privatized SOEs. The economic crisis presented an additional load on the government budget which allows the government to sell its remaining stocks. However, there is also a possibility that the government could save companies that have financial difficulties due to the economic crisis by raising its equity participation in the companies due to political pressure.
5. Discussion
This study analyzed privatization in Indonesia by comparing corporate performances before and after privatization, in the short- and the long-term periods of privatization, and before and during the economic crises. Measures of performance are the ratios of profitability, operational efficiency, employment, and debt (leverage) of Indonesian state-owned enterprises.
The comparison of performance before and after privatization pointed out a significant difference, but with the declining capacity for profit-making after SOEs were privatized. This is unlike the companies’ operational efficiency, which was significantly different and increasingly growing after privatization. With the SOEs’ debt levels lowering after being privatized, there was no difference for employment variables before and after privatization, while the companies’ debt variables were significantly different in both periods. This improvement of the ability to pay debts after privatization is in accordance with several previous studies (
Bradley et al. 1984;
Omran 2004).
On the other hand, the comparison between pre- and post-privatization and short- and long-term performances shows relatively no difference. Corporate sale efficiency in the long-term period was the only variable that shows improvement, while companies’ debt level (leverage) showed a positive growth in the long-term period after privatization. This result does not fit the previous prediction, arguing that the privatized companies’ debt levels should decrease through time, due to the implementation of innovation and the extensive access of the companies to the domestic and international stock market in order to obtain more capital injection from issued shares (
MacKenzie 2008;
Munari and Oriani 2005;
Ross 2008). Through the increase of leverage, SOE privatization in Indonesia may have been inclined to choose debt instruments (bonds) to obtain capital injection, instead of issuing long-term shares. Increasing debts in the long-term will certainly be risky for the privatized SOEs in the long run.
Furthermore, the implementation of innovation should also be operational and is predicted to be able to raise performance and efficiency of the companies. Internal resistance for privatization from the inside will expectedly decline over time. This means that, with some essential decisions the government or the company’s managers make usually have a real effect in the long-term, and the companies’ internal stakeholders will eventually accept the privatization decision, thereby allowing the performance to improve in the long-term as well, rather than in the short-term.
Accordingly, this research produced no difference in the performances of privatized SOEs in the long-term rather than the short-term. This is not in accordance with previous studies, which found that the company’s performance on the long-term after the privatization would be better due to innovation of the company and also the acceptance of privatization by the company employees (
MacKenzie 2008;
Munari and Oriani 2005). The cause for this negative result may come from the fact that the observation period of one and two years after privatization, which were compared with the period of three and four years after privatization, may have been relatively too short in that the expected difference between performances in both periods of time could not be identified. Therefore, extending the observation period in a similar study in the future may produce different outcomes.
With regard to economic crises, all indicators of performance referred to in this study show no difference of performance before and at the time the crises hit. The government may have been prepared and anticipated problems with the SOEs financial positions at the time the economic crisis touched down, so that the crisis would not cause problems for SOEs to make profits, thereby maintaining efficiency, maintaining the employment structure, and even keeping the company’s debt on the low-risk and safe level. Based on previous studies, it is generally found that the economic crisis has an impact that reduces companies’ efficiency and reduces the company’s performance (
Aifuwa et al. 2020).
Altogether, for the medium and short terms, all variables predicted in the regression model of this study indicate a significant influence on the speed of government ownership relinquishment in SOEs, whereas for the short-term, privatization determinants in Indonesia, corruption perception (CORRUPT) was apparently significantly influential, and in the medium-term, ROS and ASSETGROWTH are the most influential variables. In the long-term, it is the level of government share ownership (STATEOWN) that becomes the significantly influential variable. The variables STATEOWN, ASSETGROWTH and ROS were found to be the determinant of privatization in Indonesia in this study, in accordance with the several previous studies (
Chang and Boontham 2017;
Boubakri et al. 2015). Meanwhile, the CORRUPT variable is a determinant of privatization, which in previous studies had no influence on the government’s decision to release the remaining shares on the state-owned companies.
When reviewed using the FESPET multidimensional framework, privatization in Indonesia was found not only to pursue the goal of improving financial performance alone. When PT Indosat was privatized, for example, the Indonesian government experienced fiscal difficulties due to the monetary crisis that occurred in 1997. Therefore, the motivation for privatizing Indosat at that time had more of a political economy dimension than the aim of improving Indosat’s finances. Likewise, several other state-owned companies privatized in the late 1990s had more or less the same goal of alleviating the government’s fiscal burden due to the monetary crisis that led to the economic crisis at that time.
The absence of an improvement in the company’s ability to generate returns on company equity despite efficiency improvements can also be seen in this FESPET framework. SOE companies in Indonesia, such as those engaged in the energy, telecommunications, construction, and health sectors, are given a social mission in pursuing technology in the telecommunications sector, building road infrastructure in remote areas such as Papua and other Eastern Indonesia, as well as a social mission in the health sector during the COVID-19 pandemic, which hit in 2020. In this social dimension, companies no longer only pursue short-term performance in the financial sector (
Sorrentino 2020).
In Law No. 19 of 2003 concerning SOE, corporatization in Indonesia has begun. The railway service company (Perjan) was corporatized by changing to a public company (Perum) and then changed again to a limited liability company (PT). Likewise, several public companies (Perum) initially tasked with serving public needs were changed to limited liability companies (PT). Perum Perindo changed to PT Fisheries Indonesia (Persero), and Perum Pegadaian changed to PT Pegadaian (Persero).
If analyzed using the stages of corporatization presented by the
World Bank (
2016), the corporatization process for Perjan and Perum in Indonesia to become a limited liability company (PT) is different from the ten sub-processes presented by the World Bank. According to David
McDonald (
2014), pursuing all the sub-processes submitted by the World Bank will lead to privatization. The ten sub-processes presented by the World Bank lead the company towards commercialization. McDonald calls this neoliberal corporatization. Where corporate entities are indeed prepared to go towards privatization, and the government’s role will be increasingly diluted.
According to
McDonald (
2014), the alternative to neoliberal corporatization is progressive corporatization. In this corporatization of government entities, the government’s role and control are maintained while providing considerable autonomy to existing public companies. The idea is to create more transparent financial management with independent accounting procedures, reduce political interference, let managers manage companies in a business environment, and strengthen institutions’ loan status and credit rating.
The corporatization of Perjan and Perum in Indonesia to become a limited liability company (PT) is more like the progressive corporatization conveyed by McDonald. Perjan and Perum, which were privatized, were corporatized so that they operate more professionally as companies that are not too interfered with by the government’s political interests. It has been proven that, to date, there have been no Perjans or Perums that have been corporatized into limited liability companies (PT), and none of which have been privatized like other state-owned companies that have been established in the form of limited liability companies from the start. Public corporations are created through a process known as “corporatization” when public services previously regulated, produced, and provided directly by the state through government entities at both local and national levels, are transformed into corporations (
Clifton and Díaz-Fuentes 2018). In Indonesia, SOE is given social and environmental responsibility (TJSL). The TJSL provided to SOE includes (1) providing benefits for economic development, social development, and environmental development, as well as legal and governance development for companies, (2) contributing to creating added value for companies with principles that are integrated, directed, and measurable impact and accountable, and (3) fostering micro and small businesses to be more resilient and independent, as well as the community around the company. SOE TJSL in Indonesia is regulated by the Minister of SOE Regulation Number PER/05-MBU/04/2021. When analyzed using the FESPET multidimensional framework (
Clifton and Díaz-Fuentes 2022), it can be concluded that the Indonesian government has not entirely relinquished control and management of SOEs to the private sector. Even though some SOE shares were sold to private parties, the Indonesian government maintained the continuity of SOE businesses when the economic crisis occurred, for example, and still gave social and environmental responsibility to SOE. For example, when Garuda Indonesia experienced financial difficulties due to its debt, which had grown to 151 trillion rupiahs, the government made an additional capital investment of 7.5 trillion to improve the capital structure and increase Garuda Indonesia’s business capacity. Meanwhile, to maintain the social and environmental responsibility of SOEs, the government still assigns SOEs in Indonesia the tasks of fostering micro and small businesses, maintaining sanitation and clean water, maintaining the availability of housing at affordable prices, and protecting marine ecosystems.
6. Conclusions
Regarding economic crises, all performance measures referred to in this study reveal no change in performance before and after the crises occurred. The government may have been prepared and anticipated problems with SOEs’ financial position when the economic crisis hit so that the crisis would not cause problems for SOEs to make profits, maintain efficiency, maintain the employment structure, and even keep company debt at a low-risk and safe level.
The new finding in this study is that there has been an improvement in the efficiency of state-owned companies in Indonesia after privatization, but this has yet to be followed by an improvement in the company’s ability to generate profits for shareholders. In addition, it was found that increased efficiency after privatization was carried out but did not cause an increase in the rate of return to shareholders. It was also found that there was a decrease in the risk of state-owned companies after privatizing by reducing the company’s debt ratio after privatization. In the long term, after privatization, there was only improvement in terms of sales efficiency. This improvement in sales efficiency is in line with the tests before and after the privatization was carried out. This means that it emphasizes that efficiency improvements continue to be made, starting from privatization until four years later. The company’s debt ratio shows an increase in the long term after the privatization is carried out. This means that companies that are privatized are even more at risk because most of the SOEs that have been privatized add to the company’s debt starting in the third year after the privatization was carried out. This is in line with the evidence found in
Table 2. The ability to increase profitability ratios is still the same, making managers (agents) try to increase the inflow of funds from external parties by increasing the company’s debt.
Nonetheless, this research also has some limitations. First, samples of companies were relatively limited due to the limited number of privatized SOEs in Indonesia. Therefore, the next researchers focusing on this topic should take samples from a country with abundant SOEs being privatized. Second, the periods chosen to analyze the impacts of economic crises on privatized SOEs in Indonesia were also relatively narrow, that is, one year before the crisis compared to the year when the crisis occurred. Next, investigators may improve this design by taking data from a longer period and comparing it with the year after the economic crisis. For example, a period of two or three years before the economic crisis can be compared with the period of two or three years after the crisis.
Finally, with the pandemic bringing along with it a global economic crisis reaching nearly all countries in the world, it is also suggested that the impact of the special time period of the COVID-19 pandemic in the middle of 2020 on the privatized companies’ operational performance be investigated. Consequent to the scale of the global economic crisis, this also presents serious difficulties for all companies, including state- and private-owned enterprises. It is a possibility that SOEs were given additional social responsibilities by the government during the pandemic so that SOEs’ responsibilities burdened the companies’ financial position, especially if the government was not willing to support these SOEs or when the government delayed paying its obligations to SOEs, which are tasked. This is more likely to happen with SOEs specializing in the social or basic needs field, health industries, and the like. Future research will be expanded by comparing the performance of privatized state-owned companies with private companies in industries similar to existing state-owned companies.


