European Union Innovation Efficiency Assessment Based on Data Envelopment Analysis
Abstract
:1. Introduction
2. Literature Review
3. Methodology
3.1. Selection of the Variables
3.2. Correlation Analysis
3.3. Data Envelopment Analysis
4. Results
4.1. Findings of the Correlation Analysis
4.2. Findings of the Data Envelopment Analysis
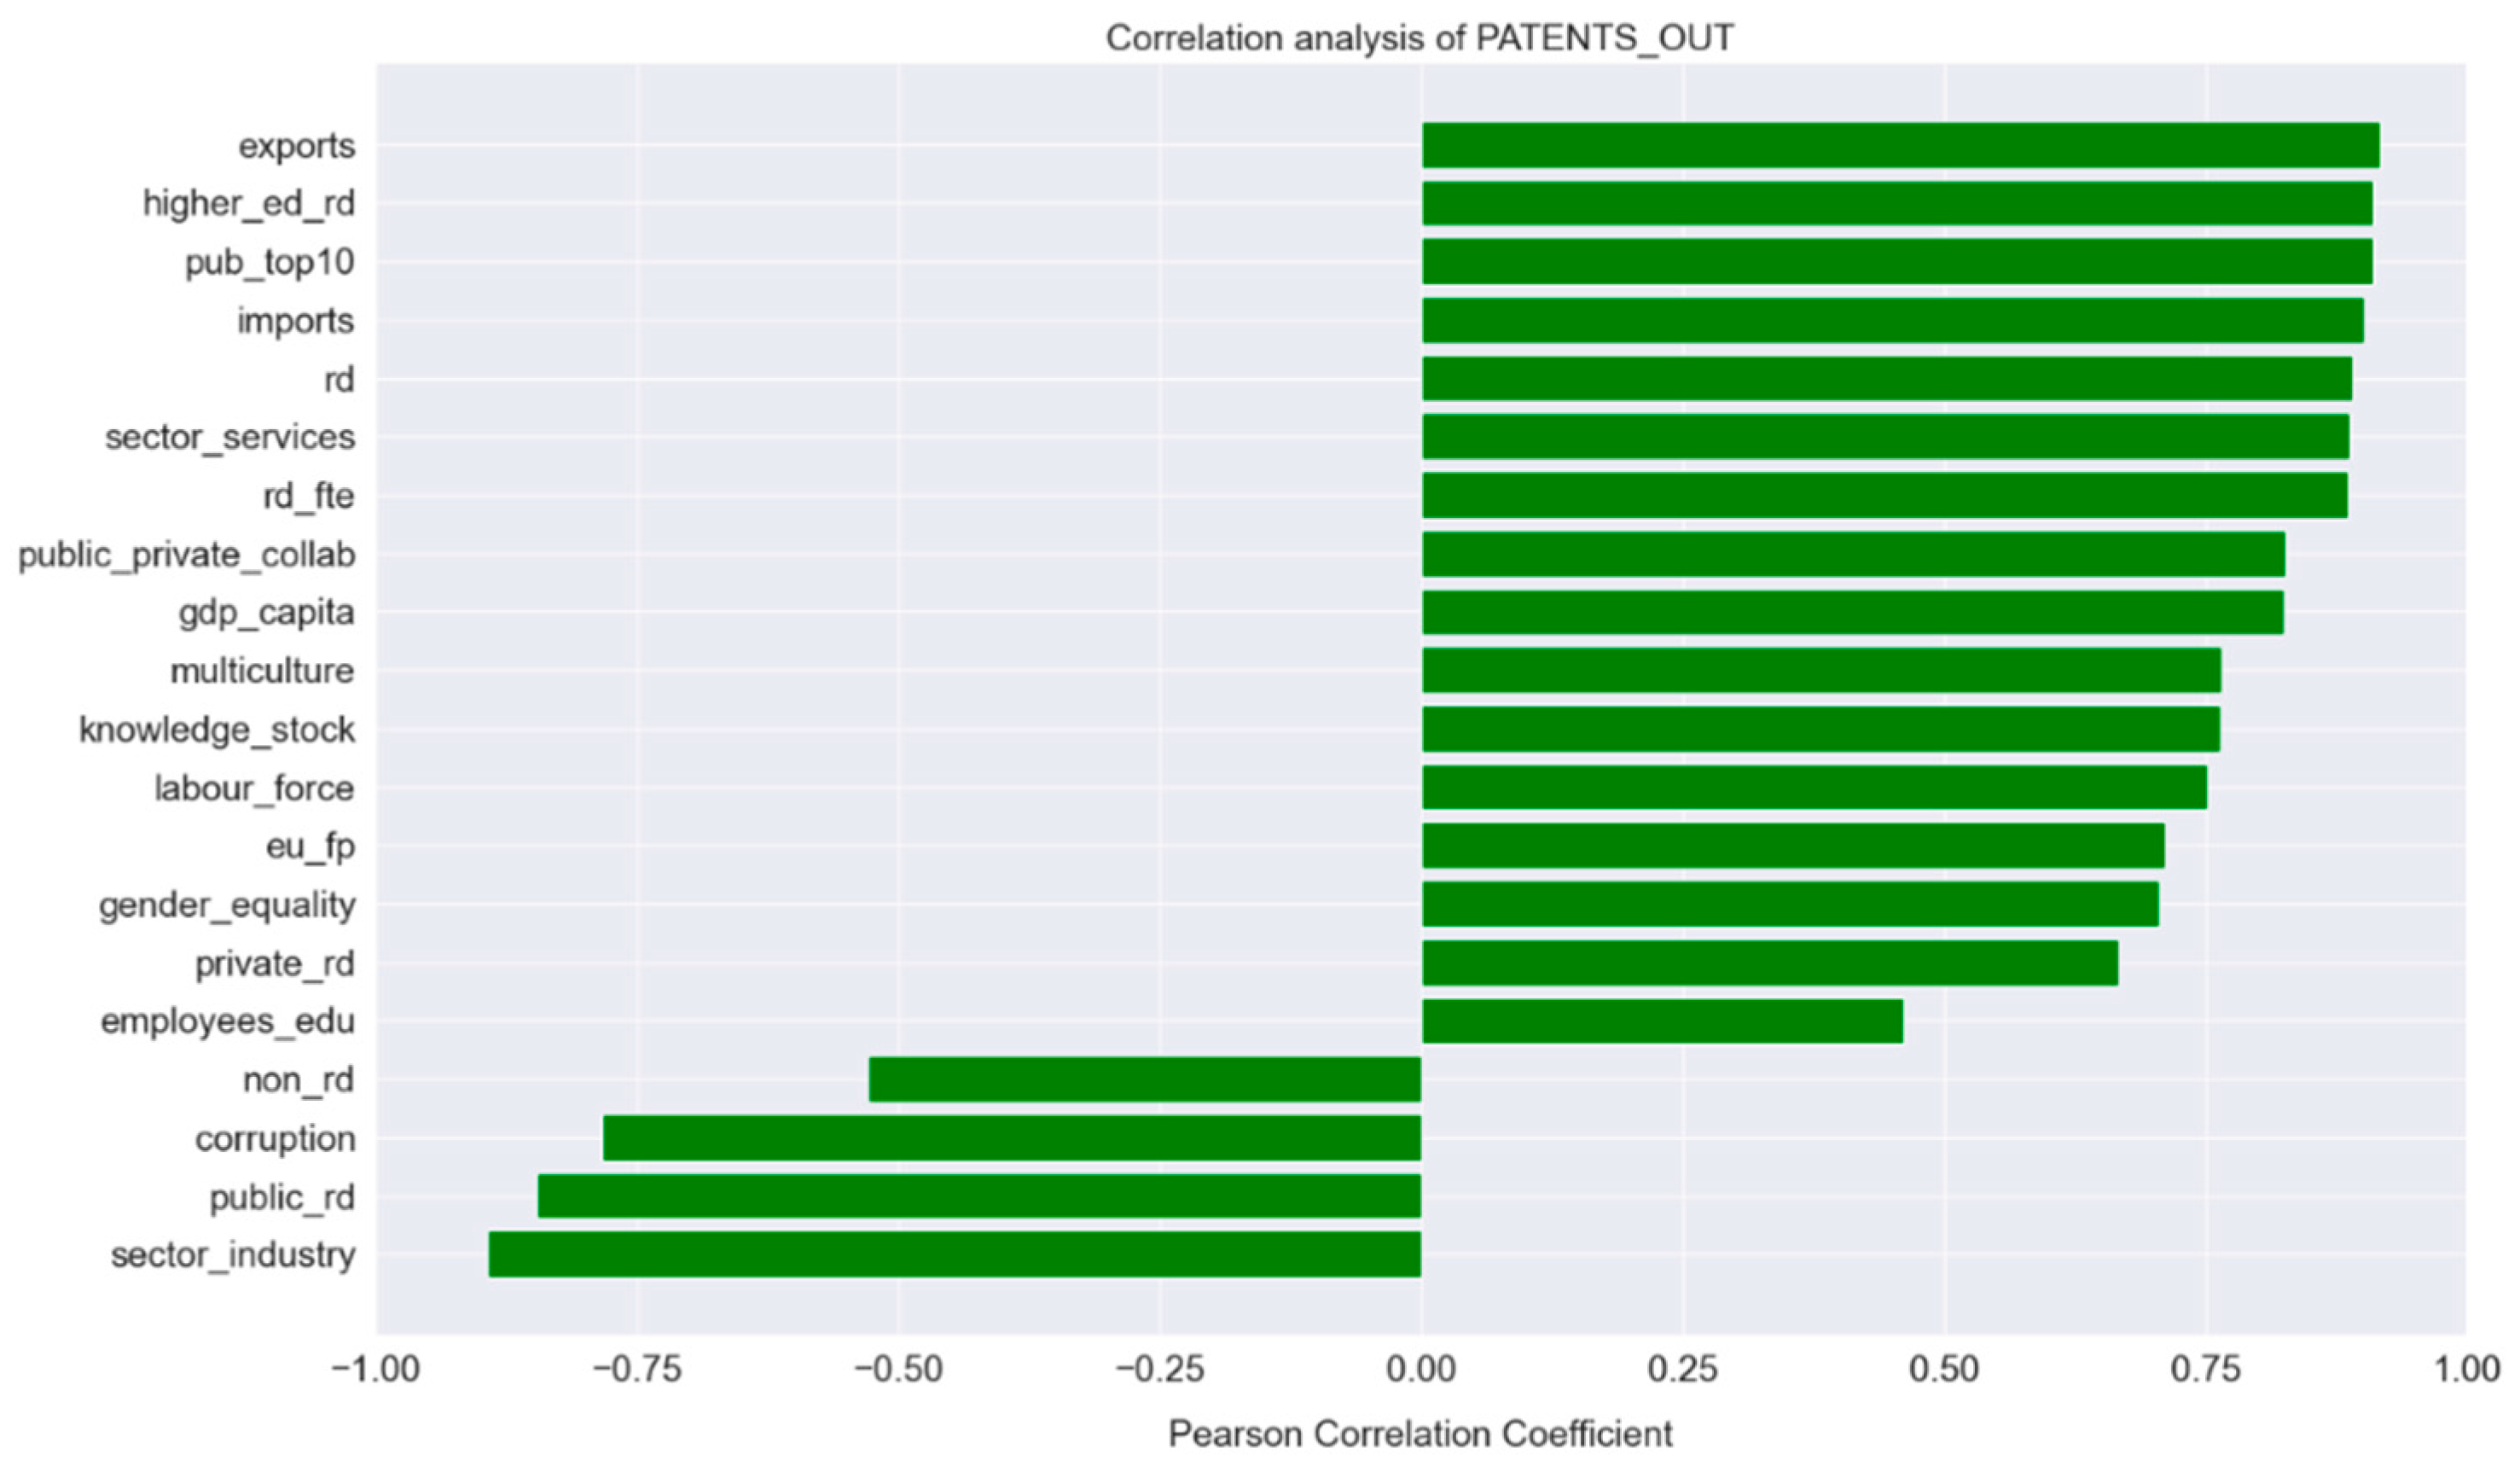
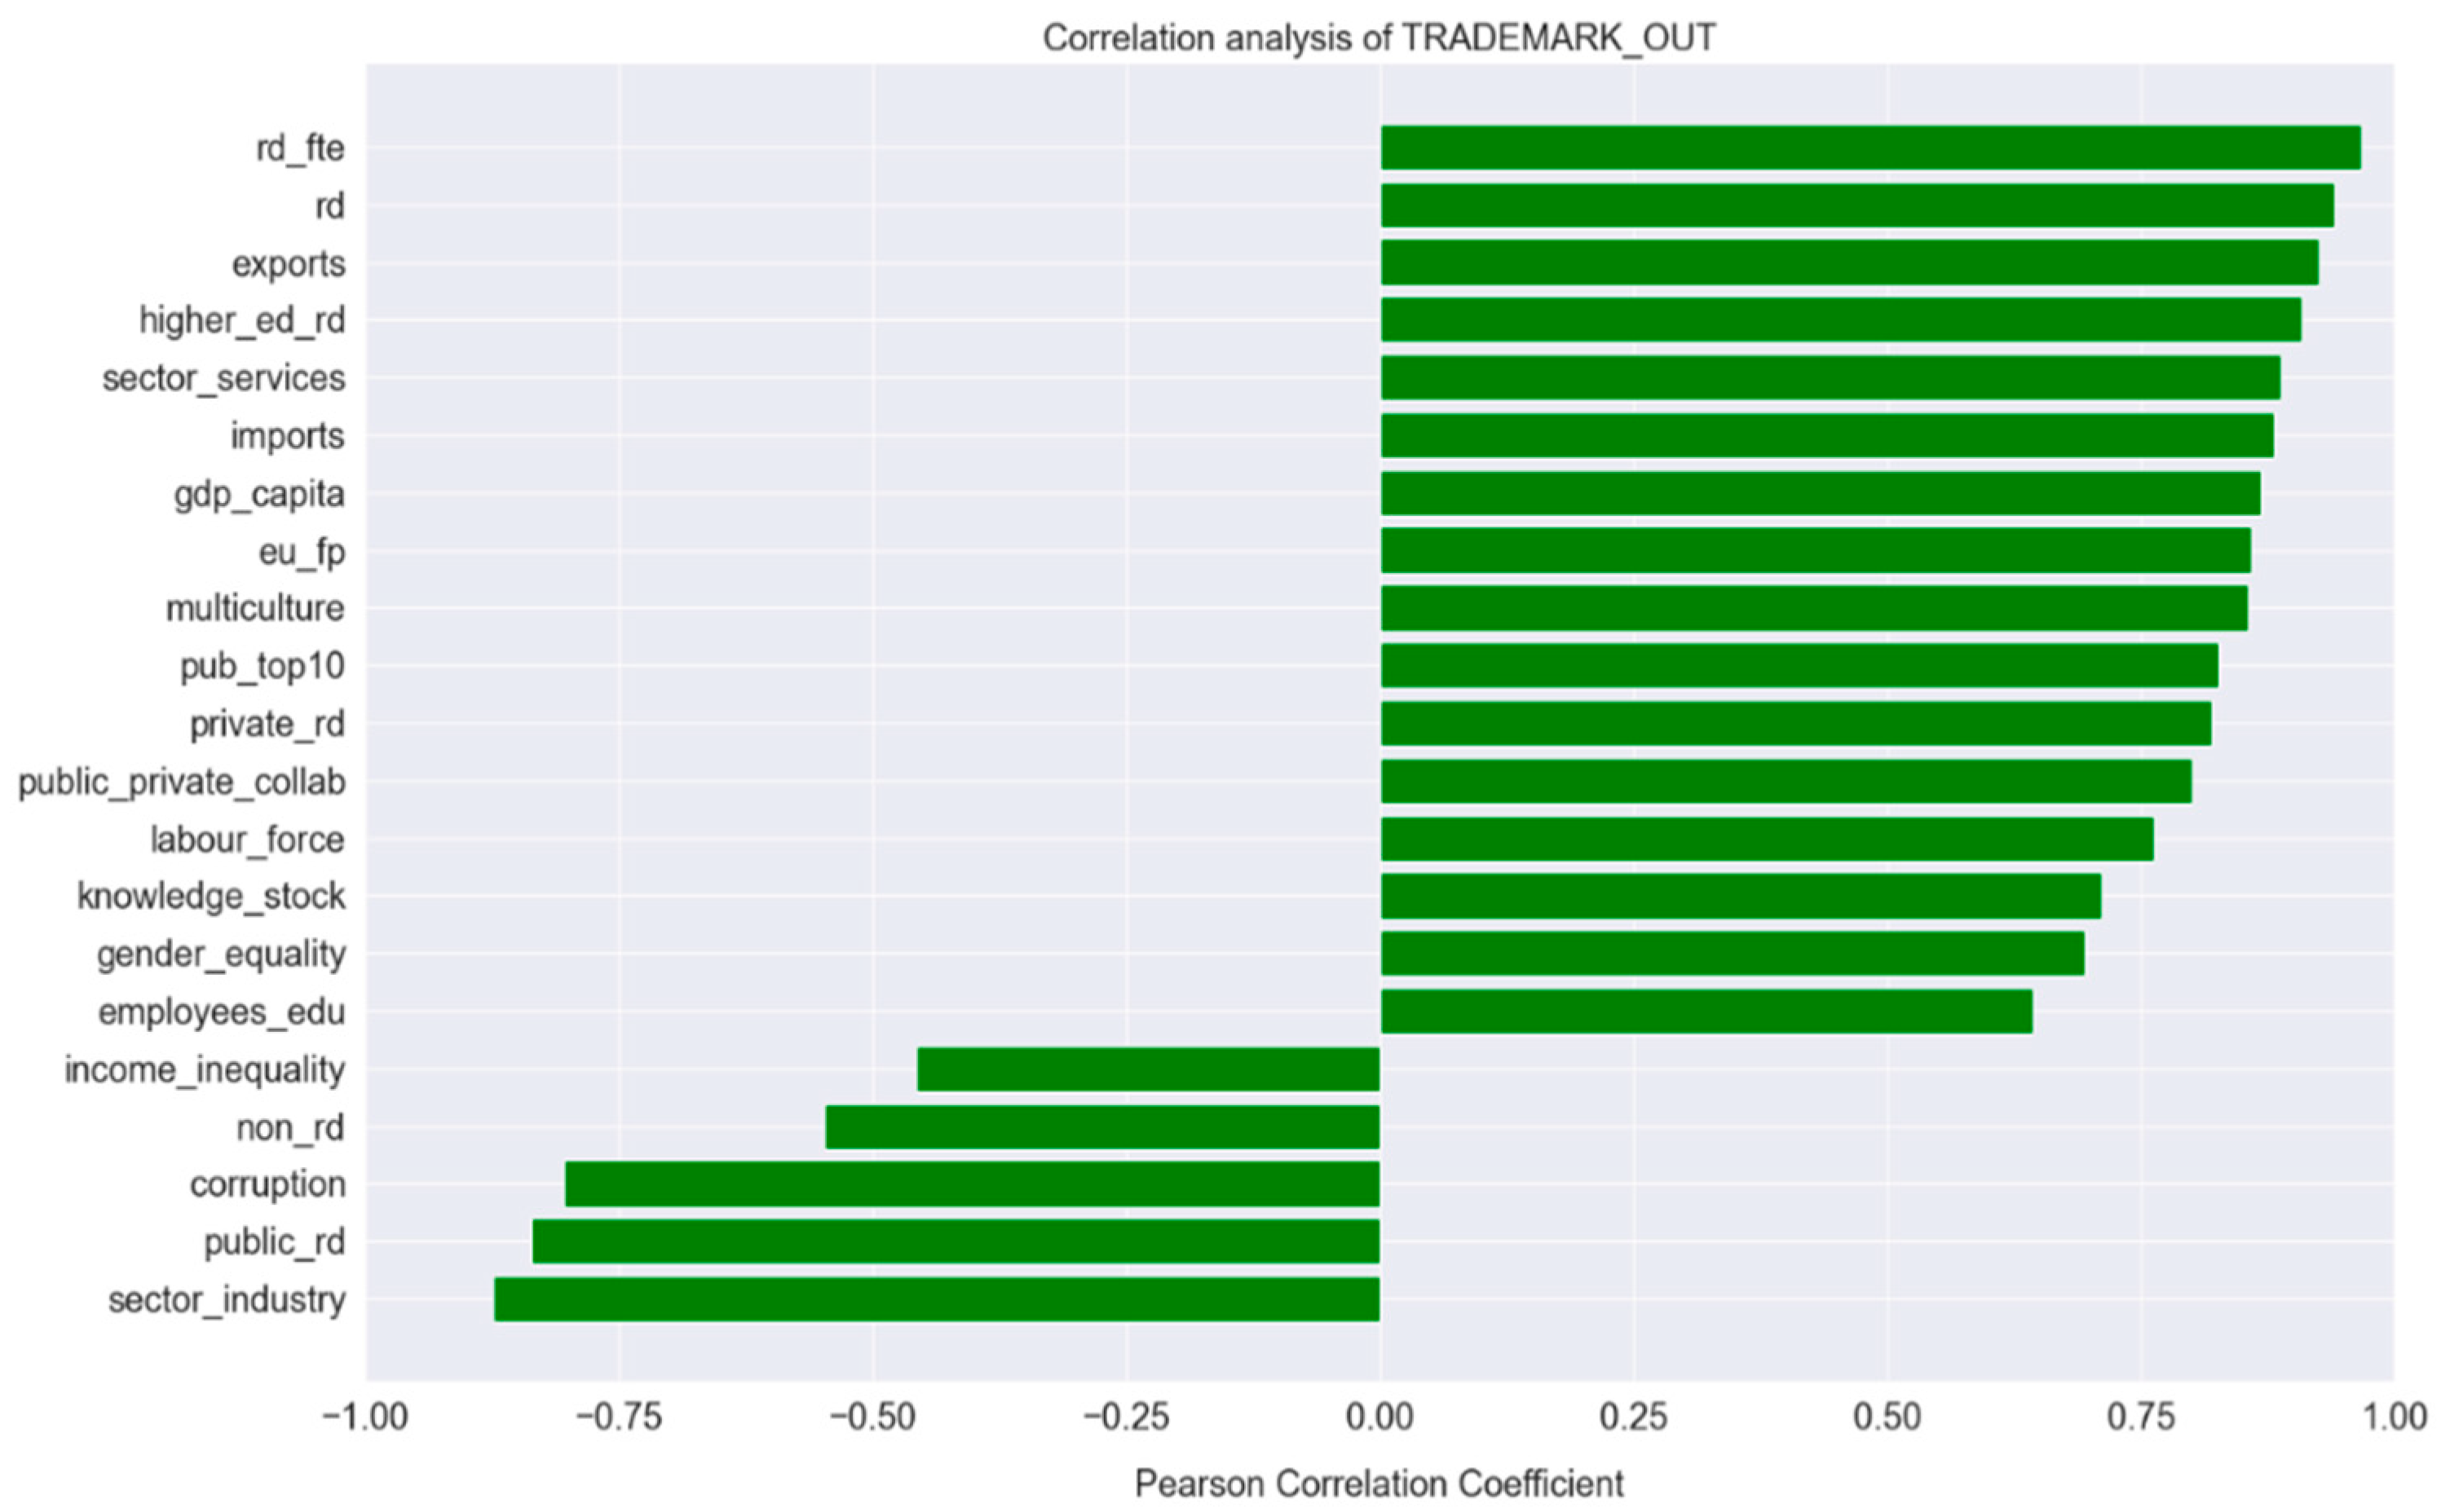
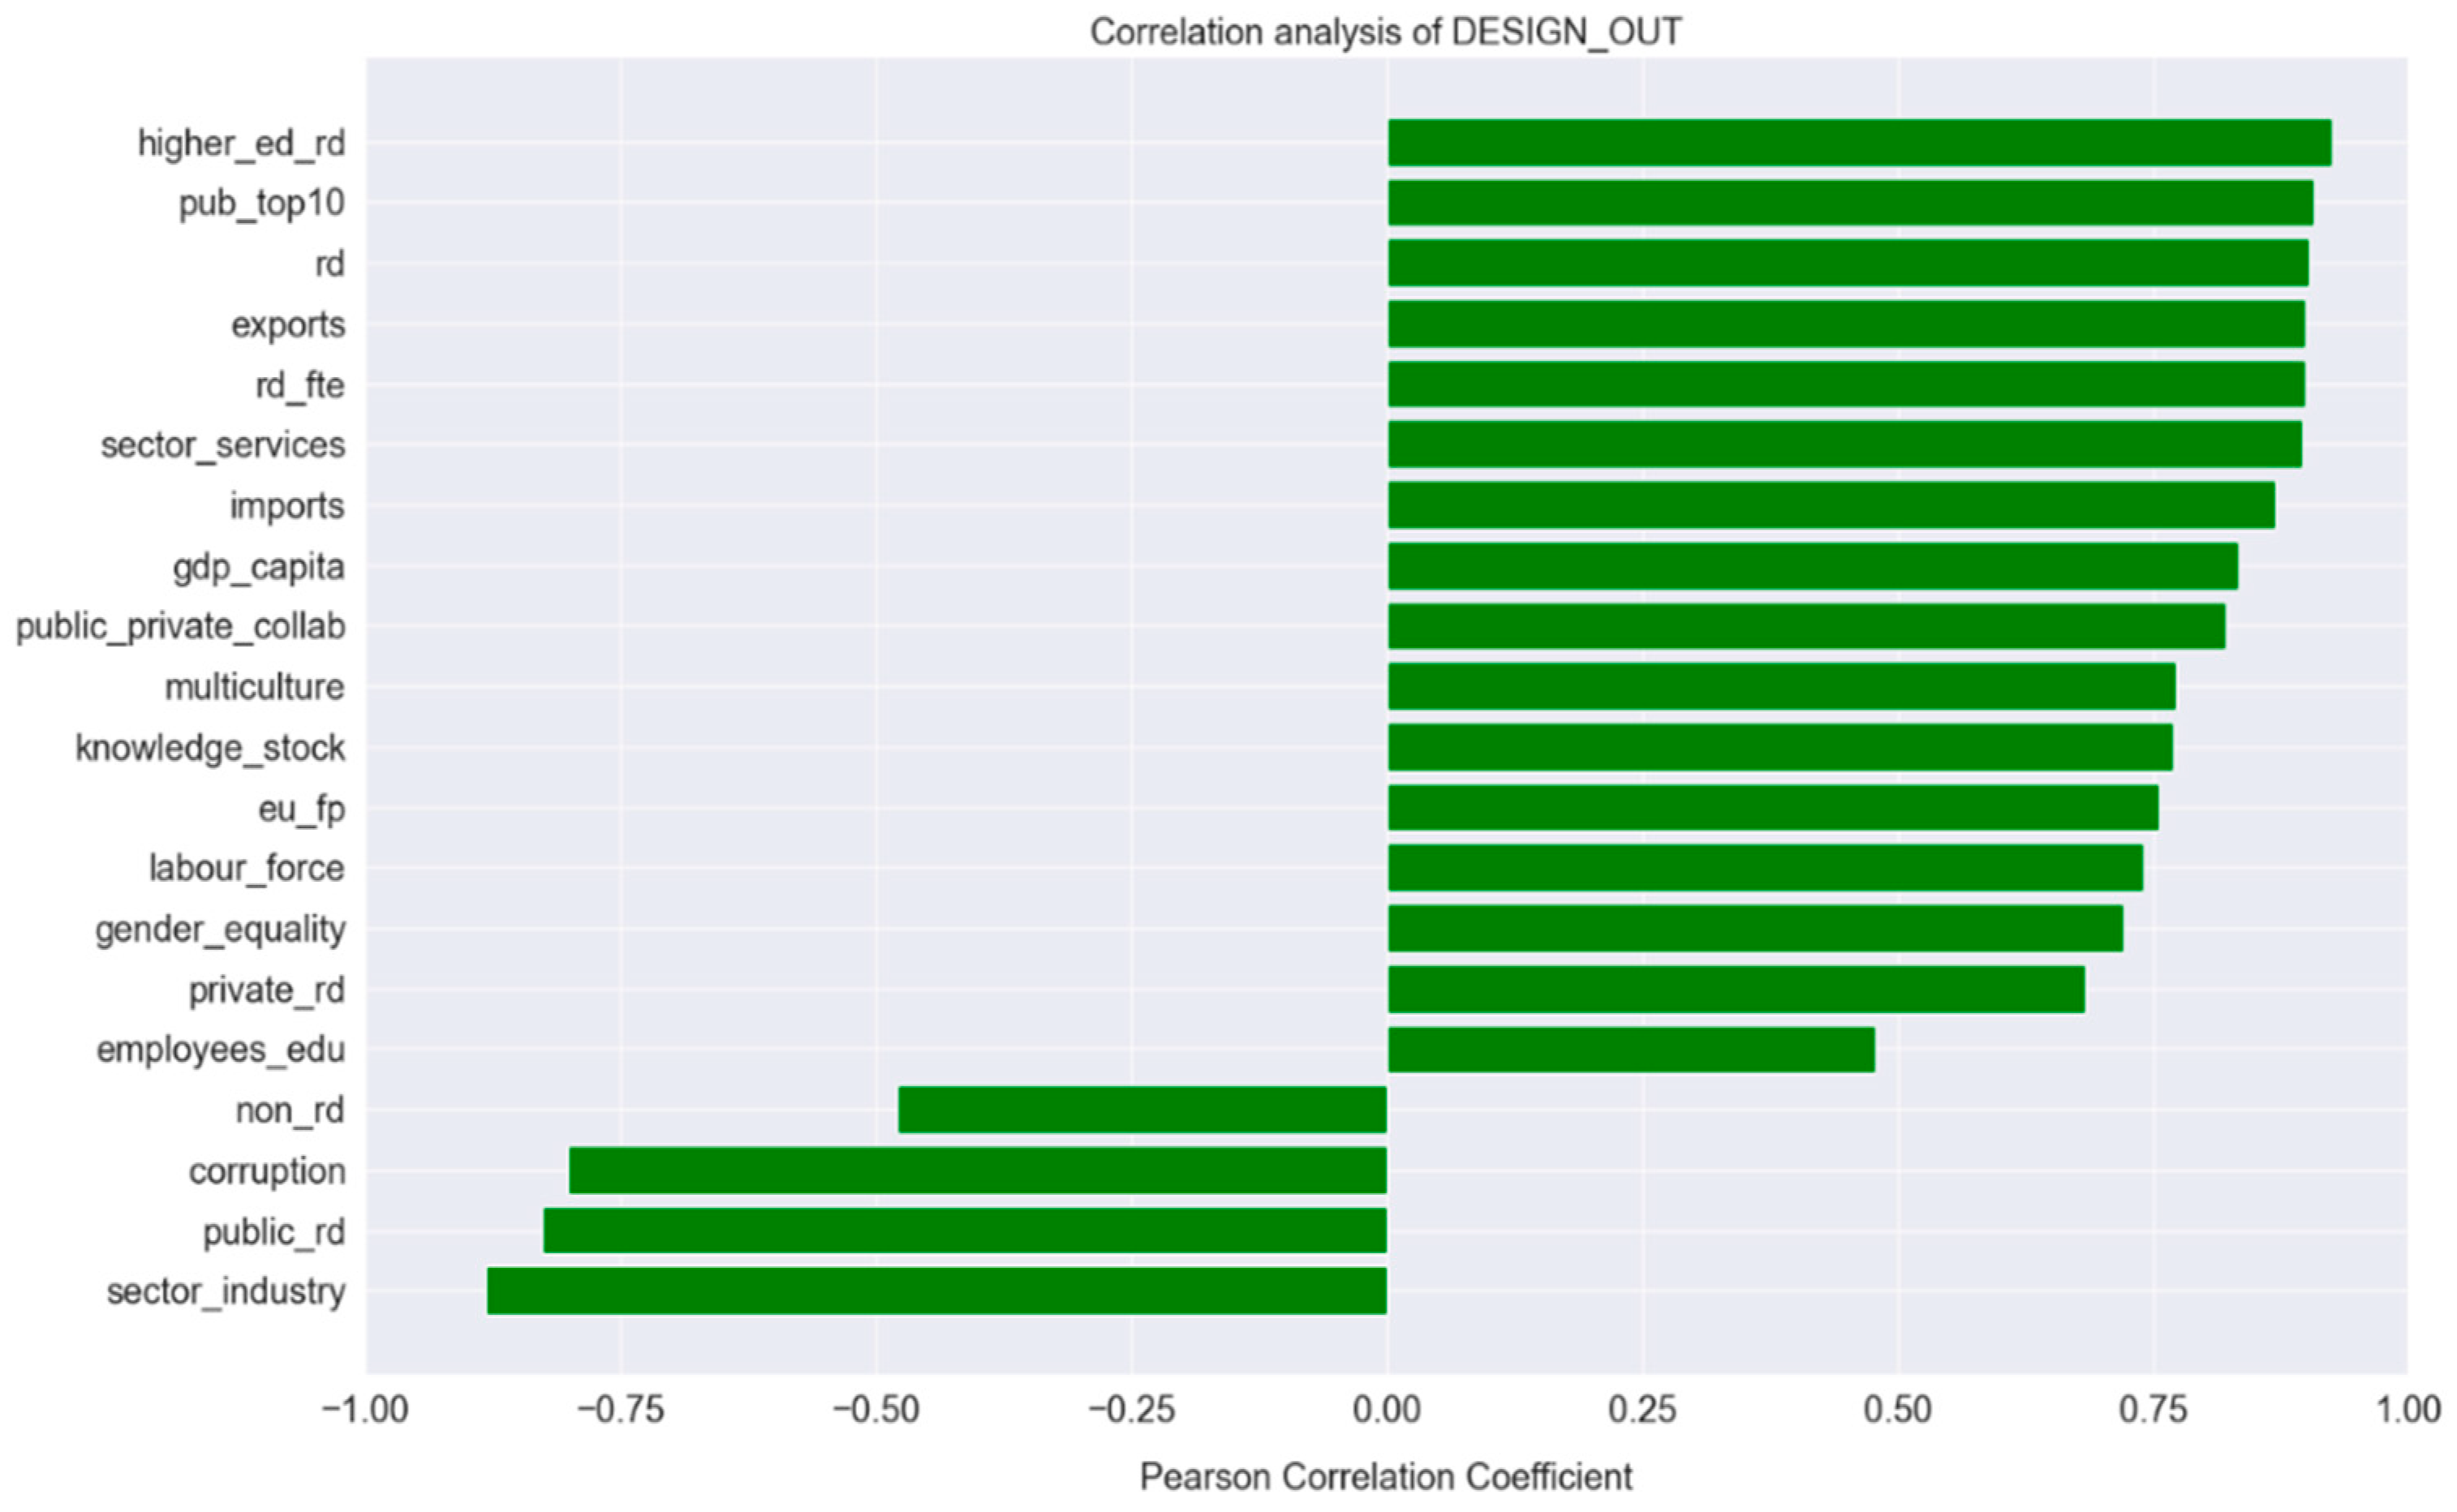
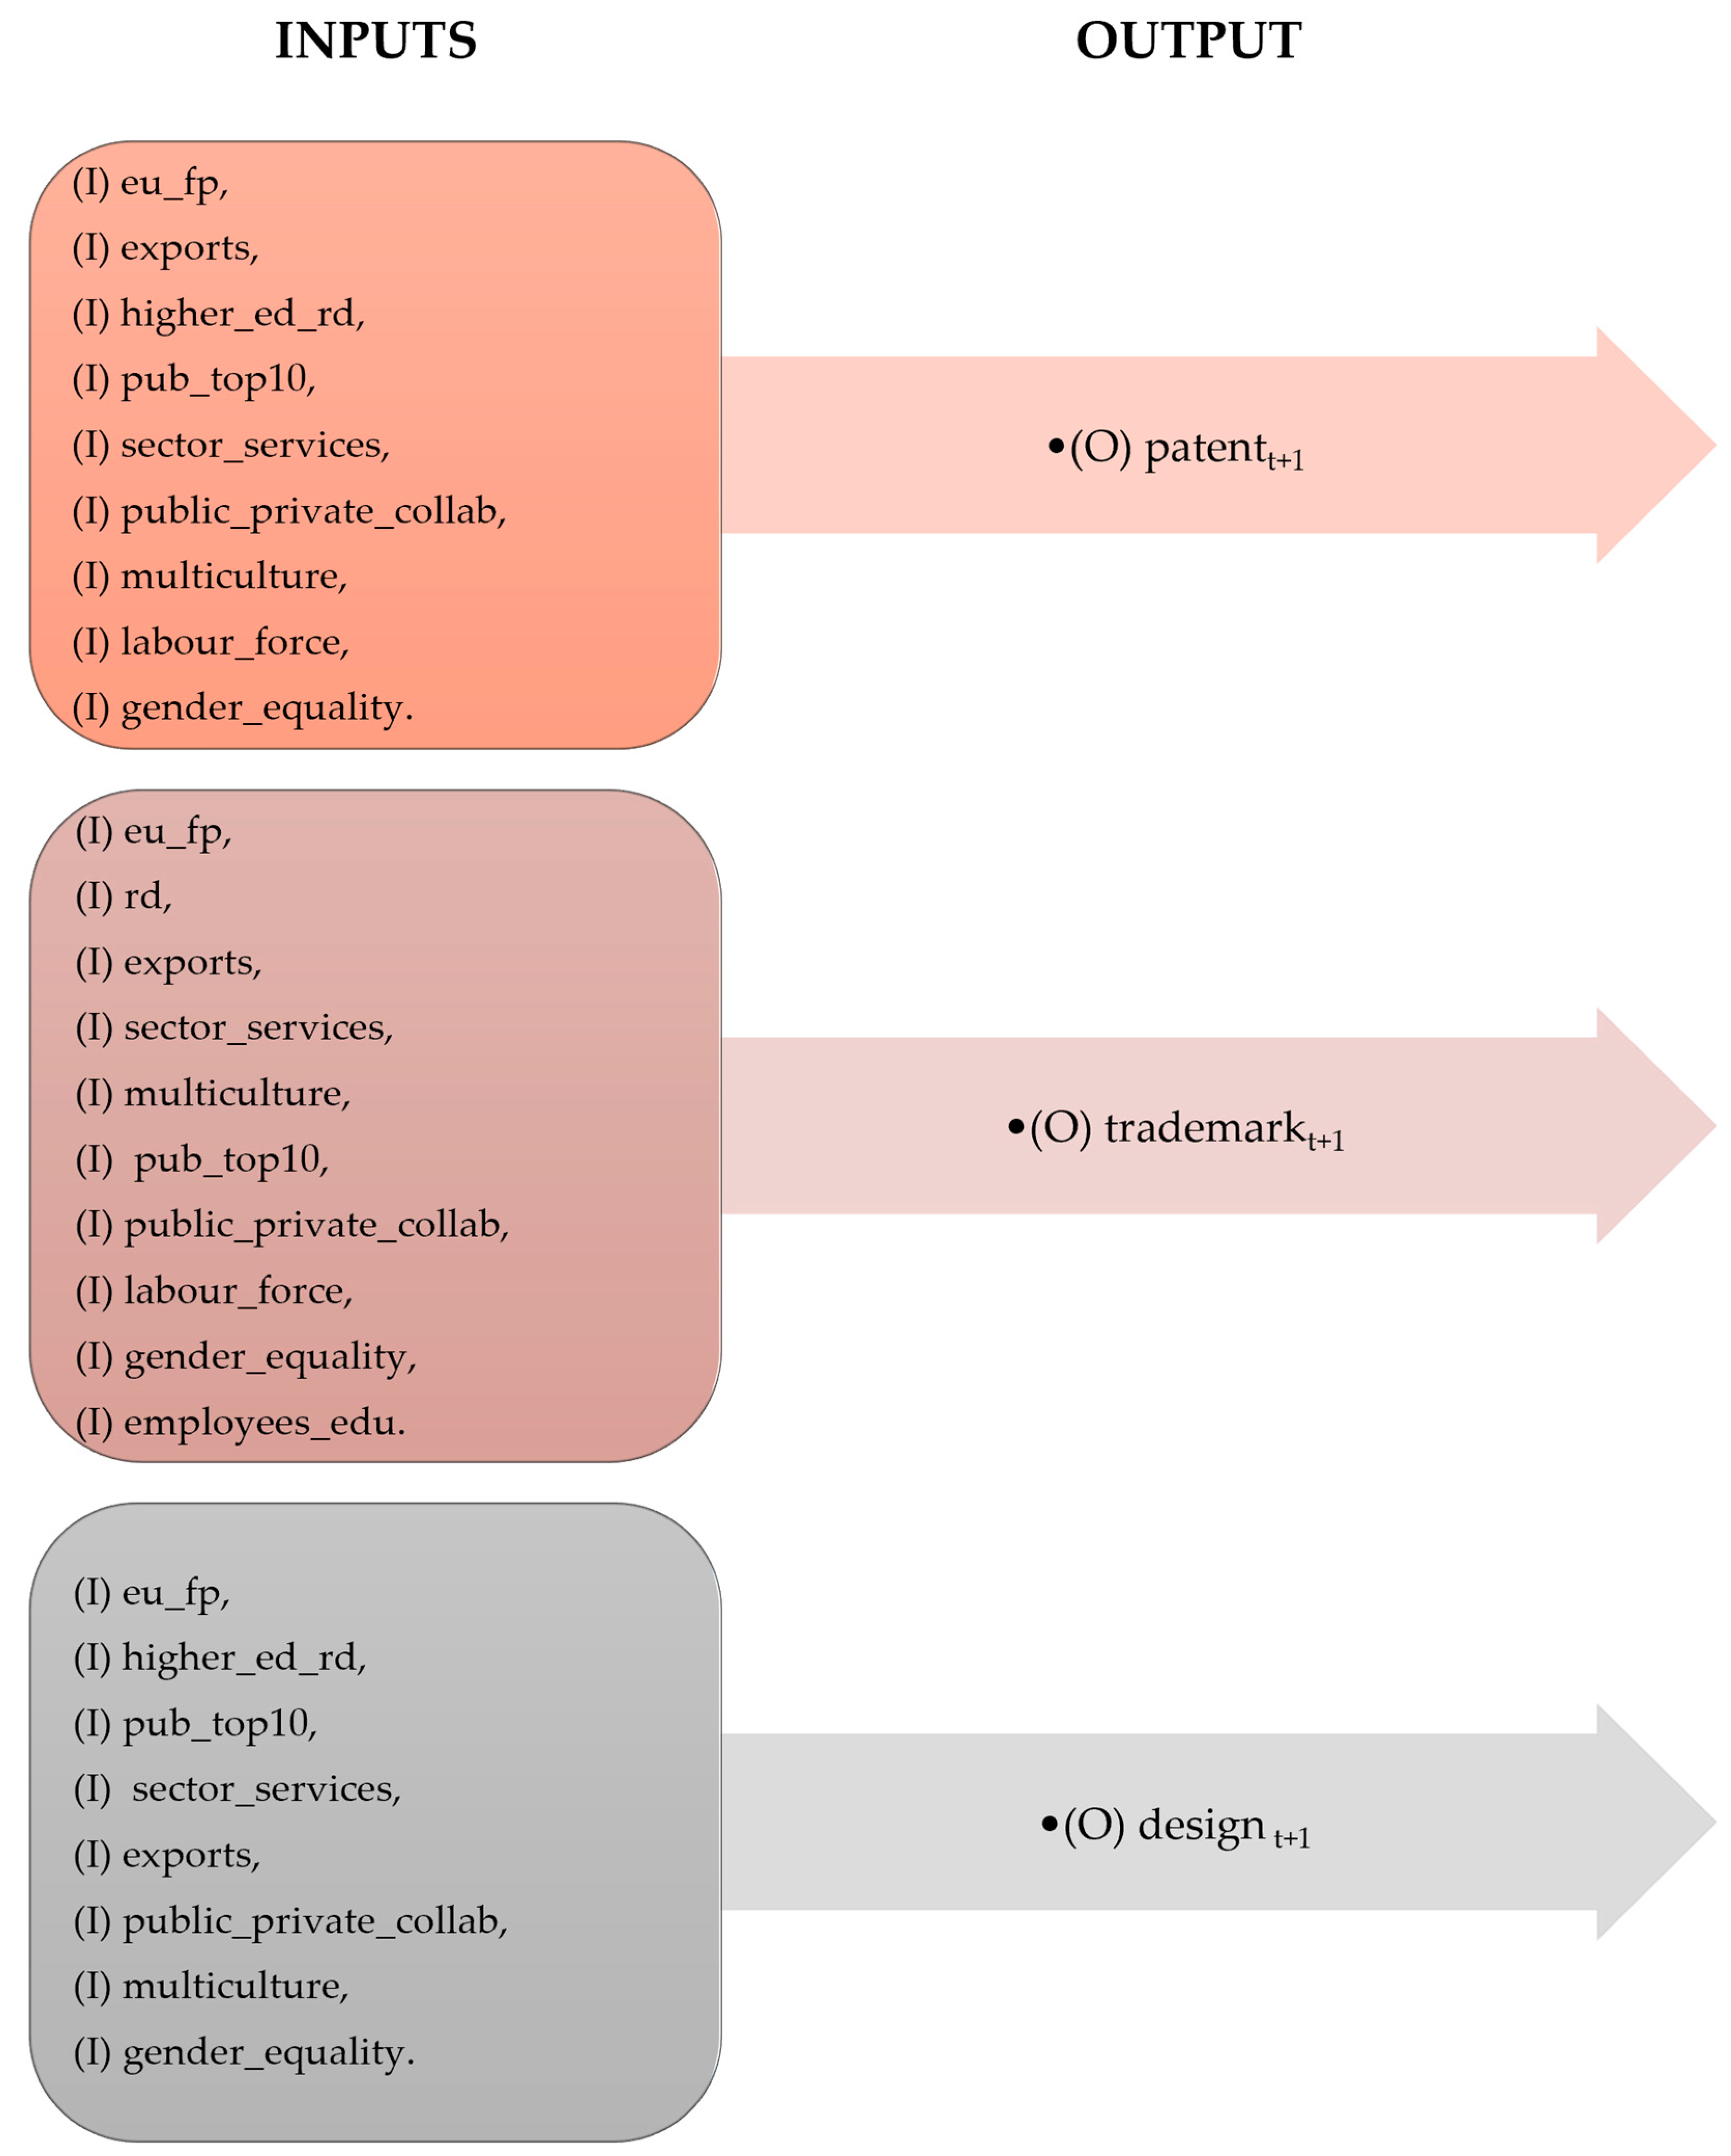
- As DEA is based on the input–output logic, the input indicators that were negatively associated with the outputs were not included in the further investigation (e.g., in the case of design applications, these were intramural R&D investment in the public sector (coef. −0.83), corruption (coef. −0.80), the share of the industry sector (coef. −0.88), and non-R&D investment (coef. −0.48)).
- There had to be a statistically significant positive relationship of a coef. > 0.5 with the output variable (i.e., (1) patents, (2) trademarks, and (3) designs)), e.g., in the patents’ case, employees_edu, non_rd, corruption, public_rd, and sector_industry were omitted from the analysis (see Section 4.1. for more information).
- If any multicollinearity (coef. > 0.9) between the input variables was captured, the input variable with the weaker relationship with the output variable was excluded from the later analysis (see the extended correlation results in Appendix B).
4.2.1. EU Innovation Efficiency across the Member States
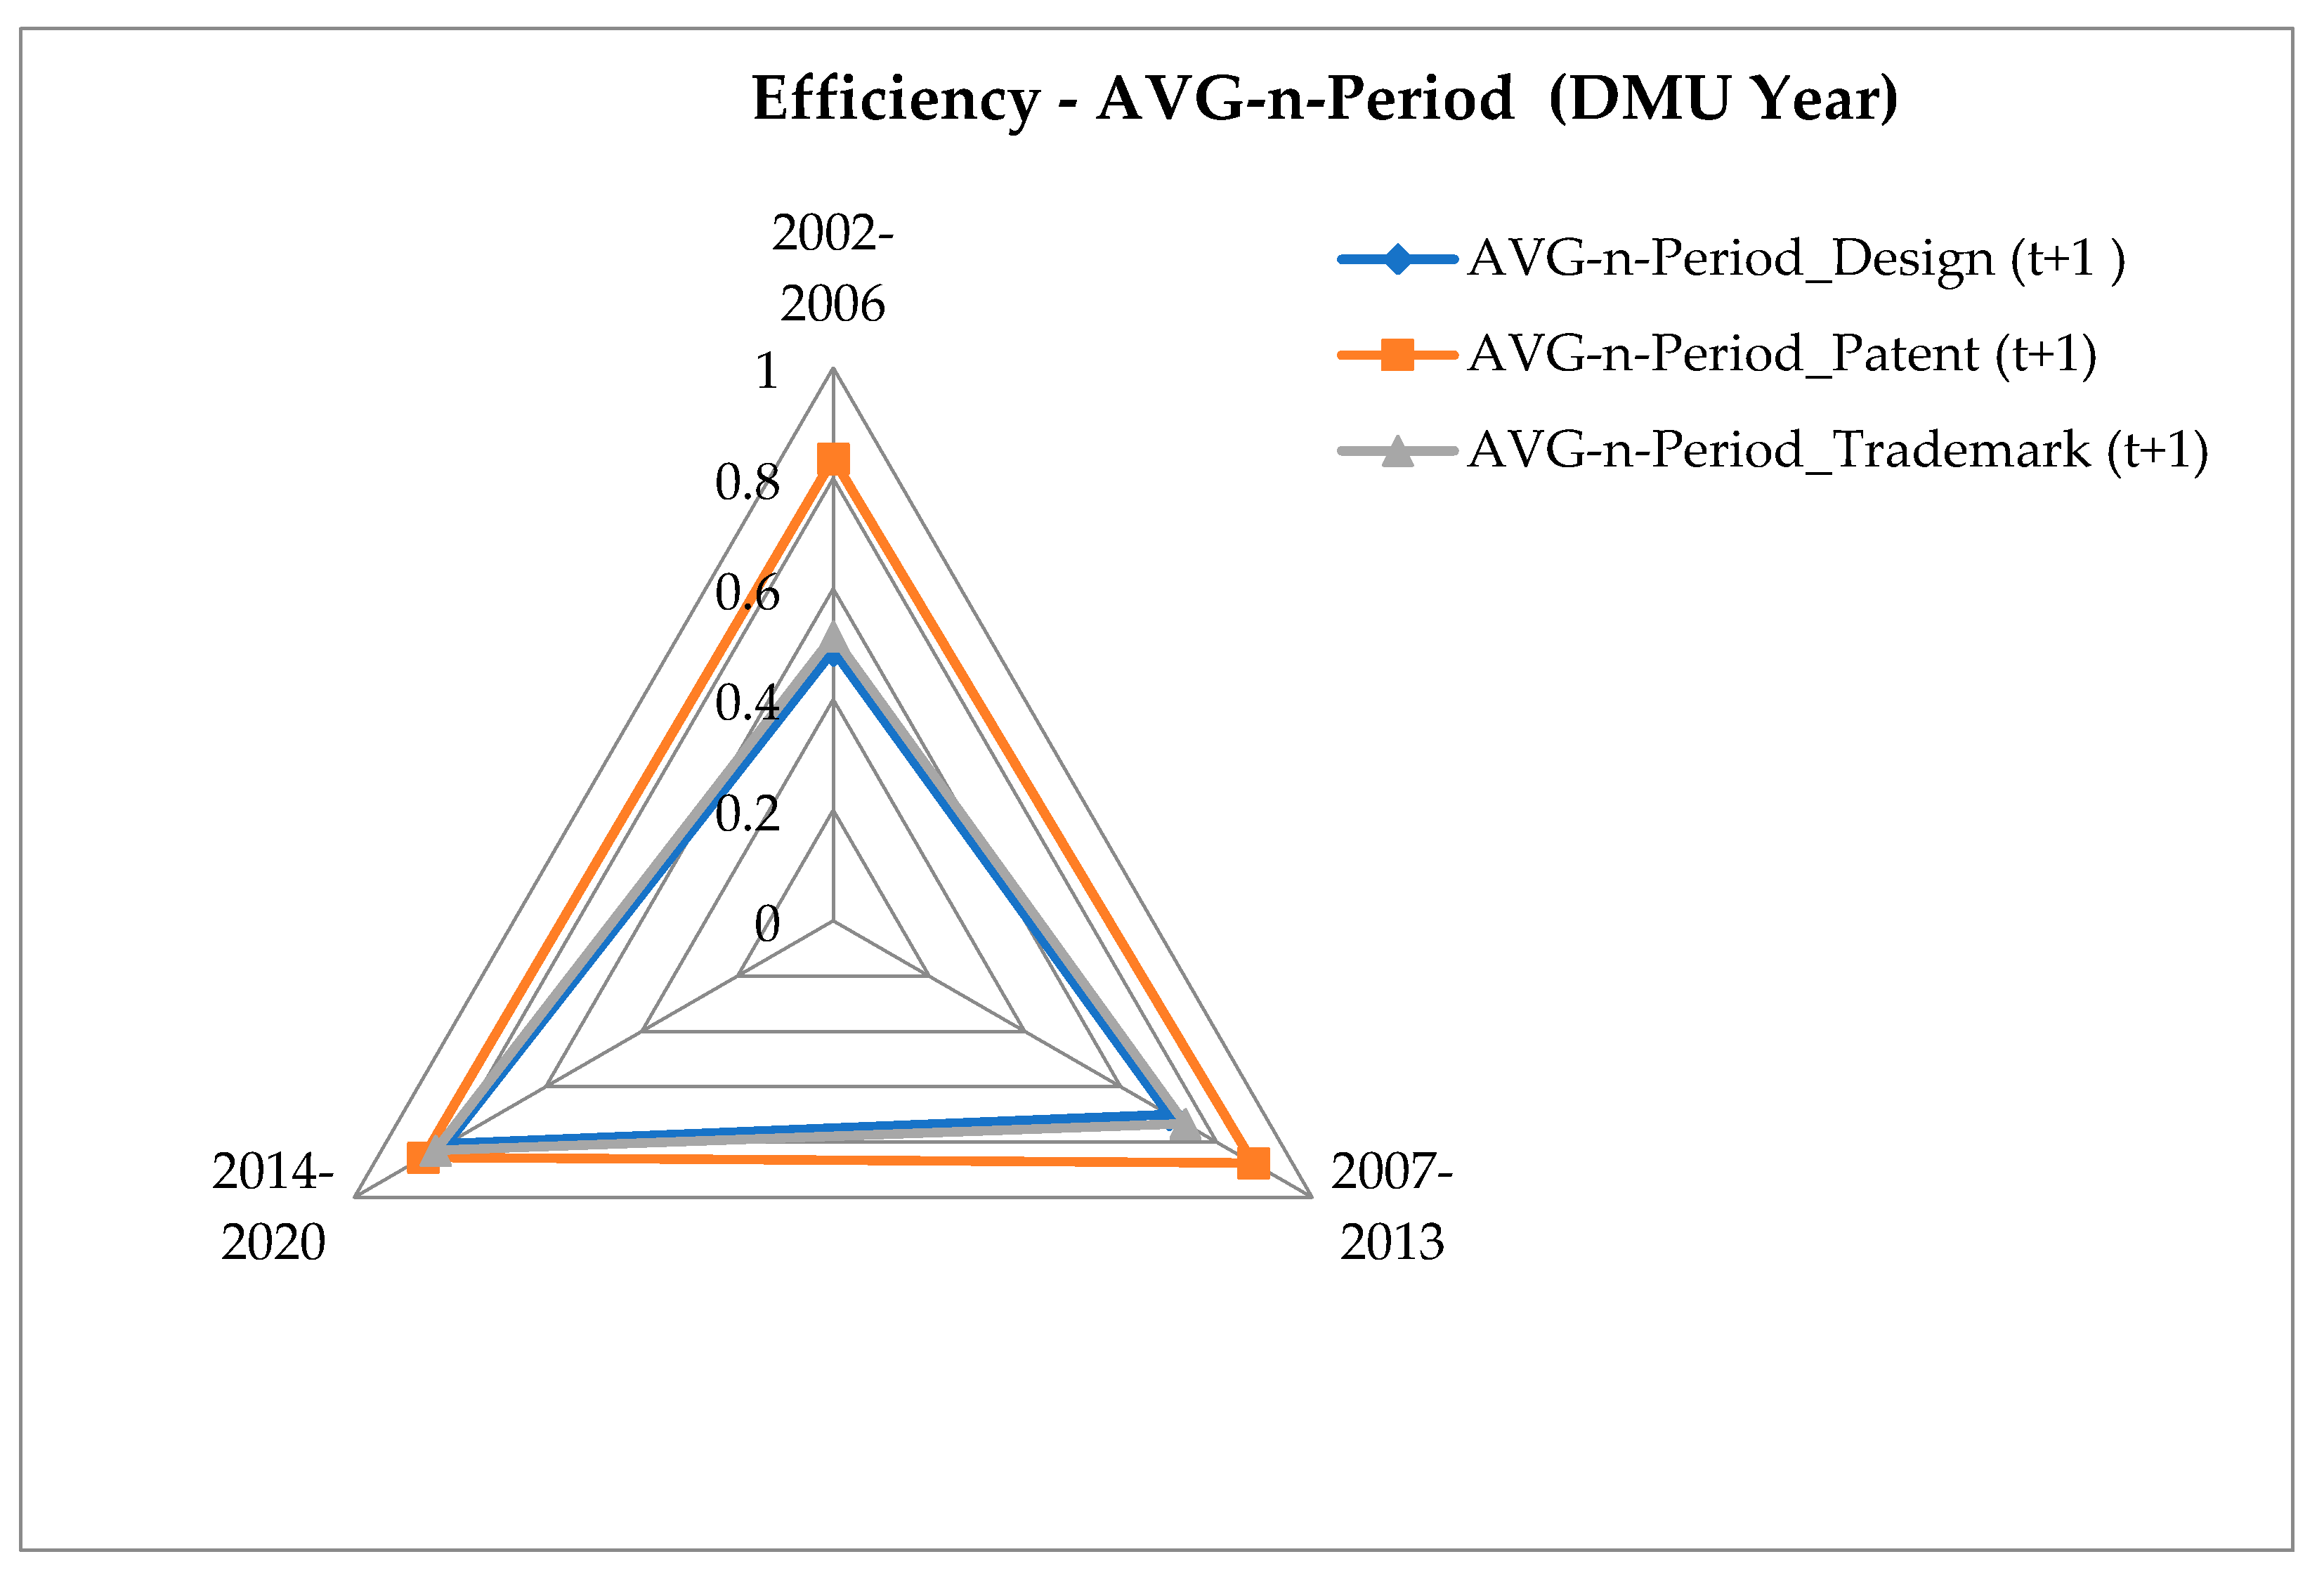
4.2.2. EU Innovation Efficiency throughout the Programming Periods
5. Discussion
6. Conclusions
Author Contributions
Funding
Data Availability Statement
Conflicts of Interest
Appendix A
| Name | Definition | Source |
|---|---|---|
| EU R&I investment | ||
| eu_fp | EU R&I investment channeled through the Framework Programs (euro per capita). | European Commission (2022b) |
| Common innovation infrastructure | ||
| rd | Research and development investment (% of GDP). All R&D investment plus gross fixed investment for R&D performed within a country during a specific year. | Eurostat (2022) |
| public_rd | Intramural R&D investment in the public sector (% of GDP). | Eurostat (2022) |
| edu_exp | Total public investment on education (% of GDP). | Eurostat (2022) |
| rd_fte | Total R&D personnel and researchers by all sectors of performance (% of total employment)—numerator in full-time equivalent (FTE) | Eurostat (2022) |
| knowledge_stock | Cumulative variable formed from granted patents stock, granted trademarks stock and granted designs stock. Method used: factor analysis. | World Intellectual Property Organization (WIPO) (2022) |
| pub_top10 | Scientific publications among the top 10% most cited publications worldwide (% of total scientific publications of the country). | Web of Science (2022) |
| employees_edu | Employees with tertiary education (% of total employees) | Eurostat (2022) |
| ict | Information and communication technologies (ICT) use index. | World Bank (2022) |
| Cluster-specific environment for innovation | ||
| private_rd | Intramural R&D investment in the business sector (% of GDP) | Eurostat (2022) |
| non_rd | Non-R&D innovation investment (% total turnover). | Eurostat (2022) |
| sector_industry | Employment in the industry sector (% total employment). | World Bank (2022) |
| sector_services | Employment in the services sector (% of total employment). | World Bank (2022) |
| pop_urban | Urban population (% of total population) | World Bank (2022) |
| Quality of the linkages | ||
| higher_ed_rd | Intramural R&D investment in the higher education sector (% of GDP) | Eurostat (2022) |
| venture_cap | Venture capital (% of GDP) | Eurostat (2022) |
| public_private_collab | Number of public–private co-authored research publications (per capita). Publications were assigned to the country/countries in which the business companies or other private sector organizations were located | Web of Science (2022) |
| inno_smes_collab | Innovative SMEs collaborating with others (% of SMEs). | Eurostat (2022) |
| International economic activities | ||
| exports | Exports of goods and services (% of GDP) | Eurostat (2022) |
| imports | Imports of goods and services (% of GDP) | World Bank (2022) |
| fdi | Inward foreign direct investment (% of GDP) | World Bank (2022) |
| Diversity and equality | ||
| multiculture | Foreign country or stateless population (% total population). | Eurostat (2022) |
| gender_equality | Female share of employment in senior and middle management (%) | World Bank (2022) |
| income_inequality | People at risk of poverty or social exclusion (% of population) | Eurostat (2022) |
| Legal and political strength | ||
| legal_political | Strength of the legal and political environment—judicial independence, rule of law, political stability. 1(worst)–7 (best) | World Bank (2022) |
| corruption | Corruption perception index. Reversed ranking (Excel RANK.AVG function) was applied, meaning that the higher the rank, the more corrupted the country was. | Eurostat (2022) |
| ipr | Protection of intellectual property rights, patent protection, copyright protection. | Property Rights Alliance (2022) |
| General socio-economic conditions | ||
| gdp_capita | Gross domestic product (euro per capita). | Eurostat (2022) |
| labour_force | Employment and activity (thousands of persons, age from 15 to 64). | Eurostat (2022) |
| Name | Definition | Source |
|---|---|---|
| patent | Total patent applications (direct and PCT national phase entries) by applicant’s origin (per million inhabitants). | World Intellectual Property Organization (WIPO) (2022) |
| trademark | Total trademark applications (direct and via the Madrid system), by applicant’s origin (per million inhabitants). | World Intellectual Property Organization (WIPO) (2022) |
| design | Total design applications (direct and via the Hague system), by applicant’s origin (per million inhabitants). | World Intellectual Property Organization (WIPO) (2022) |
Appendix B

Appendix C

References
- Anderson, Henry Junior, and Jan Stejskal. 2019. Diffusion efficiency of innovation among EU member states: A data envelopment analysis. Economies 7: 34. [Google Scholar] [CrossRef] [Green Version]
- Andrijauskiene, Meda, Daiva Dumciuviene, and Jovita Vasauskaite. 2021. Redeveloping the national innovative capacity framework: European Union perspective. Economies 9: 201. [Google Scholar] [CrossRef]
- Apostolos, Vetsikas, Stamboulis Yeoryios, and Markatou Maria. 2017. Innovation and Economic Growth: An empirical investigation of European countries. Applied Economics Letter 23: 1241–44. [Google Scholar]
- Aytekin, Ahmet, Fatih Ecer, Selçuk Korucuk, and Çağlar Karamaşa. 2022. Global innovation efficiency assessment of EU member and candidate countries via DEA-EATWIOS multi-criteria methodology. Technology in Society 68: 101896. [Google Scholar] [CrossRef]
- Bacon, David, Dominik Forner, and Sercan Ozcan. 2019. Machine learning approach for national innovation performance data analysis. In 8th International Conference on Data Science, Technology and Applications. Setúbal: SciTePress, pp. 325–31. [Google Scholar] [CrossRef]
- Carayannis, Elias G., Evangelos Grigoroudis, and Yorgos Goletsis. 2016. A multilevel and multistage efficiency evaluation of innovation systems: A multiobjective DEA approach. Expert Systems with Applications 62: 63–80. [Google Scholar] [CrossRef]
- Castaldi, Carolina. 2018. To trademark or not to trademark: The case of the creative and cultural industries. Research Policy 47: 606–16. [Google Scholar] [CrossRef] [Green Version]
- Cooper, W. W., L. M. Seiford, K. Tone, and J. Zhu. 2007. Some models and measures for evaluating performances with DEA: Past accomplishments and future prospects. Journal of Productivity Analysis 28: 151–63. [Google Scholar] [CrossRef]
- Dincer, Oguzhan. 2019. Does corruption slow down innovation? Evidence from a cointegrated panel of US states. European Journal of Political Economy 56: 1–10. [Google Scholar] [CrossRef]
- Dzemydaitė, Giedrė, Ignas Dzemyda, and Birutė Galinienė. 2016. The efficiency of regional innovation systems in new member states of the European Union: A nonparametric DEA approach. Economics and Business 28: 83–89. [Google Scholar] [CrossRef] [Green Version]
- Egilmez, Gokhan, and Deborah McAvoy. 2013. Benchmarking road safety of US states: A DEA-based Malmquist productivity index approach. Accident Analysis & Prevention 53: 55–64. [Google Scholar] [CrossRef]
- Erdin, Ceren, and Mehmet Çağlar. 2022. National innovation efficiency: A DEA-based measurement of OECD countries. International Journal of Innovation Science 15: 427–56. [Google Scholar] [CrossRef]
- European Commission. 2017. Assessment of the Union Added Value and the Economic Impact of the EU Framework Programmes. Available online: http://ec.europa.eu/research/evaluations/pdf/archive/other_reports_studies_and_documents/assessment_of_the_union_added_value_and_the_economic_impact_of_the_eu_framework_programmes.pdf (accessed on 18 November 2022).
- European Commission. 2018. Mutual Learning Exercise on Evaluation of Business R&D Grant Schemes Behavioural Change, Mixed-Method Approaches and Big Data. Available online: https://rio.jrc.ec.europa.eu/policy-support-facility/mleevaluation-business-rd-grant-schemes (accessed on 18 November 2022).
- European Commission. 2021. Better Regulation Toolbox. Available online: https://ec.europa.eu/info/sites/default/files/br_toolbox-nov_2021_en_0.pdf (accessed on 21 November 2022).
- European Commission. 2022a. EIS 2022 Executive Summary. Available online: https://research-and-innovation.ec.europa.eu/system/files/2022-09/ec_rtd_eis-2022-executive-summary_en.pdf (accessed on 7 December 2022).
- European Commission. 2022b. EU Expenditure and Revenue. Available online: https://ec.europa.eu/budget/graphs/revenue_expediture.html (accessed on 15 December 2022).
- European Commission. 2022c. Science, Research and Innovation Performance of the EU 2022—Building a Sustainable Future in Uncertain Times. Available online: https://ec.europa.eu/commission/presscorner/detail/en/IP_22_4255 (accessed on 21 November 2022).
- European Parliament. 2018. Overcoming Innovation Gaps in the EU-13 Member States. Available online: https://www.europarl.europa.eu/RegData/etudes/STUD/2018/614537/EPRS_STU(2018)614537_EN.pdf (accessed on 18 November 2022).
- Eurostat. 2022. Official Eurostat Database. Available online: https://ec.europa.eu/eurostat/data/database (accessed on 15 December 2022).
- Fancello, Gianfranco, Michele Carta, and Patrizia Serra. 2020. Data Envelopment Analysis for the assessment of road safety in urban road networks: A comparative study using CCR and BCC models. Case Studies on Transport Policy 8: 736–44. [Google Scholar] [CrossRef]
- Faria, Ana Paula, Natália Barbosa, and Joana Bastos. 2020. Portuguese regional innovation systems efficiency in the European Union context. European Planning Studies 28: 1599–618. [Google Scholar] [CrossRef]
- Feng, Yongqi, Haolin Zhang, Yung-Ho Chiu, and Tzu-Han Chang Feng. 2021. Innovation efficiency and the impact of the institutional quality: A cross-country analysis using the two-stage meta-frontier dynamic network DEA model. Scientometrics 126: 3091–129. [Google Scholar] [CrossRef]
- Fernández-Uclés, Domingo, Saida Elfkih, Adoración Mozas-Moral, Enrique Bernal-Jurado, Miguel Jesús Medina-Viruel, and Saker Ben Abdallah. 2020. Economic efficiency in the tunisian olive oil sector. Agriculture 10: 391. [Google Scholar] [CrossRef]
- Foray, Dominique, and Hugo Hollanders. 2015. An assessment of the Innovation Union Scoreboard as a tool to analyse national innovation capacities: The case of Switzerland. Research Evaluation 24: 213–28. [Google Scholar] [CrossRef]
- Furman, Jeffrey L., Michael E. Porter, and Scott Stern. 2002. The determinants of national innovative capacity. Research Policy 31: 899–933. [Google Scholar] [CrossRef] [Green Version]
- Gavurová, Beáta, Martina Halásková, and Samuel Koróny. 2019. Research and development indicators of EU28 countries from viewpoint of super-efficiency DEA analysis. Acta Universitatis Agriculturae et Silviculturae Mendelianae Brunensis 67: 225–42. [Google Scholar] [CrossRef] [Green Version]
- Gil, Dario, Stacy Hobson, Aleksandra Mojsilović, Ruchir Puri, and John R. Smith. 2020. AI for Management: An Overview. In The Future of Management in an AI World. Edited by Jordi Canals and Franz Heukamp. IESE Business Collection. Cham: Palgrave Macmillan. [Google Scholar] [CrossRef]
- Haefner, Naomi, Jaokim Wincent, Vinit Parida, and Oliver Gassmann. 2021. Artificial intelligence and innovation management: A review, framework, and research agenda. Technological Forecasting and Social Change 162: 120392. [Google Scholar] [CrossRef]
- Juřičková, Eva, Michal Pilik, and Michael Adu Kwarteng. 2019. Efficiency measurement of national innovation systems of the European Union countries: DEA model application. Journal of International Studies 12: 286–99. [Google Scholar] [CrossRef]
- Kalapouti, Kleoniki, Konstantinos Petridis, Chrisovalantis Malesios, and Prasanta Kumar Dey. 2020. Measuring efficiency of innovation using combined Data Envelopment Analysis and Structural Equation Modeling: Empirical study in EU regions. Annals of Operations Research 294: 297–320. [Google Scholar] [CrossRef] [Green Version]
- Kanellopoulos, Vassilis, and Kostas Tsekouras. 2023. Innovation efficiency and firm performance in a benchmarking context. Managerial and Decision Economics 44: 137–51. [Google Scholar] [CrossRef]
- Kontolaimou, Alexandra, Ioannis Giotopoulos, and Aggelos Tsakanikas. 2016. A typology of European countries based on innovation efficiency and technology gaps: The role of early-stage entrepreneurship. Economic Modelling 52: 477–84. [Google Scholar] [CrossRef]
- Law, Siong Hook, Weng Chang Lee, and Nirvikar Singh. 2018. Revisiting the finance-innovation nexus: Evidence from a non-linear approach. Journal of Innovation & Knowledge 3: 143–53. [Google Scholar] [CrossRef]
- Lee, Jiyoung, Chulyeon Kim, and Gyunghyun Choi. 2019. Exploring data envelopment analysis for measuring collaborated innovation efficiency of small and medium-sized enterprises in Korea. European Journal of Operational Research 278: 533–45. [Google Scholar] [CrossRef]
- Li, Qinyang. 2019. Regional technological innovation and green economic efficiency based on DEA model and fuzzy evaluation. Journal of Intelligent & Fuzzy Systems 37: 6415–25. [Google Scholar]
- Liu, Shuguang, Han Zhang, Chunyu Liu, and Lu Wang. 2019. Spatial Evolutionary Pattern and Regional Innovation Effi-ciency of European Union. IOP Conference Series: Earth and Environmental Science 234: 012030. [Google Scholar] [CrossRef]
- Long, Renyan, Hangyuan Guo, Danting Zheng, Ronghua Chang, and Sanggyun Na Long. 2020. Research on the Measurement, Evolution, and Driving Factors of Green Innovation Efficiency in Yangtze River Economic Belt: A Super-SBM and Spatial Durbin Model. Complexity 2020: 8094247. [Google Scholar] [CrossRef]
- Malik, Sakshi. 2023. Macroeconomic determinants of innovation: Evidence from Asian countries. Global Business Review 24: 137–51. [Google Scholar] [CrossRef]
- Martin, Ben R. 2016. Twenty challenges for innovation studies. Science and Public Policy 43: 432–50. [Google Scholar] [CrossRef] [Green Version]
- Narayanan, Elangovan, Wan Rosmanira Ismail, and Zainol Mustafa. 2022. A data-envelopment analysis-based systematic review of the literature on innovation performance. Heliyon 8: e11925. [Google Scholar] [CrossRef] [PubMed]
- Proksch, Dorian, Marcus Max Haberstroh, and Andreas Pinkwart. 2017. Increasing the national innovative capacity: Identifying the pathways to success using a comparative method. Technological Forecasting and Social Change 116: 256–70. [Google Scholar] [CrossRef]
- Property Rights Alliance. 2022. International Property Rights Index. Available online: https://www.internationalpropertyrightsindex.org/ (accessed on 22 December 2022).
- Rodríguez-Pose, Andrés, and Callum Wilkie. 2019. Innovating in less developed regions: What drives patenting in the lagging regions of Europe and North America. Growth and Change 50: 4–37. [Google Scholar] [CrossRef] [Green Version]
- Ryan, Thomas K., and J. W. Schneider. 2016. Examining to what extent the source of competitive funding influences scientific impact. A case study of Danish EU FP7 funded projects. 21st International Conference on Science and Technology Indicators-STI 2016. Book of Proceedings, 581–89. [Google Scholar] [CrossRef] [Green Version]
- Schneider, Patricia Higino. 2005. International trade, economic growth and intellectual property rights: A panel data study of developed and developing countries. Journal of Development Economics 78: 529–47. [Google Scholar] [CrossRef]
- Sotos, Ana Elisa Castro, Stijn Vanhoof, Wim Van Den Noortgate, and Patrick Onghena. 2009. The transitivity misconception of Pearson’s correlation coefficient. Statistics Education Research Journal 8: 33–55. [Google Scholar] [CrossRef]
- Sunley, Peter, Steven Pinch, Suzanne Reimer, and James Macmillen. 2008. Innovation in a creative production system: The case of design. Journal of Economic Geography 8: 675–98. [Google Scholar] [CrossRef]
- Toloo, Mehdi, Esmaeil Keshavarz, and Adel Hatami-Marbini Toloo. 2021. Selecting data envelopment analysis models: A data-driven application to EU countries. Omega 101: 102248. [Google Scholar] [CrossRef]
- Transparency International. 2022. Corruption Perception Index. Available online: https://www.transparency.org/en/cpi/2022 (accessed on 26 May 2023).
- van den Besselaar, Peter A. A., Ramon Flecha, and Alfred Radauer. 2018. Monitoring the Impact of EU Framework Programmes. Available online: https://op.europa.eu/en/publication-detail/-/publication/cbb7ce39-d66d-11e8-9424-01aa75ed71a1 (accessed on 22 May 2023).
- Varga, Attila, and Tamás Sebestyén. 2017. Does EU Framework Program participation affect regional innovation? The differentiating role of economic development. International Regional Science Review 40: 405–39. [Google Scholar] [CrossRef]
- Wawrosz, Petr. 2019. Productive of the service sector: Theory and practice of corruption declining. In Marketing and Management of Innovations. Ukraine: Sumy State University, vol. 9, pp. 269–79. [Google Scholar] [CrossRef] [Green Version]
- Web of Science. 2022. Database. Available online: https://clarivate.com/webofsciencegroup/ (accessed on 23 December 2022).
- World Bank. 2022. World Development Indicators. Available online: https://databank.worldbank.org/source/world-development-indicators (accessed on 12 November 2022).
- World Intellectual Property Organization (WIPO). 2022. Available online: https://www.wipo.int/publications/en/details.jsp?id=4571 (accessed on 17 November 2022).
- Xu, Kai, Ran Mei, Li Liang, and Wei Sun. 2023. Regional convergence analysis of sustainable innovation efficiency in European Union countries. Journal of Environmental Management 325: 116636. [Google Scholar] [CrossRef]
- Zang, Leizhen, Feng Xiong, Xin Lao, and Yanyan Gao. 2019. Does governance efficiency matter for national innovative capacity? One tale from different countries. Technology Analysis & Strategic Management 31: 239–52. [Google Scholar] [CrossRef]
- Zhu, Lin, Jian Luo, Qingli Dong, Yang Zhao, Yunyue Wang, and Yong Wang. 2021. Green technology innovation efficiency of energy-intensive industries in China from the perspective of shared resources: Dynamic change and improvement path. Technological Forecasting and Social Change 170: 120890. [Google Scholar] [CrossRef]
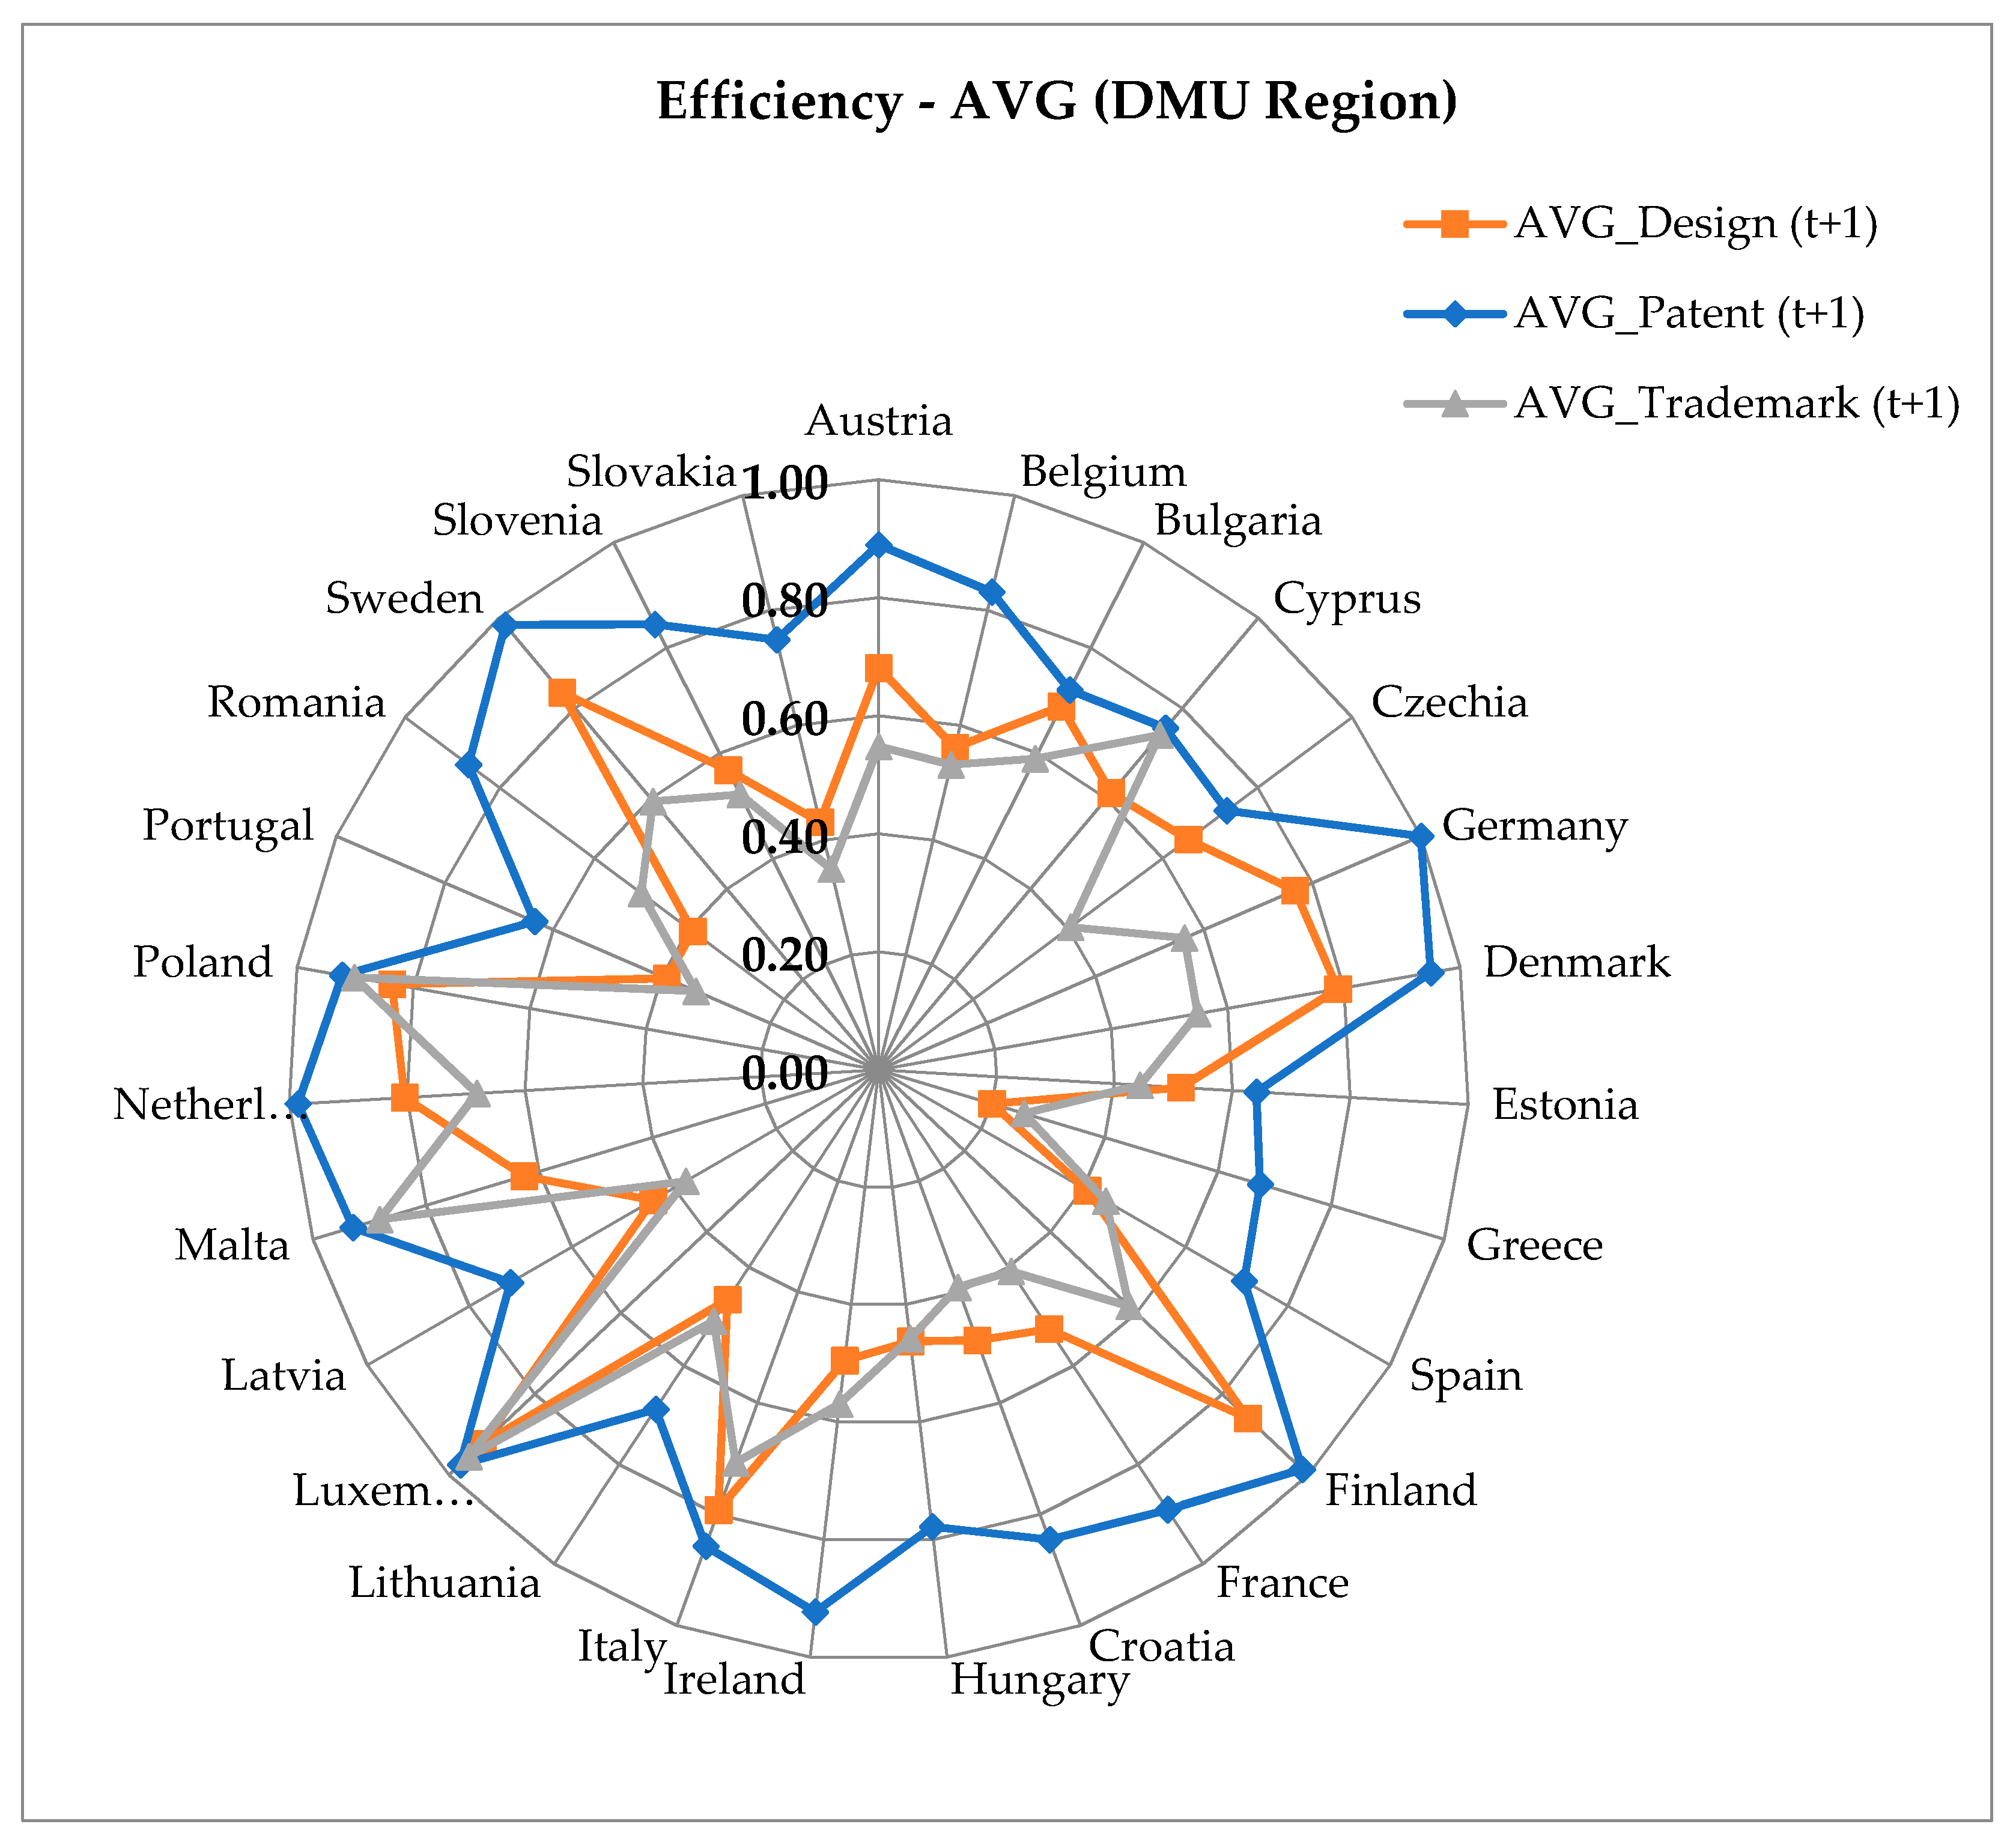
| Region | Design | Trademark | Patent | ||||||
|---|---|---|---|---|---|---|---|---|---|
| CCR | BCC | SBM | CCR | BCC | SBM | CCR | BCC | SBM | |
| Austria | 0.68 | 0.68 | 0.67 | 0.55 | 0.54 | 0.54 | 0.55 | 0.54 | 0.54 |
| Belgium | 0.56 | 0.55 | 0.55 | 0.53 | 0.52 | 0.52 | 0.53 | 0.52 | 0.52 |
| Bulgaria | 0.69 | 0.68 | 0.68 | 0.59 | 0.58 | 0.57 | 0.59 | 0.58 | 0.57 |
| Cyprus | 0.61 | 0.61 | 0.61 | 0.74 | 0.74 | 0.73 | 0.74 | 0.74 | 0.73 |
| Czechia | 0.65 | 0.65 | 0.64 | 0.41 | 0.39 | 0.39 | 0.41 | 0.39 | 0.39 |
| Germany | 0.77 | 0.75 | 0.75 | 0.56 | 0.55 | 0.55 | 0.56 | 0.55 | 0.55 |
| Denmark | 0.79 | 0.77 | 0.78 | 0.55 | 0.53 | 0.54 | 0.55 | 0.53 | 0.54 |
| Estonia | 0.51 | 0.51 | 0.51 | 0.44 | 0.44 | 0.43 | 0.44 | 0.44 | 0.43 |
| Greece | 0.20 | 0.20 | 0.18 | 0.26 | 0.25 | 0.24 | 0.26 | 0.25 | 0.24 |
| Spain | 0.41 | 0.40 | 0.40 | 0.44 | 0.44 | 0.43 | 0.44 | 0.44 | 0.43 |
| Finland | 0.86 | 0.85 | 0.85 | 0.58 | 0.57 | 0.58 | 0.58 | 0.57 | 0.58 |
| France | 0.52 | 0.51 | 0.50 | 0.41 | 0.40 | 0.40 | 0.41 | 0.40 | 0.40 |
| Croatia | 0.49 | 0.47 | 0.48 | 0.39 | 0.38 | 0.40 | 0.39 | 0.38 | 0.40 |
| Hungary | 0.46 | 0.46 | 0.46 | 0.46 | 0.45 | 0.44 | 0.46 | 0.45 | 0.44 |
| Ireland | 0.50 | 0.49 | 0.49 | 0.57 | 0.56 | 0.56 | 0.57 | 0.56 | 0.56 |
| Italy | 0.79 | 0.78 | 0.78 | 0.71 | 0.70 | 0.70 | 0.71 | 0.70 | 0.70 |
| Lithuania | 0.47 | 0.45 | 0.45 | 0.51 | 0.49 | 0.50 | 0.51 | 0.49 | 0.50 |
| Luxembourg | 0.92 | 0.91 | 0.92 | 0.95 | 0.93 | 0.95 | 0.95 | 0.93 | 0.95 |
| Latvia | 0.44 | 0.44 | 0.42 | 0.38 | 0.36 | 0.36 | 0.38 | 0.36 | 0.36 |
| Malta | 0.63 | 0.62 | 0.62 | 0.88 | 0.88 | 0.88 | 0.88 | 0.88 | 0.88 |
| Netherlands | 0.80 | 0.80 | 0.78 | 0.68 | 0.67 | 0.67 | 0.68 | 0.67 | 0.67 |
| Poland | 0.84 | 0.82 | 0.83 | 0.90 | 0.89 | 0.89 | 0.90 | 0.89 | 0.89 |
| Portugal | 0.39 | 0.39 | 0.39 | 0.34 | 0.33 | 0.33 | 0.34 | 0.33 | 0.33 |
| Romania | 0.39 | 0.39 | 0.38 | 0.50 | 0.50 | 0.49 | 0.50 | 0.50 | 0.49 |
| Sweden | 0.83 | 0.83 | 0.81 | 0.59 | 0.59 | 0.59 | 0.59 | 0.59 | 0.59 |
| Slovenia | 0.57 | 0.55 | 0.55 | 0.52 | 0.51 | 0.52 | 0.52 | 0.51 | 0.52 |
| Slovakia | 0.43 | 0.42 | 0.43 | 0.35 | 0.34 | 0.34 | 0.35 | 0.34 | 0.34 |
Disclaimer/Publisher’s Note: The statements, opinions and data contained in all publications are solely those of the individual author(s) and contributor(s) and not of MDPI and/or the editor(s). MDPI and/or the editor(s) disclaim responsibility for any injury to people or property resulting from any ideas, methods, instructions or products referred to in the content. |
© 2023 by the authors. Licensee MDPI, Basel, Switzerland. This article is an open access article distributed under the terms and conditions of the Creative Commons Attribution (CC BY) license (https://creativecommons.org/licenses/by/4.0/).
Share and Cite
Andrijauskiene, M.; Ioannidis, D.; Dumciuviene, D.; Dimara, A.; Bezas, N.; Papaioannou, A.; Krinidis, S. European Union Innovation Efficiency Assessment Based on Data Envelopment Analysis. Economies 2023, 11, 163. https://doi.org/10.3390/economies11060163
Andrijauskiene M, Ioannidis D, Dumciuviene D, Dimara A, Bezas N, Papaioannou A, Krinidis S. European Union Innovation Efficiency Assessment Based on Data Envelopment Analysis. Economies. 2023; 11(6):163. https://doi.org/10.3390/economies11060163
Chicago/Turabian StyleAndrijauskiene, Meda, Dimosthenis Ioannidis, Daiva Dumciuviene, Asimina Dimara, Napoleon Bezas, Alexios Papaioannou, and Stelios Krinidis. 2023. "European Union Innovation Efficiency Assessment Based on Data Envelopment Analysis" Economies 11, no. 6: 163. https://doi.org/10.3390/economies11060163
APA StyleAndrijauskiene, M., Ioannidis, D., Dumciuviene, D., Dimara, A., Bezas, N., Papaioannou, A., & Krinidis, S. (2023). European Union Innovation Efficiency Assessment Based on Data Envelopment Analysis. Economies, 11(6), 163. https://doi.org/10.3390/economies11060163


