Abstract
Youth not in education, employment, or training (NEET) refers to the most vulnerable group in the transition from school to work. While much research focuses on institutional factors behind the NEET incidence, the current study approaches the problem of the NEET youth from the perspective of non-cognitive skills. For measuring non-cognitive skills, the Big Five personality characteristics (openness, conscientiousness, extraversion, agreeableness, neuroticism) as well as grit were analyzed. The analysis was carried out using propensity score matching based on the data of the Russian Longitudinal Monitoring Survey (RLMS HSE) for 2016. This study shows that the majority of young people in the NEET group come from the poorest families. Nearly half of the NEET youth are not only not working, but they are also not looking for a job either. The analysis revealed that NEET youth fall behind in different non-cognitive abilities, with statistically significant differences in conscientiousness, extraversion, and grit, as well as a greater severity of neuroticism.
JEL Classification:
J24; I24; I25
1. Introduction
The ability to find a decent job that matches one’s education is a problem everyone faces when transitioning from adolescence to adulthood. While some young people fully maximize the human capital accumulated in the formal education system, others start with jobs below their career expectations. Of course, there are also those who do not study, do not develop professional skills, and are unsuccessful in the labor market. These people are referred to as NEET youth (not in education, employment, or training), a cohort of individuals aged 15–24 years, who do not receive formal education, do not undergo professional training, and do not work. It is widely recognized that the level of NEET youth indicates the effectiveness of the transition from study to work, youth inclusion, and their participation in socio-economic life (Elder 2015).
Today, NEET youth are one of the most common at-risk groups and priorities of social policy in low-, middle-, and high-income countries, which is supported by the global agenda for sustainable development. Thus, the Sustainable Development Goals (SDGs) include the prevalence of NEET youth aged 15–24 years as one of the key indicators of SDG 8, related to decent work and economic growth. Indeed, the latest data from the International Labour Organization, which is responsible for this indicator, show that even in high-income countries, 1 in 10 young people aged 15–24 years have difficulty transitioning from the education system to the labor market. In Russia, according to the data from the national statistical office, the level of NEET youth accounts for 16%, which is comparable to numbers in economically developed countries. Moreover, SDG monitoring data indirectly suggest that this level is primarily due to insufficient inclusiveness of the labor market for youth; according to the UNESCO Institute of Statistics, the out-of-school rate for youth in the upper secondary general school age (16–18 years) in Russia was only 2.5%, one of the lowest in the world. Nevertheless, young people face difficulties entering the labor market, and governments need to develop support measures for this cohort within the framework of labor policy.
The reasons for the prevalence of NEET youth in society may relate either to institutional factors characterizing the effectiveness of the education system or the labor market demand for skilled labor (Amendola 2022; Bal-Domańska 2022; Maynou et al. 2022; Bingöl 2020), or to those representing the labor supply side and describing the individual characteristics of economic agents. In addition to the basic socio-demographic parameters such as gender and age, these characteristics mainly include the highest level of education received and professional experience; existing data emphasize that early employment is an important factor in reducing the likelihood of falling into NEET (Ballo et al. 2022; Berlin et al. 2021). It goes without saying that such factors as work experience and education level are well known to economists as key predictors of the Mincer wage equation, also used to assess the return on education. On the other hand, to explain earnings, labor, and other socio-economic outcomes of individuals, over the last decades economists have become increasingly interested in individual heterogeneity, which has psychological roots and was interpreted in the Mincer equation as unobserved abilities (i.e., model error). In other words, it was recognized that a number of other factors, besides education and professional experience, explain income differences, but historically they received limited attention. In this regard, the interest of economists in personality factors behind economic success represents a reasonable attempt to pay more attention to individual characteristics traditionally considered as unobservable in economics. Thus, it led to the emergence of a new trend in economic research that investigates the impact of personality traits on individual outcomes in the labor market and beyond (Almlund et al. 2011; Lindqvist and Vestman 2011; Glewwe et al. 2017; Bowles et al. 2001; Mueller and Plug 2006; Carneiro et al. 2007; Kniesner and Ter Weel 2008).
The economic literature interprets these personality traits as non-cognitive or socio-emotional skills (Wichert and Pohlmeier 2010; Schmit et al. 1993; Heckman et al. 2006; Mueller and Plug 2006; Zetterberg 2005; Nyhus and Pons 2005). An increasing amount of work in economics pays special attention to these skills, especially in the context of continuing education (Laible et al. 2020), employment status (Heckman et al. 2011), and wages (Almlund et al. 2011; Lindqvist and Vestman 2011). However, so far, there has been limited research on non-cognitive skills in the context of NEET youth. In this regard, the current study focused on the following research question: is there a gap observed in the possession of non-cognitive skills depending on the NEET status of youth. In other words, the purpose of this research was to examine the magnitude to which NEET youth lag behind their peers in the non-cognitive skills so essential for the inclusive socio-economic participation of youth in modern economies.
2. Literature Review
Unlike cognitive skills, which are developed during formal education and consolidated with certified qualifications, non-cognitive skills, mostly not included in compulsory education play a crucial role in overall human capital formation (Kuzminov et al. 2019). These factors, characterizing individual heterogeneity and referring to personality traits, are considered skills because they meet three key criteria and represent qualities that are (i) productive, i.e., can be used to create value, (ii) expandable, meaning they can be enhanced through training and targeted policy interventions, and (iii) social, articulating the key role of the socio-economic environment in their formation. These three criteria are known within the so-called PES approach to the general definition of skills, which seeks to produce a multidisciplinary synthesis of economics, psychology, and sociology in addressing this issue (Green 2011). Therefore, non-cognitive skills are defined as patterns of thoughts, feelings, and behaviors (Borghans et al. 2008) that are formed in the socio-economic environment, can be developed with training programs or targeted interventions, and produce economic or social value (Zhou 2016).
Despite its popularity in economic literature, the term “non-cognitive skills” has been criticized in other disciplines, including psychology—the field of knowledge from which it historically originated. As noted, with a general understanding of what cognitive skills are, attempts to define what makes up other important skills seem much more complicated (Cabus et al. 2021). The definition using the exclusion approach, i.e., explaining non-cognitive skills through what they are not (Messick 1978, p. 2), has been widely criticized for creating a so-called false opposition (Farrington et al. 2012; Duckworth and Yeager 2015), which excludes the cognitive component from the considered personality traits. The second difficulty in using this concept is related to the taxonomy of non-cognitive skills, a question that still remains open and even debatable in the academic community. Since scholars in their research on non-cognitive skills use quite different characteristics to measure their impact on a person’s social or economic outcomes, the confusion about the nature of these skills may seriously hinder the universality of statistical conclusions and analysis in this field.
Despite all the open questions and unresolved contradictions in the conceptualization of non-cognitive skills, the most common approach to their taxonomy refers to the 5-factor model of personality, also known as the “Big Five” (BFI) personality traits. This model includes traits such as extraversion, neuroticism, conscientiousness, openness to new experience, and agreeableness (Goldberg 1992). The model emerged in response to the need for scientific classification of personality and its fundamental components. Despite the wide representation in science of multifactorial personality models—predecessors of the Big Five, such as H. Eysenck’s 3-factor model of personality and R. Cattell’s 16-factor model, as well as a number of other classifications (Almagor et al. 1995; De Raad and Szirmak 1994; Benet-Martínez and Waller 1997; Di Blas and Forzi 1999; Lee and Ashton 2006)—the Big Five is currently the most popular and is spreading in other disciplines studying human behavior. Early psychometric measurements demonstrated the orthogonal nature of the traits proposed by this model, i.e., the absence of mutual correlation between the factors that explain the five key sources of variation in a series of descriptive characteristics of personality in different languages (Saucier and Goldberg 2002). Although subsequent research (Hussey and Hughes 2020; Viswesvaran and Ones 2000) questioned the complete independence of the five factors, the psychometric characteristics of this model still surpass the others, explaining its popularity in psychology and other behavioral sciences. Although initially the specified characteristics were interpreted as personality traits, recent literature rather interprets them as skills, since these characteristics, on the one hand, are instrumental (i.e., produce value and have a return on the labor market), and on the other hand, can be developed through targeted interventions, especially at an early age (Heckman et al. 2011).
For these reasons, non-cognitive skills are of particular importance in the context of NEET youth—a vulnerable group facing risks of poverty, socio-economic exclusion, and health problems. The economic literature emphasizes the influence of non-cognitive skills on wages in different countries and socio-economic contexts. It was proven that the return on non-cognitive skills in developed countries increased over time from 1993 to 2013, whereas the effect of cognitive abilities began to decline from 2000. Moreover, it was highlighted that the return on non-cognitive skills exceeds the return on cognitive ones (Edin et al. 2022). Measurements in developing countries also confirmed that non-cognitive skills largely explain earnings (Perez 2020). For example, special attention in this context was paid to traits such as conscientiousness and extraversion (Nyhus and Pons 2005); on the other hand, neuroticism and agreeableness usually have a negative impact on earnings (Fletcher 2013).
Studies on the relationship between the development of non-cognitive skills, on one hand, and education and employment, on the other, prove the existence of this connection and indicate that social activity of the younger generation is directly related to personality traits (Caliendo et al. 2015; Mohanty 2010; Uysal and Pohlmeier 2011; Cuesta and Budría 2017; Varshavskaja 2016). Numerous studies point at the role of non-cognitive skills in further learning. Thus, based on a sample of more than 10,000 people from the adult population who participated in the German National Educational Panel Study (NEPS), the authors found that openness to experience is positively associated with participation in further education.
A body of work indicates a presence of the relationship between a person’s employment and their non-cognitive skills. In a series of studies carried out on large samples in different countries based on socio-economic monitoring, the likelihood of employment and successful education in school and university was confirmed for people with certain personality traits. In particular, in the Russian sample, a strong influence on this probability was shown by personal conscientiousness, which, combined with openness and emotional stability, contributes to the highest results both at work and in study (Rozhkova and Roshchin 2021). Also, based on individual unemployment data from the German SOEP panel survey, a strong negative impact of neuroticism on the immediate likelihood of finding a job was shown. Openness as a personality trait only facilitates employment for women and migrants. The authors did not find any influence of extraversion and conscientiousness on the speed of employment (Uysal and Pohlmeier 2011).
Research on Russian data confirms that introversion as a personality trait, combined with low social activity and underdeveloped communication skills, creates the prerequisites for youth to fall into the NEET group (Skvortsova and Shestakova 2020). At the same time, a person who has been experiencing unemployment for a long time constantly feels inferior and reacts sharply to peer pressure from other people, which leads to decreased self-assessment and labor motivation (Selezneva 2007; Rozhkova 2019). These findings from the Russian data on the impact of NEET status on personality are aligned and expanded by the evidence from Turkey indicating that being NEET can not only increase the likelihood of mental health problems, but it also leads to a higher probability of obesity, smoking, and alcohol consumption (Karaoğlan et al. 2022).
Furthermore, it was highlighted that non-cognitive skills of NEET youth in Russia affect their productivity, wage level, occupational choice, and job search duration (Zudina 2022). It was also shown that introversion influences the likelihood of falling into the NEET group for teenagers and young people from families with high socio-economic status. This creates risks of social isolation for these cohorts, as well as a number of economic risks associated with the ineffective utilization of the human capital that their families possess (Seregina 2006; Gimpelson et al. 2020). It was also pointed out that NEET youth have lower levels of trust in the future, in other people, and in social institutions, which leads to lower rates of social participation and creates risks for social exclusion (Alfieri et al. 2015).
The results presented in the literature suggest that the personality traits of people not involved in labor and education may vary depending on the reasons for this non-involvement, from the attitude of the individuals themselves to this fact (for example, that it is their conscious choice or a forced situation), to the duration of their stay in such a status (Skvortsova and Shestakova 2020). Those at risk are usually young people who have experienced personal failures, or had traumatic experiences in relationships with their immediate social environment, and also ones who have gone through difficult life events (Glewwe et al. 2017). The studies indicate that as young people usually lack technical and practical skills, employers are mainly concerned with the low level (or absence) of development of such skills as sociability, teamwork, client work skills (communication), leadership, reliability, and other skills that are not hard in nature (Westwood 2004; Lerman 2013; Shivpuri and Kim 2004).
While mounting evidence points out that personality traits serve as an important predictor of the economic activity of young people, manifested in employment and training, the development of both cognitive and non-cognitive characteristics is closely related to the socio-economic status of the family and the opportunities to invest in the human capital of children, enhanced by the social and cultural capital of parents (Coleman 1988; Bourdieu and Passeron 1977). In total, these characteristics are the starting point for the transition of young people from study to work (Kautz et al. 2014). Moreover, the group of young people who do not have such starting conditions (economic, social, and cultural capital) that allow them to develop the skills for a sustainable return in the education system and the labor market, as a rule, are predisposed to falling into the NEET category, namely, building a so-called “NEET core” (Quintano et al. 2018). However, a recent study indicates that, though having non-cognitive skills can indeed help young people during a school-to-work transition, it is not always enough to compensate for a low socio-economic status (Ripamonti 2023).
Studies on the non-cognitive components of human capital have shown the influence of these characteristics on the continuation of education and the chances of employment, which allows for considering these skills as a means of educational and labor policy for the socio-economic inclusion of young people and reducing the share of NEET in society. Considering the importance of these skills for various socio-economic outcomes, this work aims to contribute to filling the research gap that exists regarding knowledge about differences observed in possessing non-cognitive skills among young people depending on NEET status.
3. Data and Methods
The materials of the Russian Longitudinal Monitoring Survey (RLMS) (25th wave) for 2016 served as the empirical base of the research. RLMS is a source of information about the socio-economic characteristics of more than 15,000 Russian citizens aged 15 to 24 years. Also, the 25th wave of the RLMS HSE contains information about such non-cognitive skills as the Big Five personality characteristics (agreeableness, conscientiousness, extraversion, neuroticism, openness to new experiences) and grit. The questions used to measure the analyzed non-cognitive skills are presented in Table A1. The aggregation of indices of non-cognitive skills was carried out according to the methodology of the STEP Skills Measurement Survey (2014). The sample parameters, as well as the descriptive statistics of the variables used in the analysis, are presented in Table 1. The descriptive analysis, presented in Table 1, allows us to conclude that the distribution of the studied non-cognitive characteristics in the youth sub-sample aged 15–24 is close to normal.

Table 1.
Sample summary.
4. Econometric Verification Model
Since the key research question of the study was to identify the differences in non-cognitive skills between NEET and non-NEET youth, traditional methods of comparing means across groups, such as the t-test, ANOVA, or linear regression with a categorical predictor, would inevitably yield biased estimates due to several limitations of the sample. Firstly, the data used represent a sub-sample of observations of youth aged 15–24. Regardless of the sample model, from the originally random probability sample of the monitoring, we selected observations describing the group of persons in accordance with the questions and problems of the study (youth in the case of this work), thus inevitably losing representativeness (Heckman and MaCurdy 1986, p. 1937). Secondly, out of all 12,554 observations, the share belonging to the treatment group accounted for less than 10% of the sample, and such insufficient representation of observations (i.e., the small size of the NEET group in the overall structure of youth in the general population) created risks of bias in the estimation of the studied effects. Thirdly, as a result of the first and second, respondents in the treatment group may have significantly differed from the other respondents in the sample, and belonging to this group was not controlled by the researchers in terms of randomization principles (Toomet and Henningsen 2008).
All this made the econometric analysis of the data subject to strong sample selection bias, which can significantly shift the calculated indicators towards their distribution in the sample. Although the RLMS data used in our analysis provide a rich choice of covariates to control parameters, which would be unobservable in most other data, several authors note that linear regression, supplemented with various covariates, may actually increase the error in calculating the assumed effect of the impact when the true relationship between the covariate and the outcome is even moderately nonlinear; these risks are especially high when there are large differences in the means and variances of predictors in the treatment and control groups (Heckman et al. 1998; Rubin and Thomas 2000; Rubin 2001). One of the methods to overcome sample selection biases is propensity score matching (Rosenbaum and Rubin 1983).
Taking into account that having a large number of observables in the regression model cannot be a stable solution for reducing selection bias when using the least squares method, many authors have suggested using matching methods, which allow for ignoring linearity conditions and may reduce the role of selection biases in the estimation of the effects (Dehejia and Wahba 2002; Dehejia 2005). As noted in the research literature, the PSM method is more accurate compared to regression analysis when the researcher has a relatively small number of observations against a large number of confounders that need to be included in the analysis (Grjibovski et al. 2016). When using matching, an important point is to achieve a balance between the model variables by the propensity score, which shows the probability for each study observation to fall under the influence of the studied factor. In this regard, several matching approaches were tested, and the best results were shown by the full matching method on the propensity scale, achieving maximum balance across all variables, which allowed matching all observations of the treatment and control groups. As NEET status was a treatment variable, at the first step, logistic regression predicted belonging to the treatment group by using propensity scores. In order to do so, we used socio-economic status as a major confounder. Gender, age, and place of residence (urban/rural) were control variables. The final stage of the study was represented by a series of linear regression models, in which the dependent variable Y comprised the non-cognitive skills of the Big Five taxonomy. As independent predictors, the following were used: level of education, binary indicator of respondents’ affiliation to NEET, predictor of socio-economic status, as well as the effect of their interaction, subjective well-being, place of residence, gender, and age of respondents. The matching procedure was performed using the “MatchIt” package version 4.5.5 (Stuart et al. 2013) in the R (version 4.3.2) statistical programming language.
5. Results
5.1. Non-Cognitive Skills of Russian Youth
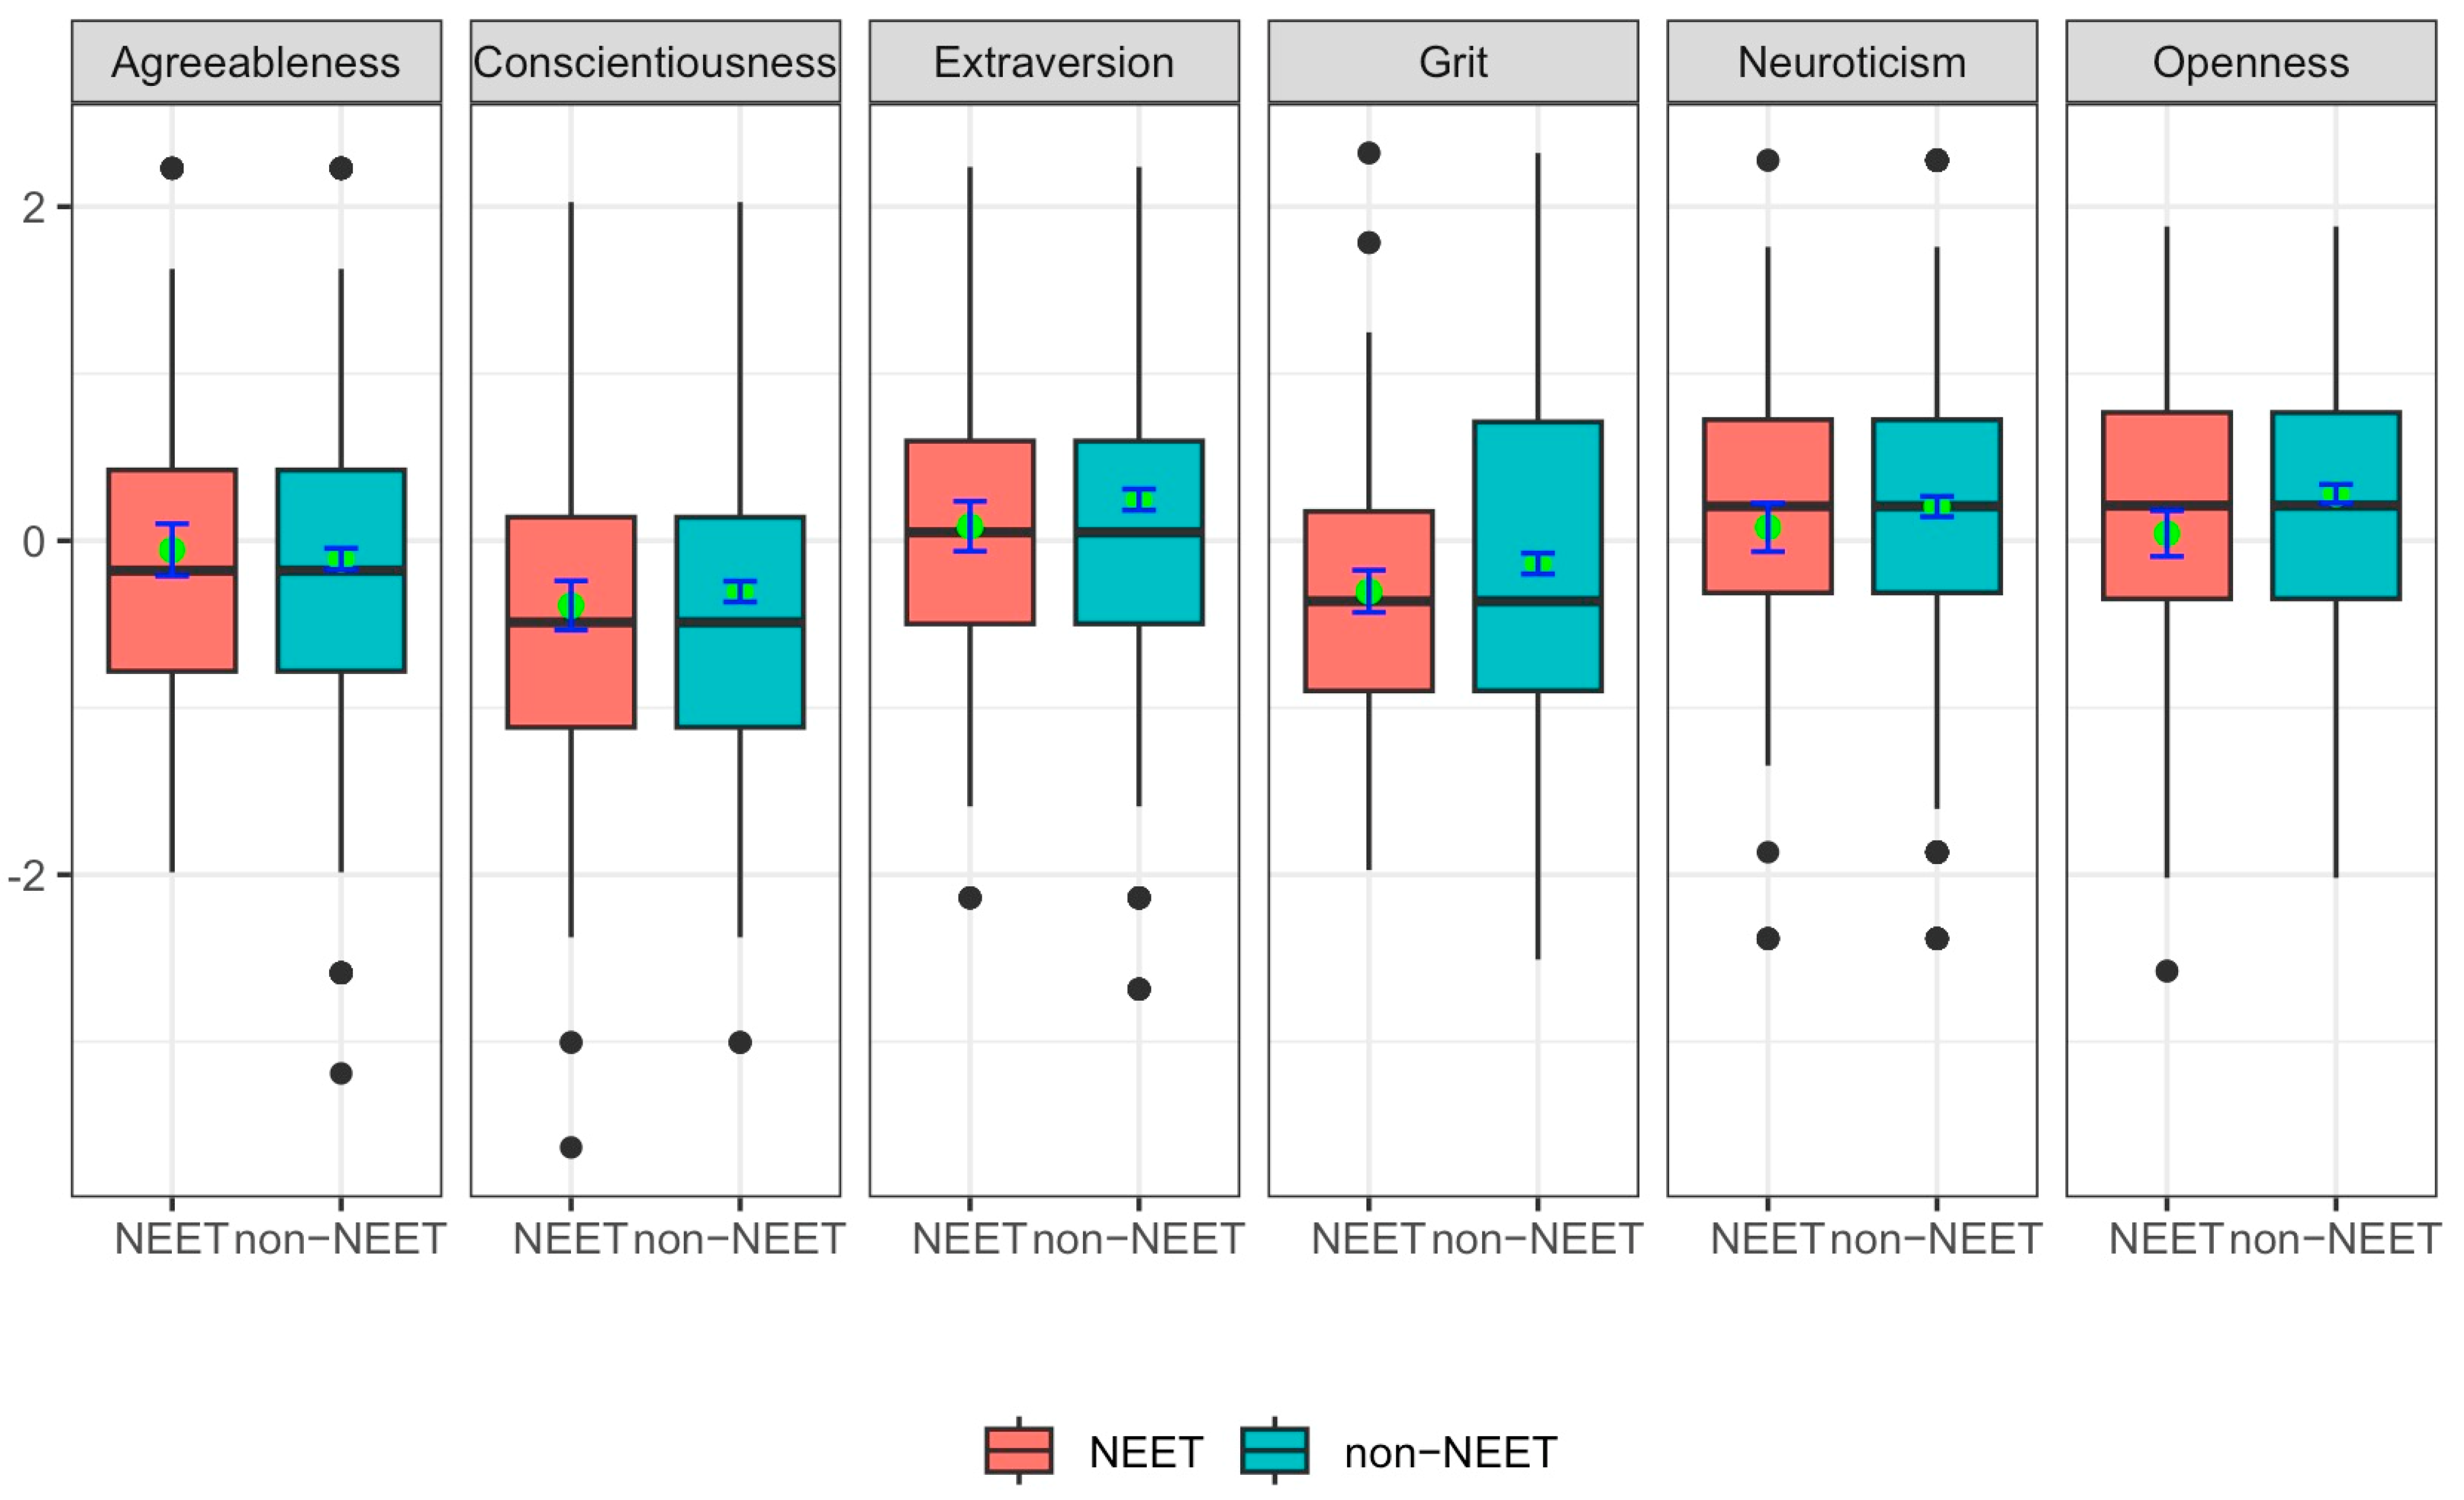
Since the focus of this study was on the NEET youth group, it was necessary to consider the differences in the distribution of non-cognitive skills between youth groups, both those included and not included in the NEET group. The distribution of measured variables broken down by groups is shown in Figure 1.

Figure 1.
Box plot of the distribution of non-cognitive skills in NEET and non-NEET youth groups. Note: the green points inside the boxes indicate the means for the groups, error bars refer to 0.95% confidence intervals, black dots visualize outliers.
In the present study, a descriptive examination of non-cognitive skill distributions was conducted across two distinct groups, with a focus on discerning the presence of any substantive distributional discrepancies. The analysis employed a box plot approach to elucidate the interquartile range (IQR), median, and outlier presence within the skill sets under investigation, which included agreeableness, conscientiousness, extraversion, grit, neuroticism, and openness. Upon scrutiny, it was observed that, with the exception of grit, there were no marked differences in the IQR between the NEET and non-NEET groups, suggesting homogeneity in the spread of scores amongst the majority of the surveyed skills. Grit, uniquely, exhibited a discernible divergence in its IQR between groups, indicating a variation in this skill’s distribution that warrants further investigation.
Outliers were a notable feature in the data, emerging in both cohorts across the majority of the skills, which may suggest the influence of individual-specific factors or experiences not encapsulated by the NEET/non-NEET dichotomy. Central to this exploratory analysis was the comparison of group means, denoted by green dots, around which confidence intervals were constructed. These intervals serve as a statistical instrument to estimate the precision of the group means. It was observed that for most skills, the confidence intervals overlapped when comparing the two groups. This overlap denoted a lack of significant difference in the mean scores between the NEET and non-NEET groups, thereby suggesting that, on a preliminary basis, NEET status does not appear to be associated with significant differences in the mean levels of most non-cognitive skills examined.
It is, however, important to contextualize these findings within the limitations inherent to exploratory analyses. While the present analysis provides a foundational understanding of the distributional characteristics of non-cognitive skills across NEET status, meaningful analytical inferences cannot be drawn in terms of understanding significance of the observed differences. Furthermore, the non-random nature of the sample might substantially bias the estimates. Inferential statistical methods that account for the sample selection bias help to better untangle the dynamics and potential implications of NEET status on non-cognitive skill development.
5.2. Socio-Demographic Composition of the NEET
The analysis of the composition of the NEET youth group shows that it had significant differences not only in non-cognitive but also in socio-economic characteristics compared to non-NEET youth. The number of NEET youth decreased with increasing socio-economic status. More than 60% of NEET youth came from poor and the poorest families, indicating their vulnerable position. As a result, there may be a reproduction of poverty patterns, associated with a lack of social elevators capable of lifting this cohort out of a life in poverty. Men made up 55% of the NEET group; rural youth dominated the NEET structure, although their prevalence was insignificant.
An interesting fact was that 16% of NEET youth had higher education but could not find a job. Excluding youth aged 15–19, who cannot complete higher education for objective reasons, the percentage of NEET youth with higher education increased to 20%, i.e., every fifth NEET had higher education but could not find a job. This suggests that young professionals with high qualifications may face insufficient inclusiveness of the labor market. Another important fact was that 45% of NEET youth did not work and were not looking for a job. This indicates a certain inertia of the NEET youth and a lack of desire by almost half of its representatives to leave this group, which may be associated with insufficient motivation. The data are presented in Table 2.
Table 2.
Socio-demographic composition of NEET youth.
5.3. Inequality in Non-Cognitive Skills of Russian Youth Depending on NEET Status
Considering the non-random nature of the sample, the method of assessing differences between NEET and non-NEET youth groups needed to be more robust than traditional regression models. The data showed that due to the small size of the NEET group, the mean values could be biased, leading to high sensitivity of the analysis results. Therefore, it was necessary to use a method of analysis that controlled for the self-selection bias of the data and, in a counterfactual manner, allowed for comparing NEET and non-NEET youth groups in terms of non-cognitive skills.
The research objective could be accomplished by the matching method, which controls for the bias caused by non-random selection due to observable characteristics and leads to a more reliable estimate of the relationship between the treatment and dependent variables. The summary of regression models is presented in Table 3. Regression models calculated after matching showed that belonging to the NEET group had a statistically significant negative effect on conscientiousness (−0.32; p < 0.01), extraversion (−0.25; p < 0.01), and grit (−0.40; p < 0.05). Moreover, matching allowed us to record a significant increase in the effect of NEET status on neuroticism (0.29, p < 0.05).
Table 3.
Results of linear regression models of non-cognitive skills after matching.
Given that the calculated coefficients were ATT, within the NEET group, socio-economic status showed significant effects on possessing several non-cognitive skills. Firstly, for NEET youth from higher income quintiles, openness to new experiences was more characteristic. The same applied to neuroticism, as the effect of being in NEET status on it increased for youth from more economically prosperous families. Moreover, NEET youth from wealthier families were also less prone to extraversion and grit. Although at first glance these results may seem counterintuitive, they were consistent with the Russian literature, which indicated that NEET youth from wealthier families may painfully experience their status of being outside the labor market system (Skvortsova and Shestakova 2020; Selezneva 2007; Seregina 2006).
To compare the effect of socio-economic status on non-cognitive characteristics in the treatment group (NEET youth) with that in the control group (other youth), an interaction effect between NEET and socio-economic status variables was introduced. The most interesting pattern was observed in the case of neuroticism; when using non-NEET youth from the poorest quintile as a reference group, we saw that the higher the socio-economic status of NEET, the lower the level of neuroticism. In other words, the richest NEET youth were more emotionally stable than their non-NEET peers from the poorest group. Conversely, NEET youth from the wealthiest quintile were more likely to be extraverts than non-NEET youth from the poorest quintile. In other words, socio-economic status indeed mediated the relationship between the NEET status and non-cognitive skills, implying that if one was at a certain level on the economic ladder, they would tend to have higher extraversion and be more emotionally stable, and that initial conditions of socialization (e.g., access to better healthcare, education, etc.) affected the way non-cognitive skills developed.
Regression analysis on the dataset after matching also showed a positive influence of education on most non-cognitive skills in the treatment group. For example, amongst NEET youth, completed school education had positive effect on extraversion (0.25, p < 0.01). Completed secondary professional (vocational) education increased openness (0.5, p < 0.01), conscientiousness (0.30, p < 0.01), and grit (0.30, p < 0.01). In turn, completed tertiary education resulted in higher levels across almost all studied non-cognitive skills. Although age demonstrated a statistically significant effect on some non-cognitive characteristics, the magnitude of this effect was very low, and this variable acted more as a controller in the model. Interestingly, male NEET youth were more disadvantaged in openness (−0.14, p < 0.05) and conscientiousness (−0.23, p < 0.01), as well as more prone to neuroticism (0.21, p < 0.01).
The results showed that the application of matching as a method controlling self-selection bias, allowed for assessing the impact of predictors on non-cognitive skills more accurately, unlike linear regression, which to a lesser extent captured the differences between NEET and non-NEET youth (the results of the OLS model are presented in Appendix A).
The results of the conducted research showed the role of the NEET status of Russian youth in the degree of manifestation of their non-cognitive skills, confirming its negative impact on the development of prosocial personal qualities. On the other hand, it was revealed that the socio-economic status of NEET youth was associated with the development of non-cognitive skills. However, the effect turned out to be significantly more pronounced when interacting with psychological and socio-economic factors, as youth from the poorest and poor segments of the population are more likely than others to fall into the NEET category, which requires adopting separate approaches to support this group and level inequality in terms of education and the development of non-cognitive skills.
A significant part of the youth who fell into the NEET group did not even seek to find a job. According to previous research literature, it is known that the development of non-cognitive skills will stimulate the behavioral motivation of youth, which will open channels of social mobility and ways to exit the NEET status. Therefore, the socio-economic inclusion of NEET youth in public life should be carried out comprehensively at multiple different levels, including personal, educational, and labor. A number of studies have shown that individual training can achieve a fragmentary effect in the form of increased labor motivation (Ushakova 2021; Aysina 2016; Selezneva 2008). However, for a systemic solution to the problem, state regulation measures are necessary.
5.4. Limitations of the Study
The main limitation of the study is that the presented conclusions cannot be interpreted in a cause-and-effect logic, although the method of comparing propensity scores is often used in econometrics as a way of performing causal analysis (Caliendo and Kopeinig 2008; Essama-Nssah 2006; Heinrich et al. 2010; Basu et al. 2017). Moreover, it is necessary to take into account that reverse causality is present in the relationship between non-cognitive skills and NEET status, as certain personality characteristics can affect the fact of falling into the NEET group; however, being in the NEET status, especially in the long term, can affect personality skills. The proposed analysis, without claiming to identify causal mechanisms between NEET status and non-cognitive skills, aimed to examine whether there is a gap in these skills between NEET and other youth, controlling for those self-selection biases that are inevitably present in the sample.
The second limitation relates to the absence of the duration of stay in NEET status as one of the predictors of the gap in non-cognitive skills. Although the RLMS is a longitudinal study, the monitoring design is such that the inclusion of this variable in the analysis is possible only for a very limited number of respondents in the 2016 sample; given that the matching method is sensitive to missing values, the current analysis could not take this criterion into account.
Finally, it is impossible not to note the limitations imposed by the measurement approach. To measure non-cognitive characteristics, a scale developed for the STEP Skills Measurement Survey was used; however, the limited number of questions for measuring each of the Big Five factors (three questions per factor), as well as the short interval of the ordinal scale (1–4), do not allow it to fully capture the variability in the possession of non-cognitive skills necessary for more accurate predictive analysis.
6. Conclusions
This study touches on the global problem of NEET youth, a group that emerges during the school-to-work transition when some cohorts of youth, after completing a certain level of education, do not find a place in the labor market. This work considers the problem of NEET youth from the point of view of their lag in non-cognitive skills, characteristics that play a key role in life success and inclusive socio-economic participation. The study results showed that a significant proportion of the NEET youth were young people with higher education; that is, higher education graduates with advanced competencies were not demanded in the labor market, which demonstrates the absence of economic returns from investments in education. Moreover, most young people who were in the NEET group came from poor families, which may indicate the lack of social elevators and an inequality in access to the education system, the labor market, and opportunities for developing key skills necessary for successful employment. Almost half of the youth in the NEET group not only did not work but also did not seek to find a job, which speaks of the need to develop personal characteristics, including non-cognitive skills, which can act as motivation drivers.
The analysis revealed that the NEET youth had a statistically significantly lower level in a number of non-cognitive skills compared to their peers. They were less conscientious, less emotionally stable, and did not have grit. These three skills indicated the main areas of lag behind other youth. A less noticeable gap was observed in extraversion.
In turn, policy measures that facilitate the effective transition of young people from the education system to the labor market could serve as mechanisms to support vulnerable youth groups experiencing the highest risks of early drop-out from the education system. It is necessary to improve public policy to support NEET youth, including through the development of non-cognitive skills through targeted social programs.
Future research endeavors in this field should pivot towards a more rigorous exploration of the causal relationships between the development of non-cognitive skills and the incidence of NEET. While recognizing the complex interplay of macroeconomic, social, and demographic determinants that contribute to NEET categorization, it is imperative to incorporate non-cognitive skills into the scholarly agenda surrounding NEET individuals. This inclusion promises to deepen our understanding of the school-to-work transition, not only in the context of systemic and institutional forces but also through a lens that captures the nuanced individual attributes on the labor market’s supply side. Such a holistic approach in research, as well as the abovementioned policy implications, would be pivotal for both developing and developed economies, as they underscore the importance of individual agency in conjunction with broader economic and societal structures.
Author Contributions
Conceptualization, G.A.; methodology, G.A.; software, V.E. and V.R.; validation, V.E. and V.R.; formal analysis, V.E., V.R. and G.A.; resources, L.D.; writing—original draft preparation, G.A., M.M. and L.D.; writing—review and editing, G.A., M.M., L.D. and M.B.; visualization, G.A. and V.E.; supervision, M.B.; funding acquisition, M.B. All authors have read and agreed to the published version of the manuscript.
Funding
This study received financial support from the research project FENW-2023-0062, which was realized at the Southern Federal University.
Informed Consent Statement
Not applicable.
Data Availability Statement
The data of Russian Longitudinal Monitoring Survey used in this study are publicly available via the following link: https://www.hse.ru/en/rlms/ (accessed on 15 October 2023).
Conflicts of Interest
The authors declare no conflict of interests.
Appendix A
Table A1.
Descriptive statistics of questions on non-cognitive skills (% of responses).
Table A1.
Descriptive statistics of questions on non-cognitive skills (% of responses).
| No. | Item | Almost Always | Most of the Time | Some of the Time | Almost Never |
|---|---|---|---|---|---|
| Openness | |||||
| 1 | Do you come up with ideas other people haven’t thought of before? * | 17 | 44 | 32 | 5 |
| 2 | Are you very interested in learning new things? * | 1.5 | 13 | 48 | 36 |
| 3 | Do you enjoy beautiful things, like nature, art and music? * | 3 | 15 | 31 | 50 |
| Conscientiousness | |||||
| 1 | When doing a task, are you very careful? * | 1 | 17 | 64 | 16 |
| 2 | Do you prefer relaxation more than hard work? | 16 | 36 | 39 | 7 |
| 3 | Do you work very well and quickly? * | 3 | 26 | 49 | 19 |
| Extraversion | |||||
| 1 | Are you talkative? * | 5 | 30 | 37 | 26 |
| 2 | Do you like to keep your opinions to yourself? Do you prefer to keep quiet when you have an opinion? | 11 | 45 | 35 | 7 |
| 3 | Are you outgoing and sociable; for example, do you make friends very easily? * | 7 | 26 | 41 | 22 |
| Agreeableness | |||||
| 1 | Do you forgive other people easily? * | 7 | 35 | 42 | 14 |
| 2 | Are you very polite to other people? * | 0 | 12 | 53 | 32 |
| 3 | Are you generous to other people with your time or money? * | 16 | 40 | 27 | 16 |
| Neuroticism | |||||
| 1 | Are you relaxed during stressful situations? * | 11 | 38 | 40 | 10 |
| 2 | Do you tend to worry? | 10 | 29 | 48 | 11 |
| 3 | Do you get nervous easily? | 14 | 21 | 51 | 12 |
| Grit | |||||
| 1 | Do you finish whatever you begin? * | 1 | 23 | 56 | 19 |
| 2 | Do you work very hard? For example, do you keep working when others stop to take a break? * | 15 | 50 | 27 | 6 |
| 3 | Do you enjoy working on things that take a very long time (at least several months) to complete? * | 37 | 39 | 17 | 6 |
Note: reverse questions marked *. Source: authors’ calculations based on RLMS HSE data (26th wave).
References
- Alfieri, Sara, Alessandro Rosina, Emiliano Sironi, Elena Marta, and Daniela Marzana. 2015. Who are Italian ‘NEETs’? Trust in institutions, political engagement, willingness to be activated and attitudes toward the future in a group at risk for social exclusion. Rivista Internazionale di Scienze Sociali 123: 285–306. [Google Scholar]
- Almagor, Moshe, Auke Tellegen, and Niels G. Waller. 1995. The Big Seven model: A cross-cultural replication and further exploration of the basic dimensions of natural language trait descriptors. Journal of Personality and Social Psychology 69: 300. [Google Scholar] [CrossRef]
- Almlund, Mathilde, Angela Lee Duckworth, James Heckman, and Tim Kautz. 2011. Personality psychology and economics. In Handbook of the Economics of Education. Edited by Hanushek E., Machin S. and Woessman L. Amsterdam: Elsevier, vol. 4, pp. 1–181. [Google Scholar]
- Amendola, Simone. 2022. Macro-Determinants of NEET: An Ecological Study at the Country Level of Analysis for the Period 1997–2020. Youth 2: 384–90. [Google Scholar] [CrossRef]
- Aysina, Rimma. 2016. Efficacy of Virtual Commmunication Training for Psychological Support to Unemployed: Randomized Controlled Trial. Sotsial’naia psikhologia i obshchestvo = Social Psychology and Society 7: 117–31. (In Russian). [Google Scholar] [CrossRef]
- Bal-Domańska, Beata. 2022. The impact of macroeconomic and structural factors on the unemployment of young women and men. Economic Change and Restructuring 55: 1141–72. [Google Scholar] [CrossRef]
- Ballo, Jannike Gottschalk, Mari Amdahl Heglum, Wendy Nilsen, and Vilde Hoff Bernstrøm. 2022. Can adolescent work experience protect vulnerable youth? A population wide longitudinal study of young adults not in education, employment or training (NEET). Journal of Education and Work 35: 502–20. [Google Scholar] [CrossRef]
- Basu, Sanjay, Ankita Meghani, and Arjumand Siddiqi. 2017. Evaluating the Health Impact of Large-Scale Public Policy Changes: Classical and Novel Approaches. Annual Review of Public Health 38: 351–70. [Google Scholar] [CrossRef]
- Benet-Martínez, Verónica, and Niels G. Waller. 1997. Further evidence for the cross-cultural generality of the Big Seven factor model: Indigenous and imported Spanish personality constructs. Journal of Personality 65: 567–98. [Google Scholar] [CrossRef]
- Berlin, Marie, Antti Kääriälä, Mette Lausten, Gunnar Andersson, and Lars Brännström. 2021. Long-term NEET among young adults with experience of out-of-home care: A comparative study of three Nordic countries. International Journal of Social Welfare 30: 266–79. [Google Scholar] [CrossRef]
- Bingöl, Ufuk. 2020. The Macroeconomic Determinants of Neet: A Panel Data Analysis For Fragile Five Countries and Russia. Journal of Management and Economics Research 18: 173–89. [Google Scholar] [CrossRef]
- Borghans, Lex, Angela Lee Duckworth, James J. Heckman, and Bas Ter Weel. 2008. The Economics and Psychology of Personality Traits. Journal of Human Resources 43: 972–1059. [Google Scholar] [CrossRef]
- Bourdieu, Pierre, and Jean-Claude Passeron. 1977. Reproduction in Education, Society and Culture. London and Beverley Hills: SAGE Publications. [Google Scholar]
- Bowles, Samuel, Herbert Gintis, and Melissa Osborne. 2001. The Determinants of Earnings: A Behavioral Approach. Journal of Economic Literature 39: 1137–76. [Google Scholar] [CrossRef]
- Cabus, Sofie, Joanna Napierala, and Stephanie Carretero. 2021. The Returns to Non-Cognitive Skills: A Meta-Analysis. Seville: European Commission, JRC123308. [Google Scholar]
- Caliendo, Marco, and Sabine Kopeinig. 2008. Some Practical Guidance for the Implementation of Propensity Score Matching. Journal of Economic Surveys 22: 31–72. [Google Scholar] [CrossRef]
- Caliendo, Marco, Deborah A. Cobb-Clark, and Arne Uhlendorff. 2015. Locus of control and job search strategies. The Review of Economics and Statistics 97: 88–103. [Google Scholar] [CrossRef]
- Carneiro, Pedro, Claire Crawford, and Alissa Goodman. 2007. The Impact of Early Cognitive and Noncognitive Skills on Later Outcomes. CEE DP 92. London: Centre for the Economics of Education, London School of Economics. [Google Scholar]
- Coleman, James. 1988. Social Capital in the Creation of Human Capital. American Journal of Sociology 94: 95–120. [Google Scholar] [CrossRef]
- Cuesta, Maite Blázquez, and Santiago Budría. 2017. Unemployment persistence: How important are non-cognitive skills? Journal of Behavioral and Experimental Economics 69: 29–37. [Google Scholar] [CrossRef]
- De Raad, Boele, and Zsófia Szirmak. 1994. The search for the “Big Five” in a non-Indo-European language: The Hungarian trait structure and its relationship to the EPQ and the PTS. European Review of Applied Psychology/Revue Européenne de Psychologie Appliquée 44: 17–24. [Google Scholar]
- Dehejia, Rajeev. 2005. Practical propensity score matching: A reply to Smith and Todd. Journal of Econometrics 125: 355–64. [Google Scholar] [CrossRef]
- Dehejia, Rajeev H., and Sadek Wahba. 2002. Propensity Score Matching Methotds for Nonexperimental casal Studies. The Review of Economics and Statistics 84: 151–61. [Google Scholar] [CrossRef]
- Di Blas, Lisa, and Mario Forzi. 1999. Refining a descriptive structure of personality attributes in the Italian language: The abridged Big Three circumplex structure. Journal of Personality and Social Psychology 76: 451. [Google Scholar] [CrossRef]
- Duckworth, Angela L., and David Scott Yeager. 2015. Measurement matters: Assessing personal qualities other than cognitive ability for educational purposes. Educational Researcher 44: 237–51. [Google Scholar] [CrossRef] [PubMed]
- Edin, Per-Anders, Peter Fredriksson, Martin Nybom, and Björn Öckert. 2022. The Rising Return to Noncognitive Skill. American Economic Journal: Applied Economics 14: 78–100. [Google Scholar] [CrossRef]
- Elder, Sara. 2015. What Does NEETs Mean and Why Is the Concept so Easily Misinterpreted? ILO Technical Brief No. 1. Geneva: International Labour Office. Available online: https://www.ilo.org/wcmsp5/groups/public/---dgreports/---dcomm/documents/publication/wcms_343153.pdf (accessed on 15 October 2023).
- Essama-Nssah, Boniface. 2006. Propensity Score Matching and Policy Impact Analysis: A Demonstration in EViews; World Bank Policy Research Working Paper No. 3877. Washington, DC: The World Bank. Available online: https://openknowledge.worldbank.org/bitstream/handle/10986/8730/wps38770rev0pdf.pdf?sequence=1 (accessed on 15 October 2023).
- Farrington, Camille A., Melissa Roderick, Elaine Allensworth, Jenny Nagaoka, Tasha Seneca Keyes, David W. Johnson, and Nicole O. Beechum. 2012. Teaching Adolescents to Become Learners: The Role of Noncognitive Factors in Shaping School Performance. A Critical Literature Review. Chicago: University of Chicago Consortium on Chicago School Research. [Google Scholar]
- Fletcher, Jason. 2013. The Effects of Childhood Adhd on Adult Labor Market Outcomes. Health Economics 23: 159–81. [Google Scholar] [CrossRef] [PubMed]
- Gimpelson, Vladimir, Anna Zudina, and Rostislav Kapeliushnikov. 2020. Non-Cognitive Components of Human Capital: Evidence from Russian Data. Series WP3 “Labour Markets in Transition”. [Electronic Resource]: Working Paper WP3/2020/02. Moscow: National Research University Higher School of Economics, Publishing House of the Higher School of Economics. 46p. (In Russian) [Google Scholar]
- Glewwe, Paul, Qiuqiong Huang, and Albert Park. 2017. Cognitive skills, noncognitive skills, and school-to-work transitions in rural China. Journal of Economic Behavior & Organization 134: 141–64. [Google Scholar]
- Goldberg, Lewis R. 1992. The development of markers for the Big-Five factor structure. Psychological Assessment 4: 26. [Google Scholar] [CrossRef]
- Green, Francis. 2011. What is Skill? An Inter-Disciplinary Synthesis. Centre for Learning and Life Chances in Knowledge Economies and Societies. London: LLAKES Research Paper 20. [Google Scholar]
- Grjibovski, Andrej. M., Sergey Ivanov, М. A. Gorbatova, and Altay Dyussupov. 2016. Propensity Score Matching as a Modern Statistical Method for Bias Control in Observational Studies with Continuous Outcome Variable. Ekologiya Cheloveka [Human Ecology] 7: 51–60. (In Russian). [Google Scholar] [CrossRef]
- Heckman, James J., and Thomas E. MaCurdy. 1986. Labor econometrics. Handbook of Econometrics 3: 1917–77. [Google Scholar]
- Heckman, James J., Hidehiko Ichimura, and Petra Todd. 1998. Matching as an econometric evaluation estimator. The Review of Economic Studies 65: 261–94. [Google Scholar] [CrossRef]
- Heckman, James J., John Eric Humphries, Sergio Urzua, and Gregory Veramendi. 2011. The Effects of Educational Choices on Labor Market, Health and Social Outcomes. Working Paper No. 2011-002. Chicago: Human Capital and Economic Opportunity: A Global Working Group. Available online: http://humcap.uchicago.edu/RePEc/hka/wpaper/HHUV_2010_effect-edu-choice.pdf (accessed on 15 October 2023).
- Heckman, James J., Jora Stixrud, and Sergio Urzua. 2006. The effects of cognitive and noncognitive abilities on labor market outcomes and social behavior. Journal of Labor Economics 24: 411–82. [Google Scholar] [CrossRef]
- Heinrich, Carolyn, Alessandro Maffioli, and Gonzalo Vazquez. 2010. A Primer for Applying Propensity-Score Matching. Impact-Evaluation Guidelines. Inter-American Development Bank Technical Notes no IDB-TN-161. Available online: https://publications.iadb.org/publicationswedishh/document/A-Primer-for-Applying-Propensi-ty-Score-Matching.pdf (accessed on 15 October 2023).
- Hussey, Ian, and Sean Hughes. 2020. Hidden invalidity among 15 commonly used measures in social and personality psychology. Advances in Methods and Practices in Psychological Science 3: 166–84. [Google Scholar] [CrossRef]
- Karaoğlan, Deniz, Nazire Begen, and Pinar Tat. 2022. Mental Health Problems and Risky Health Behaviors among Young Individuals in Turkey: The Case of Being NEET. The Journal of Mental Health Policy and Economics 25: 105–17. [Google Scholar] [PubMed]
- Kautz, Tim, James J. Heckman, Ron Diris, Bas Ter Weel, and Lex Borghans. 2014. Fostering and Measuring Skills: Improving Cognitive and Noncognitive Skills to Promote Lifetime Success. Paris: OECD. [Google Scholar] [CrossRef]
- Kniesner, Thomas, and Bas Ter Weel, eds. 2008. Special Issue on Noncognitive Skills and Their Development. Journal of Human Resources 43: 729–1059. [Google Scholar]
- Kuzminov, Yaroslav, Pavel Sorokin, and Isak Froumin. 2019. Generic and Specific Skills as Components of Human Capital: New Challenges for Education Theory and Practice. Foresight and STI Governance 13: 19–41. (In Russian). [Google Scholar] [CrossRef]
- Laible, Marie-Christine, Silke Anger, and Martina Baumann. 2020. Personality Traits and Further Training. Frontiers in Psychology 11: 510537. [Google Scholar] [CrossRef]
- Lee, Kibeom, and Michael C. Ashton. 2006. Further assessment of the HEXACO Personality Inventory: Two new facet scales and an observer report form. Psychological Assessment 18: 182. [Google Scholar] [CrossRef]
- Lerman, Robert I. 2013. Are employability skills learned in U.S. youth education and training programs? IZA Journal of Labor Policy 2: 1–12. [Google Scholar] [CrossRef]
- Lindqvist, Erik, and Roine Vestman. 2011. The labor market returns to cognitive and noncognitive ability: Evidence from thewedishh enlistment. American Economic Journal: Applied Economics 3: 101–28. [Google Scholar] [CrossRef]
- Maynou, Laia, Javier Ordóñez, and José Ignacio Silva. 2022. Convergence and determinants of young people not in employment, education or training: An European regional analysis. Economic Modelling 110: 105808. [Google Scholar] [CrossRef]
- Messick, Samuel. 1978. Potential Uses of Noncognitive Measurement in Education. Journal of Educational Psychology 71: 281–92. [Google Scholar] [CrossRef]
- Mohanty, Madhu Sudan. 2010. Effects of positive attitude and optimism on employment: Evidence from the US data. The Journal of Socio-Economics 39: 258–70. [Google Scholar] [CrossRef]
- Mueller, Gerrit, and Erik Plug. 2006. Estimating the effect of personality on male and female earnings. Industrial and Labor Relations Review 60: 3–22. [Google Scholar] [CrossRef]
- Nyhus, Ellen K., and Empar Pons. 2005. The effects of personality on earnings. Journal of Economic Psychology 26: 363–84. [Google Scholar] [CrossRef]
- Perez, Judith Areli. 2020. Returns to Noncognitive Skills in Men and Women of Mexico. Doctoral dissertation, Georgetown University, Washington, DC, USA. Available online: https://repository.library.georgetown.edu/bitstream/handle/10822/1059492/PerezGarza_georgetown_0076M_14643.pdf?sequence=1&isAllowed=y (accessed on 15 October 2023).
- Quintano, Claudio, Paolo Mazzocchi, and Antonella Rocca. 2018. The determinants of Italian NEETs and the effects of the economic crisis. GENUS: Journal of Population Sciences 74: 2–24. [Google Scholar] [CrossRef] [PubMed]
- Ripamonti, Enrico. 2023. Young people’s literacy, numeracy achievements, and the school-to-work transition: A longitudinal study of regional variation. Oxford Review of Education, 1–17. [Google Scholar] [CrossRef]
- Rosenbaum, Paul R., and Donald B. Rubin. 1983. The central role of the propensity score in observational studies for causal effects. Biometrika 70: 41–55. [Google Scholar] [CrossRef]
- Rozhkova, Ksenia V. 2019. The Return to Noncognitive Characteristics in the Russian Labor Market. [Electronic Resource]: Working Paper WP15/2019/02. Moscow: Publishing House of the Higher School of Economics. 46p. (In Russian) [Google Scholar]
- Rozhkova, Ksenia, and Sergey Roshchin. 2021. The Effect of Non-Cognitive Skills on Higher Education and Labor Market Outcomes in Russia. Higher Education in Russia and Beyond 5: 14–15. Available online: https://herb.hse.ru/data/2022/01/19/1754822789/1HERB_30_view%20(1).pdf#page=14 (accessed on 15 October 2023).
- Rubin, Donald B. 2001. Using propensity scores to help design observational studies: Application to the tobacco litigation. Health Services and Outcomes Research Methodology 2: 169–88. [Google Scholar] [CrossRef]
- Rubin, Donald B., and Neal Thomas. 2000. Combining propensity score matching with additional adjustments for prognostic covariates. Journal of the American Statistical Association 95: 573–85. [Google Scholar] [CrossRef]
- Saucier, Gerard, and Lewis R. Goldberg. 2002. Assessing the Big Five: Application of 10 psychometric criteria to the development of marker scales. In Big Five Assessment. Edited by Boele de Raad and Marco Perugini. Cambridge: Hogrefe & Huber Publishers. [Google Scholar]
- Schmit, Mark J., Elise L. Amel, and Ann Marie Ryan. 1993. Self-reported assertive job-seeking behaviors of minimally educated job hunters. Personnel Psychology 46: 105–24. [Google Scholar] [CrossRef]
- Selezneva, A. V. 2007. Youth Unemployment—Personal Characteristics and Typical Behavior in Failure Situations. Siberian Journal of Psychology 26: 93–95. [Google Scholar]
- Selezneva, A. V. 2008. Psihologicheskie osobennosti lichnosti molodogo bezrabotnogo i vozmozhnosti ih korrekcii v processe treningovogo obuchenija [Psychological Characteristics of the Personality of a Young Unemployed Person and the Possibility of Their Correction in the Process of Training]. Doctoral dissertation, Psychology, Baikal State University of Economics and Law, Irkutsk, Russia; p. 20. (In Russian). [Google Scholar]
- Seregina, A. A. 2006. Sotsial’no-psikhologicheskiye usloviya preodoleniya infantilizma u bezrabotnoy molodezhi [Social and Psychological Conditions for Overcoming Infantilism in Unemployed Youth]. Doctoral dissertation, Psychology, Russian State Social University, Moscow, Russia. (In Russian). [Google Scholar]
- Shivpuri, S., and B. Kim. 2004. Do Employers and Colleges See Eye-to-Eye? NACE Journal 65: 37–44. [Google Scholar]
- Skvortsova, Margarita Borisovna, and Natalia Nikolaevna Shestakova. 2020. Youth not in employment and education: Factors, origins, and psychological peculiarities of the group. Sociodynamics 12: 39–51. [Google Scholar] [CrossRef]
- Stuart, Elizabeth A., Gary King, Kosuke Imai, and Daniel Ho. 2013. MatchIt: Nonparametric Preprocessing for Parametric Causal Inference (Software). Available online: http://gking.harvard.edu/matchit (accessed on 15 October 2023).
- Toomet, Ott, and Arne Henningsen. 2008. Sample Selection Models in R: Package sampleSelection. Journal of Statistical Software 27: 1–23. [Google Scholar] [CrossRef]
- Ushakova, M. Y. 2021. Training as a method aimed at providing psychological assistance to various categories of unemployed citizens. Paper presented at Collection of Scientific Papers Based on the Materials of the XVIII International Scientific and Practical Conference, Anapa, Russia, January 14; p. 172. [Google Scholar]
- Uysal, Selver Derya, and Winfried Pohlmeier. 2011. Unemployment duration and personality. Journal of Economic Psychology 32: 980–92. [Google Scholar] [CrossRef]
- Varshavskaja, E. Ja. 2016. Rossijskaja NEET-molodezh’: Harakteristiki i tipologija. Sociologicheskie issledovanija 9: 31–39. (In Russian). [Google Scholar]
- Viswesvaran, Chockalingam, and Deniz S. Ones. 2000. Measurement Error in “Big Five Factors” Personality Assessment: Reliability Generalization across Studies and Measures. Educational and Psychological Measurement 60: 224–35. [Google Scholar] [CrossRef]
- Westwood, Andrew. 2004. Skills That Matter and Shortages That Don’t. In The Skills That Matter. Edited by Christopher Warchurst, Irena Grugulis and Ewart Keep. New York: Palgrave-Macmillan. [Google Scholar]
- Wichert, Laura, and Winfried Pohlmeier. 2010. Female Labor Force Participation and the Big Five. Discussion Paper No. 10-003. Mannheim: Centre for European Economic Research (ZEW). [Google Scholar]
- Zetterberg, Johnny. 2005. Swedish Evidence on the Impact of Cognitive and Non-Cognitive Ability on Earnings—An Extended Pre-Market Factor Approach. Uppsala: Institute for Labour Market Policy Evaluation. [Google Scholar]
- Zhou, Kai. 2016. Non-cognitive skills: Definitions, measurement and malleability. In Education for People and Planet: Creating Sustainable Futures for All. Paper Commissioned for the Global Education Monitoring Report 2016. Paris: UNESCO. [Google Scholar]
- Zudina, Anna. 2022. Non-Cognitive Skills of NEET Youth in Russia. Voprosy Obrazovaniya/Educational Studies Moscow 4: 154–83. [Google Scholar] [CrossRef]
Disclaimer/Publisher’s Note: The statements, opinions and data contained in all publications are solely those of the individual author(s) and contributor(s) and not of MDPI and/or the editor(s). MDPI and/or the editor(s) disclaim responsibility for any injury to people or property resulting from any ideas, methods, instructions or products referred to in the content. |
© 2024 by the authors. Licensee MDPI, Basel, Switzerland. This article is an open access article distributed under the terms and conditions of the Creative Commons Attribution (CC BY) license (https://creativecommons.org/licenses/by/4.0/).