Article

Pathways to Prosperity: Navigating Post-Stagnation Growth and Revitalizing Business

by
Vladislav Spitsin
1,*,
Darko B. Vuković
2,3,
Marina Ryzhkova
1 and
Victoria Leonova
1
1
Business School, National Research Tomsk Polytechnic University, 634050 Tomsk, Russia
2
Graduate School of Management, Saint Petersburg State University, 199004 Saint Petersburg, Russia
3
Geographical Institute “Jovan Cvijic” SASA, 11000 Belgrade, Serbia
*
Author to whom correspondence should be addressed.
Economies 2024, 12(3), 55; https://doi.org/10.3390/economies12030055
Submission received: 10 November 2023 / Revised: 17 January 2024 / Accepted: 2 February 2024 / Published: 24 February 2024
(This article belongs to the Section Economic Development)

Abstract

:
This study examines the ways in which firms recover from stagnation or sales decline, with a focus on two key aspects: traditional high-growth companies and growth restarts within the framework of organizational life cycle theory. Analyzing a dataset of 1883 Russian firms from 2013 to 2021, this research employs logistic regression to identify factors that promote growth. These factors include the youth of the firm, investment intensity, and significant sales drops during periods of stagnation. The study introduces a new economic category, termed ‘restarting growth’, which signifies a firm’s sustained expansion following an extended period of stagnation. This category is crucial for identifying factors that increase the likelihood of a company transitioning to growth after prolonged stagnation or production downturn. The findings of this study reveal that firms that are younger, invest more intensively in fixed capital, and have experienced a larger sales drop during a period of stagnation are more likely to transition to growth. These results are juxtaposed with the growth factors characteristic of traditional high-growth companies, as well as with the theoretical approaches explaining growth restarts within the framework of organizational life cycle theory. Such distinctions are pivotal both for academic understanding and practical applications in discerning how companies rebound from crises. Moreover, the research identifies several highly significant factors—indicators that can assist investors in selecting promising firms for financing.

1. Introduction

Despite over six decades of promoting sustainable development on the global agenda, the prevailing development paradigm continues to prioritize quantitative economic growth as the principal indicator of business success (Vuković et al. 2022). This emphasis is pervasive across various levels, encompassing household welfare, firm success, and broader economic aggregates like industry output shares and GDP growth. Within industries, growth distribution is uneven, with overall industry growth rates reflecting a combination of several high-performing firms and the decline, or even exit, of competitors. While both extremes present scientific interest, the future trajectory of an industry arguably depends more on those entities that achieve abnormally high growth rates through qualitative leaps. These entities are identified as ‘growth companies’, ‘gazelles’, and ‘scale-ups’ (Savin and Novitskaya 2023; Spitsin et al. 2023b; Tomenendal et al. 2022). High growth in indicators over a specific period may be attributed to external circumstances; however, consistent high growth across multiple periods, particularly post the low base effect, warrants focused investigation.
In the early 21st century, numerous countries faced recessions and crises, defying the anticipated trajectory of economic growth (Foroni et al. 2020; Hardy and Sever 2021; Vukovic et al. 2017). This challenging external environment, exacerbated by financial crises, political tensions, economic sanctions, the COVID-19 pandemic, and other forms of turbulence, has had detrimental effects on economies and businesses (Maiti et al. 2022; Kohler and Stockhammer 2021; Halmai 2021; Spitsin et al. 2020b). These systemic problems cannot be effectively addressed through governmental intervention and the allocation of subsidies alone. It is critical to explore the strategies employed by firms that manage to achieve accelerated growth under such adverse conditions, particularly following a prolonged period of stagnation (Xiang et al. 2021; Knowles et al. 2020; Åslund and Snegovaya 2021). As a result, there is a necessitated shift in economic research focus—from analyzing generic growth factors to examining a special type of firm dynamics where, post-stagnation, a company’s primary indicators begin to exhibit high rates of growth, a phenomenon this study terms ‘restarting growth’.
Traditionally, rapid growth is commonly associated with new firms, fostering an expectation that such growth will decelerate over time, eventually leading to a protracted period of sluggish performance or decline, as conceptualized in the organizational life cycle theory. There is an extensive body of literature on fast-growing companies, particularly ‘gazelles’, that thoroughly examines growth factors across various countries, regions, and economic sectors. However, recent scholarly attention has pivoted from gazelles to ‘scale-ups’—mature companies that have maintained sustained growth for a duration of three or more years (Ambrosio et al. 2021). While academic research actively explores patterns in firm growth dynamics, the mechanisms and factors that enable a company to reinitiate growth following a prolonged period of stagnation remain under-explored in existing literature.
The issue under discussion is particularly relevant to the Russian economy, which has experienced protracted stagnation due to reduced trade with foreign nations and the impact of economic sanctions imposing export and import restrictions. These sanctions have significantly limited Russia’s access to financial resources and its ability to participate in international value chains. Such constraints highlight the challenge of fostering growth in companies that possess the potential to develop, notwithstanding periods of stagnation or reduction in production. Consequently, it becomes imperative for researchers to identify firms exhibiting the necessary growth dynamics, to characterize these firms, and to uncover the factors that have enabled them to resume a trajectory of growth following a period of stagnation.
The objective of this research is to identify factors that increase the likelihood of companies transitioning to growth following a period of long-term stagnation or decline in production. Spanning the years 2013 to 2021, the study is divided into two distinct phases: the first phase, from 2013 to 2017, focuses on identifying firms experiencing stagnation, and the second phase, from 2016 to 2021, concentrates on identifying firms that demonstrate restarting growth. The research targets a specific cohort of firms that were stagnant or facing declining sales in the first phase and then transitioned to sustainable growth in the subsequent phase. This study relies on a database of Russian enterprises (Spark Information System 2023) and restricts its analysis to quantitative data derived from enterprise reporting indicators. This study formulates several research questions: Firstly, what are the key factors that enhance the likelihood of firms transitioning from a state of stagnation or decline to one of growth? Secondly, how do financial outcomes during periods of stagnation compare with those observed in subsequent phases of growth? Furthermore, the study seeks to understand how the growth probabilities and dynamics of firms recovering from stagnation differ from those of firms experiencing traditional rapid growth, particularly within the framework of organizational life cycle theory.
The novelty of this study is twofold: it introduces and articulates a new concept, namely the ‘restarting growth’ of enterprises, and identifies, using data on Russian enterprises with the requisite dynamics, the factors precipitating this phenomenon. The investigation into growth opportunities for firms’ post-stagnation or following a sales decline adopts a dual perspective. Initially, the study examines traditional fast-growing firms, delineates their growth drivers, and draws parallels with firms rebounding from stagnation or declining sales. Simultaneously, it systematizes theoretical frameworks explaining growth restart within the context of organizational life cycle theory and formulates hypotheses concerning growth factors. The empirical segment of the study is dedicated to identifying factors that contribute to firms’ transition to restarting growth after prolonged stagnation. This research addresses several key challenges:
It identifies factors that enhance the probability of firms transitioning to growth after stagnation.
It unravels patterns of financial outcomes during periods of stagnation and subsequent growth.
It compares growth probabilities and dynamics between firms experiencing post-stagnation growth and those undergoing traditional rapid growth, within the ambit of organizational life cycle theory. Our study represents a novel enterprise-level exploration of the phenomenon of enterprise growth restart. While the existing literature has examined similar dynamics at macrolevels and in regional studies (Otiman 2008), this specific focus is unprecedented.
This research introduces a novel economic category termed ‘restarting growth’, which denotes the sustained expansion of an enterprise following a period of prolonged stagnation. Discovering factors that support a company’s shift toward sustained growth after a crisis is essential, both in academic realms and practical applications.
We propose a methodological distinction between ‘restarting’ and ‘restarted’ growth. The former focuses on the identification of factors that enhance the probability of a company’s transition to growth after enduring long-term stagnation or a production downturn, while the latter pertains to analyzing a company’s growth dynamics in the years subsequent to its resurgence. Throughout this research, we adopt and consistently employ the concept of ‘restarting growth’. To effectively clarify growth processes, it is imperative to choose a suitable indicator that consistently signifies the cessation of stagnation. We consider the following:
Profit: Although this metric reflects the firm’s stability and favorable market conditions, it is susceptible to rapid changes due to external factors, making it challenging to analyze growth determinants solely based on profit. Additionally, the relationship between growth and profitability merits separate investigation (Markman and Gartner 2002).
Employment or Fixed Assets: These are industry-specific measures with long-term characteristics that tend to change gradually at the onset of stagnation. It is generally observed that corporate growth leads to job creation (Davidsson and Delmar 2017). However, there are instances where job dynamics can sometimes move inversely to company growth (Brouwer et al. 1993).
Output: Performance indicators measured in physical units are inherently incomparable. A single enterprise may produce a variety of goods with different production dynamics. Thus, comparing physical output does not necessarily reflect company growth dynamics but rather market dynamics for specific goods. This perspective also considers growth resulting from productivity enhancements and production scale decisions (Aiello et al. 2011).
Sales: This metric is fundamental to evaluating company growth and presents no inherent contradictions in its dynamics. It allows for uniform assessment across various types of companies without necessitating differentiation based on other metrics (Delmar et al. 2003).
In quantitative analysis, scholars employ absolute measures, including duration and growth rate, as well as relative measures, such as companies ranked within the top percentiles in employment or income growth distributions (Haltiwanger et al. 2016). Additionally, they utilize the Birch Index (Birch 1987), examine patterns in company growth distribution dynamics (Halvarsson 2013a), and utilize composite indices derived from company activity indicators (Hangstefer 2000). Our study employs the most widely recognized absolute measure—sales growth—as the primary metric for analysis. An alternative metric, such as the increase in the number of workers, was considered but is not utilized in this research due to the unavailability of sufficient empirical data.
The structure of this study is methodically arranged as follows: The second section introduces and elaborates on the concept of ‘restarting growth’, situating it in relation to existing economic theories and justifying the necessity of this new term. The third section is devoted to the development and substantiation of scientific hypotheses relevant to the study. The fourth section details the research methodology employed, encompassing a review of company growth data and a comprehensive description of the model groups and variable structures. In the fifth section, the results of the regression model tests are presented and analyzed. The sixth section delves into an additional hypothesis concerning the dynamics of firms undergoing restarting growth. Subsequently, the Discussion section provides theoretical insights and practical implications drawn from the identified patterns. This is followed by a comparative analysis of our findings with similar studies, along with an articulation of the limitations pertaining to the applicability of our results. The final section offers a conclusion to the study.

2. Literature Review

2.1. High-Growth Firms

In scholarly discourse, the term ‘high-growth firms’ (HGFs) is well established and widely recognized (Grover Goswami et al. 2019; Nightingale and Coad 2014). These firms are characterized by various monikers within the literature. ‘Gazelles’, as defined by Birch (1981), are predominantly new and rapidly growing firms responsible for significant employment growth in regional economies. These are businesses that start larger than new firms but smaller than establishments of large firms. Gazelles are contrasted with ‘mice’, described as small but fast-growing firms with fewer than 20 employees, and ‘elephants’, denoting large fast-growing firms with more than 500 employees (Acs and Mueller 2008). Additional terms include ‘gazillas’ (Ferrantino et al. 2012), referring to very large fast-growing companies, and ‘unicorns’, which are large, fast-growing startups (Casnici 2021). Notably, ‘scale-ups’ are defined as mature companies sustaining annual growth rates exceeding 20% for at least three years (Piaskowska et al. 2021; Duruflé et al. 2016). This study diverges from the traditional categorization of HGFs to investigate a distinct form of company dynamics, one that is not predefined by the qualitative attributes of its growth but focuses on the unique phenomenon of ‘restarting growth’.
Scholars frequently associate rapid growth with new ventures, noting that growth typically slows over time, potentially leading to prolonged periods of subdued dynamics, stagnation, or declines in sales and production (Evans 1987). The extensive literature on fast-growing firms, particularly gazelles (Coad and Srhoj 2019; Grover Goswami et al. 2019; Spitsin et al. 2023a, 2023b), offers an in-depth exploration of growth factors across diverse geographical regions and economic sectors. Gazelle companies are commonly identified among younger enterprises (Henrekson and Johansson 2010), with research focusing on how certain factors, such as venture capital, may enhance growth trajectories, leading to significant liquidity events like initial public offerings (Aldrich and Ruef 2018). This body of work, employing various analytical methodologies including econometric models and artificial intelligence techniques, implicitly suggests a correlation between a firm’s growth and its age. However, the continued observation and analysis of gazelles post liquidity event are not extensively pursued in existing research. As a result, the concept of reinitiating or restarting growth in enterprises has remained underexplored and has not been adequately recognized as an independent area of scholarly inquiry within this domain.

2.2. Unpacking the Drivers and Varieties of Restarting Growth

In the theoretical framework of organizational life cycles, also referred to as the corporate life cycle, two divergent perspectives are posited concerning the ultimate stages of an organization’s existence. One perspective argues that the life cycle inevitably leads to the dissolution of the organization. In contrast, the other perspective acknowledges the potential for renewed growth and revival (refer to Table 1 for a detailed comparison).
The catalysts for the resumption of growth are diverse, and the enumeration provided in this paper is not exhaustive. Recognizing a phase of ‘restarting growth’ in a company’s trajectory significantly enhances our understanding of how both nascent and established companies can achieve renewed expansion and how they may rejuvenate during the later stages of their life cycle. However, to discern underlying patterns, it is imperative to identify statistically significant correlates indicative of the onset of growth resurgence.
Our study examines various factors that may augment the likelihood of companies transitioning back to growth following a period of stagnation. It differentiates between two types of post-stagnation growth: moderate long-term and rapid long-term. The analysis includes factors typically associated with young, rapidly growing companies, as well as unique factors pertinent to growth following stagnation. Moreover, this paper contrasts the outcomes of post-stagnation growth with the growth trajectories of new enterprises. To classify dynamics as ‘restarting growth’, we employ specific criteria:
A period of no positive revenue (sales) growth for three consecutive years during stagnation.
Subsequently, a positive sales growth rate for at least three out of four years during the growth period, categorized as follows:
  • The first group of enterprises with an annual growth rate of 10% (accumulating to 30% or more over four years).
  • The second group of enterprises with an annual growth rate exceeding 20% (accumulating to 60% or more over four years).
  • The third group of enterprises with revenue growth for less than three years but an overall increase exceeding 60% over four years (to be addressed in a separate publication).
This categorization aligns with Birch’s classic definition of gazelle companies (1981) and the Eurostat-OECD (2007) Manual on Business Demography Statistics criteria for high-growth firms (HGFs).

2.3. ‘Growth Firms’ versus ‘Growth Episodes’

Identifying high-growth firms poses a challenge due to the volatility, marked by substantial variation, in annual sales growth rates. Existing empirical studies affirm that the fluctuation in annual growth rates within firms over time exceeds that between firms (Coad and Srhoj 2019). This observation allows scholars to refer to ‘growth episodes’ rather than designating entities as ‘growth firms’ (Grover Goswami et al. 2019). To accurately discern and scrutinize ‘growth firms’, it becomes imperative to consider growth variation and mitigate the impact of elevated one-year growth spurts. A range of strategies may be deployed to tackle this issue, encompassing the adoption of the geometric average of sales growth over multiple years (OECD 2008) and the incorporation of the normalized beta coefficient in the sales growth trend equation for the designated period (Spitsin et al. 2023b).
A potential resolution involves integrating two criteria: sales growth for the specific period and the coefficient of variation of sales growth for that period. Nonetheless, the coefficient of variation functions as a parametric feature of the sample and attains optimal efficacy when the sample is both substantial in size and adheres to the normal distribution law. Given the common non-compliance of these conditions in the context of rapidly growing firms, empirical confirmation is warranted to establish the appropriateness of deploying the coefficient of variation (Spitsin et al. 2023b).
The inclination to account for variation and focus on ‘growth firms’ instead of ‘growth episodes’ may result in a reduction in the count of identified high-growth companies. Several studies opt not to grapple with this predicament, choosing instead to examine cumulative sales growth over successive years, effectively amalgamating ‘growth firms’ and ‘growth episodes’ (Coad and Srhoj 2019; Chae 2023). This approach, however, elicits controversy, given previous research findings indicating that entities exhibiting sustained, long-term growth (annual sales growth) possess distinct advantages over those characterized by sporadic, yet robust, sales growth (Spitsin et al. 2023b).
Our study investigates the resurgence of growth in firms, prioritizing the examination of growth trajectories over episodic occurrences. To surmount this challenge, we propose the introduction of a minimum annual growth criterion, necessitating compliance in three out of four years. This method ensures the identification of ‘growth firms’ that consistently manifest annual sales growth over an extended period. We contend that this approach holds greater reliability compared to the simultaneous application of two criteria: sales growth and sales growth variation.
Excluded from this study are the interrelations between firm growth and overall economic expansion, the nexus between a company’s restarting growth and broader economic and employment growth, as well as the macroeconomic rejuvenation of the economy and individual firms through direct governmental interventions (Postelnicu and Ban 2010).

3. Development of Research Hypotheses

Our study is positioned at the intersection of two key theoretical perspectives: the examination of the phenomenon of ‘restarting growth’ within the framework of organizational life cycle theory (as detailed in Table 1) and the exploration of theories related to the evolution of fast-growing companies. Consequently, the development of our hypotheses endeavors to amalgamate insights from both these theoretical realms, aiming for a comprehensive understanding of the factors influencing restarting growth.

3.1. Firm Age and Restarting Growth

The youth of a company is a prominent characteristic in identifying fast-growing firms, especially ‘gazelle firms’. This attribute is widely recognized as a standard criterion in scholarly discourse (Anyadike-Danes et al. 2009; Daunfeldt et al. 2015; Grover Goswami et al. 2019; Haltiwanger et al. 2016; Arrighetti and Lasagni 2013). However, in the context of our study, the situation presents a different dynamic. Our sample does not include very young firms, as it presupposes a minimum of three years of stagnation, suggesting that other factors may influence the restarting growth process.
Furthermore, within the framework of the organizational life cycle theory, and more specifically, the corporate transformation model, research indicates that strategic learning and the implementation of adaptive strategies are often more feasible in smaller and younger companies (Sirén et al. 2017). Younger firms are typically better positioned to alleviate administrative burdens and to transform their values and corporate culture, as they are less likely to have developed the administrative inflexibility characteristic of more established organizations. While we anticipate that younger firms may have a relative advantage in achieving restarting growth, the influence of the ‘Age’ factor might be less pronounced than in scenarios involving very young firms.
Consequently, we propose the following hypothesis:
Hypothesis 1 (H1).
Younger firms are more likely to achieve restarting growth following a period of stagnation compared to their older counterparts.

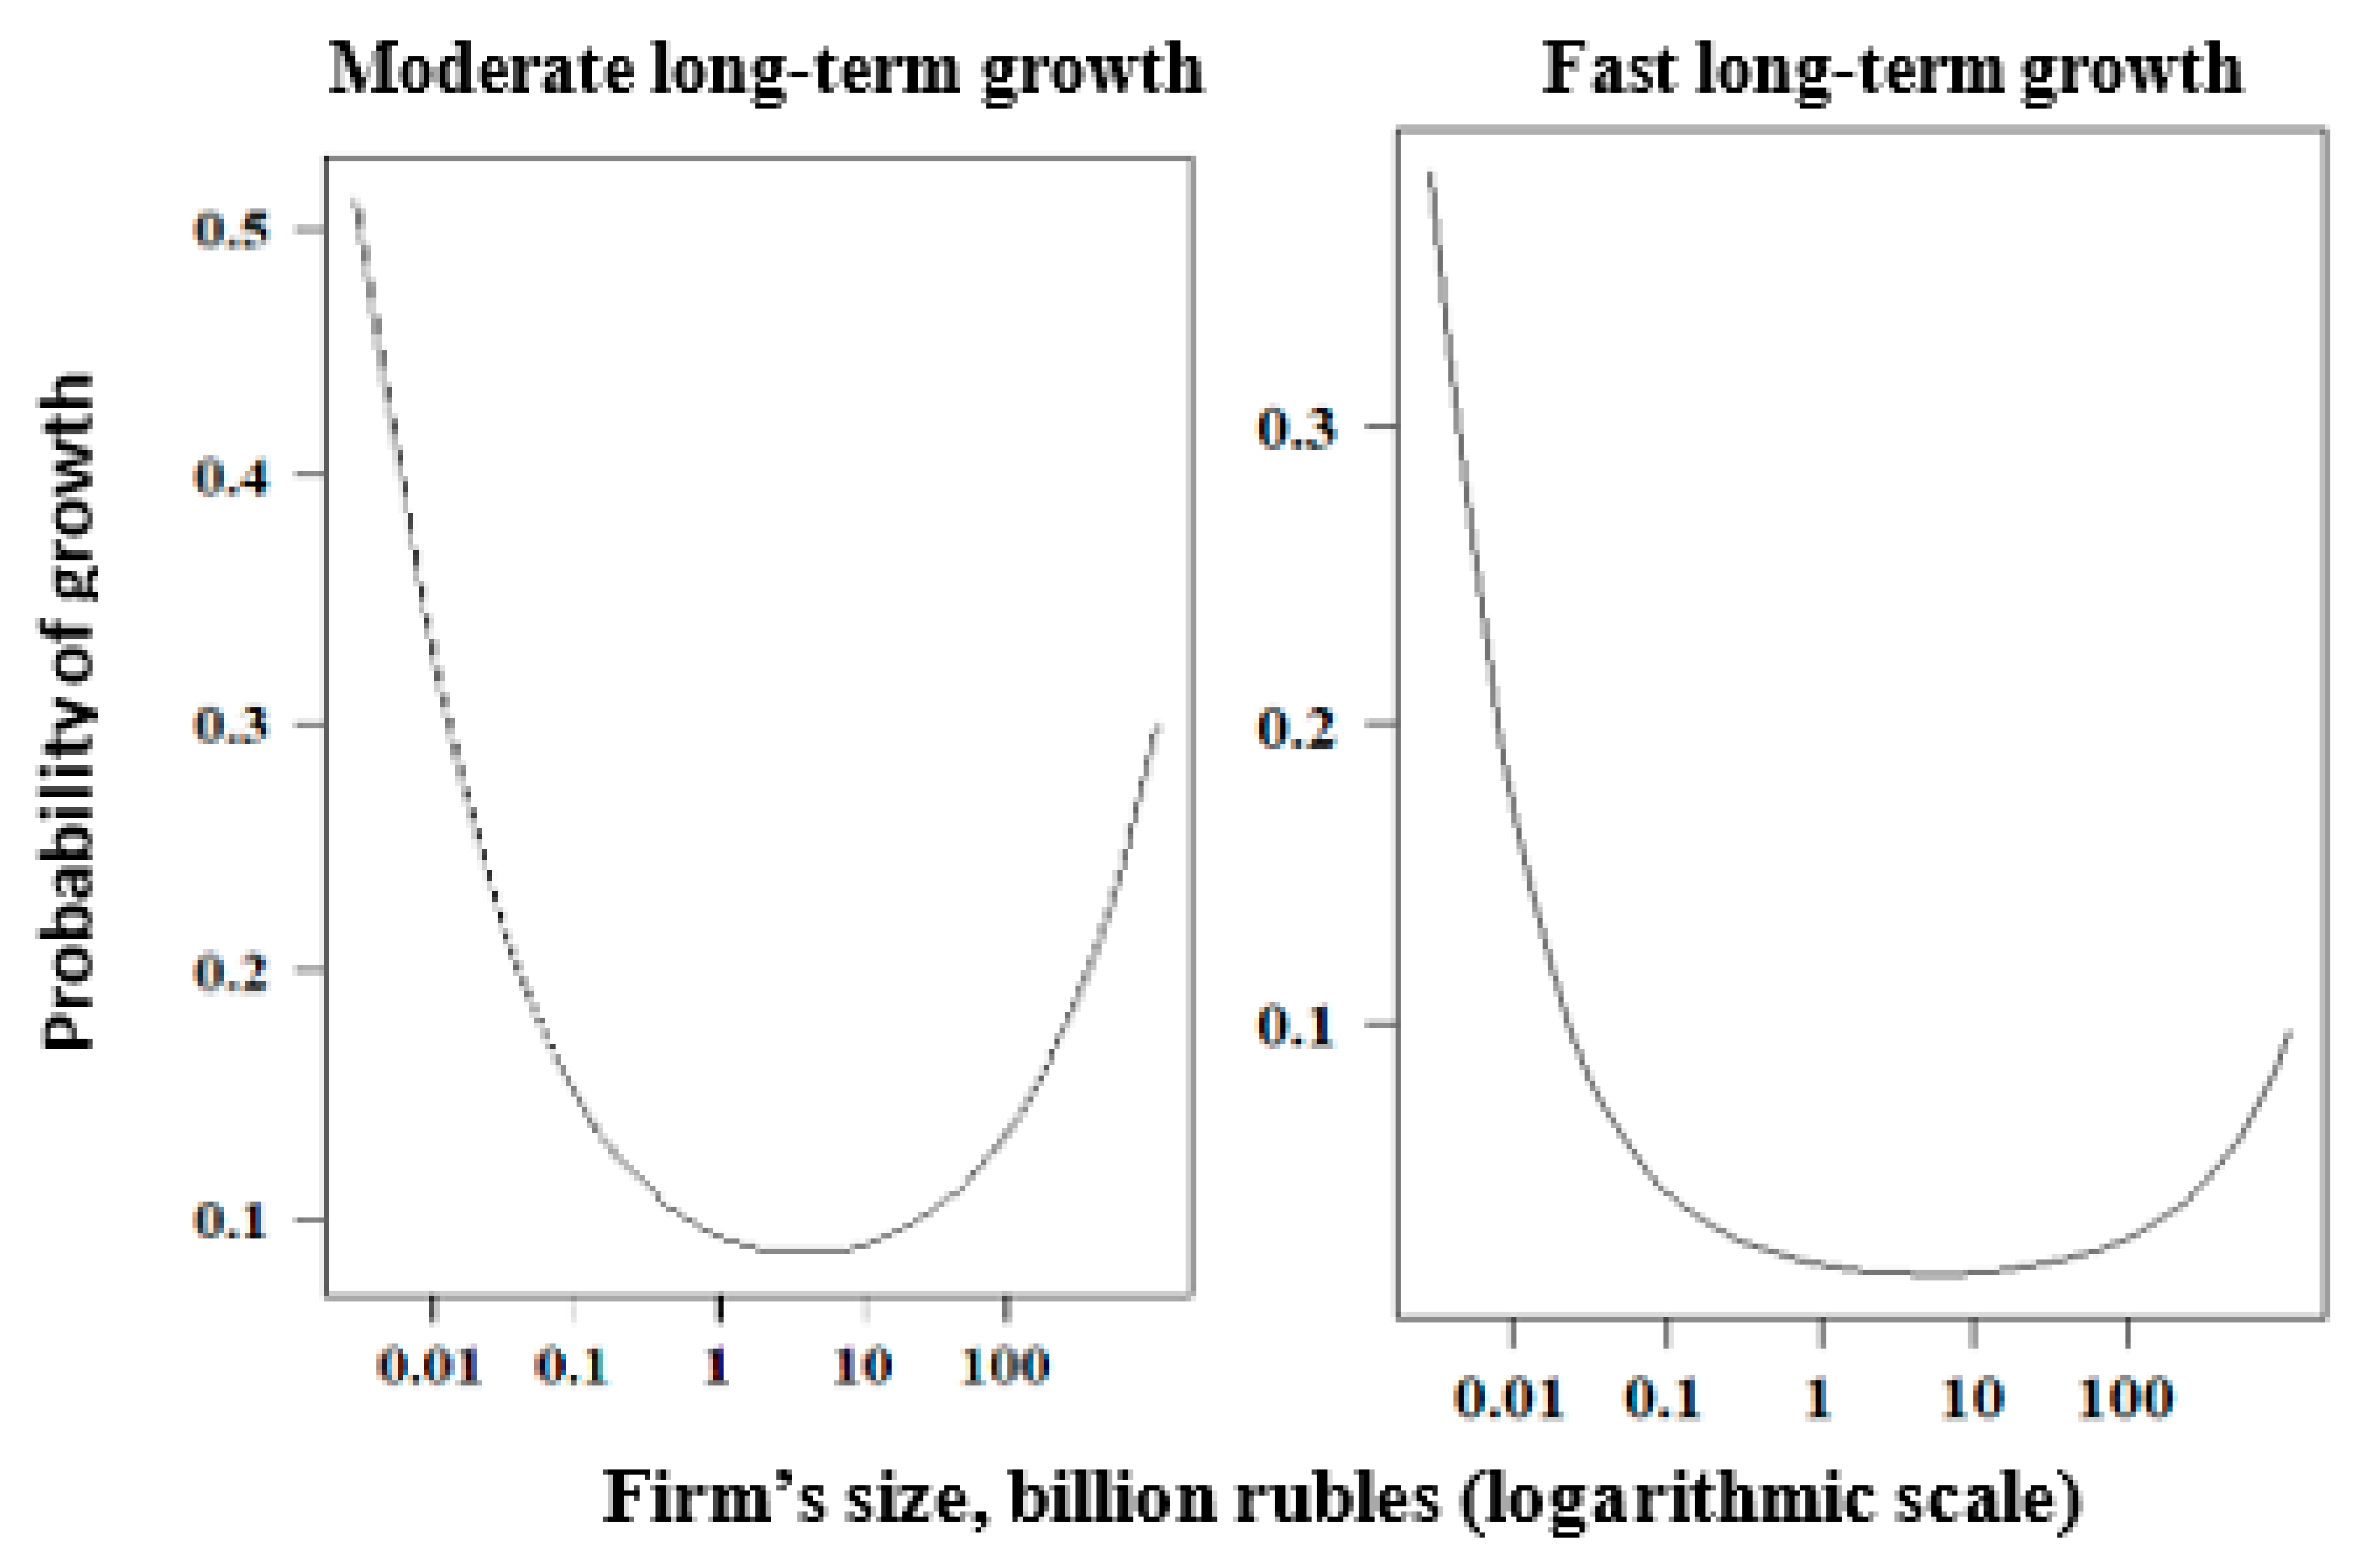
3.2. Firm Size and Restarting Growth

The impact of firm size on the resumption of growth is a contentious topic in global research, particularly in the context of young, fast-growing firms. Numerous studies have posited that smaller companies are more likely to achieve higher growth rates (Grover Goswami et al. 2019; Hall 1986). Conversely, other research either does not identify a distinct advantage for smaller firms (Haltiwanger et al. 2013) or suggests a non-linear relationship between firm size and growth (Spitsin et al. 2023b). When analyzed through the lens of organizational life cycle theory, the influence of firm size becomes increasingly complex. Small firms may possess an advantage due to their agility in strategic learning (Sirén et al. 2017). Yet, the relationship between organizational size and adaptability is bifurcated by two contrasting dynamics: larger organizations might exhibit increased adaptability due to their slack resources, diversified structures, and market dominance, but they also face potential rigidity from bureaucratic complexities (Haveman 1993).
In light of this theoretical ambiguity, we propose the following hypotheses, which we aim to empirically validate:
Hypothesis 2.1 (H2.1).
Smaller firms are more likely to achieve restarting growth following a period of stagnation.
Hypothesis 2.2 (H2.2).
There exists a non-linear relationship between firm size and the likelihood of transitioning to growth, characterized by a U-shaped dependency that favors both small and large firms.
The selection of growth factors for testing these hypotheses is inspired by the influential work of Delmar et al. (2003), which established a linkage between growth and factors such as firm age, size, and industry affiliation.

3.3. Decline in Sales during a Period of Stagnation and Restarting Growth

Typically, the variable of sales decline during a stagnation phase is not a focal point in analyses of fast-growing firms, as these firms are generally not expected to experience periods of recession. However, within the context of this study, examining sales decline during stagnation is highly pertinent. Empirical research frequently indicates a recovery in sales following a significant decline (Bloom et al. 2021; Foroni et al. 2020). Insights from the organizational life cycle theory further enhance our understanding of this factor. The first approach posits the redesign of business models, shifting focus from products to services and emphasizing alliances and collaboration. This strategy has proven notably effective for small and medium-sized enterprises, particularly during the COVID-19 pandemic. Researchers have observed that many firms successfully navigated challenges through strategic repositioning, which often involves developing a distinctive selling proposition coupled with innovation and network integration (Mayr et al. 2017). The second approach from the organizational life cycle theory emphasizes organizational changes prompted by past performance downturns (Zhou et al. 2006).
Based on these considerations, we propose the following hypothesis for empirical validation:
Hypothesis 3 (H3).
Firms that have experienced a more significant decline in sales during a period of stagnation are more likely to achieve restarting growth.

3.4. Investments in Fixed Assets and Restarting Growth

Investment in fixed assets is commonly associated with the growth of a firm (Bai et al. 2019; Chen and Ku 2000). However, for fast-growing companies, this relationship is not consistently observed (Croce et al. 2020). When considering restarting growth, two additional factors warrant consideration. Firstly, one perspective suggests that growth cycles in a firm can be facilitated through the reinvestment of retained earnings. According to this view, restarting growth is often a result of altering reinvestment strategies. The response of revenue to such investment may be delayed, as reinvestment decisions are nuanced and dependent on internal policy considerations (Pokorná 2020; Yashin et al. 2016). Secondly, many companies, after enduring prolonged stagnation or declining sales, may face financial challenges. Investments in fixed capital can further impact a company’s liquidity and financial stability negatively. Financial constraints, particularly high leverage, can limit a firm’s investment opportunities (Oliveira and Fortunato 2006; Vo 2019). Therefore, while investments are drivers of firm growth, in the context of restarting growth, there are several influencing factors to consider.
Based on these insights, we propose the following hypothesis for empirical validation:
Hypothesis 4 (H4).
Firms that invest more intensively in fixed assets during a period of stagnation are more likely to achieve restarting growth.
This hypothesis, along with others, is evaluated using a dataset of Russian firms. The analysis considers two distinct trajectories: moderate long-term post-stagnation growth and rapid long-term post-stagnation growth.

4. Methodological Framework

4.1. Data and Sample

Data pertaining to sales, financial indicators, and the age of firms are obtained from the SPARK system (Spark Information System 2023). The initial dataset encompassed 10,909 companies, specifically selected from the mining and manufacturing sectors, as well as certain high-tech service industries, to ensure a comprehensive representation of key sectors in the economy. The inclusion of the manufacturing industry is crucial, given its significance to the economy of any country. The mining sector, particularly pivotal in the Russian economy, was selected to provide specific insights relevant to the country under study. The inclusion of the high-tech sector in the sample enables an examination of potential differences between high-tech industries and other sectors. To facilitate this analysis, a corresponding dummy variable is integrated into the regression models. Furthermore, it is noteworthy that other industries are underrepresented in the SPARK database, precluding the formation of large enterprise samples for these sectors.
To ensure a precise evaluation of financial indicators, revenue and other absolute financial metrics are adjusted for inflation to reflect their 2012 values. This adjustment was crucial for an accurate longitudinal analysis. In the subsequent stage, sales dynamics from 2012 to 2017 were scrutinized to identify firms exhibiting prolonged stagnation or production decline. This is defined as companies demonstrating negative sales growth over three consecutive years. To encompass a broader spectrum, we categorized firms into three groups based on periods of stagnation: 2013–2015, 2014–2016, and 2015–2017. These groups were then amalgamated into a single sample, significantly augmenting the sample size, and enhancing the robustness of the analysis.
To maintain the integrity of the data, firms with incomplete information are excluded from the sample. This exclusion is particularly notable for companies’ lacking data on investments in fixed assets. The final analytical sample consists of 1883 firms, each exhibiting signs of stagnation or production decline, which represented 17.3% of the original dataset of 10,909 firms. This methodological rigor ensures that the sample is both representative and that the findings are based on comprehensive and reliable data.
The period designated for detecting restarting growth, spanning 2016 to 2021, coincides with the COVID-19 pandemic, a significant disruptor of the Russian economy in 2020 (Aganbegyan 2022). Consequently, the criteria are adjusted to require evidence of growth in three out of the four years following the stagnation period, to accommodate the pandemic’s impact.
In the identification of traditional fast-growing companies, scholars typically employ three approaches: the Absolute approach (Birch 1981; OECD 2008), the Relative approach (Haltiwanger et al. 2016), and an approach based on firms’ growth distribution (Halvarsson 2013b). Our study utilizes the Absolute approach, which generally identifies high growth as an annual sales growth rate exceeding 20%. However, we moderate these criteria to reflect the economic disturbances of 2020 due to the COVID-19 pandemic. Drawing upon the criteria and growth types outlined by Spitsin et al. (2023a, 2023b), our investigation encompasses two types of post-stagnation growth:
  • Moderate long-term growth: This category includes firms achieving an annual sales growth rate above 10% for at least three out of four post-stagnation years, with total sales growth over these four years surpassing 30%.
  • Fast long-term growth: This category encompasses firms achieving an annual sales growth rate above 20% for at least three out of four post-stagnation years, with total sales growth over these four years exceeding 60%.
In our analysis, we assess whether the firms meet the established growth criteria over a four-year period following stagnation. These periods are specifically 2016–2019, 2017–2020, and 2018–2021. Firms that satisfy the growth criteria are assigned a dependent variable value of 1, whereas those that do not meet the criteria are assigned a value of 0. This binary classification is critical for the analysis (as detailed in the methodology section). Within the initial sample, the identified growth types were observed in 268 and 87 firms, respectively. This translates to 14% and 5% of the firms analyzed, providing a quantitative perspective on the prevalence of these growth types in the sample.

4.2. Models and Variables

4.2.1. Dependent Variables

Our study employs two binary variables to encapsulate the two distinct types of growth identified: moderate long-term growth (MLTG) and fast long-term growth (FLTG). This approach aligns with methodologies utilized in prior research in this field (Coad and Srhoj 2019; Chae 2023; Heimonen and Virtanen 2012; Megaravalli 2017). The criteria for categorizing firms into each growth type have been delineated earlier in the study. For analytical purposes, these variables are coded as follows: a value of 1 is assigned to a firm that demonstrates the respective type of growth, whereas a value of 0 is assigned if a firm does not meet the established criteria for that specific growth category. This binary classification facilitates a clear and structured analysis of the growth patterns within the sample.

4.2.2. Independent Variables

In accordance with the hypotheses formulated earlier, this study assesses four independent variables:
  • Firm’s Age (Age): This variable is measured as the number of years elapsed from the company’s inception to the current date, as recorded in the SPARK database.
  • Firm’s Size (Size): Firm size is operationalized using the natural logarithm of the firm’s total assets. To ensure temporal consistency in value terms, adjustments are applied based on the inflation index. This method of quantifying firm size aligns with the approaches adopted in previous studies (Bon and Hartoko 2022; Dang et al. 2018).
  • Sales Dynamics in the Last Year of Stagnation (Sales Dynamics): This metric is computed as the percentage change in sales. It is determined by the ratio of the difference in sales between year t (the final year of stagnation) and year t − 1 to the sales in year t − 1 and then multiplied by 100%. This measure aims to capture the sales momentum or contraction as the firm transitions out of the stagnation phase.
  • Intensity of Investment in Fixed Capital (Investment): We calculate this variable as the ratio of investment in fixed capital in the final year of the stagnation period to the value of the firm’s total assets, subsequently multiplied by 100%. This metric is designed to assess the firm’s investment activities relative to its asset base during the stagnation period.

4.2.3. Control Variables

In alignment with established methodologies for econometric analysis, our regression models include several control variables. These variables are integral to mitigating the potential impact of extraneous factors on the dependent variable and accommodating alternative explanations:
  • Leverage (Share of Borrowed Capital): Defined as the ratio of borrowed capital to total assets, multiplied by 100%. Leverage can aid in business modernization and expansion, potentially leading to growth following a period of stagnation (Arellano et al. 2012; Lin 2015; Baule 2018; Spitsin et al. 2020a).
  • Net Return on Assets (ROA): Calculated as the ratio of net profit to total assets, multiplied by 100%. While a high ROA can generate internal funds for business development, it may also act as a disincentive for change (Coad and Srhoj 2019; Mansikkamäki 2023).
  • Asset Turnover (Turnover): This metric is determined by the ratio of sales to total assets, multiplied by 100%. A reduction in turnover is typically observed during stagnation phases, indicating potential for operational efficiency improvements (Spitsin et al. 2021).
  • Firms with State Participation (Firms with State): This variable accounts for the influence of state involvement in corporate activities in Russia, particularly during crises when the state may provide support. A dummy variable is used to control this factor’s impact on restarting growth.
  • Industry Effects (Mining and HighTech): To account for industry-specific dynamics, two dummy variables are introduced for the mining industry and high-tech sector, respectively. These variables take the value of 1 for firms within these industries, reflecting expectations of differing restarting growth intensities across sectors (Ostapenko et al. 2022).
  • External Conditions (GDP Growth): To control for the broader economic environment, a variable reflecting the total GDP dynamics over the four years corresponding to firms’ restarting growth is included. This variable captures the economic conditions of the country’s development (Athari et al. 2023).
The independent and control variables, excluding the dependent variables, are calculated using data from the third year of the identified stagnation period for each firm. This approach ensures consistency in the dataset and aligns with the study’s focus on the dynamics of restarting growth. To provide a comprehensive overview of the data, descriptive statistics and correlations between these variables are systematically presented in Table 2. This table offers valuable insights into the relationships and trends within the dataset, thereby facilitating a deeper understanding of the underlying patterns and interdependencies among the variables.
The observation, as per Table 1, that correlation coefficients are well below the threshold of 0.70 suggests that multicollinearity is unlikely to be a concern in our logistic regression models. This allows for the simultaneous inclusion of variables without the risk of inflated variances due to high intercorrelations. To further ensure the robustness of our analysis, additional calculations were conducted to assess the potential impact of multicollinearity on the regression results. A common benchmark in statistical analysis is that multicollinearity is considered a risk if the variance inflation factor (VIF) exceeds 10. Our calculations indicate that the average VIF for the variables is 1.15, which is significantly below this threshold. Notably, the highest VIF value is observed for the ‘Size’ variable. However, even in this case, the VIF is only 1.45, far below the threshold of concern, thereby mitigating any statistical worries about multicollinearity. This additional analysis confirms that all variables can be confidently used in the regression models without concerns of multicollinearity.
Given the binary nature of the dependent variable in our study, logistic regression is indeed the appropriate statistical method for analysis. The general form of the logistic regression model, as delineated by Hosmer et al. (2013), is presented as follows:
ln ( P 1 P ) = β 0 + β 1 X 1 + β 2 X 2 + + β n X n
P = 1 1 + e β 0 + β 1 X 1 + β 2 X 2 + + β n X n
where ln denotes the natural logarithm, p represents the probability of the event of interest, P 1 P is the odds ratio of the dependent event occurring, β0 is the intercept of the model, and β1, β2, …, βk are the coefficients for each independent variable X1, X2, …, Xn in the model. The logistic regression model is used to estimate the probability that a given outcome will occur.
To appraise the efficacy of the logistic regression models constructed in our study, several statistical measures are utilized, each offering unique insights into the models’ performance: (a) Nagelkerke pseudo-R2: This is a modification of the Cox and Snell R2 that adjusts the scale of the statistic to cover the full range from 0 to 1, making it more interpretable as a measure of model fit. It is a measure of the proportion of variance explained by the model (Nagelkerke 1991). (b) Likelihood Ratio Test (LR χ2): This is a statistical test used to compare the goodness of fit of two models, typically a more complex model against a simpler one. It is based on the difference in the log-likelihoods of the two models, with the test statistic following a chi-square distribution under the null hypothesis (Hosmer et al. 2013). (c) Area Under the Receiver Operating Characteristic (ROC) Curve (AUC): The AUC is a performance measurement for classification problems at various threshold settings. The ROC is a probability curve, and the AUC represents the degree or measure of separability. It tells how much the model is capable of distinguishing between classes. The higher the AUC, the better the model is at predicting 0s as 0s and 1s as 1s.
For each of the two types of restarting growth (MLTG and FLTG), we build two logistic regression models:
A model that includes only control variables (Model 1). Based on Table 2, the logistic regression model expression for Model 1 can indeed be expressed as
ln P 1 P = β 0 + β 1 Leverage + β 2 ROA + β 3 Turnover + β 4 HighTech + β 5 Mining + β 6 Firms   with   state + β 7 GDP   growth
and for the probability,
P = 1 1 + e β 0 + β 1 Leverage + β 2 ROA + β 3 Turnover + β 4 HighTech + β 5 Mining + β 6 Firms   with   state + β 7 GDPgrowth
where P is the probability of the event of interest (e.g., a firm exhibiting either moderate long-term growth or fast long-term growth), β0 is the intercept, and β1, β2, … β7 are the coefficients for the variables Leverage, ROA, … GDP growth, respectively. The e represents the base of the natural logarithm. Equation (3) calculates the log-odds of the event occurring, which is then transformed into a probability through the logistic function in Equation (4).
  • The logistic regression model employed in our study, referred to as Model 2, incorporates a comprehensive set of variables. This includes control variables, independent variables, and notably, a squared term for the variable ‘Size’ (Size2). The inclusion of Size2 is particularly significant as it allows for the testing of the non-linear relationship hypothesis concerning firm size and its impact on restarting growth, as described earlier in the study. This model formulation aligns with the methodological framework established for testing the hypotheses and ensures a robust and nuanced analysis of the factors influencing firm growth dynamics.
Following the structure provided for Model 1, the expressions for Model 2 are constructed similarly, incorporating the corresponding variables:
ln P 1 P = β 0 + β 1 Leverage + β 2 ROA + β 3 Turnover + β 4 HighTech + β 5 Mining + β 6 Firms   with   state + β 7 GDP   growth + β 8 Age + β 9 Size + β 10 Size 2 + β 11 Sales   Dynamics + β 12 Investment
To mitigate the potential bias in regression coefficients due to multicollinearity, a standardization process for the control and independent variables is implemented, as advocated by Marquardt (1980). This standardization involves adjusting each variable by subtracting its mean and then dividing it by its standard deviation. Consequently, each standardized variable attains a mean of 0 and a standard deviation of 1, ensuring uniformity in the scale of the variables. Such standardization is crucial for enhancing the accuracy and interpretability of the logistic regression models. The logistic regression analyses are separately conducted for each type of growth identified in the study: moderate long-term growth (MLTG) and fast long-term growth (FLTG). These analyses are carried out using the R statistical software, renowned for its robust capabilities in executing logistic regression analyses. R also offers a comprehensive suite of diagnostic and visualization tools, which are instrumental in assessing the quality and validity of the models. Employing these tools ensures that the models are reliable, and the findings are grounded in a rigorous statistical examination.
Our study employs analysis of variance (ANOVA) to discern differences among various groups of firms, namely those with MLTG compared to other firms, firms with FLTG versus other firms, and the comparison between MLTG and FLTG, among others. The analysis of variance utilizes specialized tests to pinpoint distinctions between groups of observations, categorized into parametric tests and non-parametric tests. Parametric tests are applied under two conditions: when observation groups are substantial in size and when the normal distribution law of the output variable is satisfied. In cases where these conditions are not met, the preference is for nonparametric tests.
Given the outcomes of sample verification, which revealed highly significant differences from the normal distribution (χ2 test), the study employs boxplots and nonparametric tests such as Mann–Whitney and Wilcoxon to identify variations between groups of firms, similar to the approach adopted in the studies by Zekić-Sušac et al. (2016) and Spitsin et al. (2023b). The analysis, utilizing Mann–Whitney and Wilcoxon tests, underscores highly significant differences (p < 0.001 ***) for both types of growth, MLTG and FLTG.

5. Empirical Results

The results of regression modeling are presented in Table 3.
In the analysis of MLTG and FLTG, we obtained notable results from two logistic regression models. Model 1, which incorporates only control variables, indicates that high leverage and low asset turnover are predictors of moderate post-stagnation growth. Similarly, high leverage and low Net Return on Assets (ROA) are indicative of fast post-stagnation growth. However, other control variables do not significantly predict these outcomes. Model 1 accounts for a modest portion of the variance in the dependent variable, as reflected by a low R2 value.
Model 2, which adds independent variables to the analysis, reveals more nuanced insights. The Age and Sales Dynamics variables exhibit a significant negative effect on restarting growth, favoring younger firms that experienced a substantial sales drop during stagnation. This finding aligns with Hypotheses 1 and 3. A U-shaped relationship between firm size and restart growth is identified, confirming Hypothesis 2.2. A weakly significant positive effect of Investment on restarting growth is also observed, supporting Hypothesis 4. However, Hypothesis 2.1 is not substantiated, as the evidence suggests a U-shaped dependence rather than a linear one. Overall, Model 2 demonstrates superior performance compared to Model 1, with a significant increase in R2, though it remains modest.
The validation of Hypothesis 3, indicating that firms with a more pronounced decline in sales during stagnation are more likely to restart growth, is particularly intriguing. This may suggest a ‘bounce-back’ effect, where firms that have contracted significantly are potentially more agile or radical in their strategic responses, thereby facilitating a stronger recovery. The inclusion of sales dynamics in the model thus offers critical insights for stakeholders and policymakers focused on promoting firm growth as a lever for economic development.
The relationship between Size, Size2, and the probability of MLTG is illustrated in Figure 1. To construct this visualization, we assume all other predictor variables, except for Size and Size2, are held at their mean values. As all predictor variables are standardized, their means are zero. Employing the logistic regression model (Model 2), we derive the following probability function for moderate long-term growth:
P = 1 1 + e 2.06 0.40 S i z e + 0.13 S i z e 2
The functional determination for FLTG mirrors the approach used for MLTG, similarly reflecting the non-linear relationship between firm size and the probability of growth post-stagnation. This methodology underscores the nuanced interplay between firm size and the likelihood of a firm achieving growth after a period of stagnation.
This summary succinctly encapsulates the statistical significance and implications of each variable within the logistic regression models, along with the confirmation or refutation of the formulated hypotheses. It also delineates the relationship between specific firm characteristics, such as age and size, and their propensity to achieve growth following a stagnation phase. The incorporation of a U-shaped relationship into the analysis provides a nuanced understanding of these dynamics.
The practical demonstration of this relationship is visually represented in Figure 1. This visualization serves as an invaluable tool in interpreting the results, offering a clear and accessible illustration of the U-shaped connection between firm size and the likelihood of restarting growth. Such visual aids are integral to conveying complex statistical relationships in a more digestible and informative manner, thereby enhancing the overall interpretability and utility of the study’s findings.
In the graphical representations shown in Figure 1, a distinct U-shaped relationship is observable between firm size and the probability of achieving growth post-stagnation. For both types of growth—moderate long-term growth (MLTG) and fast long-term growth (FLTG)—the probability of growth initially decreases as firm size increases from the smallest category. It reaches its lowest point at an intermediate firm size, then ascends again for the largest firms. This pattern suggests that both small and large firms are more likely to achieve growth post-stagnation compared to those of intermediate size. Notably, the graphs indicate a relative advantage for smaller firms, as they appear more likely to experience growth than larger firms.
The steeper U-shape observed for MLTG implies that firm size has a more pronounced impact on the probability of achieving this type of growth than on FLTG. Additionally, the peak probabilities of growth differ between the two types, with a higher peak observed for moderate growth compared to fast growth. This disparity may signify that while firm size is a crucial factor in determining the likelihood of achieving growth post-stagnation, other variables not represented in these graphs could also have a substantial influence, particularly on the likelihood of achieving fast long-term growth. Such insights underscore the complexity of factors influencing firm growth trajectories and highlight the importance of considering a range of variables in understanding post-stagnation growth dynamics.

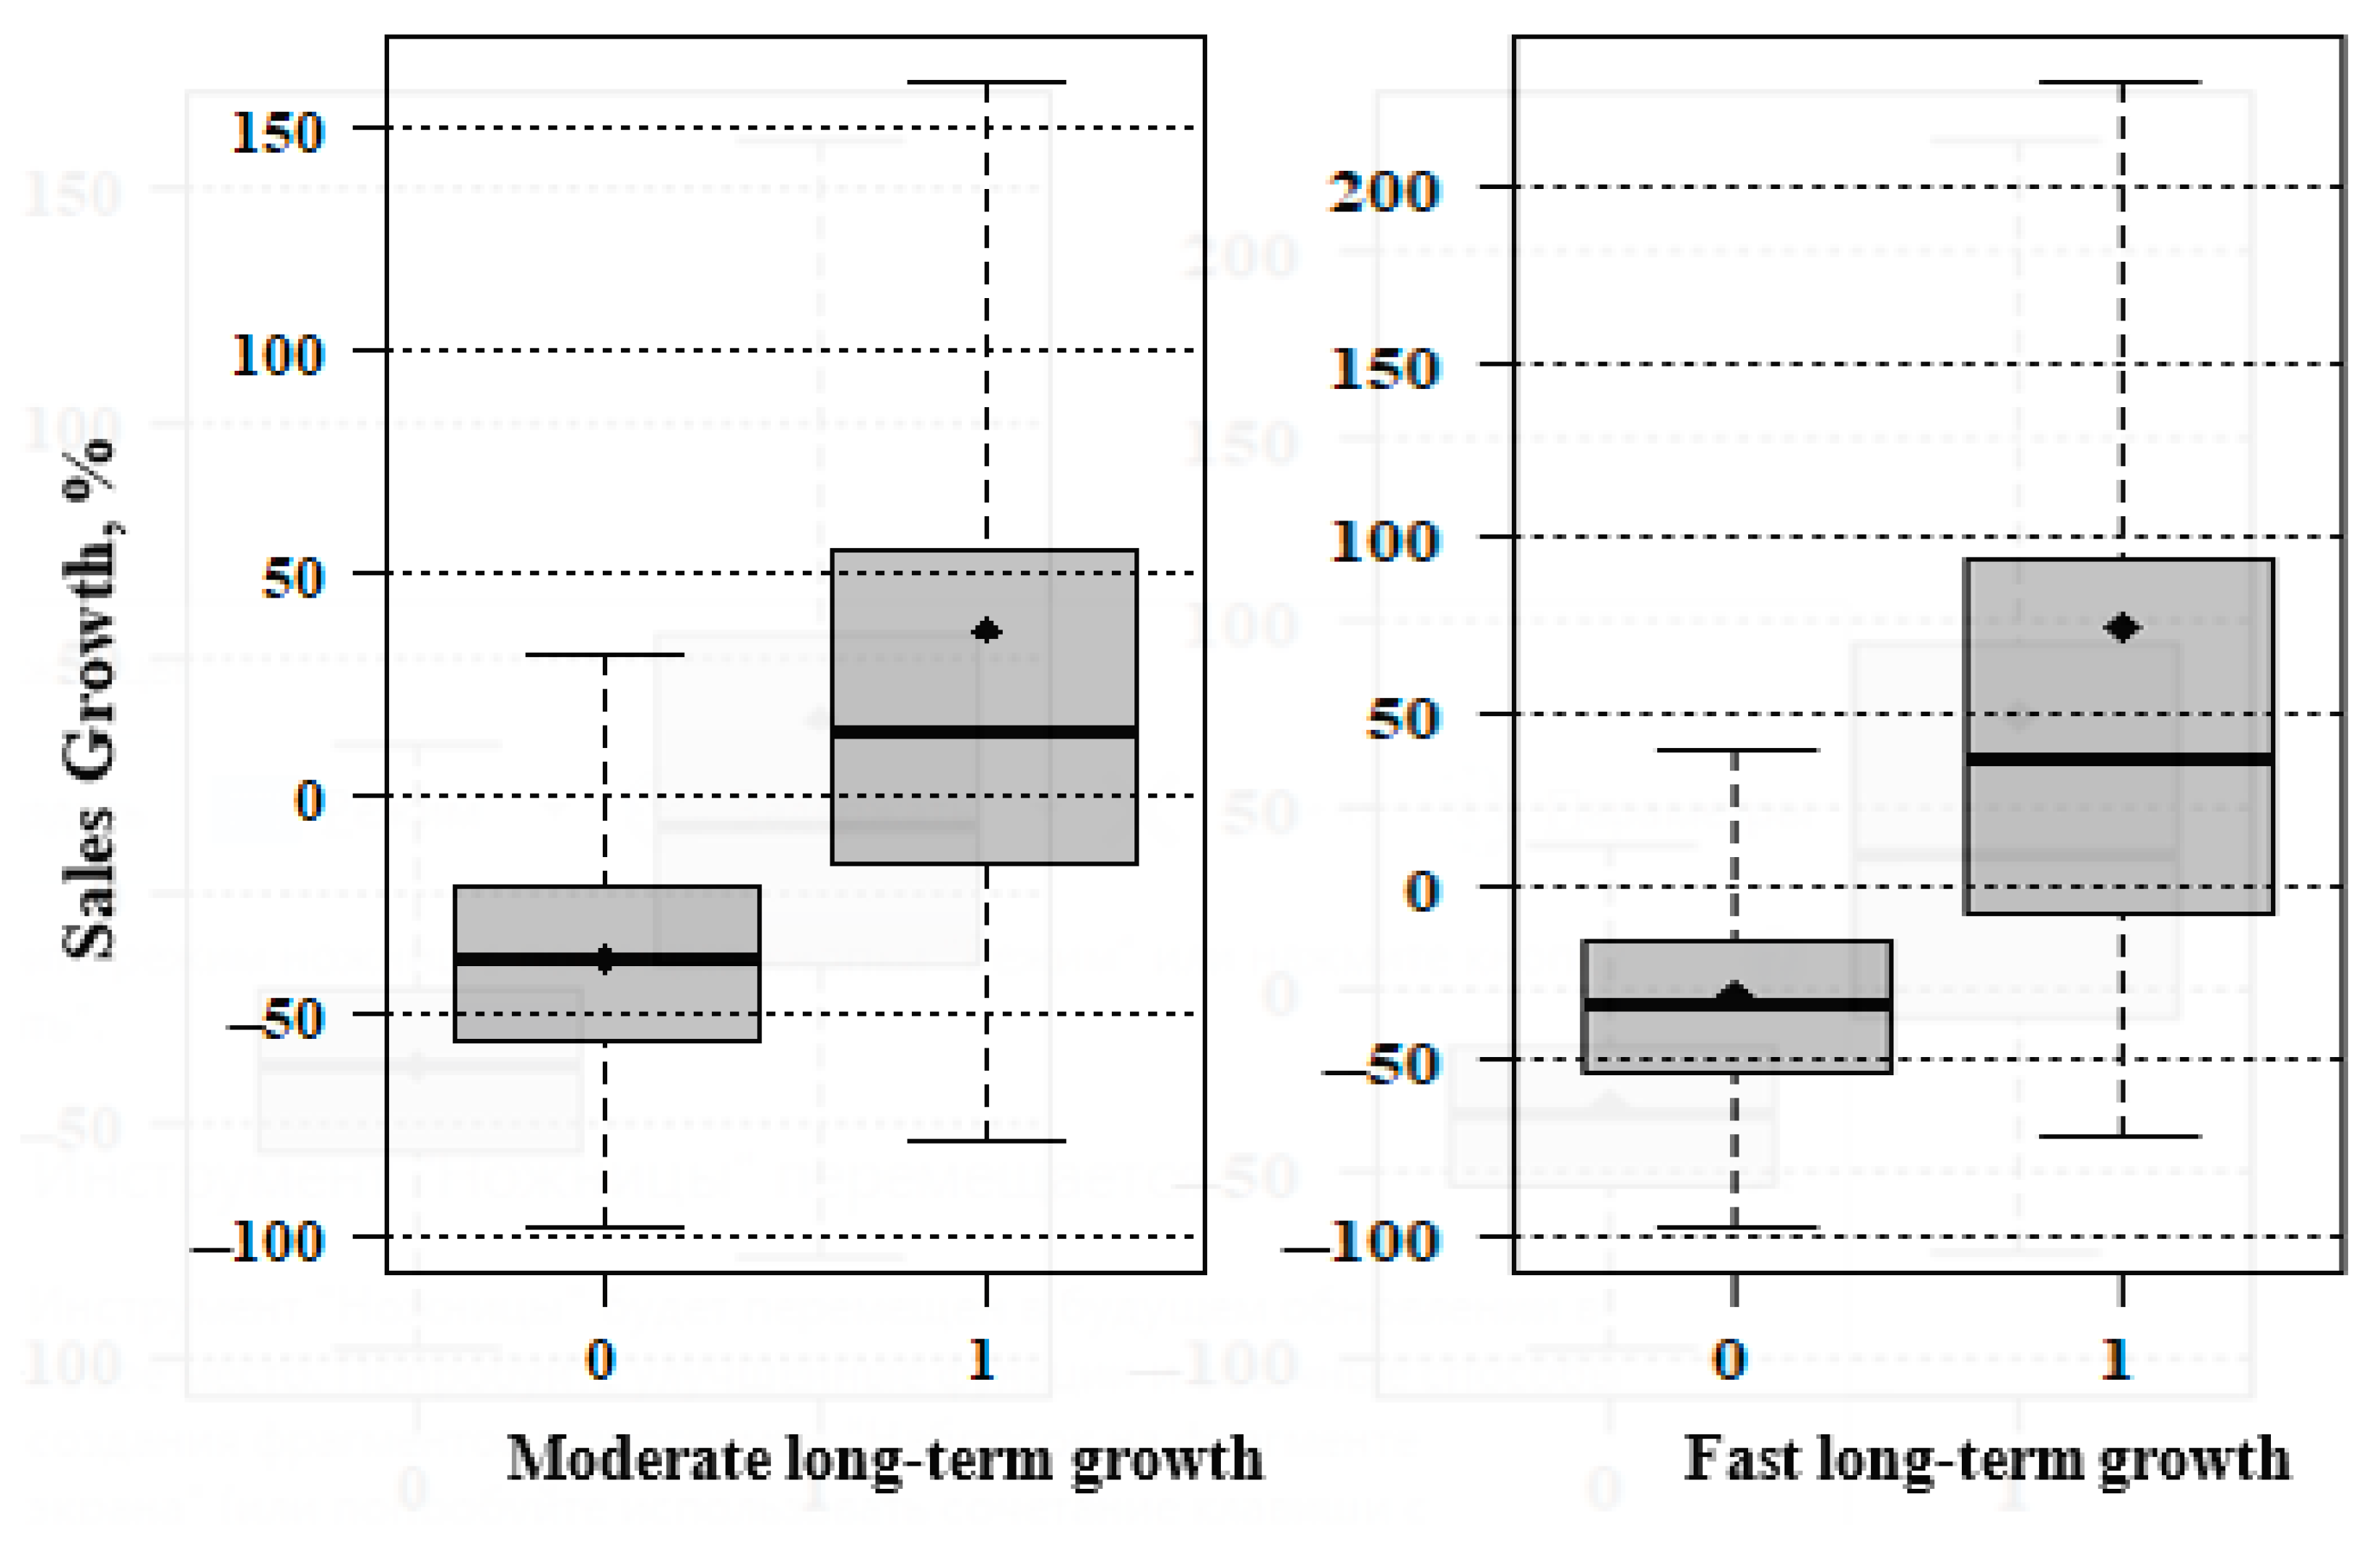
6. Ad Hoc Analysis: Comprehensive Sales Dynamics throughout Stagnation and Subsequent Restarting Growth

With the validation of Hypothesis No. 3, demonstrating that a significant decline in sales during a period of stagnation augments the probability of subsequent growth, it becomes essential to conduct a more comprehensive assessment of firm growth over an extended temporal span. A critical aspect of this analysis is to discern how firms’ sales trajectories have evolved throughout the entire cycle, including both the stagnation and resurgence phases. This comprehensive understanding is vital for evaluating the feasibility of restarting growth as a strategy for economic development, particularly from a macroeconomic standpoint.
To delve into this question, our study broadens the scope of the analysis. We calculate the overall sales growth for each firm across a seven-year period, which encompasses the three-year phase of stagnation followed by the four-year period during which signs of growth resurgence are observed. This extended analysis aims to provide a holistic view of the firms’ performance, accounting for both the downturn and recovery phases. The formula for calculating the overall sales growth is as follows:
S a l e s   G r o w t h = ( S a l e s 7 S a l e s 0 ) / S a l e s 0 100 %
In our analysis, ‘Sales7’ represents the sales figure in the final year of the period under review, while ‘Sales0’ denotes the sales at the onset of the stagnation period. This formula calculates the percentage change in sales across the entire seven-year timeframe. To ensure accuracy and consistency, all sales figures have been adjusted in accordance with the cumulative inflation index. This adjustment is critical for providing a reliable comparison over time.
Figure 2 in our study presents boxplots that visually depict the distribution of sales growth over the complete study period. These boxplots differentiate between two distinct groups: firms that achieved growth following the stagnation period (group 1) and those that did not (group 0). To facilitate a comparative analysis of sales growth between these groups, an ANOVA is conducted. The boxplots serve as an effective tool for visually comparing the central tendencies and dispersions of sales growth in each group. Additionally, statistical testing is employed to determine any significant differences in sales growth between the groups. This combination of visual and statistical analysis provides a comprehensive view of the sales growth patterns, enabling a deeper understanding of the impact of post-stagnation growth on the firms’ overall performance.
In these boxplots, various essential statistical measures are visually represented. The central point inside the box denotes the mean value of sales growth, while the line within the box indicates the median value. The box itself displays the interquartile range (IQR), representing the middle 50% of the data (from the 25th to the 75th percentile). The whiskers extend to 1.5 times the IQR from the box, illustrating the data range while excluding outliers.
For the group that exhibits post-stagnation growth (group 1), the sales growth statistics are as follows: For moderate long-term growth, the median sales growth is 13.51%, and the mean sales growth is 36.94%. For fast long-term growth, the median sales growth is 36.03%, and the mean sales growth is 74.16%.
According to the Mann–Whitney and Wilcoxon tests, there are highly significant differences (p < 0.001 ***) for both types of growth (MLTG and FLTG):
Sales Growth in group 1 is significantly higher than in group 0.
Sales Growth in group 1 is significantly higher than zero Sales Growth.
Sales Growth in group 0 is significantly lower than zero Sales Growth.
Furthermore, Sales Growth for fast long-term growth is significantly higher than for moderate long-term growth within group 1 (p = 0.03 *). These findings demonstrate that sales growth is significantly greater than zero for the entire period for firms that show post-stagnation growth, in both moderate and fast growth scenarios. This supports the viability of restarting growth as an economic development strategy, as firms that manage to restart growth after stagnation indeed show significant increases in sales over time.

7. Robustness Check

To assess the robustness of the results, an additional regression model is constructed for Model 2, incorporating robust correction to account for potential heteroscedasticity in the data. The outcomes of the robustness test are presented in Table 4.
Our calculations reaffirm the stability of the obtained results. In the models with robust correction, all independent variables (Age, Size, Size2, Sales dynamics, Investment) remain significant. Additionally, the variable Investment becomes significant (instead of weakly significant) in Model 2 for FLTG. The models with robust correction validate the fulfillment of Hypotheses 1, 2.2, 3, and 4 for both MLTG and FLTG.

8. Discussion

8.1. Theoretical Contribution

The novelty of this study lies in its focus on a relatively unexplored category: the restarting growth of firms after stagnation, which is especially pertinent amidst recent unstable economic developments. This paper examines two types of post-stagnation growth—moderate long-term and fast long-term—and compares the findings with those of researchers studying rapidly growing firms, such as gazelles and scale-ups, as well as theories within the organizational life cycle framework (Arellano et al. 2012; Baranova 2019; Grover Goswami et al. 2019; Lin 2015; Greiner 1997; Barrett 2013; Jørgensen and Pedersen 2018; Johnson et al. 2008; Andries et al. 2013).
Our analysis reveals that firms demonstrating restarting growth tend to be younger, aligning with literature on fast-growing firms which predominantly shows a young firm advantage (Anyadike-Danes et al. 2009; Daunfeldt et al. 2015; Grover Goswami et al. 2019; Haltiwanger et al. 2016). However, our study considers firms that are at least three years old at the inception of growth, suggesting a more moderate influence of age on the likelihood of restarting growth. This finding is consistent with the organizational life cycle theory, where younger firms are posited to have greater agility in implementing strategic learning and organizational change (Sirén et al. 2017).
The impact of firm size on long-term growth is contested. While many studies identify high-growth firms (HGFs) as primarily small (Grover Goswami et al. 2019; Hall 1986), others do not support this view (Haltiwanger et al. 2013). Our research indicates a significant non-linear U-shaped effect of firm size on growth following stagnation, challenging the assumption of Gibrat’s Law that growth rates are independent of firm size (Gibrat 1931). Similar U-shaped correlations between firm size and growth have been observed in other studies (Bentzen et al. 2012; Cabral 1995; Park and Jang 2010). Our findings are particularly relevant for the Russian economy, known for its high level of monopolization and the significant influence of large businesses on various economic indicators (Henderson and Moe 2016; Kirkham 2016; Kudrin and Gurvich 2015). Here, the success of large firms is crucial for economic growth, and their stagnation has wider economic and social repercussions. Our results also align with the notion that organizational size influences change, with large firms being more adaptable due to resource slack but potentially more rigid due to bureaucracy (Haveman 1993).
Moreover, the paper finds that firms with a larger drop in sales during the last year of stagnation have a higher likelihood of restarting growth. This factor, often overlooked in studies of high-growth firms, is highly significant in our context. The concept of recovery following a downturn (Bloom et al. 2021; Foroni et al. 2020) is well recognized, but our findings suggest that firms that recover post-stagnation can significantly increase their sales over the entire period under review. These outcomes align with two approaches within the organizational life cycle theory: the redesign of business models with a focus on services, alliances, and collaboration (Mayr et al. 2017) and organizational changes stimulated by past performance declines (Zhou et al. 2006).
The study also finds that intensive investment in fixed assets is driving restart growth. This result is consistent with the works of (Bai et al. 2019; Chen and Ku 2000). It also corresponds to one of the approaches within the organizational life cycle theory. This approach explains repeated cycles of firm growth through reinvestment of retained earnings. Revenue response to investment may be delayed with reinvestment being a nuanced internal policy decision (Pokorná 2020; Yashin et al. 2016). In our case, investments take place in the third year of stagnation, and then, within 1-2 years, sales growth begins; that is, the delay is 1–2 years.
Moreover, we tested the influence of a number of factors that take into account the specifics of the Russian economy. We did not find any advantages for firms with state participation, as well as for firms in the extractive industries. Many scholars have documented the benefits of the high-tech sector in times of crisis (Evans and Garnsey 2009; Decker et al. 2016; Haltiwanger et al. 2014; Spitsin et al. 2023a). We have not identified any advantages for the entire high-tech sector. However, our additional calculations showed the advantages of certain high-tech industries (pharmaceutical industry). Enterprises in this industry have benefited from the rise in the dollar (which has led to a decrease in competition with foreign drugs) and COVID-19. If the dummy variable ‘High-tech sector’ is replaced by ‘Pharmaceutical industry’, then it will have a significantly positive effect on restarting growth. Thus, the paper will not find advantages at the level of large sectors of the economy, but firms in certain industries may be more likely to restart growth.
The study revealed some differences between the growth types (MLTG and FLTG). In particular, firm age has a stronger effect on MLTG. The situation is similar with the size of the company (according to the plotted graph). In contrast, investment activity is more pronounced in firms with FLTG, which is confirmed by models with operational adjustment of standard errors. Moreover, the total Sales Growth for the entire period (including stagnation and growth) is significantly higher for companies with FLTG. Such firms produce a greater effect on the economy.
Our study supports the notion that restarting growth constitutes a viable strategy for firm development, indicating that firms capable of such growth contribute significantly to economic development. Summarizing the discussion, Figure 3 depicts the interplay between theoretical approaches to restarting growth within the context of organizational life cycle theory and the empirical factors identified in this study as instrumental to the restarting of firm growth. This visualization serves as a bridge between theory and practice, illustrating how theoretical constructs find reflection in observed firm behaviors and outcomes.
The focus of our research is Russian enterprises, which raises the pertinent question: Are the results obtained applicable to the economies of other countries? We posit that our findings regarding the benefits of young, small, and investment-intensive firms hold relevance for other countries. Concurrently, the conclusion that highlights some advantages of large firms, as well as the pharmaceutical industry, primarily stems from the specificities of the Russian economy and may not find confirmation under different economic conditions.

8.2. Practical Implementation

From a macroeconomic perspective, this study elucidates two viable development approaches within an unstable economy: firstly, the traditional creation of new businesses and, secondly, an alternative strategy that identifies and fosters promising firms capable of transitioning from stagnation to growth. Notably, the proportion of firms experiencing rapid post-stagnation growth in this study compares to the ‘vital 6%’ of high-growth firms traditionally observed in the UK, as reported by the National Endowment for Science, Technology and the Arts (NESTA) (2009). Our findings also align with those of Coad and Srhoj (2019), where the prevalence of high-growth firms in a sample was found to be 5.22%. Despite a slight relaxation of the growth criteria to accommodate the economic impact of 2020 (COVID-19), the potential for existing firms to restart growth closely aligns with the emergence of new high-growth entities, substantiating both pathways as feasible in an unstable economic environment.
From a microeconomic and financial standpoint, this paper identifies factors that increase the likelihood of a firm achieving restarted growth. These insights offer investors criteria to pinpoint and support promising ventures. However, the challenge of identifying firms poised for post-stagnation growth remains as complex as the traditional search for fast-growing ‘gazelles’. The regression models constructed in this study yield a Pseudo R2 of approximately 10%, mirroring the results obtained in gazelle research (Coad and Srhoj 2019; Zekić-Sušac et al. 2016), yet still leaving room for improvement. Future research aims to expand the array of factors included in regression models to enhance the precision of predictions for promising firms.
This study demonstrates that investment activity plays a crucial role in fostering the restarted growth of firms. However, firms that have been stagnating for extended periods often encounter financial constraints that discourage investment, as noted by Oliveira and Fortunato (2006) and Vo (2019). Therefore, policymakers need to consider this reality, actively stimulating investment activity, enhancing the availability of financial resources, and controlling the levels of inflation and interest rates on loans. Moreover, this study draws attention to the specific challenges faced by medium-sized firms. Small firms often find it easier to restart growth due to their agility, and large corporations typically benefit from targeted government policies and incentives. However, medium-sized businesses frequently lack these tailored growth stimuli. Consequently, it is crucial for policymakers to recognize this gap and develop support measures specifically tailored to the needs of medium-sized firms experiencing stagnation.
Our findings suggest that younger firms, as well as those experiencing significant drops in sales during periods of stagnation, are more likely to transition to growth. This insight serves as a guide for investors and policymakers in identifying and supporting potential growth firms. There exists a need for targeted policies specifically aimed at aiding medium-sized firms, which encounter unique challenges in comparison to smaller and larger companies. By underscoring these key factors, the research contributes to the shaping of strategies for economic development and business support in unstable economic contexts.

9. Conclusions

Our study delves into the growth opportunities for firms that have experienced stagnation or declining sales, offering insights from two distinct perspectives. First, we examine the traditional realm of rapidly growing companies, often referred to as ‘gazelle firms’ or ‘scale-up firms’. Our analysis focuses on the factors contributing to their growth and seeks parallels with the resurgence of firms following stagnation or sales downturns. Second, we systematically organize approaches within the framework of organizational life cycle theory to elucidate the concept of restarting growth, formulating hypotheses concerning growth factors derived from these approaches.
We identify factors that increase the probability of a firm altering its trajectory from stagnation to growth, categorizing them into two distinct groups: moderate long-term growth and fast long-term growth. Notably, our study finds that firms established at a later stage and those experiencing a more substantial decline in sales during periods of stagnation are more likely to achieve growth. Intensive investment in fixed assets emerges as another key driver of restarting growth.
Additionally, both small and large firms exhibit a greater likelihood of recovering from stagnation and recession. A promising direction for further research involves segmenting the sample of enterprises into fast-growing small enterprises (‘mice’) and fast-growing very large enterprises (‘elephants’), as well as elucidating the causes and conditions of growth for these two heterogeneous groups of firms. We underscore the feasibility of two developmental approaches within an unstable economic landscape. The traditional method involves initiating new businesses, while the alternative approach focuses on identifying promising firms capable of resuming growth after stagnation. This study identifies highly significant factors and indicators that can assist investors in selecting promising firms for financing.
A noteworthy aspect of our study is the comparison of its results, derived from a novel focus on restarting or post-stagnation growth, with traditional studies of high-growth firms (HGFs). This analysis reveals comparability in terms of the share of growing firms in the sample and the accuracy of the constructed regression models. Moreover, the study elucidates the relationship between approaches explaining restarting growth within the framework of organizational life cycle theory and the factors identified for the restarting growth of firms.
The limitation in our study pertains to the relatively low Pseudo-R2, a characteristic shared with several prior studies discussed in this research, exemplified by Srhoj (2022), Coad and Srhoj (2019), and Megaravalli (2017), among others. To address this limitation, two potential strategies merit consideration, each offering distinct avenues for improvement.
The first approach involves the augmentation of the model through the inclusion of additional indicators. In our specific case, limitations arise from restricted access to data pertaining to the innovation and export activities of companies. The incorporation of these crucial indicators into the model holds the promise of enhancing the Pseudo-R2. By capturing the nuanced dimensions of innovation and export activities, the model could provide a more comprehensive understanding of the factors influencing restart growth, potentially leading to a higher explanatory power.
The second strategy involves the adoption of machine learning models designed to forecast companies capable of successfully transitioning to restart growth. Unlike traditional statistical models, machine learning algorithms have the capacity to discern complex patterns and interactions within the data. By leveraging machine learning, the model’s predictive capabilities may be enhanced, potentially resulting in a higher Pseudo-R2 and increased accuracy in predicting companies poised for restart growth.
These strategies not only hold the potential to elevate the explanatory power of the model but also offer a more nuanced and accurate understanding of the factors influencing companies’ capacity to embark on successful restart growth trajectories.
The distinctive economic, political, and cultural characteristics of Russia during this period, particularly under the influence of international sanctions and the complexities of post-communist economic transition, may not parallel the conditions in other global economies. Therefore, while the study offers valuable insights into the Russian context, the extrapolation of these findings to broader or different economic settings should be done with caution, considering the unique attributes of each market and period. This research highlights the crucial role of distinct economic and cultural environments, regulatory frameworks, and the dynamic nature of global economic trends in shaping business growth patterns. Because of these features, it underscores the necessity of adapting and contextualizing these insights to the specificities of different market conditions. However, while the findings are particularly pertinent to economies like Russia’s post-communist context, they also offer insights into global and Western economies. Our analysis identifies that younger, agile firms frequently spearhead innovation and growth in Western markets. Moreover, the study uncovers a U-shaped relationship between firm size and growth after periods of stagnation, suggesting that both small startups and large corporations are likely to see higher growth. This phenomenon mirrors trends in Western economies. Additionally, the universal principle of strategic adaptation and pivot during stagnation or decline is affirmed, underscoring its applicability across diverse economic landscapes.

Author Contributions

Conceptualization, V.S., D.B.V. and M.R.; methodology, V.S. and V.L.; software, V.S.; data curation, V.L.; writing—original draft preparation, V.S., D.B.V. and M.R.; writing—review and editing, V.S., D.B.V. and V.L.; visualization, V.L.; supervision, M.R.; project administration, V.S.; funding acquisition, V.S. All authors have read and agreed to the published version of the manuscript.

Funding

The study was supported by the Russian Science Foundation within the framework of the research project of the Russian Science Foundation “Changing the firm development trajectory: Investigating the drivers of entering the growth highway”, project No. 23-28-01404, https://rscf.ru/project/23-28-01404/, accessed on 6 October 2023.

Institutional Review Board Statement

Not applicable.

Informed Consent Statement

Not applicable.

Data Availability Statement

The data that support the findings of this study are available upon request from the corresponding author.

Conflicts of Interest

The authors declare no conflicts of interest.

References

  1. Acs, Zoltan J., and Pamela Mueller. 2008. Employment Effects of Business Dynamics: Mice, Gazelles and Elephants. Small Business Economics 30: 85–100. [Google Scholar] [CrossRef]
  2. Adizes, I. 2004. Managing Corporate Lifecycles. Santa Barbara: The Adizes Institute Publishing. 460p. [Google Scholar]
  3. Aganbegyan, A. G. 2022. RUSSIA: FROM STAGNATION TO SUSTAINABLE SOCIO-ECONOMIC GROWTH. Scientific Works of the Free Economic Society of Russia 237: 310–62. [Google Scholar] [CrossRef]
  4. Aiello, Francesco, Camilla Mastromarco, and Angelo Zago. 2011. Be Productive or Face Decline. On the Sources and Determinants of Output Growth in Italian Manufacturing Firms. Empirical Economics 41: 787–815. [Google Scholar] [CrossRef]
  5. Albaz, Abdulaziz, Tarek Mansour, Tarek Rida, and Jörg Schubert. 2020. Setting Up Small and Medium-Size Enterprises for Restart and Recovery. June 9. Available online: http://dln.jaipuria.ac.in:8080/jspui/bitstream/123456789/10866/1/Setting-up-small-and-medium-size-enterprises-for-restart-and-recovery.pdf (accessed on 6 October 2023).
  6. Aldrich, Howard E., and Martin Ruef. 2018. Unicorns, Gazelles, and Other Distractions on the Way to Understanding Real Entrepreneurship in the United States. Academy of Management Perspectives 32: 458–72. [Google Scholar] [CrossRef]
  7. Ambrosio, F., A. Brasili, and K. Niakaros. 2021. European Scale-Up Gap: Too Few Good Companies or Too Few Good Investors; European Commission, Directorate-General for Research and Innovation. Available online: https://research-and-innovation.ec.europa.eu/knowledge-publications-tools-and-data/publications/all-publications/european-scale-gap-too-few-good-companies-or-too-few-good-investors_en (accessed on 6 October 2023).
  8. Andries, Petra, Koenraad Debackere, and Bart van Looy. 2013. Simultaneous Experimentation as a Learning Strategy: Business Model Development Under Uncertainty. Strategic Entrepreneurship Journal 7: 288–310. [Google Scholar] [CrossRef]
  9. Anyadike-Danes, Michael, Karen Bonner, Mark Hart, and Colin Mason. 2009. Measuring Business Growth: High Growth Firms and Their Contribution to Employment in the UK. London: National Endowment for Science, Technology and the Arts (NESTA). [Google Scholar]
  10. Arellano, Cristina, Yan Bai, and Jing Zhang. 2012. Firm Dynamics and Financial Development. Journal of Monetary Economics 59: 533–49. [Google Scholar] [CrossRef]
  11. Arrighetti, Alessandro, and Andrea Lasagni. 2013. Assessing the Determinants of High-Growth Manufacturing Firms in Italy. International Journal of the Economics of Business 20: 245–67. [Google Scholar] [CrossRef]
  12. Athari, Seyed Alireza, Farid Irani, and Abobaker AlAl Hadood. 2023. Country Risk Factors and Banking Sector Stability: Do Countries’ Income and Risk-Level Matter? Evidence from Global Study. Heliyon 9: e20398. [Google Scholar] [CrossRef]
  13. Åslund, A., and M. Snegovaya. 2021. The Impact of Western Sanctions on Russia and How They Can Be Made Even More Effective. Washington, DC: Atlantic Council, vol. 3. [Google Scholar]
  14. Bai, John (Jianqiu), Douglas Fairhurst, and Matthew Serfling. 2019. Employment Protection, Investment, and Firm Growth. Edited by David Denis. The Review of Financial Studies 33: 44–88. [Google Scholar] [CrossRef]
  15. Baranova, E. I. 2019. Patterns and evolution stages of the Russian high-growth firms. The Eurasian Scientific Journal 11: 1. Available online: https://esj.today/PDF/41ECVN119.pdf (accessed on 6 October 2023).
  16. Barrett, Richard. 2013. Liberating the Corporate Soul. Oxfordshire: Routledge. [Google Scholar] [CrossRef]
  17. Baule, Rainer. 2018. The Cost of Debt Capital Revisited. Business Research 12: 721–53. [Google Scholar] [CrossRef]
  18. Beck, Don Edward, and Christoher Cowan. 2014. Spiral Dynamics: Mastering Values, Leadership and Change. Hoboken: John Wiley and Sons. [Google Scholar]
  19. Bentzen, Jan, Erik Strøjer Madsen, and Valdemar Smith. 2012. Do Firms’ Growth Rates Depend on Firm Size? Small Business Economics 39: 937–47. [Google Scholar] [CrossRef]
  20. Birch, David. 1981. Who creates jobs? Public Interest 65: 3–14. [Google Scholar]
  21. Birch, David. 1987. Job Creation in America: How Our Smallest Companies Put the Most People to Work. New York: Free Press. [Google Scholar]
  22. Bloom, Nicholas, Robert Fletcher, and Ethan Yeh. 2021. The Impact of COVID-19 on US Firms. Cambridge, MA: National Bureau of Economic Research. [Google Scholar] [CrossRef]
  23. Bon, Sergius Fribontius, and Sri Hartoko. 2022. The Effect of Dividend Policy, Investment Decision, Leverage, Profitability, and Firm Size on Firm Value. European Journal of Business and Management Research 7: 7–13. [Google Scholar] [CrossRef]
  24. Brouwer, Erik, Alfred Kleinknecht, and Jeroen O. N. Reijnen. 1993. Employment Growth and Innovation at the Firm Level. Journal of Evolutionary Economics 3: 153–59. [Google Scholar] [CrossRef]
  25. Cabral, Luis. 1995. Sunk Costs, Firm Size and Firm Growth. The Journal of Industrial Economics 43: 161. [Google Scholar] [CrossRef]
  26. Campbell, Andrew, and Robert Park. 2005. The Growth Gamble. London: Nicholas Brealey International. [Google Scholar]
  27. Casnici, Cyntia Vilasboas Calixto. 2021. The Rise of Unicorn Companies: A Magical Growth? In The Palgrave Handbook of Corporate Sustainability in the Digital Era. Cham: Springer, pp. 581–93. [Google Scholar] [CrossRef]
  28. Chae, Ho-Chang. 2023. In Search of Gazelles: Machine Learning Prediction for Korean High-Growth Firms. Small Business Economics 62: 243–84. [Google Scholar] [CrossRef]
  29. Chen, Tain-Jy, and Ying-Hua Ku. 2000. The Effect of Foreign Direct Investment on Firm Growth: The Case of Taiwan’s Manufacturers. Japan and the World Economy 12: 153–72. [Google Scholar] [CrossRef]
  30. Coad, Alex, and Stjepan Srhoj. 2019. Catching Gazelles with a Lasso: Big Data Techniques for the Prediction of High-Growth Firms. SSRN Electronic Journal. [Google Scholar] [CrossRef]
  31. Croce, Annalisa, Elisa Ughetto, Stefano Bonini, and Vincenzo Capizzi. 2020. Gazelles, Ponies, and the Impact of Business Angels’ Characteristics on Firm Growth. Journal of Small Business Management 59: 223–48. [Google Scholar] [CrossRef]
  32. Dang, Chongyu, Zhichuan (Frank) Li, and Chen Yang. 2018. Measuring Firm Size in Empirical Corporate Finance. Journal of Banking & Finance 86: 159–76. [Google Scholar] [CrossRef]
  33. Daunfeldt, Sven-Olov, Dan Johansson, and Daniel Halvarsson. 2015. Using the Eurostat-OECD Definition of High-Growth Firms: A Cautionary Note. Journal of Entrepreneurship and Public Policy 4: 50–56. [Google Scholar] [CrossRef]
  34. Davidsson, Per, and Frédéric Delmar. 2017. Hunting for New Employment: The Role of High Growth Firms. In Small Firms and Economic Development in Developed and Transition Economies: A Reader. London: Routledge, pp. 7–19. [Google Scholar] [CrossRef]
  35. Decker, Ryan, John Haltiwanger, Ron Jarmin, and Javier Miranda. 2016. Where Has All the Skewness Gone? The Decline in High-Growth (Young) Firms in the U.S. Cambridge, MA: National Bureau of Economic Research. [Google Scholar] [CrossRef]
  36. Delmar, Frédéric, Per Davidsson, and William B. Gartner. 2003. Arriving at the High-Growth Firm. Journal of Business Venturing 18: 189–216. [Google Scholar] [CrossRef]
  37. Downs, Anthony. 1967. The life cycle of bureaus. Inside Bureaucracy 296: 309. [Google Scholar]
  38. Duruflé, Gilles, Thomas F. Hellmann, and Karen E. Wilson. 2016. From Start-Up to Scale-Up: Examining Public Policies for the Financing of High-Growth Ventures. SSRN Electronic Journal. [Google Scholar] [CrossRef]
  39. Eurostat-OECD. 2007. Manual on Business Demography Statistics. Available online: https://ec.europa.eu/eurostat/web/products-manuals-and-guidelines/-/ks-ra-07-010 (accessed on 6 October 2023).
  40. Evans, David S. 1987. The Relationship Between Firm Growth, Size, and Age: Estimates for 100 Manufacturing Industries. The Journal of Industrial Economics 35: 567. [Google Scholar] [CrossRef]
  41. Evans, Mark, and Elizabeth W. Garnsey. 2009. The Cambridge High Tech Cluster on the Eve of the Financial Crisis. SSRN Electronic Journal. [Google Scholar] [CrossRef]
  42. Ferrantino, Michael J., Megha Mukim, Alison Pearson, and Nathanael David Snow. 2012. Gazelles and Gazillas in China and India. SSRN Electronic Journal. [Google Scholar] [CrossRef]
  43. Foroni, Claudia, Massimiliano Marcellino, and Dalibor Stevanović. 2020. Forecasting the COVID-19 Recession and Recovery: Lessons from the Financial Crisis. SSRN Electronic Journal. [Google Scholar] [CrossRef]
  44. Gibrat, Robert. 1931. Les Inegalities Economiques. Paris: Sirey. [Google Scholar]
  45. Greiner, Larry E. 1997. Evolution and Revolution as Organizations Grow. Family Business Review 10: 397–409. [Google Scholar] [CrossRef]
  46. Grover Goswami, Arti, Denis Medvedev, and Ellen Olafsen. 2019. High-Growth Firms: Facts, Fiction, and Policy Options for Emerging Economies. Washington, DC: World Bank. [Google Scholar] [CrossRef]
  47. Hall, Bronwyn. 1986. The Relationship Between Firm Size and Firm Growth in the U.S. Manufacturing Sector. Cambridge, MA: National Bureau of Economic Research. [Google Scholar] [CrossRef]
  48. Halmai, Péter. 2021. COVID-Crisis and Economic Growth: Tendencies on Potential Growth in the European Union. Acta Oeconomica 71: 165–86. [Google Scholar] [CrossRef]
  49. Haltiwanger, John, Ian Hathaway, and Javier Miranda. 2014. Declining Business Dynamism in the U.S. High-Technology Sector. SSRN Electronic Journal. [Google Scholar] [CrossRef]
  50. Haltiwanger, John, Ron S. Jarmin, and Javier Miranda. 2013. Who Creates Jobs? Small versus Large versus Young. Review of Economics and Statistics 95: 347–61. [Google Scholar] [CrossRef]
  51. Haltiwanger, John, Ron S. Jarmin, and Robert B. Kulick. 2016. High Growth Young Firms: Contribution to Job, Output and Productivity Growth. SSRN Electronic Journal. [Google Scholar] [CrossRef]
  52. Halvarsson, Daniel. 2013a. Firm Dynamics: The Size and Growth Distribution of Firms. Doctoral dissertation, KTH Royal Institute of Technology, Stockholm, Sweden; p. 44. Available online: https://urn.kb.se/resolve?urn=urn:nbn:se:kth:diva-118333 (accessed on 6 October 2023).
  53. Halvarsson, Daniel. 2013b. Identifying High-Growth Firms. No 215, Ratio Working Papers, The Ratio Institute. Available online: https://www.diva-portal.org/smash/get/diva2:605658/FULLTEXT01.pdf (accessed on 6 February 2024).
  54. Hangstefer, James B. 2000. Revenue margin: A better way to measure company growth. Strategic Finance 82: 40. [Google Scholar]
  55. Hanks, Steven H. 1990. The organization life cycle: Integrating content and process. Journal of Small Business Strategy 1: 1–12. [Google Scholar]
  56. Hardy, Bryan, and Can Sever. 2021. Financial Crises and Innovation. European Economic Review 138: 103856. [Google Scholar] [CrossRef]
  57. Haveman, Heather A. 1993. Organizational Size and Change: Diversification in the Savings and Loan Industry after Deregulation. Administrative Science Quarterly 38: 20. [Google Scholar] [CrossRef]
  58. Heimonen, Tomi, and Markku Virtanen. 2012. Characteristics of Successful Gazelles—Problems in Approaches and Methods of Analysing the Data. International Journal of Business and Globalisation 9: 12. [Google Scholar] [CrossRef]
  59. Henderson, James, and Arild Moe. 2016. Gazprom’s LNG Offensive: A Demonstration of Monopoly Strength or Impetus for Russian Gas Sector Reform? Post-Communist Economies 28: 281–99. [Google Scholar] [CrossRef]
  60. Henrekson, Magnus, and Dan Johansson. 2010. Firm Growth, Institutions and Structural Transformation. SSRN Electronic Journal. [Google Scholar] [CrossRef]
  61. Hosmer, David W., Stanley Lemeshow, and Rodney X. Sturdivant. 2013. Applied Logistic Regression. Wiley Series in Probability and Statistics; Hoboken: John Wiley & Sons, Inc. [Google Scholar] [CrossRef]
  62. Johnson, Mark W., Clayton M. Christensen, and Henning Kagermann. 2008. Reinventing your business model. Harvard Business Review 86: 50–59. Available online: https://hbr.org/2008/12/reinventing-your-business-model (accessed on 6 October 2023).
  63. Jørgensen, Sveinung, and Lars Jacob Tynes Pedersen. 2018. RESTART Sustainable Business Model Innovation. Palgrave Studies in Sustainable Business In Association with Future Earth. Cham: Springer International Publishing. [Google Scholar] [CrossRef]
  64. Kirkham, Ksenia. 2016. The Formation of the Eurasian Economic Union: How Successful Is the Russian Regional Hegemony? Journal of Eurasian Studies 7: 111–28. [Google Scholar] [CrossRef]
  65. Knowles, Jonathan, Richard Ettenson, Patrick Lynch, and Joseph Dollens. 2020. Growth opportunities for brands during the COVID-19 crisis. MIT Sloan Management Review 61: 2–6. [Google Scholar]
  66. Kohler, Karsten, and Engelbert Stockhammer. 2021. Growing Differently? Financial Cycles, Austerity, and Competitiveness in Growth Models since the Global Financial Crisis. Review of International Political Economy 29: 1314–41. [Google Scholar] [CrossRef]
  67. Kudrin, Alexey, and Evsey Gurvich. 2015. A New Growth Model for the Russian Economy1. Russian Journal of Economics 1: 30–54. [Google Scholar] [CrossRef]
  68. Lin, Qi. 2015. Growth Options Effect on Leverage: Evidence from China. Pacific-Basin Finance Journal 34: 152–68. [Google Scholar] [CrossRef]
  69. Maiti, Moinak, Darko Vuković, Amrit Mukherjee, Pavan D. Paikarao, and Janardan Krishna Yadav. 2022. Advanced Data Integration in Banking, Financial, and Insurance Software in the Age of COVID-19. Software: Practice and Experience 52: 887–903. [Google Scholar] [CrossRef] [PubMed]
  70. Mansikkamäki, Susanna. 2023. Firm Growth and Profitability: The Role of Age and Size in Shifts between Growth–Profitability Configurations. Journal of Business Venturing Insights 19: e00372. [Google Scholar] [CrossRef]
  71. Markman, Gideon D., and William B. Gartner. 2002. Is Extraordinary Growth Profitable? A Study ofInc. 500High–Growth Companies. Entrepreneurship Theory and Practice 27: 65–75. [Google Scholar] [CrossRef]
  72. Marquardt, Donald W. 1980. A Critique of Some Ridge Regression Methods: Comment. Journal of the American Statistical Association 75: 87. [Google Scholar] [CrossRef]
  73. Mayr, Stefan, Christine Mitter, and Andrea Aichmayr. 2017. Corporate Crisis and Sustainable Reorganization: Evidence from Bankrupt Austrian SMEs. Journal of Small Business Management 55: 108–27. [Google Scholar] [CrossRef]
  74. McGrath, Rita Gunther. 2010. Business Models: A Discovery Driven Approach. Long Range Planning 43: 247–61. [Google Scholar] [CrossRef]
  75. Megaravalli, Amith Vikram. 2017. Estimating Growth of SMES Using a Logit Model: Evidence from Manufacturing Companies in Italy. Management Science Letters, 125–34. [Google Scholar] [CrossRef]
  76. Metzger, Georg. 2006. Once Bitten, Twice Shy? The Performance of Entrepreneurial Restarts. SSRN Electronic Journal. [Google Scholar] [CrossRef]
  77. Miller, Danny, and Peter H. Friesen. 1983. Successful and Unsuccessful Phases of the Corporate Life Cycle. Organization Studies 4: 339–56. [Google Scholar] [CrossRef]
  78. Nagelkerke, Nico. 1991. A Note on a General Definition of the Coefficient of Determination. Biometrika 78: 691–92. [Google Scholar] [CrossRef]
  79. National Endowment for Science, Technology and the Arts (NESTA). 2009. The Vital 6 per Cent: How High-Growth Innovative Businesses Generate Prosperity and Jobs, NESTA, London. Available online: www.nesta.org.uk/library/documents/Report-Summary-Vital-6-per-cent-v13.pdf (accessed on 6 October 2023).
  80. Nightingale, Paul, and Alex Coad. 2014. Muppets and Gazelles: Political and Methodological Biases in Entrepreneurship Research. Industrial and Corporate Change 23: 113–43. [Google Scholar] [CrossRef]
  81. Oliveira, Blandina, and Adelino Fortunato. 2006. Firm Growth and Liquidity Constraints: A Dynamic Analysis. Small Business Economics 27: 139–56. [Google Scholar] [CrossRef]
  82. Organisation for Economic Co-operation and Development (OECD). 2008. Eurostat-OECD Manual on Business Demography Eurostat Electronic Report. Available online: https://ec.europa.eu/eurostat/web/products-manuals-and-guidelines/-/ks-ra-07-010 (accessed on 6 October 2023).
  83. Ostapenko, Svitlana, Ana Paula Africano, and Raquel Meneses. 2022. Cluster Dynamics and Firms’ Strategies—An Integrative Framework. EuroMed Journal of Business, August 8. [Google Scholar] [CrossRef]
  84. Otiman, Paun Ioan. 2008. Rural development and agriculture: Opportunities to attenuate the economic and financial crisis and to resume economic growth. Agricultural Economics and Rural Development 5: 97–128. [Google Scholar]
  85. Park, Kwangmin, and SooCheong (Shawn) Jang. 2010. Firm Growth Patterns: Examining the Associations with Firm Size and Internationalization. International Journal of Hospitality Management 29: 368–77. [Google Scholar] [CrossRef]
  86. Perrini, Francesco, and Antonio Tencati. 2006. Sustainability and Stakeholder Management: The Need for New Corporate Performance Evaluation and Reporting Systems. Business Strategy and the Environment 15: 296–308. [Google Scholar] [CrossRef]
  87. Piaskowska, Dorota, Esther Tippmann, and Sinéad Monaghan. 2021. Scale-up Modes: Profiling Activity Configurations in Scaling Strategies. Long Range Planning 54: 102101. [Google Scholar] [CrossRef]
  88. Pokorná, Pavla. 2020. Financial Sources for Company Scale-Up. In Developing Entrepreneurial Competencies for Start-Ups and Small Business. Advances in Business Strategy and Competitive Advantage. Hershey: IGI Global, pp. 97–108. [Google Scholar] [CrossRef]
  89. Postelnicu, Cătălin, and Irina M. Ban. 2010. Some Empirical Approaches of the Competitiveness’ Diamond-The Case of Romanian Economy. Romanian Economic Journal 36: 53–77. [Google Scholar]
  90. Preisendörfer, Peter, and Thomas Voss. 1990. Organizational Mortality of Small Firms: The Effects of Entrepreneurial Age and Human Capital. Organization Studies 11: 107–29. [Google Scholar] [CrossRef]
  91. Savin, Ivan, and Maria Novitskaya. 2023. Data-Driven Definitions of Gazelle Companies That Rule out Chance: Application for Russia and Spain. Eurasian Business Review 13: 507–42. [Google Scholar] [CrossRef]
  92. Sirén, Charlotta, Henri Hakala, Joakim Wincent, and Dietmar Grichnik. 2017. Breaking the Routines: Entrepreneurial Orientation, Strategic Learning, Firm Size, and Age. Long Range Planning 50: 145–67. [Google Scholar] [CrossRef]
  93. Spark Information System. 2023. Available online: https://spark-interfax.com/ (accessed on 6 October 2023).
  94. Spitsin, Vladislav, Alexandr Mikhalchuk, Darko Vukovic, and Lubov Spitsina. 2023a. Technical Efficiency of High-Technology Industries in the Crisis: Evidence from Russia. Journal of the Knowledge Economy 14: 200–25. [Google Scholar] [CrossRef]
  95. Spitsin, Vladislav, Darko B. Vukovic, Lubov Spitsina, and Mustafa Özer. 2021. The Impact of High-Tech Companies’ Performance and Growth on Capital Structure. Competitiveness Review: An International Business Journal 32: 975–94. [Google Scholar] [CrossRef]
  96. Spitsin, Vladislav, Darko Vukovic, Alexander Mikhalchuk, Lubov Spitsina, and Daria Novoseltseva. 2023b. High-Tech Gazelle Firms at Various Stages of Evolution: Performance and Distinctive Features. Journal of Economic Studies 50: 674–95. [Google Scholar] [CrossRef]
  97. Spitsin, Vladislav, Darko Vukovic, Sergey Anokhin, and Lubov Spitsina. 2020a. Company Performance and Optimal Capital Structure: Evidence of Transition Economy (Russia). Journal of Economic Studies 48: 313–32. [Google Scholar] [CrossRef]
  98. Spitsin, Vladislav, Marina Ryzhkova, Darko Vukovic, and Sergey Anokhin. 2020b. Companies Profitability under Economic Instability: Evidence from the Manufacturing Industry in Russia. Journal of Economic Structures 9: 9. [Google Scholar] [CrossRef]
  99. Srhoj, Stjepan. 2022. Can We Predict High Growth Firms with Financial Ratios? Financial Internet Quarterly 18: 66–73. [Google Scholar] [CrossRef]
  100. Tomenendal, Matthias, Florian Becker-Ritterspach, and Christoph Dörrenbächer. 2022. Taking Stock and Moving Forward: Some Concluding Remarks on Gazelle Firms and Gazelle Research. In The Promises and Properties of Rapidly Growing Companies: Gazelles. Leeds: Emerald Publishing Limited, pp. 149–54. [Google Scholar] [CrossRef]
  101. Vo, Xuan Vinh. 2019. Leverage and Corporate Investment—Evidence from Vietnam. Finance Research Letters 28: 1–5. [Google Scholar] [CrossRef]
  102. Vukovic, Darko B., Alexander Zobov, and Ekaterina Degtereva. 2022. The Nexus between Tourism and Regional Real Growth: Dynamic Panel Threshold Testing. Journal of the Geographical Institute “Jovan Cvijic” SASA 72: 111–16. [Google Scholar] [CrossRef]
  103. Vukovic, Darko B., Edin Hanic, and Hasan Hanic. 2017. Financial Integration in the European Union - the Impact of the Crisis on the Bond Market. Equilibrium. Quarterly Journal of Economics and Economic Policy 12: 195–210. [Google Scholar] [CrossRef]
  104. Wilber, Ken. 2005. Introduction to integral theory and practice. AQAL: Journal of Integral Theory and Practice 1: 2–38. [Google Scholar]
  105. Xiang, Shihui, Saad Rasool, Yong Hang, Kamran Javid, Tasawar Javed, and Alin Emanuel Artene. 2021. The Effect of COVID-19 Pandemic on Service Sector Sustainability and Growth. Frontiers in Psychology 12: 633597. [Google Scholar] [CrossRef]
  106. Yashin, Sergei, Yurii Trifonov, and Egor Koshelev. 2016. Forecasting the company growth rate based on reinvestment rate, profit margin and capital turnover. Финансы и кредит 1: 38–51. Available online: http://213.226.126.9/fc/2016/fc01/fc0116-38.pdf (accessed on 6 October 2023).
  107. Zekić-Sušac, Marijana, Nataša Šarlija, Adela Has, and Ana Bilandžić. 2016. Predicting Company Growth Using Logistic Regression and Neural Networks. Croatian Operational Research Review 7: 229–48. [Google Scholar] [CrossRef]
  108. Zhou, Kevin Zheng, David K. Tse, and Julie Juan Li. 2006. Organizational Changes in Emerging Economies: Drivers and Consequences. Journal of International Business Studies 37: 248–63. [Google Scholar] [CrossRef]
Figure 1. Influence of firm size on the probability of realizing restarting growth (by type of growth). Note: The figure provided depicts two U-shaped curves, each representing the relationship between a firm’s size and the probability of experiencing either moderate or fast long-term growth post-stagnation. The x-axis is on a logarithmic scale, indicating the firm’s size in RUB billion, which allows for a wide range of firm sizes to be displayed on the same graph. The y-axis represents the probability of growth, with the left graph pertaining to moderate long-term growth and the right to fast long-term growth.
Economies 12 00055 g001
Figure 2. Boxplots of sales growth over the entire time period for groups of firms that showed (1) and did not show (0) post-stagnation growth. Note: The figure depicts two boxplots representing the distribution of sales growth percentages over an entire time period for two distinct groups of firms—those that exhibited post-stagnation growth (labeled as ‘1’) and those that did not (labeled as ‘0’). The boxplots are separated into two categories: moderate long-term growth and fast long-term growth. Symbols on the graph: point–mean value, line—median, rectangle—25–75% quartile range, whiskers—1.5 interquartile range.
Economies 12 00055 g002
Figure 3. The interplay between organizational life cycle theory approaches and empirical factors influencing the restarting of growth in firms.
Economies 12 00055 g003
Table 1. Approaches to restarting growth in the theory of the organization life cycle.
No.Direction/ApproachSummaryScholars
1Terminal DeclineThe life cycle concludes with the cessation of growth or the dissolution of the organization. The potential revival is seen as a transient phase preceding decline (Adizes).(Downs 1967; Adizes 2004; Miller and Friesen 1983; Hanks 1990)
2Renewal Post-RecessionThe cycle concludes with a phase of renewal, leading to a new stage of development.
2.1Integral Theory—Spiral Dynamics Model—Discovery Driven ApproachOrganizations evolve in a manner akin to human and social organisms, where organizational disbandment signals a new developmental phase (Wilber). External influences and their management can forestall organizational demise (Beck and Cowan), with growth emerging from ‘discovery’ under uncertainty (McGrath).(Wilber 2005; Beck and Cowan 2014; McGrath 2010)
2.2Organizational Life Cycle—Corporate Transformation ModelCorporate evolution involves navigating through crises via diverse strategies, such as reducing administrative burdens (Greiner) or altering organizational values (Barrett).(Greiner 1997; Barrett 2013)
2.3Restart FrameworkGrowth is achieved by redesigning business models and engaging in controlled experimentation, shifting focus to service-oriented and circular business models, and fostering collaborative alliances (Jørgensen and Pedersen 2018; Johnson et al. 2008; Andries et al. 2013). Outcome-driven business models are emphasized (Perrini and Tencati 2006).(Jørgensen and Pedersen 2018; Johnson et al. 2008; Andries et al. 2013)
2.4Reinvestment of Retained EarningsRestarting growth is attributed to altering reinvestment strategies of retained earnings. Revenue response to investment may be delayed (Yashin et al. 2016), with reinvestment being a nuanced internal policy decision (Pokorná).(Pokorná 2020; Yashin et al. 2016)
2.5SerendipityRapid growth is not always feasible due to market rigidity and infrastructural limitations, which can amplify business risks. Growth thus is seen as an interplay of strategic actions and fortuitous events, cautioning against the pursuit of high growth rates.(Campbell and Park 2005)
2.6New Firm vs. Reestablishing a FirmEntrepreneurs may either establish new firms alongside existing ones (‘portfolio entrepreneurs’) or disengage from current ventures to initiate new ones (‘restarters’). This bifurcation complicates the statistical tracking of growth restarts in the context of corporate restructuring.(Metzger 2006)
2.7Entrepreneur PersonalityA firm’s growth correlates with the leader’s persona (encompassing human capital and prior business failures), although the leader’s influence tends to wane as the company matures.(Preisendörfer and Voss 1990)
2.8Systemic State ImpactPost-COVID, a widespread rejuvenation in the growth of companies, particularly SMEs, was necessitated. Discussions focus on aid for business resumption and the cultivation of personalized, systemic collaboration between government entities and SME ecosystems.(Albaz et al. 2020)
Table 2. Descriptive statistics and correlations.
NVariableMeanStd. DeviationVIF1234
1Leverage54.5239.241.171
2ROA2.6114.361.14−0.26 ***1
3Turnover165.67145.851.400.11 ***0.08 ***1
4HighTech0.170.381.060.040.05 *0.031
5Mining0.030.181.140.04 λ0.08 **−0.11 ***−0.08 ***
6Firms with State0.040.191.04−0.07 **−0.01−0.06 **0.16 ***
7GDP Growth6.231.311.02−0.05 *0.000.040.02
8Age17.206.141.07−0.19 ***−0.04 λ−0.07 **−0.06 *
9Size19.511.661.45−0.01−0.03−0.47 ***−0.10 ***
10Sales Dynamics−14.5713.341.11−0.08 ***0.18 **0.19 ***−0.05 *
11Investment2.375.301.04−0.07 **0.04 λ−0.02−0.03
NVariable567891011
1Leverage
2ROA
3Turnover
4HighTech
5Mining1
6Firms with State0.011
7GDP Growth−0.10 ***0.001
8Age−0.010.07 **0.05 *1
9Size0.31 ***0.03−0.09 ***0.09 ***1
10Sales Dynamics0.00−0.010.030.07 **0.001
11Investment0.10 ***0.00−0.030.05 *0.11 ***0.12 ***1
Note: *** p < 0.001; ** p < 0.01; * p < 0.05; λ p < 0.10.
Table 3. Results of logistic regression for the MLTG and the FLTG.
VariablesModel 1 (MLTG)Model 2 (MLTG)Model 1 (FLTG)Model 2 (FLTG)
Intercept−1.82 ***
(0.07)
−2.06 ***
(0.09)
−3.08 ***
(0.12)
−3.57 ***
(0.17)
Leverage0.20 **
(0.06)
0.15 *
(0.06)
0.17 *
(0.09)
0.15
(0.09)
ROA−0.13
(0.08)
−0.09
(0.08)
−0.27 **
(0.10)
−0.16
(0.11)
Turnover−0.32 ***
(0.09)
−0.49 ***
(0.11)
−0.11
(0.12)
−0.30 λ
(0.16)
HighTech0.11
(0.06)
0.03
(0.07)
0.17
(0.10)
0.04
(0.11)
Mining−0.06
(0.07)
−0.05
(0.08)
0.00
(0.11)
0.05
(0.12)
Firms with State−0.02
(0.07)
0.00
(0.07)
0.02
(0.10)
0.05
(0.11)
GDP Growth−0.08
(0.07)
−0.06
(0.07)
0.04
(0.11)
0.06
(0.12)
Age −0.33 ***
(0.07)
−0.26 *
(0.11)
Size −0.40 ***
(0.10)
−0.62 ***
(0.16)
Size2 0.13 **
(0.04)
0.18 **
(0.07)
Sales Dynamics −0.31 ***
(0.06)
−0.56 ***
(0.09)
Investment 0.10 λ
(0.06)
0.14 λ
(0.08)
Pseudo R20.0370.1050.0310.140
LR χ238.36 on 7 DF112.04 on 12 DF17.84 on 7 DF83.40 on 12 DF
p<0.001<0.0010.013<0.001
Area under ROC Curve0.6300.6930.6370.743
Note: *** p < 0.001; ** p < 0.01; * p < 0.05; λ p < 0.10 (standard errors are in brackets). The table shows the coefficients for each variable across two models, indicating how each factor might influence the likelihood of a firm experiencing moderate or fast long-term growth following a period of stagnation. The statistical significance is denoted by asterisks, showing that many of the coefficients are significant predictors of MLTG and FLTG. From Model 1 to Model 2, there is a trend of increasing explanatory power, as indicated by the rising values of Pseudo R2 and the LR χ2 statistics, with Model 2 showing significance at p < 0.001. This suggests that as more variables are included, the models become better at predicting MLTG and FLTG. The area under the ROC curve also increases, suggesting improved model performance and an increased ability to distinguish between firms that do and do not achieve MLTG and FLTG.
Table 4. Robustness tests for Model 2.
VariablesModel 2 (MLTG)Model 2 (FLTG)
Intercept−2.06 ***
(0.10)
−3.57 ***
(0.17)
Leverage0.15 *
(0.07)
0.15 λ
(0.08)
ROA−0.09
(0.09)
−0.16
(0.13)
Turnover−0.49 **
(0.17)
−0.30
(0.22)
HighTech0.03
(0.07)
0.04
(0.12)
Mining−0.05
(0.08)
0.05
(0.13)
Firms with State0.00
(0.07)
0.05
(0.11)
GDP Growth−0.06
(0.07)
0.06
(0.12)
Age−0.33 ***
(0.07)
−0.26 *
(0.11)
Size−0.40 ***
(0.11)
−0.62 ***
(0.18)
Size20.13 **
(0.04)
0.18 **
(0.06)
Sales Dynamics −0.31 ***
(0.06)
−0.56 ***
(0.10)
Investment0.10 λ
(0.06)
0.14 *
(0.06)
Pseudo R20.1050.140
LR χ2112.04 on 12 DF83.40 on 12 DF
p<0.001<0.001
Area under ROC Curve0.6930.743
Note: *** p < 0.001; ** p < 0.01; * p < 0.05; λ p < 0.10 (standard errors are in brackets).
Disclaimer/Publisher’s Note: The statements, opinions and data contained in all publications are solely those of the individual author(s) and contributor(s) and not of MDPI and/or the editor(s). MDPI and/or the editor(s) disclaim responsibility for any injury to people or property resulting from any ideas, methods, instructions or products referred to in the content.

