Abstract
This study investigates the impact of green equity indices on global market dynamics using a time-varying parameter vector autoregression (TVP-VAR) model. We uncover a significant shift in the role of the global market, transitioning from a shock transmitter to a shock receiver, as the influence of green finance grows. By directly comparing green equity indices with their corresponding global parent indices, we adopt a global perspective that transcends the limitations of studies focusing on specific regions, such as the USA, China, or Europe. This novel approach minimizes the potential biases in the transmission channels within regional markets, enabling a more comprehensive understanding of the relationship between green finance and global market dynamics. Moreover, by focusing on equity indices we ensure a consistent comparison of financial instruments, avoiding the complexities that arise when comparing different asset classes such as green bonds and conventional equities. For global investors, our results highlight the importance of dynamic and flexible hedging strategies that adapt to the distinct characteristics of green assets and their growing influence on the global market. Risk managers should incorporate these time-varying spillover effects into their models to better assess and mitigate potential risks. Policymakers should consider the growing influence of green finance on the broader market when formulating regulations and incentives to support sustainable investing, as our findings underscore the increasing importance of this sector in shaping market dynamics.
1. Introduction
In recent decades, the environmental crisis has manifested with increasing global significance, stressing the need for sustainable interventions. The evolution of green finance has been pivotal in this regard. Since the European Investment Bank pioneered the use of green bonds in 2007, there has been a notable shift in financial markets towards environmentally conscious investments. This shift was further cemented by the International Capital Markets Association’s establishment of the Green Bond Principles in 2014, which significantly propelled the growth of the green bond market. Despite these advancements, green financial instruments still represent a relatively small segment within the broader markets (Reboredo 2018; Sangiorgi and Schopohl 2021). The global financial ecosystem, marked by its complexity, poses challenges to the trajectory of green finance. Financial instabilities, the intertwining of climate risks with financial stability, and the intricate interrelationship between green equity and other financial markets add layers of complexity. These dynamics can present unforeseen risks, necessitating cautious navigation by investors (Reboredo 2018). The COVID-19 pandemic has particularly underscored the susceptibility of green finance to global events affecting its reach and market efficiency (Jiang et al. 2023; Naeem et al. 2021a)
As the prominence of green finance increases and the integration of green and conventional markets intensifies, a fundamental question arises: can green finance influence the dynamics of global markets? Despite the growing body of literature on green finance, the specific impact of green financial instruments, particularly green equity indices, on global equity markets remains underexplored. Many studies have focused on regional markets, such as the USA (Dragomirescu-Gaina et al. 2021), Europe (Sangiorgi and Schopohl 2021), or China (Duan et al. 2023), providing valuable insights into the dynamics of green finance within these specific contexts. However, this regional focus limits our understanding of how sustainability considerations embedded in green finance are influencing the broader global market dynamics. A potential reversal in the direction of transmission channels can be observed, with green markets exerting influence on the broader global market. However, existing research presents mixed views on the net direction of these spillover effects. This ambiguity may partly stem from the common approach in studies that cross-examine different regional market assets and segments, such as comparing the US equity market (e.g., S&P 500) with the green bond market (e.g., Solactive Green Bond Index).
The implications could be profound. If green equity indices are highly integrated with their global parent indices to the point of influencing their performance, it may indicate a fundamental shift in market dynamics, with sustainability considerations gaining prominence. Alternatively, if the influence is found to predominantly flow from conventional to green markets, this would suggest that green finance, while growing, is still navigating within the paradigms set by traditional market forces. These insights are relevant for investors, policymakers, and stakeholders who are seeking to understand the evolving role of green finance in shaping financial market dynamics. A preliminary preview of the results unveils a landscape of pronounced interconnectedness between green and global equity indices, a finding that adds a new dimension to our understanding of green markets. Particularly striking is the evolving role of the Global Broad Market Index, which appears to have transitioned from being predominantly a shock transmitter to a net receiver of shocks originating from green equity indices. This shift is not only statistically significant but carries important implications for global investors and policymakers. Additionally, the varying influences of multi-industry versus specific-industry green indices provide insights into their distinct roles in the financial domain, further contributing to our understanding of the green finance ecosystem.
In an effort to address the research gap regarding the impact of green finance on global markets, this study adopts a focused methodological approach, resulting in several contributions to the literature. First, we directly compare green equity indices with their corresponding global parent index, employing an “apples to apples” comparison. This approach, combined with our focus on transmission channels specifically between equity indices, aims to resolve the comparability issue resulting from linking indices that are distinct in scope, methodological procedure, and composition, such as the disparate MSCI, S&P, BoA, and Solactive indices (for an example, see Reboredo and Ugolini 2020). By employing a time-varying approach that considers the distinct characteristics of different green assets, our study further contributes to broadening the scope of the green finance literature, which has traditionally focused more on bonds and cross-market asset analysis. This time-varying approach allows us to capture the dynamic nature of the relationship between green and conventional markets, providing a more nuanced understanding of the impact of green finance on global markets over time. Finally, our proxy for the global equity market, the S&P Global Broad Market Index, adds to the existing empirical literature by providing a comprehensive overview of both developed and emerging market countries, tracking over 99% of its 49 constituent countries’ available market capitalization. This comprehensive coverage enables us to draw more generalizable conclusions about the impact of green finance on global equity markets.
The remainder of the paper is organized as follows: Section 2 discusses related literature; Section 3 presents the analytical framework, discussing the TVP-VAR connectedness approach’s merits; Section 4 provides detailed information and descriptive statistics of the selected sample dataset; Section 5 discusses the empirical results, comparing the impact of diverse green indices on the global market; finally, Section 6 concludes the paper by summarizing the study’s contributions and implications in the broader context of green finance.
2. Related Literature
The recent literature has highlighted the ascending trajectory of green finance, increasingly focusing on instruments such as green bonds and equity indices. This trend represents a broader shift in the financial sector, reflecting the growing integration of investors’ environmental preferences, as evidenced by the premium often commanded by green assets (MacAskill et al. 2021; Zerbib 2019). Green finance instruments are increasingly seen as not just financial tools but as symbols of commitment to sustainable development and catalysts for green innovation. They incentivize environmentally conscious corporate practices and technological advancements, thereby merging economic incentives with sustainability goals (Broadstock et al. 2022). An influential study by (Zhou et al. 2020) positioned green finance as a critical nexus that bridges the gap between economic and environmental objectives. Their research suggests that aligning monetary incentives with environmental sustainability can significantly influence corporate behavior, driving a shift towards more sustainable business operations. This alignment is evident in how green finance channels investments into projects promoting renewable energy, low-carbon transportation, and climate change mitigation, underscoring the business logic behind the adoption of sustainable practices. Recent studies corroborate this, showing a tangible link between green assets and advancements in renewable energy and carbon emission reductions (Alamgir and Cheng 2023; Jiang et al. 2023).
Despite its promising role, the green finance sector, including green equity, is not without complexities and critiques. A key area of debate involves understanding the motivations behind corporate and investor engagement in green finance. Questions arise about whether such engagements reflect a true commitment to environmental sustainability or are merely strategic maneuvers for enhancing corporate image (Dutordoir et al. 2023). Data transparency remains a critical issue within the broader financial ecosystem, and is particularly vital due to the co-movements characterizing these markets (Reboredo 2018). Concerns about potential agency problems surface as well, particularly regarding firms that profess social responsibility. There are apprehensions that such firms might prioritize managerial benefits at the expense of shareholder interests (Tang and Zhang 2020). Furthermore, the inherent nature of green finance, which emphasizes long-term environmental goals, often clashes with short-term financial imperatives. This dichotomy becomes increasingly challenging to manage in dynamic environmental contexts, where factors such as air pollution, public concern, and economic development can swiftly shift the landscape (He and Shi 2023; Zhou et al. 2020).
Extensive research has been dedicated to understanding the global impact of green markets, particularly focusing on the transmission channels between green and conventional assets. This body of work aims to ascertain how green finance’s contributions to sustainability are reflected in the valuation of green assets and their interactions with conventional counterparts. The connectedness of green assets to various financial sectors is seen as a key indicator of the increasing integration of sustainability principles into the broader financial architecture (Reboredo and Ugolini 2020). Such influence signifies shifting market preferences, where sustainability becomes a central consideration in investment decisions, potentially prompting notable shifts in traditional equity portfolios and underscoring the transformative potential of green finance (Tang and Zhang 2020).
The empirical literature sheds light on the current pattern of integration, particularly across different market assets and segments. High levels of integration and spillovers have been documented between green and conventional stocks (Lundgren et al. 2018), clean energy and stock prices (Nguyen et al. 2021), green and corporate bond markets (Ferrer et al. 2021; Gao et al. 2021; Reboredo 2018), green and treasury bond markets (Ferrer et al. 2021; Reboredo 2018), green bond and stock markets (Tang and Zhang 2020; Zhang and Umair 2023), green bonds and commodities (Naeem et al. 2021a), and green bond and currency markets (Naeem et al. 2021a; Reboredo and Ugolini 2020). However, the nature and direction of the transmission channels are subjects of ongoing debate. While some researchers argue for the growing influence of green assets on traditional markets (Chai et al. 2022; Lundgren et al. 2018; Tang and Zhang 2020), others suggest that the influence predominantly flows from conventional to green markets (Hammoudeh et al. 2020; Mensi et al. 2022; Pham 2016; Reboredo 2018; Reboredo and Ugolini 2020). This divergence in findings points to the complex and dynamic relationship between green and conventional finance, influenced by factors such as external events and market conditions (Jiang et al. 2023; Zhang et al. 2023). Studies have further suggested that the spillover effects between green and traditional markets are asymmetric (Naeem et al. 2021a, 2021b; Pham and Nguyen 2021; Saeed et al. 2021; Wang et al. 2022) and time-varying (Arif et al. 2021; Broadstock and Cheng 2019; Karim and Naeem 2022; Naeem and Karim 2021; Pham 2016; Wang et al. 2022).
The heterogeneity observed in the existing research on green finance can be attributed to two key factors: the distinct dynamics of various green asset classes, and the potential oversight of common or uncontrolled factors influencing market behavior. In addition, the interaction between green and conventional markets adds a layer of complexity to the interpretation of spillovers within the green finance sector. For example, spillovers identified within regional green markets, such as those in Asia, might actually be indicative of the interconnectedness prevalent in the conventional markets of those regions. Additionally, Pham (Pham and Nguyen 2021) highlighted that, after accounting for movements in general stock, energy, and fixed-income markets, the correlation between green bonds and green equity appears relatively minor under typical market conditions. This finding prompts a critical question: are the interactions observed in green finance primarily driven by unique “green effects”, or do they simply mirror the standard dynamics seen in broader market activities? The methodologies and metrics employed in these studies, encompassing coverage, aggregation, scoring, and reporting, further complicate interpretations, indicating the need for a careful and nuanced analysis of such results.
Common factors that influence both green and conventional assets, such as policy and regulation, macroeconomic conditions, geopolitical events, and shifts in investor sentiment, play a significant role as well, especially when they have an asymmetrical impact on these markets (Duan et al. 2023; Zhang and Umair 2023). Policy uncertainty can cast a long shadow over investment strategies, influencing the allocation of capital between green and conventional assets (Dragomirescu-Gaina et al. 2021). When the future direction of regulations remains unclear, investors may hesitate to commit funds to green projects, fearing potential policy changes that could undermine the viability of their investments. The introduction of subsidies, tax breaks, or other supportive measures can significantly enhance the financial attractiveness of green projects, drawing in more investors and driving up demand for green assets; for example, government grants for research and development in clean energy technologies can accelerate innovation, leading to breakthroughs that make renewable energy more competitive with conventional sources. Similarly, the streamlining of licensing processes for green projects can reduce barriers to entry, encouraging more companies to venture into the sustainable energy sector. As the relative profitability of green investments improves, capital may flow more readily from conventional to green assets, altering the dynamics of spillover effects between these markets. However, the impact of policy changes on green investing is not always straightforward. The introduction of new regulations or the tightening of existing ones can also create challenges for green projects. For instance, stricter environmental standards may increase compliance costs for companies operating in the sustainable energy sector, potentially eroding their profitability and making green investments less attractive. Similarly, changes in intellectual property laws or the expiration of key patents can alter the competitive landscape for green technologies, affecting the value of green assets and the spillover effects between green and conventional markets.
To mitigate these complexities, our study adopts a two-pronged approach. First, we move the analysis to a global perspective, which allows us to transcend the limitations of region-specific policies, regulations, and other common factors and to capture the broader trends shaping global green finance. Second, we employ a time-varying approach using the TVP-VAR model, enabling us to detect and analyze the evolution of global market trends and the impact of temporal events and shocks on the relationship between green and conventional markets. This dynamic framework provides a more accurate and timely assessment of spillover effects, empowering global investors and policymakers to make informed decisions in response to shifting market conditions.
3. Methodology
This study adopts a time-varying parameter vector autoregression (TVP-VAR) approach, as proposed by (Antonakakis et al. 2020), which is an extension of the dynamic connectedness model originally put forward by (Diebold and Yilmaz 2009). Grounded on a VAR framework, this original methodology was designed to model nonlinear transmission channels. This is achieved by taking advantage of Impulse Response Functions and Forecast Error Variance Decompositions, which in turn enable the identification of feedback loops across the entire network. The TVP extension enables both the coefficients and the error covariance matrices to change over time. Such adaptability brings two primary benefits for our study. First, it sidesteps the often-problematic task of having to select an optimal rolling window size without a clear rationale. Second, it prevents the exclusion of valuable data points, making the methodology particularly well suited for analyses with smaller sample sizes. As part of implementing this methodology, we have made provisions for variance to undergo modifications via a Kalman Filter estimation, incorporating forgetting factors ( = 0.99, = 0.99); the TVP-VAR model is outlined as follows:
where is an vector of endogenous variables, (for ) are matrices of time-varying coefficients, and serves to encapsulate all the data available up to point . Shifting our focus to the error term, is a vector that houses potential heteroskedastic innovations. Additionally, is represented as an dimensional vector. The time-varying variance–covariance matrices and are and dimensional matrices, respectively. The vectorization of , as depicted by , is an dimensional vector.
An essential transformation takes place to help analyze the impact of shocks emanating from a particular index and how they influence one another. To achieve this, the TVP-VAR model is adeptly modified into its moving average (VMA) counterpart. This transformation finds its foundation in the Wold theorem:
where is an identity matrix of size . The matrix represents the time-varying impact of a one-time shock to the innovations on future values of . The coefficients in are computed recursively using
Upon successfully transitioning to the VMA representation, we make use of the generalized impulse response functions (GIRF), which enables us to quantitatively gauge how any given variable within the system responds when subjected to external shocks:
where represents the impact of a shock in variable j on variable i over horizon H at time t, is a selection vector with one in the j-th position and zeros elsewhere, and is the variance of the j-th error term at time t. The utility of the GIRF becomes evident, as it provides a clear lens to comprehend the ripple effects of sector-focused shocks as they journey across the complete system at any designated timestamp. When we look to the horizon of an H-step ahead, the generalized forecast error variance decomposition quantifies variable j on variable i in terms of its forecast variance share, and is computed as follows:
Next, we proceed to calculate the Total Connectedness Index (TCI). This index provides comprehensive insight into the magnitude of influence that a shock originating from one specific variable exerts on other variables within the system:
Through the TCI, we can understand and visualize the degree of interlinkages and the transmission of shocks across the entirety of the variables in question. To delve deeper into directional connectedness, we split the total directional connectedness into three components: total directional connectedness to others (TO), total directional connectedness from others (FROM), and net total directional connectedness (NET):
To provide a more detailed understanding of the interrelationships within the system, we break down the net total directional connectedness (NET) through the net pairwise directional connectedness (NPDC). This decomposition facilitates a closer examination of the bidirectional ties between variables. The mathematical representation of NPDC is provided by
When , this indicates that variable i holds a dominating influence over variable j. Conversely, when (), this suggests that variable i is more influenced by variable j. This breakdown offers a granular perspective on the power dynamics between the variables.
4. Data
Our data gather time series from green equity indices and the corresponding global equity index. The selection of green equity indices consists of the S&P Global Clean Energy Index, the S&P Global Water Index, and the S&P Global Eco Index, which are widely present in the Green Finance literature (Liu et al. 2021; Madaleno et al. 2022; Nguyen et al. 2021; Tiwari et al. 2022; Wang et al. 2022). The stocks pertaining to each index must be a member of the parent S&P Global Broad Market Index (BMI), which spans 49 developed and emerging market countries and more than 14,000 companies, tracking over 99% of each constituent country’s available market capitalization. Labeled as sustainable indices, the three green equity indices display different features which are relevant for the purpose of the present analysis. The S&P Global Clean Energy Index measures the performance of 100 companies involved in the production of clean energy or the provision of clean energy technology and equipment. Companies are chosen based on an exposure score to the clean energy theme provided that they do not exhibit a high carbon footprint-to-revenue score. The S&P Global Water Index targets companies involved in water-related businesses, including the Water Utilities and Infrastructure and Water Equipment and Materials sectors. Selected companies must fulfill market cap and liquidity conditions, and are ordered according to a score measuring exposure to the industry. The S&P Global Eco Index departs from the previous indices by not focusing on a particular industry, as it is comprised of 40 of the largest publicly traded companies in six different clusters representing ecology-related industries. This broad-band composition has the potential to better insulate the index from specific industry-related shocks and provide a wider picture of the influence of ecology-related markets.
Our sample is comprised of a decade of daily data, spanning from 1 August 2013 to 31 July 2023 (2608 daily observations). The data were obtained directly from the S&P Global website, and consist of price return indices denominated in US Dollars, which have been re-based to 100 at the start of the sample period (1 August 2013). The very few missing observations were handled by linearly interpolating the previous and forward observations. As we are interested in measuring the volatility spillovers between the indices, we begin by computing daily returns in log form. Table 1 provides a comprehensive statistical overview of daily returns for the S&P BMI, S&P Eco, S&P Water, and S&P Clean Energy indices. The positive mean returns for all indices indicate a consistent growth trend, with the S&P Clean Energy index leading at 0.037%. When observing volatility through variance, the S&P Clean Energy index emerges as the most volatile, with a variance of 2.135, while the S&P BMI is the most stable. All of the indices display negative skewness, suggesting a left-skewed return distribution, with the S&P BMI being the most negatively skewed. In terms of kurtosis, all the indices have positive values, implying fatter tails than a standard normal distribution, with the S&P BMI showing the most extreme returns. The Jarque–Bera (JB) test consistently rejects normal distribution across all indices, underscoring the non-normal nature of their returns. Engle’s LM Test (ERS) and the Ljung–Box Test (Q(20) and Q2(20)) point to conditional heteroskedasticity and autocorrelation in the returns, respectively. The Kendall’s Tau coefficients serve as a measure of the unconditional correlation between the indices, offering nonparametric insight into their interdependencies. A notable positive association across all indices underscores the interconnected nature of these markets. Specifically, the S&P Water and S&P BMI indices share the most profound connection, with a coefficient of 0.652, hinting at possible shared economic drivers or mutual reactions to global market events. Conversely, the S&P Clean Energy and S&P Water indices display a weaker correlation level, suggesting higher potential diversification opportunities for investors looking to mitigate risks.

Table 1.
Summary statistics.
5. Results and Discussion
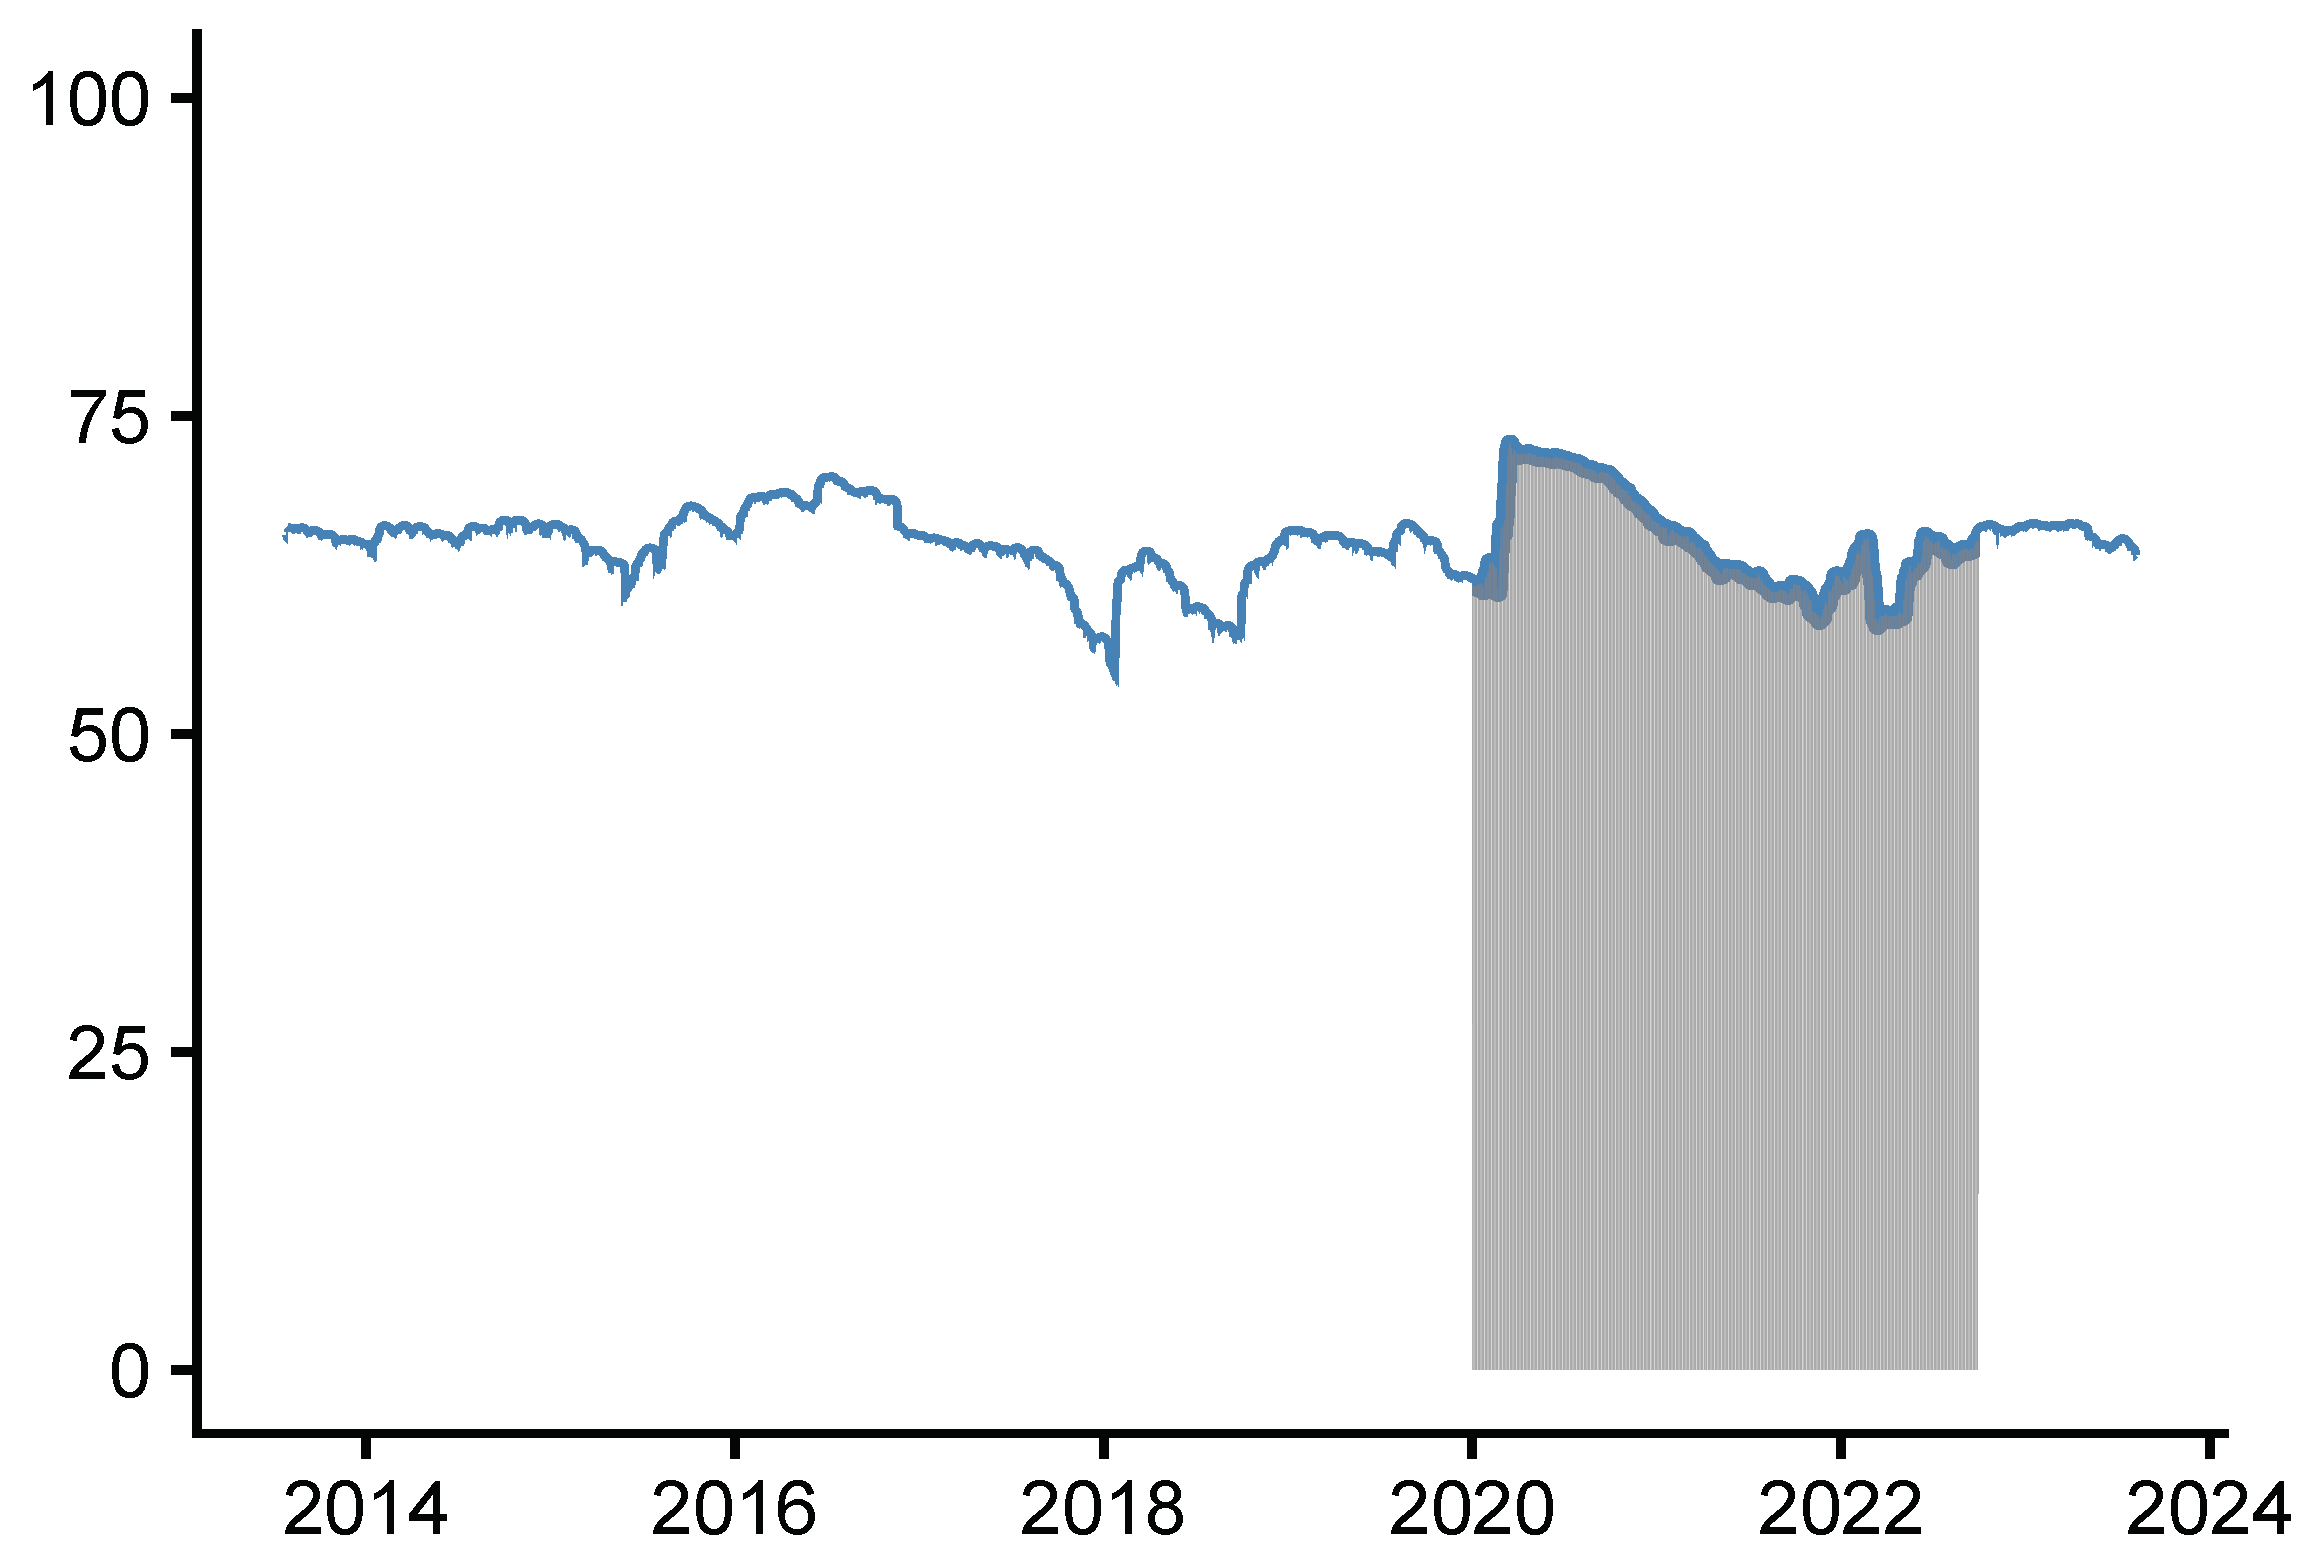
Our analysis, illustrated in Figure 1, focuses on the dynamic Total Connectedness Index (TCI) among equity indices. This index, calculated using a VAR model of length 1 as per the Bayesian Information Criterion, looks at a 10-day-ahead time horizon. The results indicate a significant level of integration among the indices, with TCI peaking at 73% in March 2020 and maintaining a minimum of 53% in January 2018. This consistently high level of connectedness, fluctuating within a band of 20 percentage points over more than 2600 trading days, aligns with the concept of time-varying interconnectedness among green assets as suggested by (Broadstock and Cheng 2019), (Naeem et al. 2021a), (Wang et al. 2022), (Karim and Naeem 2022), (Tiwari et al. 2022), and (Pham 2016).

Figure 1.
Dynamic Total Connectedness Index (the shaded area corresponds to pandemic period: Jan 2020–Jul 2022).
Furthermore, our findings engage with the ongoing debate about the impact of the COVID-19 pandemic on the interconnectedness among green assets and their relationship with other financial assets. While (Wei et al. 2023) posited that the pandemic altered the causal relationships in these markets, particularly under extreme conditions, contrasting views have been presented by (Jiang et al. 2023) and (Naeem et al. 2021a). These studies observed increased spillover effects between green assets and stronger connections with other financial assets during the pandemic, with (Lu et al. 2023) and (Jiang et al. 2023) further noting a significant spike in interconnectedness following the pandemic’s onset. Our analysis partially corroborates these latter views, evidenced by a significant rise in the TCI during the COVID-19 pandemic followed by a gradual decline extending into the first quarter of 2022 (Arif et al. 2021).
Table 2 offers a detailed look at the average connectedness between various green equity indices and the broader global equity market represented by the S&P Global BMI. Notably, the S&P Eco Index stands out as a prominent contributor, registering a net transmitter value of 5.95%. This index, encompassing a diverse range of ecological industries, emerges as a significant barometer within the green market, indicating its broad-based influence. In contrast, the performance of industry-specific green equity indices paints a different picture. The S&P Clean Energy Index, for instance, predominantly acts as a net receiver of shocks, with a value of −6.83%. This finding implies that the index is considerably influenced by broader market trends and is particularly sensitive to changes in policies and global sentiment surrounding sustainable energy. This contrasts with the conclusions drawn by (Tiwari et al. 2022) and (Madaleno et al. 2022), who assigned a more central role to clean energy. However, this discrepancy may stem from their focus on primarily comparing the clean energy index with other green assets such as bonds, solar, wind, carbon, and green tech sectors. The S&P Water Index exhibits a more balanced profile, having a net transmission value of 0.28%. This suggests its dual role as both a receiver and transmitter of market shocks, likely reflecting dynamics specific to the water sector. It is important to note that the average connectedness is a static measure and may not fully capture dynamic shifts, which will be discussed in subsequent sections; nonetheless, the performance of the S&P Water Index is likely influenced more by factors specific to its sector such as water scarcity, shifts in water management policies, and global climate patterns rather than by overarching market sentiments.
Table 2.
Average connectedness among equity indices.
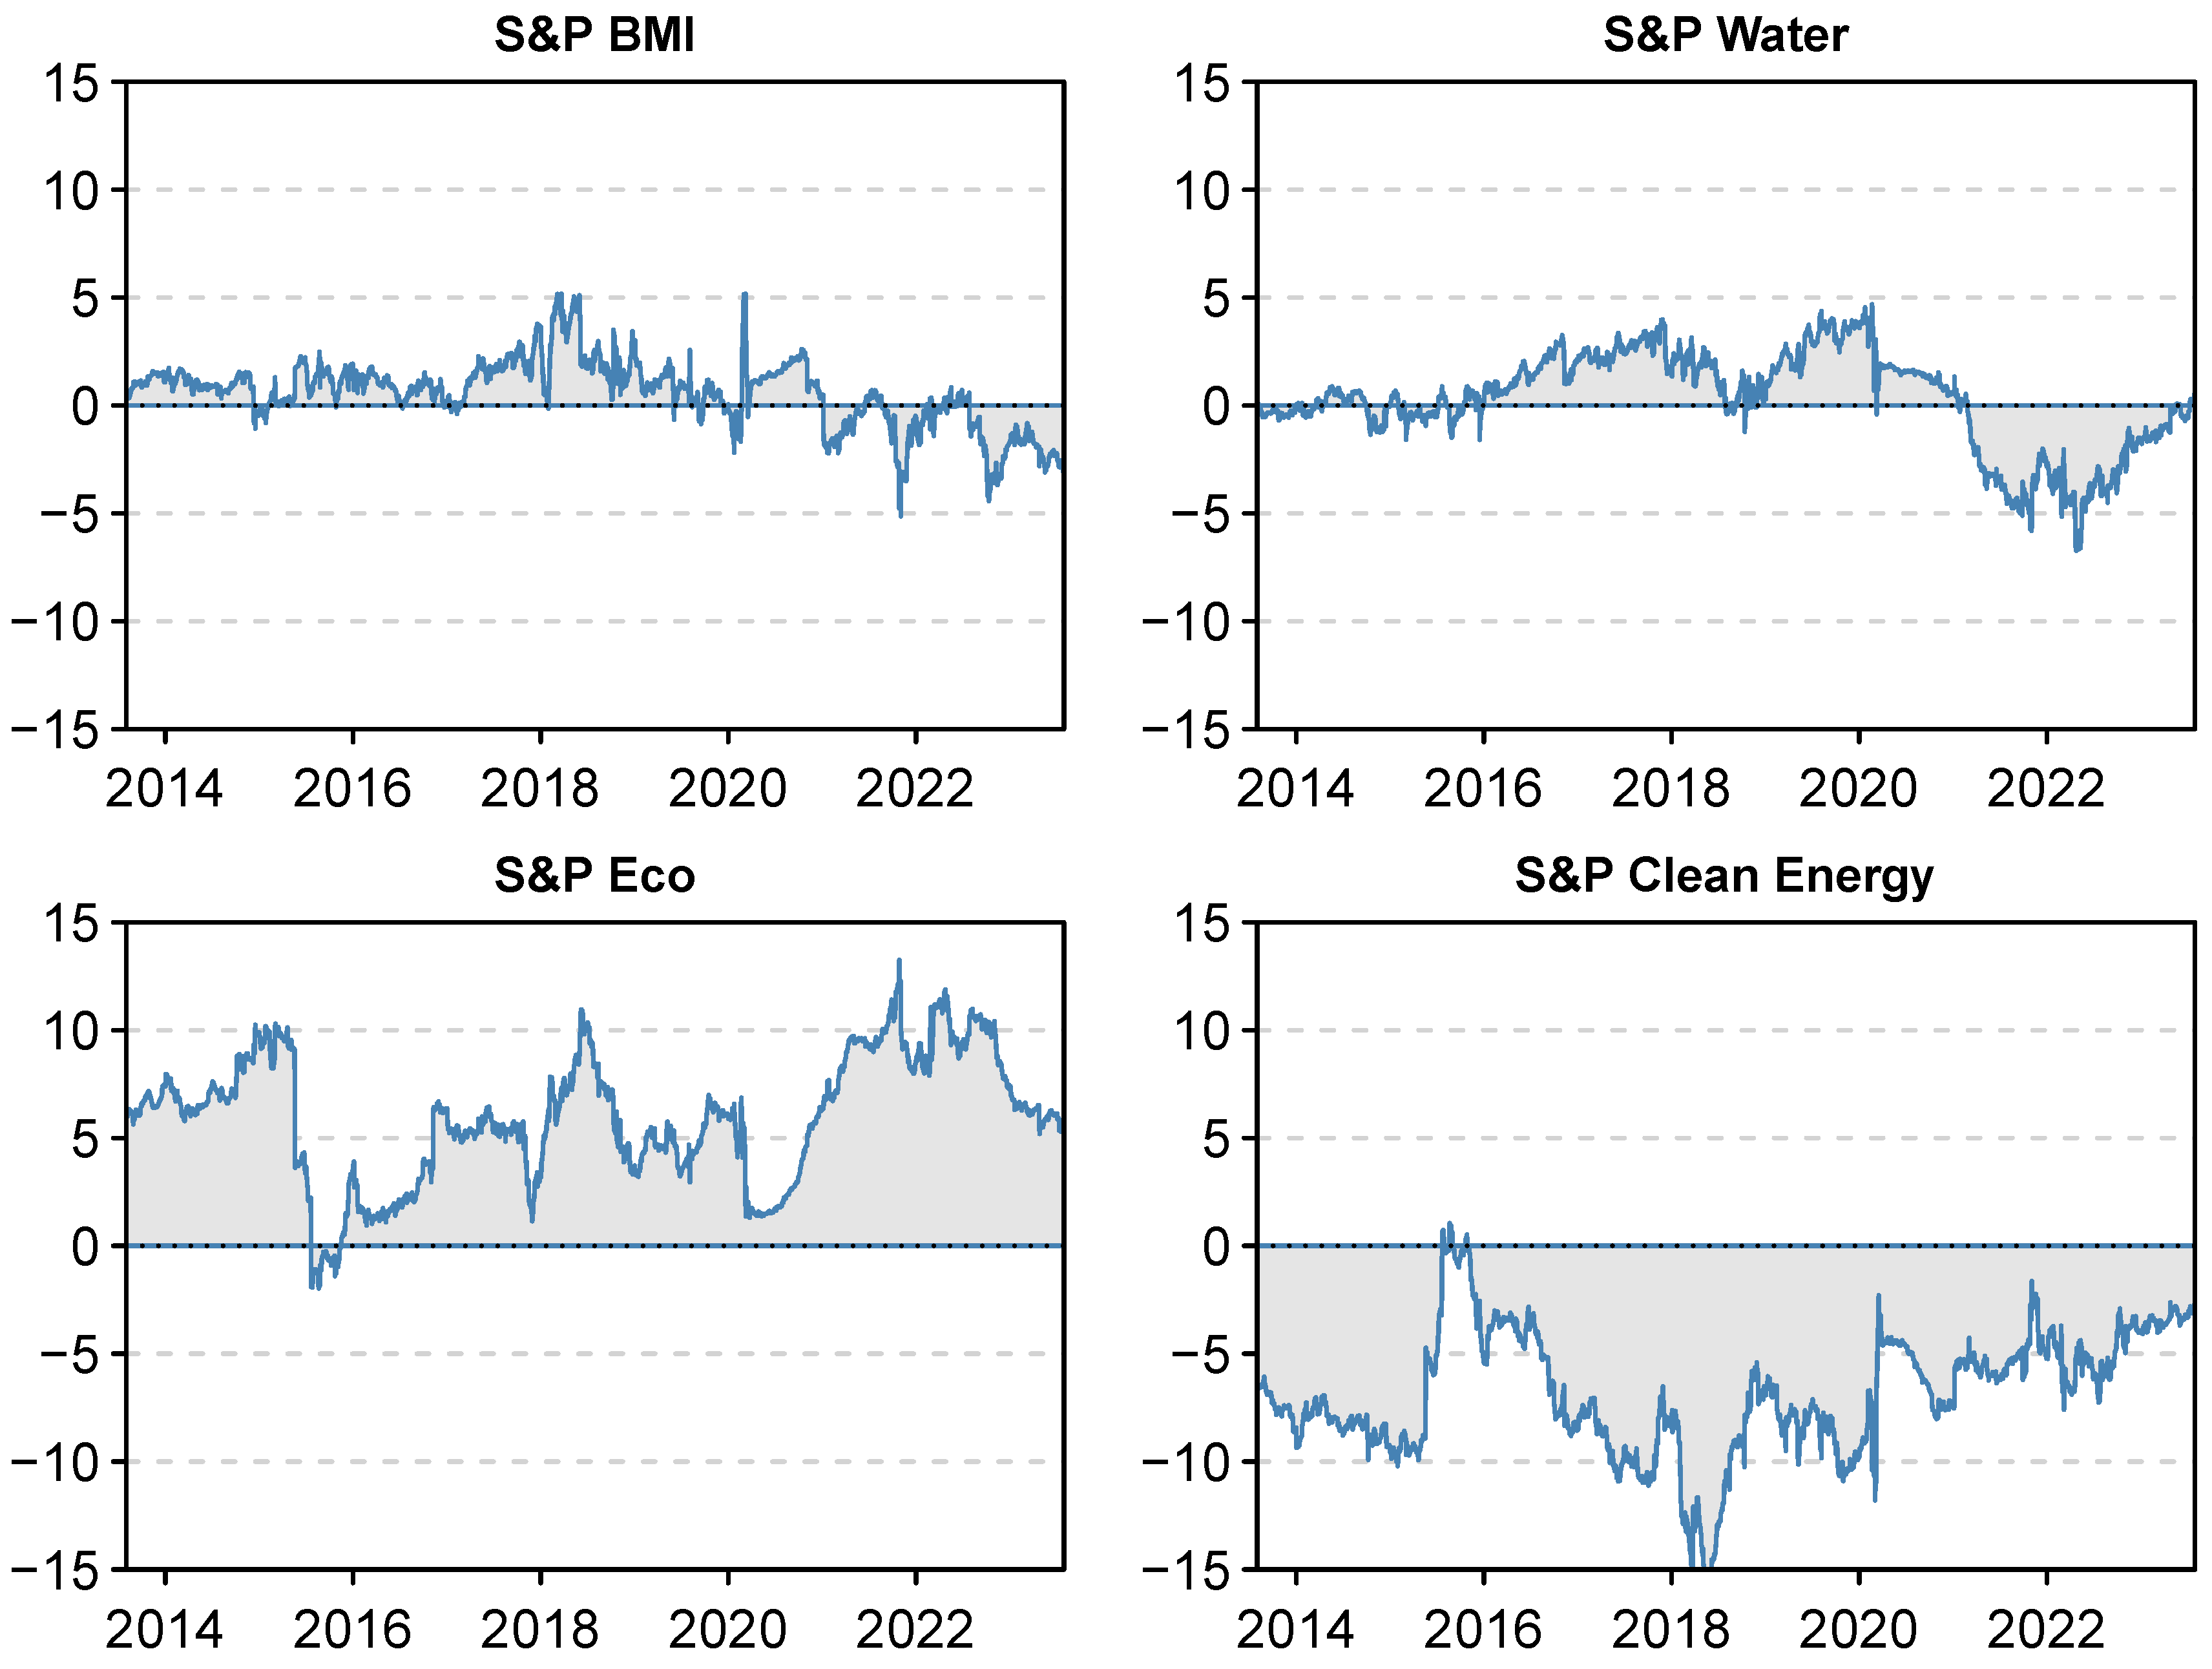
While Table 2 presents the averaged connectedness between green equity indices and the global equity market, the prevalent direction of shocks remains ambiguous, as indicated by the residual net value of 0.60% for the S&P Global BMI. This ambiguity calls for a deeper analysis using net dynamic connectedness measures, which can offer a more detailed time–frequency perspective of the influence exerted by green equity indices. Figure 2 reports the net directional connectedness dynamics for each index, quantifying the net spillovers as the difference between the shocks transmitted by an index to others and the shocks it receives. This figure reveals a significant shift in the role of the global equity index in recent years, from being a mild transmitter of shocks to becoming a net receiver. This trend indicates that the global market has increasingly been influenced by green equity index dynamics, with the latter’s shocks overshadowing those from the global market. In dissecting the origin of these green shocks, we observe that the S&P Eco Index consistently acted as a net transmitter throughout the sample period, and has further solidified this role recently. This finding is in contrast to the specific-industry indices, which exhibit mixed roles. The S&P Water Index, for instance, primarily functioned as a transmitter of shocks for most of the analyzed period, aligning with the findings of (Mensi et al. 2022). However, there appears to be a turning point coinciding with the growing dominance of the S&P Eco Index. On the other hand, the S&P Clean Energy Index has predominantly been a net receiver of spillovers, resonating with the observations of (Chatziantoniou et al. 2022) and (Karim and Naeem 2022), though this trend lessened in the latter half of the sample period.

Figure 2.
Dynamic net spillovers for each index.
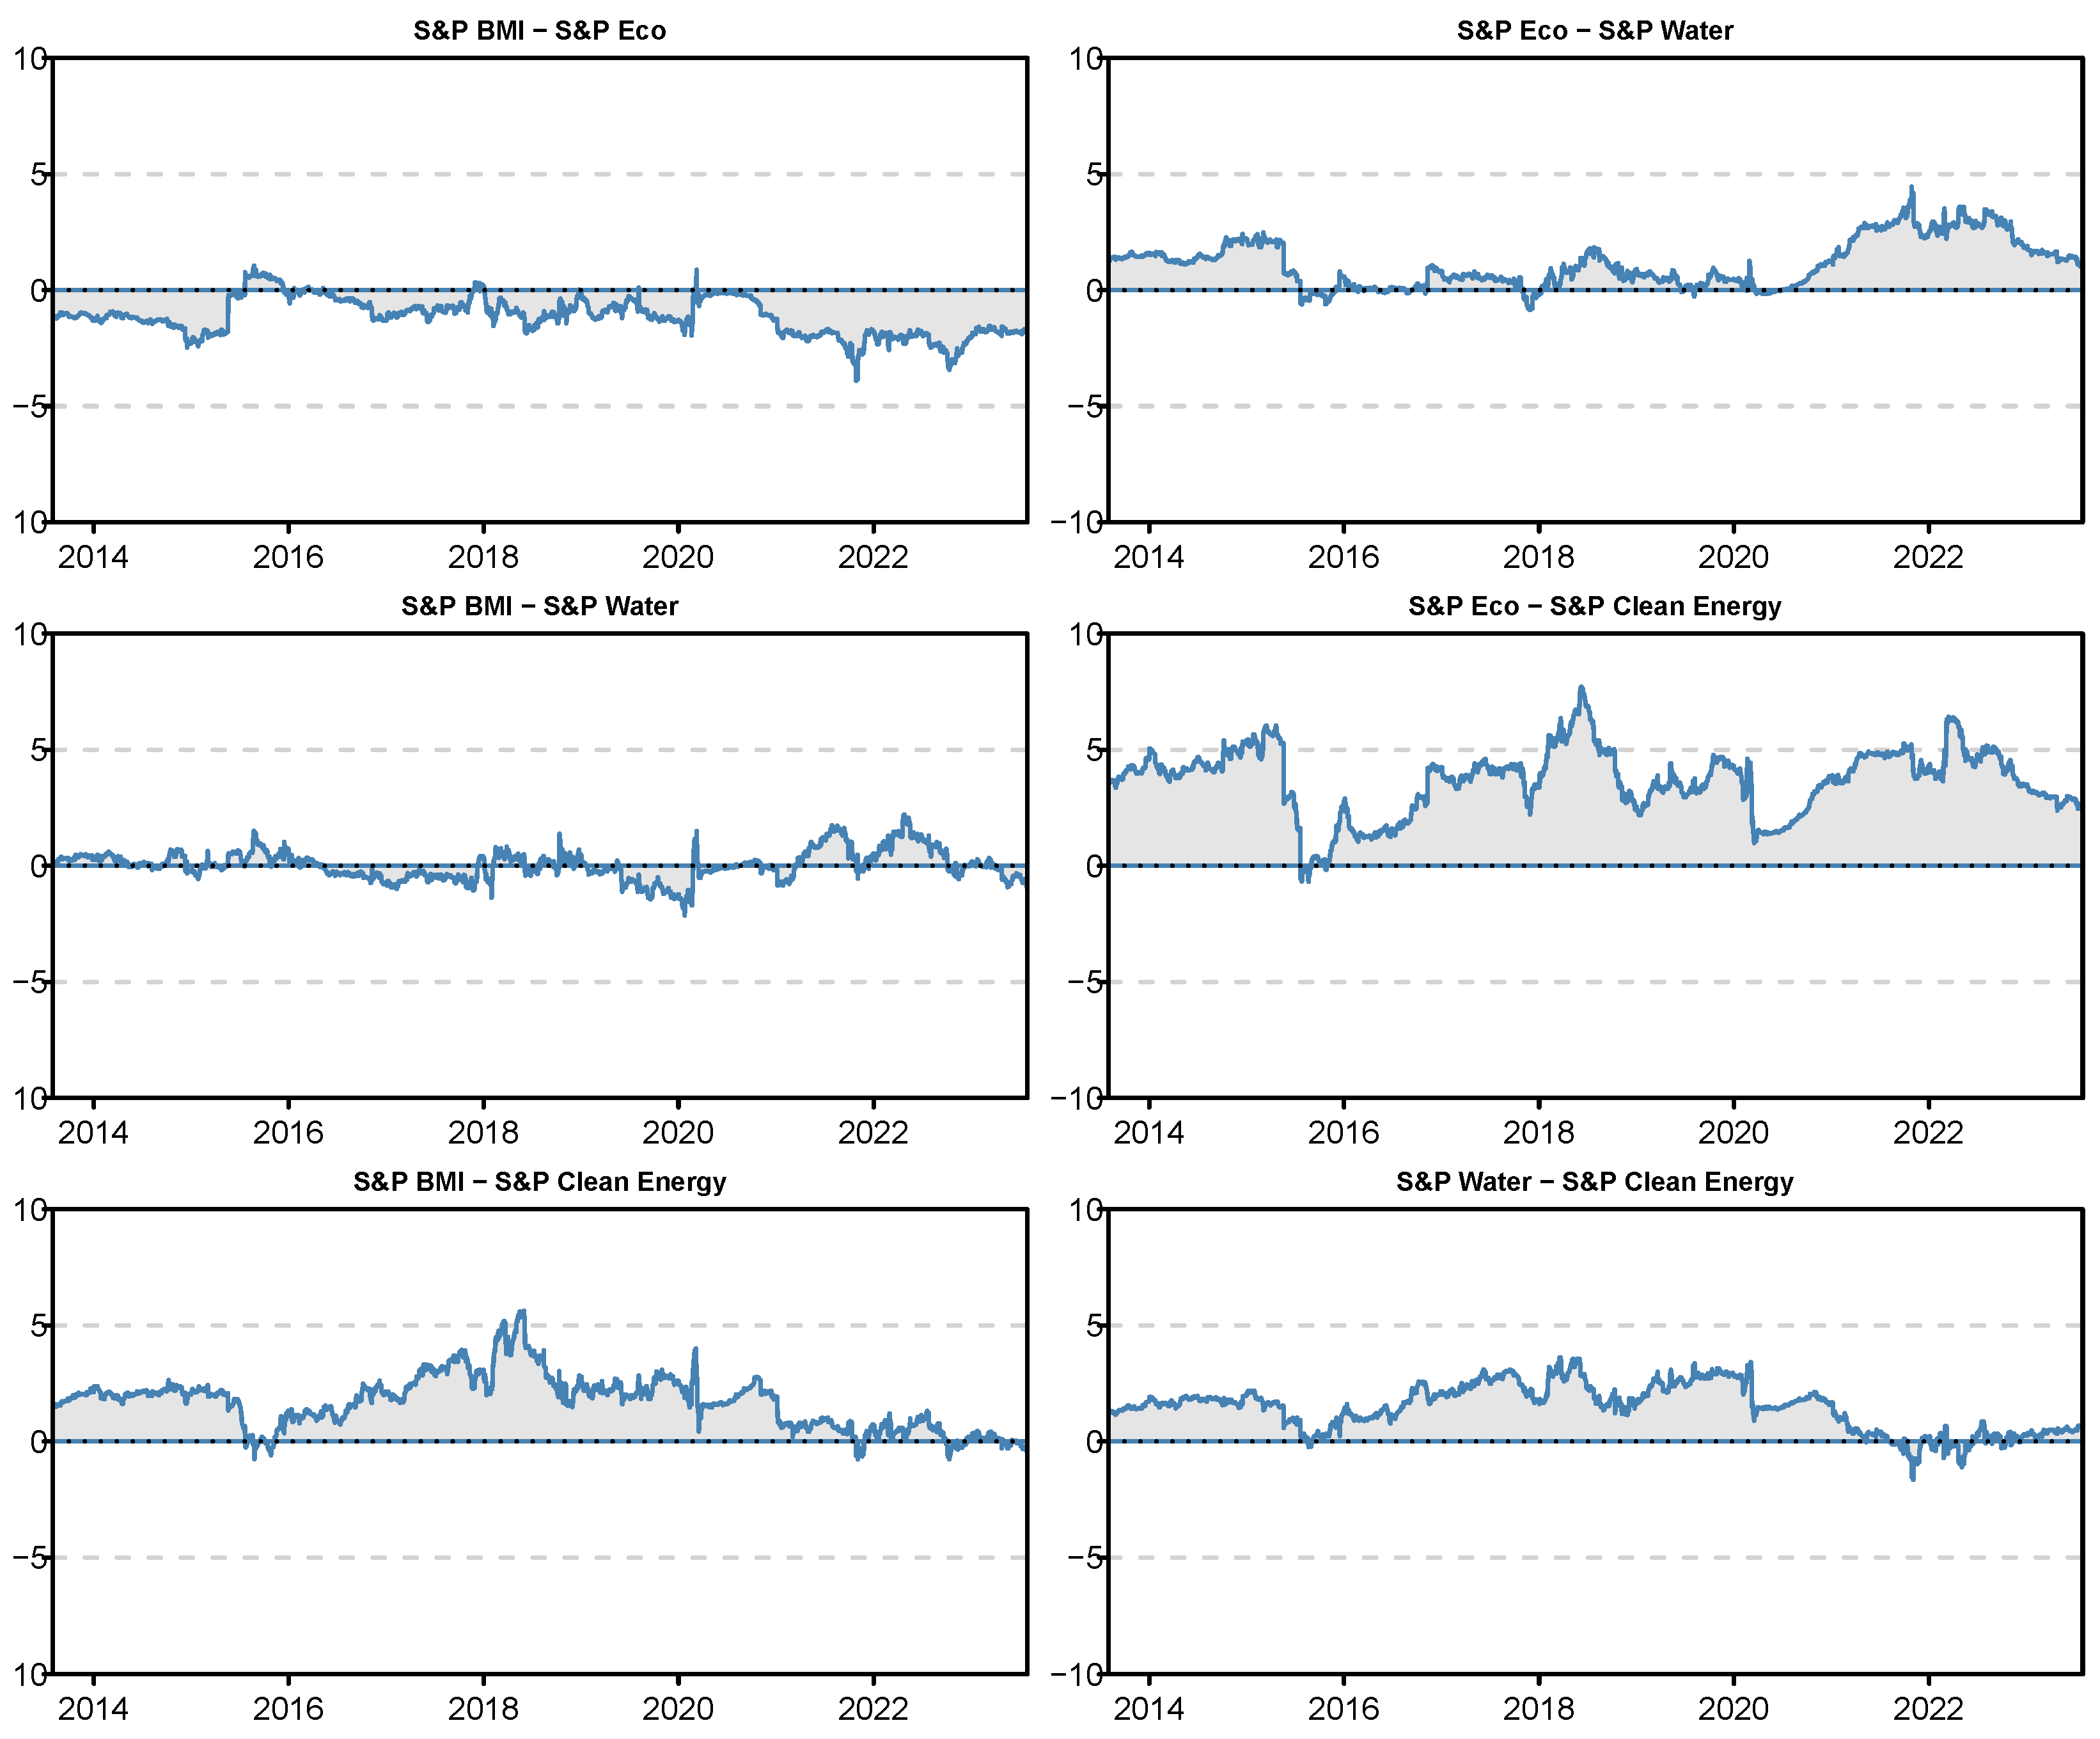
Next, we extend our analysis to directly evaluate the impact of individual green equity indices on the global equity index. This is achieved by examining the net pairwise directional connectedness, as illustrated in Figure 3. These results highlight the consistent influence of the S&P Eco Index on the S&P Global BMI, demonstrating the former’s dominance in its interactions with other green indices. The spillover dynamics between the specific-industry indices and the global market index further corroborate our earlier findings, providing a comprehensive view of interconnectedness within the green finance sector.

Figure 3.
Dynamic net pairwise spillovers.
Our analysis reveals that the dynamics of the S&P Global BMI are significantly influenced by the S&P Eco Index. This finding aligns with the research of (Liu et al. 2021) and (Madaleno et al. 2022), who have emphasized the growing importance of ecological and sustainability themes in financial markets. The increasing prominence of the S&P Eco Index in our analysis suggests a broader trend, namely, that ecological factors are becoming more integral to investment decision-making, exerting a notable impact on global market dynamics. Additionally, we observe a notable shift in the role of the S&P Water Index. Initially acting primarily as a shock transmitter, this index has transitioned to being more of a shock receiver. This change coincided with the period when the S&P Eco Index consolidated its influence, suggesting dynamic shifts within the green equity market. Such shifts may be indicative of evolving investor priorities and heightened global focus on sustainability concerns. Conversely, the S&P Clean Energy Index presents a different narrative, highlighting the sector’s complexities and its susceptibility to rapid changes. This observation is in line with the findings of (Nguyen et al. 2021), which pointed to a high correlation between clean energy and global stock prices, especially around 2018. Our results not only confirm this correlation peak but reveal that it was primarily driven by shocks transmitted from the global market to the clean energy sector. Despite the substantial growth of the clean energy market, it seems to remain susceptible to a range of factors, including internal dynamics, technological advancements, regulatory shifts, and global energy demands (Nguyen et al. 2021; Wang et al. 2022). The bilateral measures underscore a recurring theme in both the green finance literature and our empirical results, namely, that spillover effects are not static but vary over time. However, a discernible trend emerges from our analysis, suggesting increasing influence of green assets within the broader landscape of global finance.
The global landscape is undergoing transformation, with the green paradigm reshaping the contours of the financial world. The implications of this study for global investors, policymakers, and stakeholders are manifold. The growing interconnectedness between green and conventional assets suggests that global investors should carefully consider potential spillover effects when constructing their portfolios. The distinct roles played by multi-industry and specific-industry green indices highlight the need for a dynamic and flexible approach to hedging. Investors might consider diversifying their holdings across different types of green assets to mitigate the impact of sector-specific shocks. Investors can potentially hedge their exposure to the global market equity index by taking positions in green equity indices that exhibit opposite spillover patterns. For instance, during periods when the S&P Eco Index is expected to have a positive spillover effect on the global market equity index, investors could consider shorting the S&P Eco Index to offset potential losses in their global market equity holdings. However, our results reveal that the spillover effects between green and global markets are time-varying and subject to changing market conditions; thus, investors should regularly monitor these spillover patterns and adjust their hedging strategies accordingly. During periods of heightened market stress or significant shifts in the performance of green equity indices, investors may need to rebalance their hedging positions to ensure effective risk management (Pham 2021).
Recognizing the dominance of the S&P Eco Index, financial institutions could explore the development of innovative financial products or derivatives based on multi-industry green assets to offer resilience against external shocks and tap into a diverse range of eco-related industries. These industries could be selected based on sustainable resource management criteria, thereby broadening the scope of green investment opportunities. Concurrently, the global market’s evolving role as a net receiver of shocks from green indices calls for a comprehensive revision of risk assessments. Financial institutions and individual investors must be apprised of the potential vulnerability and volatility emanating from the green sector.
Regulatory authorities and policymakers should adapt to these changing dynamics as well. The increased influence of ecological themes on global market trends accentuates the need for policies that support sustainable investments. With ecological considerations now significantly influencing market trajectories, there is an opportunity for policies to actively support and promote investments that prioritize sustainability, thereby contributing to broader environmental and social objectives. Yet, the integration of green and conventional assets presents a complex scenario akin to a double-edged sword. On one side, this integration signifies a positive shift towards a more sustainable financial ecosystem, reflecting a changing investor mindset and indicating broader acceptance of ecological factors in financial decision-making. On the other side, this integration brings with it the challenge of managing spillover effects. If not carefully monitored and managed, these effects can lead to increased market volatility and risk, potentially undermining the stability of both green and conventional markets.
Furthermore, companies in ecological sectors should acknowledge the extensive impact of their strategic choices on the broader financial market. The influence of decisions related to expansions, mergers, or technological innovations extend beyond the immediate green sector, affecting global market dynamics; for example, a major merger in the renewables sector can alter investment patterns across related industries, while breakthroughs in eco-friendly technologies can redefine investment strategies far and wide. This interconnectedness bestows significant responsibility on these companies, and as such their strategic planning should consider the broader implications for market stability, public perception, and environmental sustainability.
In ensuring the robustness of our model specification, we conducted several checks of the TVP-VAR model. While this model offers the advantage of not relying on the arbitrary specification of a rolling window, it does depend on the configuration of specific parameters. To test the stability of our results under different conditions, we first extended the forecast horizon from 10 to 20 days. This alteration aimed to assess the model’s performance over a longer period. Subsequently, we adjusted the model’s internal settings, specifically by modifying the forgetting parameter , increasing it to 0.96. This change was intended to examine how a different rate of decay in the model’s learning process affected the results. Finally, we shifted the model’s initialization approach from a Bayesian to a Minnesota prior, setting to 0.01. This modification was made in order to explore the impact of a different prior assumption on the model’s output. our findings demonstrated remarkable consistency across all these variations. The adjustments in the model’s horizon, forgetting parameter, and initialization approach resulted in minimal changes to both the static and dynamic connectedness measures. This consistency reinforces the reliability of our original results, suggesting that our findings are robust against various specifications of the TVP-VAR model. The detailed results of these robustness checks are available upon request.
Finally, we extended our model to include interaction with conventional energy equities, represented by the S&P Global BMI Energy (Sector), in order to maintain consistency and comparability throughout the analysis. We acknowledge that the inclusion of the energy sector could raise endogeneity issues due to its relative weight in the S&P Global BMI (approximately 5%), which explains its exclusion from our previous analysis. However, we have included it here to provide a final robustness check. The results provided in Table A1 of the Appendix suggest that the fossil fuel sector is a net absorber of shocks originating in the global market as well as in the green sector. The passiveness running from the conventional energy sector does not alter the net position of the green indices in the previously examined transmission channels. This finding is relevant from a dynamic hedging perspective, and is largely consistent with other studies finding that traditional energy markets are vulnerable to herding and risk contagion while clean and new energy markets have steadily contributed volatility spillovers to other markets (Dragomirescu-Gaina et al. 2021; Duan et al. 2023).
6. Conclusions
Can green finance influence the dynamics of global markets? Our study underscores a significant shift in the financial landscape marked by heightened integration of green and global equity markets. Notably, the global market is increasingly becoming a net receiver of shocks, indicating the rising influence of green assets on the broader financial spectrum. This trend is particularly exemplified by the S&P Eco Index, which has emerged as a dominant force in transmitting shocks, highlighting the substantial role of multi-industry green assets in influencing global market trends. Conversely, the distinct roles played by specific-industry indices such as the S&P Clean Energy and S&P Water indices illuminate the convoluted dynamics within the green finance sector. These indices reveal how sector-specific events and policy changes can differentially impact parts of the green market, reflecting the complexity and evolving nature of this sector.
The implications of these findings are manifold. Global investors should carefully consider potential time-varying spillover effects when constructing their portfolios. The distinct roles played by multi-industry and specific-industry green indices highlight the need for a flexible approach to hedging. Investors might consider diversifying their holdings across different types of green assets in order to mitigate the impact of sector-specific shocks, while financial institutions might find new opportunities in creating financial products that leverage the stability and growth potential of multi-industry green assets. In the face of increasing interconnectedness, regulatory bodies are tasked with a dual challenge around fostering sustainable investments while safeguarding against potential market vulnerabilities that could arise from this interconnectedness. Moreover, companies operating within ecological sectors should carefully consider the broader implications of their decisions on global market dynamics.
The methodological choices we have made bring their own limitations to this study. While we do not dismiss the effects that alternative transmission channels and common factors, such as economic policies, instabilities, and uncertainty, may have in driving the transmission channels between green and conventional financial markets, in order for spillovers to persist these factors should have an asymmetric impact on green and conventional markets. Therefore, examining such effects may constitute a relevant topic for future research. Another inherent limitation of using international indices relates to the currency in which price or total returns are reported, usually US Dollars; as global indices are enlarged, and as more companies traded on non-USD-denominated exchanges join these indices, the index dynamics may be increasingly influenced by exchange rate fluctuations. A possible workaround may be the recalculation of these indices according to currency factors, in line with the work of (Aloosh and Bekaert 2022) and (Trancoso and Gomes 2023). Looking further ahead, future studies could extend our findings by comparing a wider range of green indices with their respective parent indices, thereby providing a more comprehensive view of the green finance landscape. An in-depth granular examination of the factors driving the distinct dynamics between multi-industry and specific-industry green indices would further enrich our understanding of this evolving field.
Author Contributions
Conceptualization, and methodology, T.T.; software, validation, and formal analysis, T.T. and S.G.; investigation, resources, data curation, T.T. and S.G.; writing—original draft preparation, writing—review and editing, T.T. and S.G. All authors have read and agreed to the published version of the manuscript.
Funding
T. Trancoso acknowledges this work was developed within the scope of the project proMetheus—Research Unit on Materials, Energy and Environment for Sustainability, FCT Ref. UID/05975/2020, financed by national funds through the FCT/MCTES.
Informed Consent Statement
Not applicable.
Data Availability Statement
The data presented in this study are available on request from the corresponding author.
Conflicts of Interest
The authors declare no potential conflicts of interest related to the publication of this paper.
Appendix A
Table A1.
Average connectedness among equity indices.
Table A1.
Average connectedness among equity indices.
| S&P BMI | S&P Eco | S&P Energy | S&P Water | S&P Clean Energy | FROM | |
|---|---|---|---|---|---|---|
| S&P BMI | 29.96 | 18.69 | 14.41 | 22.38 | 14.56 | 70.04 |
| S&P Eco | 18.97 | 30.65 | 8.08 | 21.60 | 20.69 | 69.35 |
| S&P Energy | 20.47 | 10.96 | 43.39 | 14.28 | 10.89 | 56.61 |
| S&P Water | 23.33 | 22.01 | 10.65 | 30.95 | 13.06 | 69.05 |
| S&P Clean Energy | 16.90 | 23.82 | 9.11 | 14.55 | 35.63 | 64.37 |
| TO | 79.67 | 75.48 | 42.25 | 72.80 | 59.21 | 329.42 |
| Inc.Own | 109.63 | 106.14 | 85.64 | 103.75 | 94.84 | cTCI/TCI |
| NET | 9.63 | 6.14 | −14.36 | 3.75 | −5.16 | 82.35/65.88 |
Notes: This table shows the connectedness values between the S&P Global BMI, S&P Global Eco Index, S&P Global Energy (Sector), S&P Global Water Index, and S&P Global Clean Energy Index (subsample: 28 February 2014–31 July 2023; indices have been re-based at 100 at the start of the subsample).
References
- Alamgir, Muhammad, and Ming-Chang Cheng. 2023. Do green bonds play a role in achieving sustainability? Sustainability 15: 10177. [Google Scholar] [CrossRef]
- Aloosh, Arash, and Geert Bekaert. 2022. Currency factors. Management Science 68: 4042–64. [Google Scholar] [CrossRef]
- Antonakakis, Nikolaos, Ioannis Chatziantoniou, and David Gabauer. 2020. Refined measures of dynamic connectedness based on time-varying parameter vector autoregressions. Journal of Risk and Financial Management 13: 84. [Google Scholar] [CrossRef]
- Arif, Muhammad, Mudassar Hasan, Suha M. Alawi, and Muhammad Abubakr Naeem. 2021. COVID-19 and time-frequency connectedness between green and conventional financial markets. Global Finance Journal 49: 100650. [Google Scholar] [CrossRef]
- Broadstock, David C., and Louis T.W. Cheng. 2019. Time-varying relation between black and green bond price benchmarks: Macroeconomic determinants for the first decade. Finance Research Letters 29: 17–22. [Google Scholar] [CrossRef]
- Broadstock, David C., Ioannis Chatziantoniou, and David Gabauer. 2022. Minimum connectedness portfolios and the market for green bonds: Advocating socially responsible investment (SRI) activity. In Applications in Energy Finance. Berlin/Heidelberg: Springer International Publishing, pp. 217–53. [Google Scholar] [CrossRef]
- Chai, Shanglei, Wenjun Chu, Zhen Zhang, Zhilong Li, and Mohammad Zoynul Abedin. 2022. Dynamic nonlinear connectedness between the green bonds, clean energy, and stock price: The impact of the COVID-19 pandemic. Annals of Operations Research 2022: 1–28. [Google Scholar] [CrossRef] [PubMed]
- Chatziantoniou, Ioannis, Emmanuel Joel Aikins Abakah, David Gabauer, and Aviral Kumar Tiwari. 2022. Quantile time-frequency price connectedness between green bond, green equity, sustainable investments and clean energy markets. Journal of Cleaner Production 361: 132088. [Google Scholar] [CrossRef]
- Diebold, Francis X., and Kamil Yilmaz. 2009. Measuring financial asset return and volatility spillovers, with application to global equity markets. The Economic Journal 119: 158–71. [Google Scholar] [CrossRef]
- Dragomirescu-Gaina, Catalin, Emilios Galariotis, and Dionisis Philippas. 2021. Chasing the “green bandwagon” in times of uncertainty. Energy Policy 151: 112190. [Google Scholar] [CrossRef]
- Duan, Xiaoping, Ya Xiao, Xiaohang Ren, Farhad Taghizadeh-Hesary, and Kun Duan. 2023. Dynamic spillover between traditional energy markets and emerging green markets: Implications for sustainable development. Resources Policy 82: 103483. [Google Scholar] [CrossRef]
- Dutordoir, Marie, Shuyu Li, and João Quariguasi Frota Neto. 2023. Issuer motivations for corporate green bond offerings. British Journal of Management 00: 1–25. [Google Scholar] [CrossRef]
- Ferrer, Román, Syed Jawad Hussain Shahzad, and Pilar Soriano. 2021. Are green bonds a different asset class? Evidence from time-frequency connectedness analysis. Journal of Cleaner Production 292: 125988. [Google Scholar] [CrossRef]
- Gao, Yang, Yangyang Li, and Yaojun Wang. 2021. Risk spillover and network connectedness analysis of china’s green bond and financial markets: Evidence from financial events of 2015–2020. The North American Journal of Economics and Finance 57: 101386. [Google Scholar] [CrossRef]
- Hammoudeh, Shawkat, Ahdi Noomen Ajmi, and Khaled Mokni. 2020. Relationship between green bonds and financial and environmental variables: A novel time-varying causality. Energy Economics 92: 104941. [Google Scholar] [CrossRef]
- He, Xubiao, and Jiaojiao Shi. 2023. The effect of air pollution on chinese green bond market: The mediation role of public concern. Journal of Environmental Management 325: 116522. [Google Scholar] [CrossRef] [PubMed]
- Jiang, Wei, Lingfei Dong, and Xinyi Liu. 2023. How does COVID-19 affect the spillover effects of green finance, carbon markets, and renewable/non-renewable energy markets? Evidence from china. Energy 281: 128351. [Google Scholar] [CrossRef]
- Karim, Sitara, and Muhammad Abubakr Naeem. 2022. Do global factors drive the interconnectedness among green, islamic and conventional financial markets? International Journal of Managerial Finance 18: 639–60. [Google Scholar] [CrossRef]
- Liu, Nana, Chuanzhe Liu, Bowen Da, Tong Zhang, and Fangyuan Guan. 2021. Dependence and risk spillovers between green bonds and clean energy markets. Journal of Cleaner Production 279: 123595. [Google Scholar] [CrossRef]
- Lu, Xunfa, Nan Huang, Jianlei Mo, and Zhitao Ye. 2023. Dynamics of the return and volatility connectedness among green finance markets during the COVID-19 pandemic. Energy Economics 125: 106860. [Google Scholar] [CrossRef]
- Lundgren, Amanda Ivarsson, Adriana Milicevic, Gazi Salah Uddin, and Sang Hoon Kang. 2018. Connectedness network and dependence structure mechanism in green investments. Energy Economics 72: 145–53. [Google Scholar] [CrossRef]
- MacAskill, S., E. Roca, B. Liu, R. A. Stewart, and O. Sahin. 2021. Is there a green premium in the green bond market? Systematic literature review revealing premium determinants. Journal of Cleaner Production 280: 124491. [Google Scholar] [CrossRef]
- Madaleno, Mara, Eyup Dogan, and Dilvin Taskin. 2022. A step forward on sustainability: The nexus of environmental responsibility, green technology, clean energy and green finance. Energy Economics 109: 105945. [Google Scholar] [CrossRef]
- Mensi, Walid, Muhammad Abubakr Naeem, Xuan Vinh Vo, and Sang Hoon Kang. 2022. Dynamic and frequency spillovers between green bonds, oil and G7 stock markets: Implications for risk management. Economic Analysis and Policy 73: 331–44. [Google Scholar] [CrossRef]
- Naeem, Muhammad Abubakr, and Sitara Karim. 2021. Tail dependence between bitcoin and green financial assets. Economics Letters 208: 110068. [Google Scholar] [CrossRef]
- Naeem, Muhammad Abubakr, Imen Mbarki, Majed Alharthi, Abdelwahed Omri, and Syed Jawad Hussain Shahzad. 2021a. Did COVID-19 impact the connectedness between green bonds and other financial markets? Evidence from time-frequency domain with portfolio implications. Frontiers in Environmental Science 9: 657533. [Google Scholar] [CrossRef]
- Naeem, Muhammad Abubakr, Saqib Farid, Román Ferrer, and Syed Jawad Hussain Shahzad. 2021b. Comparative efficiency of green and conventional bonds pre- and during COVID-19: An asymmetric multifractal detrended fluctuation analysis. Energy Policy 153: 112285. [Google Scholar] [CrossRef]
- Nguyen, Thi Thu Ha, Muhammad Abubakr Naeem, Faruk Balli, Hatice Ozer Balli, and Xuan Vinh Vo. 2021. Time-frequency comovement among green bonds, stocks, commodities, clean energy, and conventional bonds. Finance Research Letters 40: 101739. [Google Scholar] [CrossRef]
- Pham, Linh. 2016. Is it risky to go green? A volatility analysis of the green bond market. Journal of Sustainable Finance & Investment 6: 263–91. [Google Scholar] [CrossRef]
- Pham, Linh. 2021. Frequency connectedness and cross-quantile dependence between green bond and green equity markets. Energy Economics 98: 105257. [Google Scholar] [CrossRef]
- Pham, Linh, and Canh Phuc Nguyen. 2021. Asymmetric tail dependence between green bonds and other asset classes. Global Finance Journal 50: 100669. [Google Scholar] [CrossRef]
- Reboredo, Juan C. 2018. Green bond and financial markets: Co-movement, diversification and price spillover effects. Energy Economics 74: 38–50. [Google Scholar] [CrossRef]
- Reboredo, Juan C., and Andrea Ugolini. 2020. Price connectedness between green bond and financial markets. Economic Modelling 88: 25–38. [Google Scholar] [CrossRef]
- Saeed, Tareq, Elie Bouri, and Hamed Alsulami. 2021. Extreme return connectedness and its determinants between clean/green and dirty energy investments. Energy Economics 96: 105017. [Google Scholar] [CrossRef]
- Sangiorgi, Ivan, and Lisa Schopohl. 2021. Why do institutional investors buy green bonds: Evidence from a survey of european asset managers. International Review of Financial Analysis 75: 101738. [Google Scholar] [CrossRef]
- Tang, Dragon Yongjun, and Yupu Zhang. 2020. Do shareholders benefit from green bonds? Journal of Corporate Finance 61: 101427. [Google Scholar] [CrossRef]
- Tiwari, Aviral Kumar, Emmanuel Joel Aikins Abakah, David Gabauer, and Richard Adjei Dwumfour. 2022. Dynamic spillover effects among green bond, renewable energy stocks and carbon markets during COVID-19 pandemic: Implications for hedging and investments strategies. Global Finance Journal 51: 100692. [Google Scholar] [CrossRef] [PubMed]
- Trancoso, Tiago, and Sofia Gomes. 2023. Beyond the dollar: A global perspective on exchange rate dynamics via currency factors. Finance Research Letters 58: 104261. [Google Scholar] [CrossRef]
- Wang, Xiong, Jingyao Li, and Xiaohang Ren. 2022. Asymmetric causality of economic policy uncertainty and oil volatility index on time-varying nexus of the clean energy, carbon and green bond. International Review of Financial Analysis 83: 102306. [Google Scholar] [CrossRef]
- Wei, Ping, Yinshu Qi, Xiaohang Ren, and Giray Gozgor. 2023. The role of the COVID-19 pandemic in time-frequency connectedness between oil market shocks and green bond markets: Evidence from the wavelet-based quantile approaches. Energy Economics 121: 106657. [Google Scholar] [CrossRef]
- Zerbib, Olivier David. 2019. The effect of pro-environmental preferences on bond prices: Evidence from green bonds. Journal of Banking & Finance 98: 39–60. [Google Scholar] [CrossRef]
- Zhang, Dongna, Xihui Haviour Chen, Chi Keung Marco Lau, and Yifei Cai. 2023. The causal relationship between green finance and geopolitical risk: Implications for environmental management. Journal of Environmental Management 327: 116949. [Google Scholar] [CrossRef] [PubMed]
- Zhang, Yafei, and Muhammad Umair. 2023. Examining the interconnectedness of green finance: An analysis of dynamic spillover effects among green bonds, renewable energy, and carbon markets. Environmental Science and Pollution Research 30: 77605–21. [Google Scholar] [CrossRef]
- Zhou, Xiaoguang, Xinmeng Tang, and Rui Zhang. 2020. Impact of green finance on economic development and environmental quality: A study based on provincial panel data from china. Environmental Science and Pollution Research 27: 19915–32. [Google Scholar] [CrossRef] [PubMed]
Disclaimer/Publisher’s Note: The statements, opinions and data contained in all publications are solely those of the individual author(s) and contributor(s) and not of MDPI and/or the editor(s). MDPI and/or the editor(s) disclaim responsibility for any injury to people or property resulting from any ideas, methods, instructions or products referred to in the content. |
© 2024 by the authors. Licensee MDPI, Basel, Switzerland. This article is an open access article distributed under the terms and conditions of the Creative Commons Attribution (CC BY) license (https://creativecommons.org/licenses/by/4.0/).