
Estimating Spillover Effect from International Oil Market to Stock Market: Evidence from Korean Portfolio-Level Analysis

Department of International Commerce, Faculty of Economics and Commerce, Keimyung University, Daegu 42601, Republic of Korea
Economies 2024, 12(4), 92; https://doi.org/10.3390/economies12040092
Submission received: 12 March 2024
/
Revised: 4 April 2024
/
Accepted: 10 April 2024
/
Published: 15 April 2024
Abstract
:Using a diagonal BEKK model, this paper estimates a spillover effect from the international crude oil market to the Korean stock market. Empirical results suggest that shocks and volatility in Dubai oil prices are significantly transmitted into twenty portfolios of the Korean stock market. Also, it was found that these spillover effects dramatically rose during the year 2020, when the threat of COVID-19 was the most serious. More specifically, oil-oriented portfolios, such as the power and gas firms’ portfolio and chemical firms’ portfolio, had a greater spillover effect from the international crude oil market rather than other portfolios. Further, compared to larger-capitalization firm portfolios, small-capitalization firm portfolios had a relatively greater spillover effect. Several implications and important avenues for further research are identified.
1. Introduction
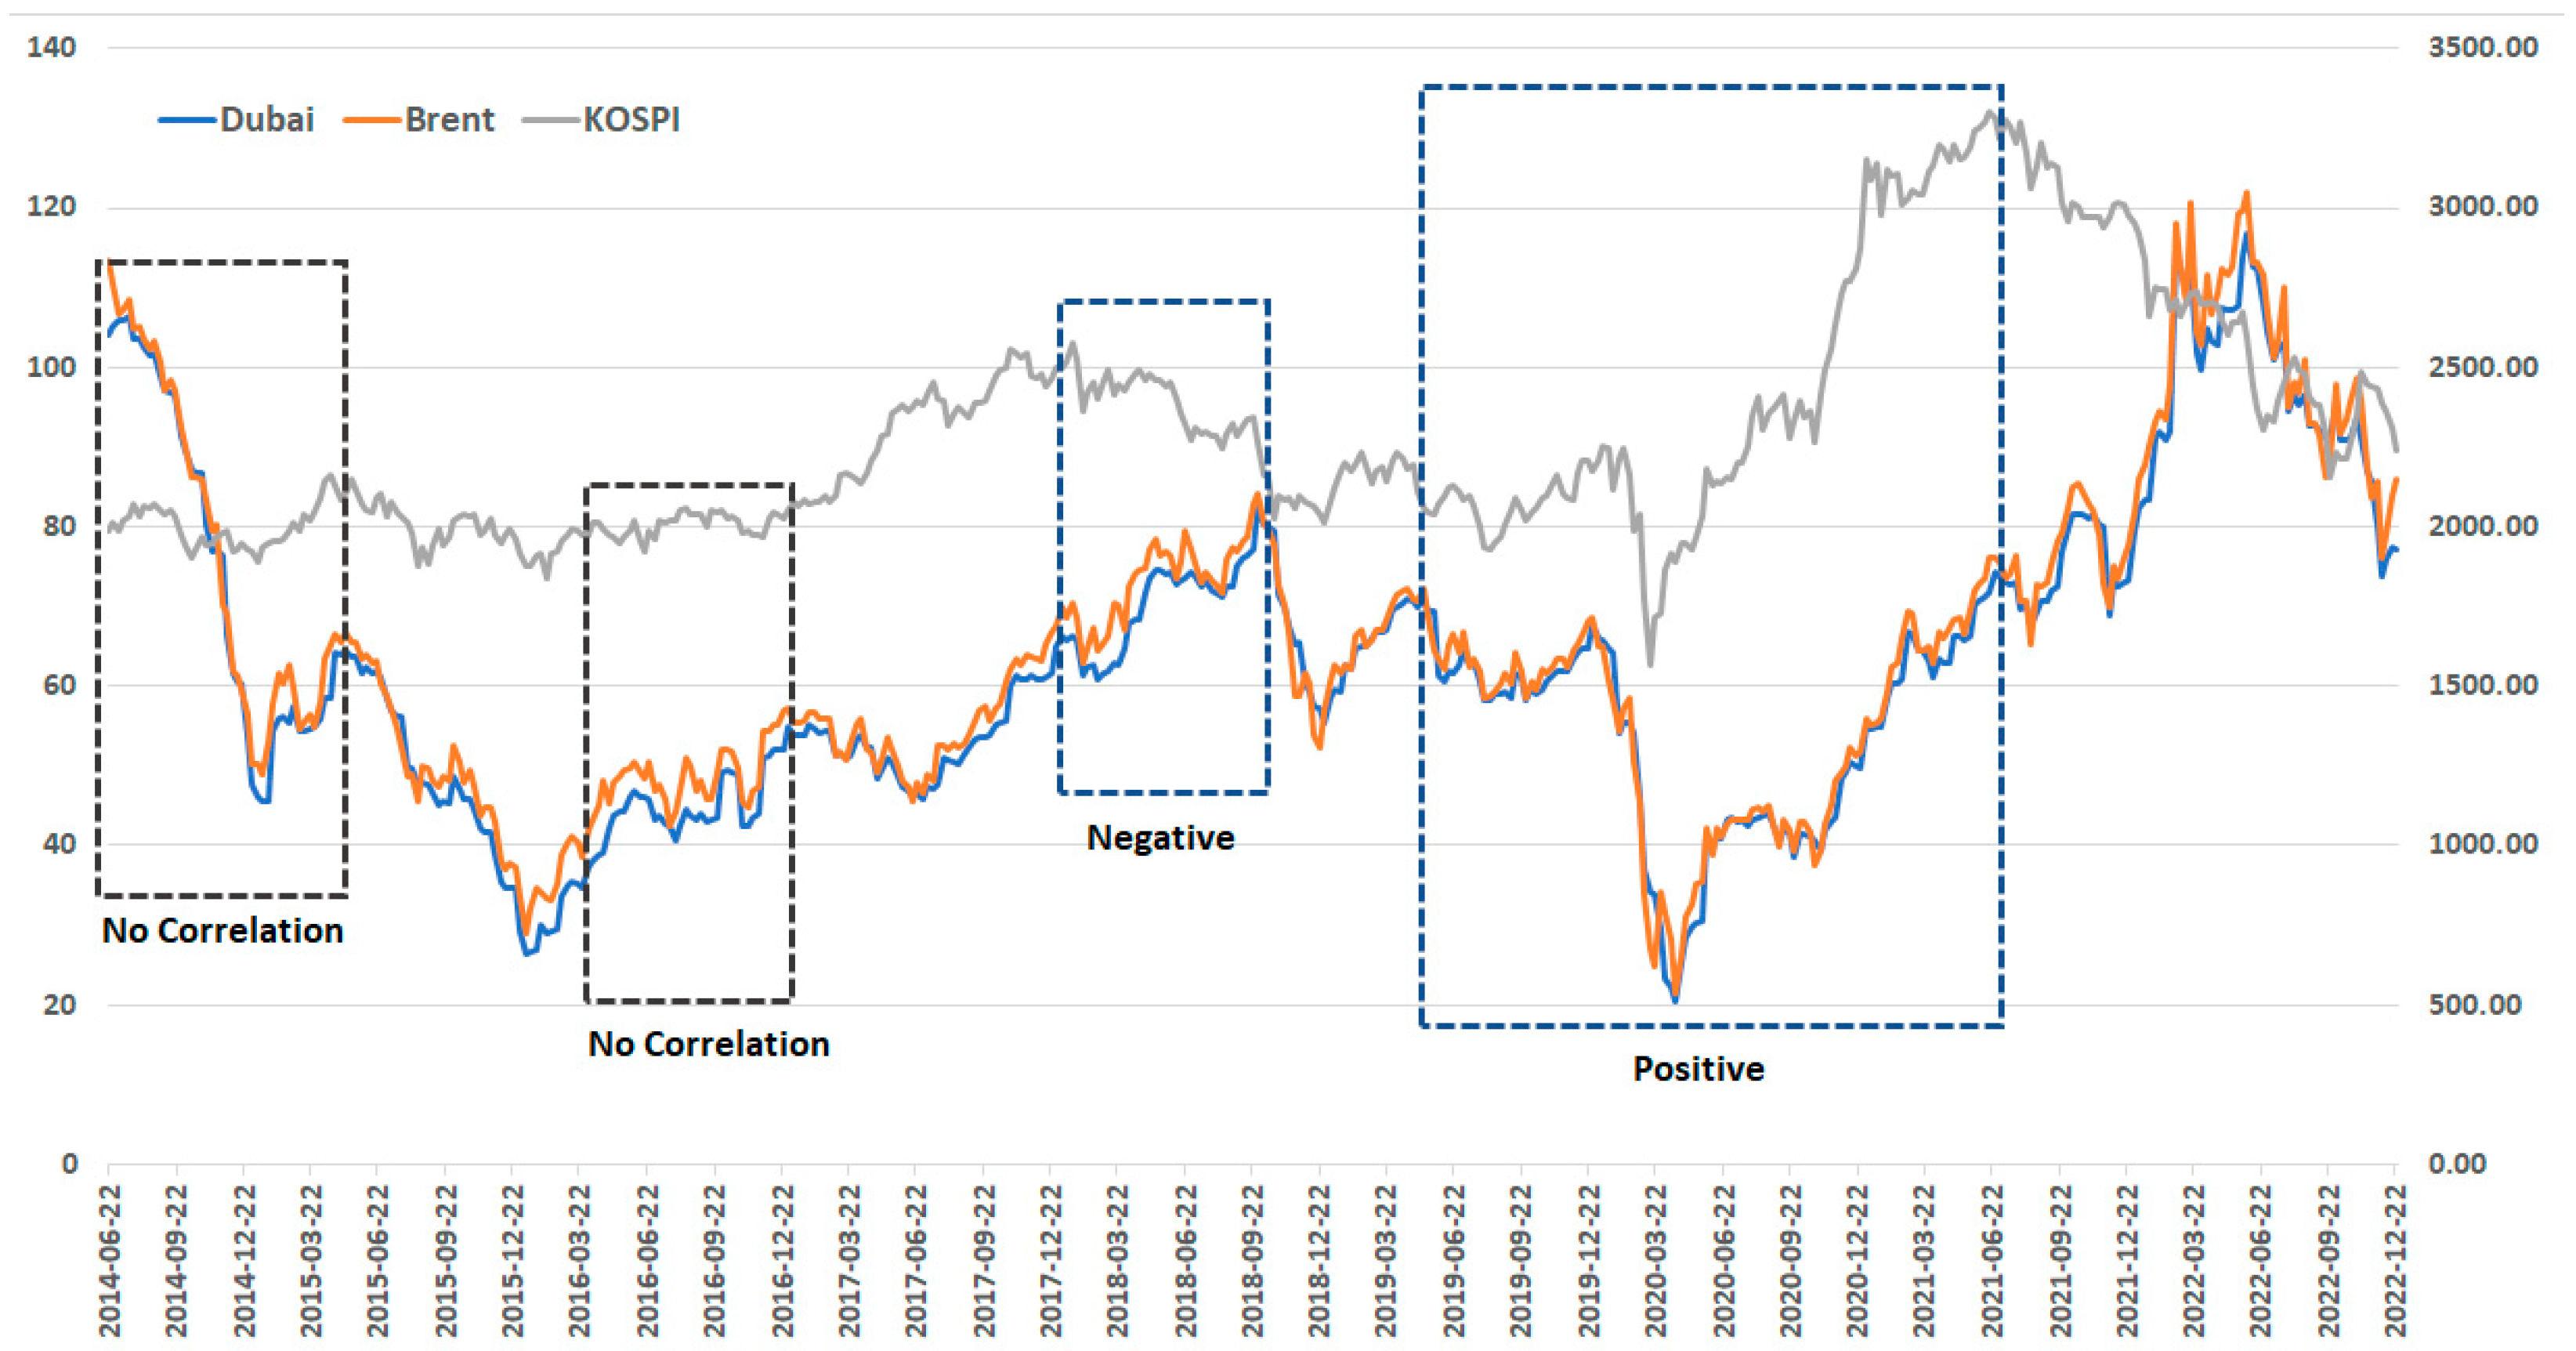
The relationship between international oil prices and stock markets has been brought to the attention of investors, policymakers, and even the general public in recent years because oil prices have been showing dramatic volatility during the past decade. As Figure 1 displays, the weekly forecasted prices of international crude oils moved dramatically between 2014 and 2022. The oil prices that had been above 100 USD per barrel in the first half of 2014 began to fall below 30 USD in December 2015. As of the year 2016, the oil prices gradually rose and recovered to 80 USD in July 2018 but immediately plunged about 60 USD and then remained in the range of 60–70 USD until 2019. In the year 2020, when COVID-19 occurred, the oil price collapsed to 20 USD and then continued to rise and reached 120 USD. The oil price declined again and moved to around 80 USD in December 2022.
These surges and falls in oil prices are expected to affect stock markets because oil is a crucial source for the modern economic system. However, the effect does not necessarily exhibit a stable pattern. As Figure 1 shows, in the case of the Republic of Korea (hereafter Korea), the pattern of the oil/stock market relationship varies with time. There were periods of positive or negative relationships, and even seemingly no relationship, between the oil prices and the KOSPI index, which is a proxy for the Korean stock market. For the first “no correlation” box, which corresponds to the period from the 1st week of June 2014 to the 4th week of May 2015, the correlation coefficient between the oil prices (either Dubai or Brent) and KOSPI is calculated as 0.096. The second “no correlation” box with stable movements in KOSPI, although oil price movements fluctuated from the 1st week of April 2016 to the 4th week of December 2016, has quite a low correlation, which is 0.19. The third and fourth box shows the negative and positive relationship between oil prices and Korean stock prices, respectively, which supports the argument that the oil/stock relationship is unstable over time.
Motivated by the observation of dramatic changes in oil prices and inconclusive patterns of oil/stock relationships over time, this paper aims to investigate a time-varying spillover effect from oil market volatility to stock market volatility with an industry-specific dataset, especially for the case of Korea. The aim of this paper is also meaningful for dealing with three research questions that have not been resolved in the oil/price research field. First, the Korean case helps discover clear patterns of oil/stock relationships due to its higher economic vulnerability to changes in international oil prices. According to the Ministry of Foreign Affairs of Republic of Korea (2021), Korea is known as the 8th largest energy consumer in the world, and 94.8% of the large energy consumption depends on imported oil. Second, portfolio-specific analysis is useful for detecting differences in the oil/price relationship across portfolios, unlike the aggregated analysis by most previous studies. Third, time-varying analysis, instead of time-static analysis, is suitable for handling the dynamic relationship pattern over time. Moreover, the time span for time-varying analysis includes the years of the COVID-19 pandemic, which contributes to suggesting significant evidence of the oil/stock market linkage for the turbulent time of international commodity and financial markets.
As the scope and the target of research, this paper estimates a weekly time-varying spillover effect from 2014 to 2022 by using a diagonal BEEK model, which is suggested as an appropriate model by existing studies. The main results are as follows: First, for the entire sample period, this paper finds that shocks and volatility in the Dubai oil market were transmitted into the Korean stock market. In particular, these spillover effects dramatically rose during the year 2020, when the threat of COVID-19 was the most serious. Second, among a variety of classified portfolios, this paper finds that the spillover effect during the year 2020 was the greatest for the energy-oriented portfolios, such as electricity, gas, and chemicals, rather than other industrial portfolios. Further, it is found that small-capitalization portfolios had a greater spillover effect from the oil market than large-capitalization portfolios, which supports the intuition that small firms have lower operational and financial capability to manage external risk and uncertainty than large firms.
The remainder of this paper is organized as follows. Section 2 briefly reviews the related literature and the limitations to be overcome, and Section 3 explains the data and methodology, respectively. Section 4 provides the empirical results. Section 5 summarizes the study and suggests key implications for further research.
2. Literature Review
The relationship between international oil prices and the stock market has long been an intriguing topic in economic research. In particular, since 2008 when various global economic crises frequently emerged and hit both the oil markets and stock markets, the research interests in the oil/stock relationship have been growing remarkably. The number of papers investigating the oil/stock relationships published in top-ranked journals, on average, was about 1.9 during 1997–2007 but increased to 13.1 during 2008–2017 (Degiannakis et al. 2018), which shows a more than six times rate of growth before and after 2008.
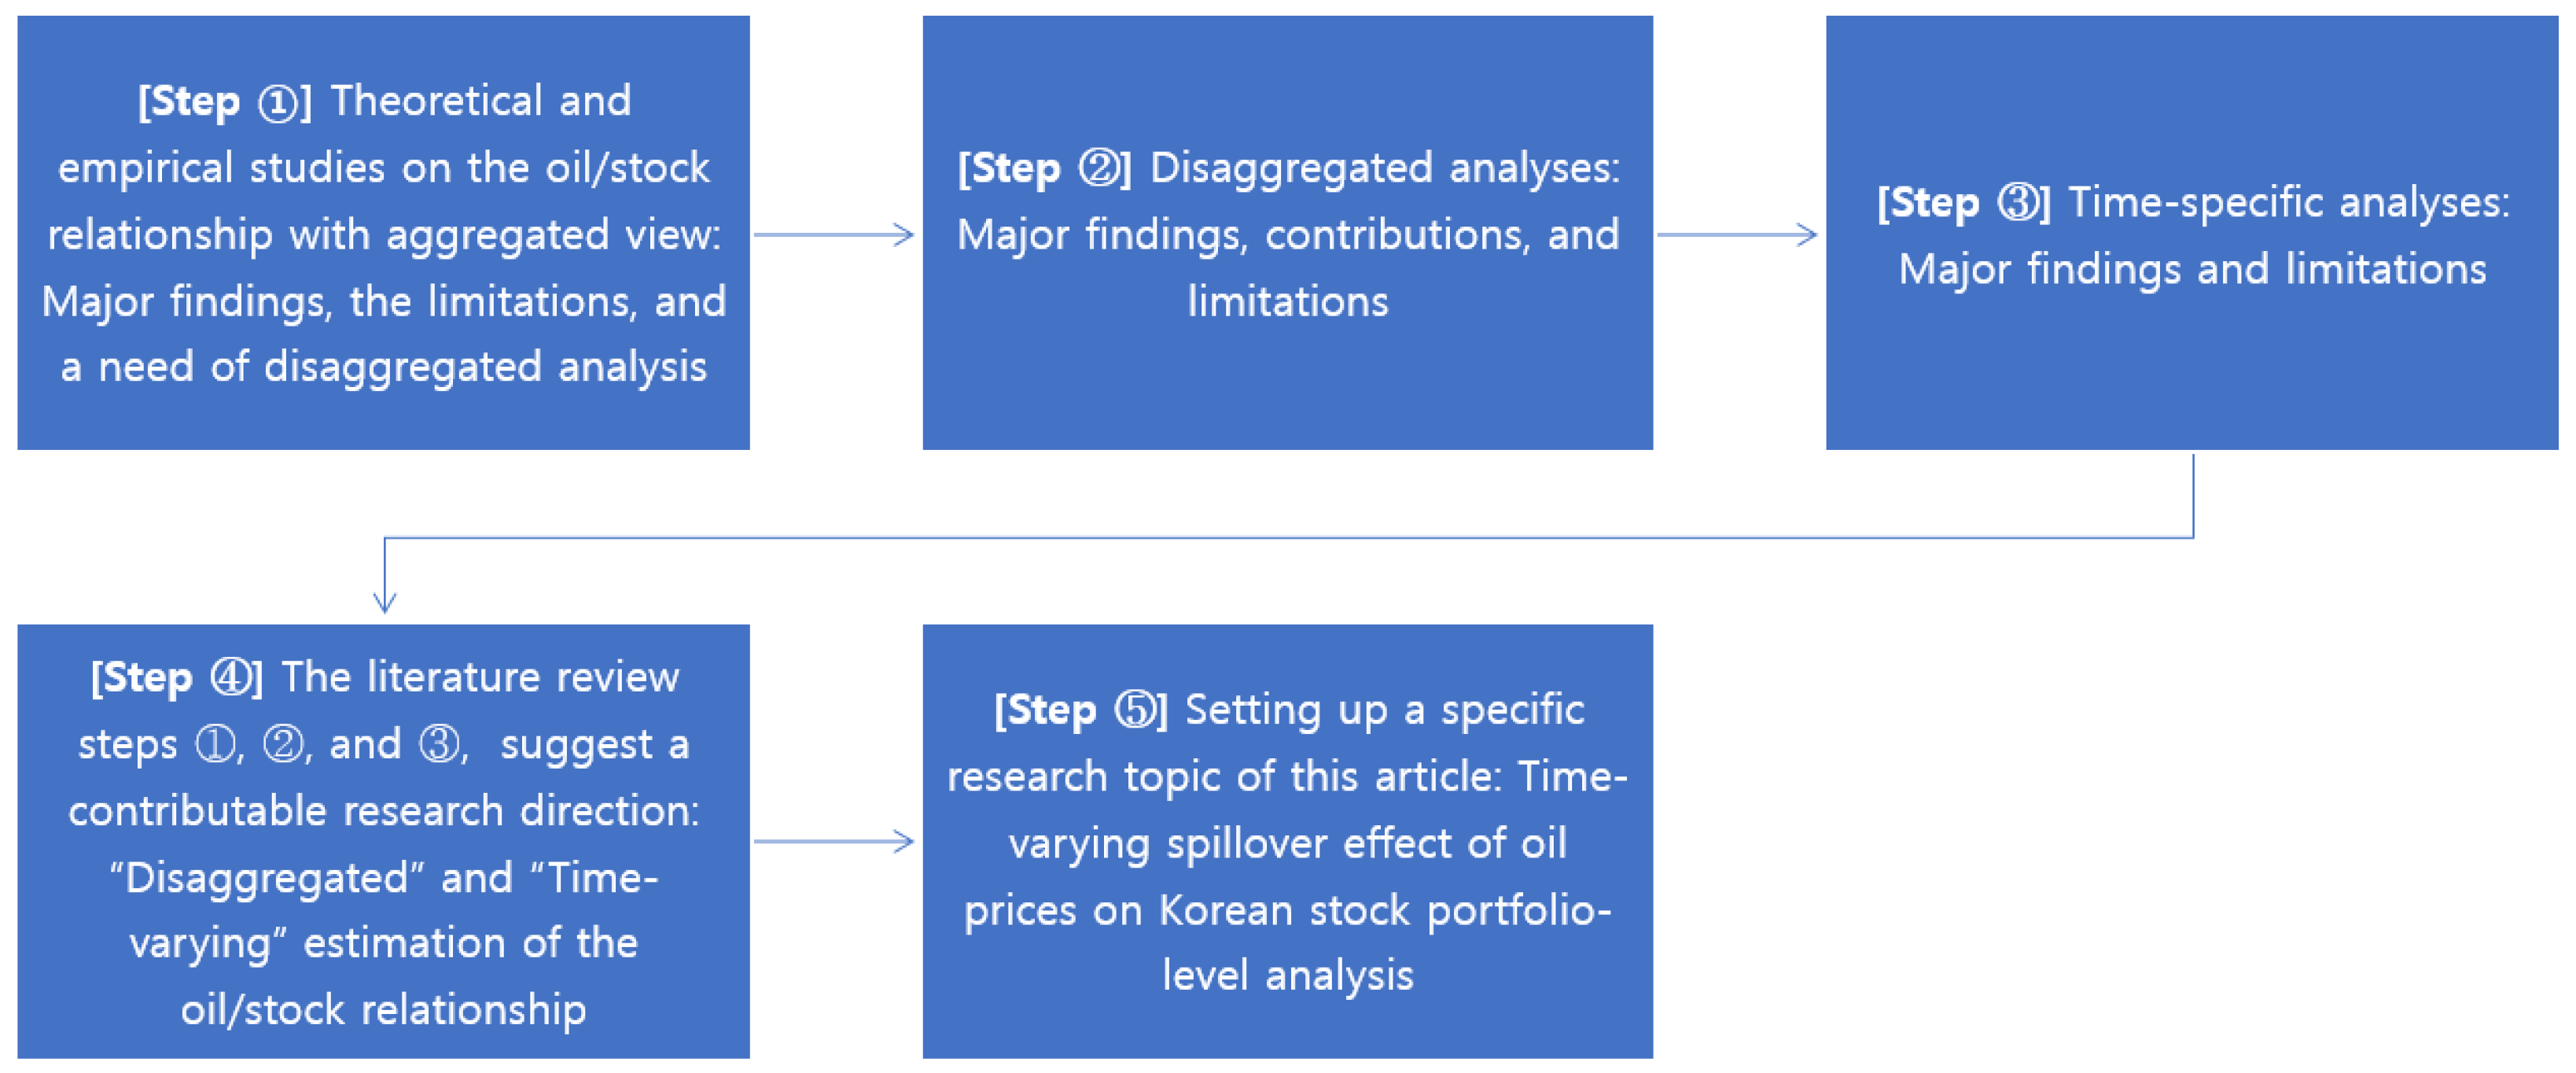
In order for a clearer presentation, we provide the steps of our literature review work in Figure 2. As the fundamental work, the first step is to review the theoretical background and channel for explaining the effect of oil prices on stock prices. The earliest empirical analyses with the theoretical results were mostly about aggregated estimation. Therefore, the first step of the review focuses on summarizing the major findings as well as the limitations of empirical studies by aggregated approaches. Then, for the second step, the focus of our review moves naturally to the disaggregated empirical analyses because the need for disaggregated analyses was brought by the limitations of the aggregated analysis in the first step. In addition to the empirical studies with disaggregated approaches, we reviewed the literature on the time-specific analyses for the third step because the need for specifying the time sample was emerging and growing too. Consequently, these steps of our literature review lead to a specific research topic that may contribute to the existing literature on the oil/price relationship, which is the time-varying spillover effect of oil prices on the Korean stock portfolio-level analysis.
For the first step, we review the theoretical framework for the oil/stock relationship and find that the results are well-documented. The results suggest several transmission mechanisms with macroeconomic perspectives. Three primary mechanisms are summarized in this review, which are the monetary channel, the aggregate output channel, and the uncertainty channel. These channels explain the negative effect of oil prices on stock prices, in general. The specific explanation for each channel is suggested as follows:
First, the monetary channel focuses on inflation and interest rates. Rising oil prices are expected to cause inflation because production costs and retail prices are under pressure to rise (Gagliardone and Gertler 2023; Kilian and Zhou 2022; Hamilton 1988, 2003). Such inflation expectation influences monetary policy-makers to decide to raise short-term interest rates under the assumption that their policy target is to stabilize the higher price levels by following the Tayler’s Rule (Basher and Sadorsky 2006). The Tayler’s Rule is designed to approximate the response of short-term nominal interest rates, as these are set by the central bank when economic conditions change (Tayler 1993). As a result, raised interest rates increase the borrowing costs of the firm, which deteriorates the firm’s cash flow, which is the most essential factor of stock prices of firms. Second, the output channel focuses on the household’s income and aggregate output. Rising oil prices lead to lower discretionary income of households due to higher retail prices of commodities and services in most economies (Svensson 2005, 2006). The negative relationship between oil prices and income holds for most of the oil-importing countries in the world. However, in the case of oil-exporting countries, the income increases when the oil price rises due to increased oil revenue. Since this paper deals with the case of Korea, which is an oil-importing country, the literature review on the output channel focuses on the oil-importing case. Such lowered income leads to lower consumption and lower aggregate output, which deteriorates the cash flow of firms, which is the factor of stock prices in value (Hamilton 1983, 2003; Kilian 2008). Third, the uncertainty channel points out the higher uncertainty generated by higher oil price volatility because higher uncertainty deteriorates the future cash flows of firms by postponing their decision-making on investment and purchasing (Bernanke 1983; Pindyck 2003; Edelstein and Kilian 2009).
Although these theoretical frameworks support for negative oil/stock relationship, many other analyses reported positive relationships. The background for the positive oil/stock relationship is the fiscal transmission channel. The fiscal channel argues that higher oil prices may lead to an increase in the wealth of oil-exporting countries, which allows for increases in government purchases of the countries. Considering that such purchases are not substitutes but complements, these can lead to increases in household consumption as well as aggregate demand. Responding to the expectation of higher aggregate demand, private firms will make more active production and investment, which contributes to higher cash flow of firms and stock prices in the world. In addition, Bernanke (2016) suggests an additional view of the positive oil/stock relationship through the lens of aggregate demand. He argues that oil prices and stock prices move together toward the aggregate demand movements in the real world. For example, the fall (rise) in international oil prices leads to an expectation of a downward (upward) global economy and lower (higher) aggregate demand in the world. In such cases, private firms become less (more) active in production and investment, which pushes the stock prices to lower (higher) levels.
Summing up the first step of the literature review on theoretical frameworks and aggregated macroeconomic perspectives, it is not simple to conclude the sign of the oil/stock price relationship. Because higher oil prices may lead to either lower stock prices through some perspectives or higher stock prices through other perspectives, aggregating these two opposite signs leads to the inconclusive results on the oil/price relationship. More specifically, if the aggregate demand effect is greater than other factor effects, then the aggregated oil/stock price relationship is positive. Otherwise, the relationship becomes either negative or unexplained. The aggregated analysis, which combines all the effects of oil price changes on stock markets, has limitations in yielding a conclusive relationship between oil and stock.
To overcome the limitations in the aggregate oil/stock analysis, a lot of research has been extended to disaggregate analysis, such as industry-specific analysis, firm-specific analysis, and period-specific analysis. For the second step, we review the disaggregated analyses and find that the contribution of the disaggregated analyses was to detect heterogeneity in oil/stock relationships across industries and firms. For example, the industry-specific sectoral index analyses reveal that there are indeed heterogeneous responses to the oil price changes by different industrial sectors (El-Sharif et al. 2005; Boyer and Filion 2007; Arouri and Nguyen 2010; Arouri 2012; Broadstock et al. 2012, 2014). For example, highly oil-related sectors, such as oil and gas, electricity, oil refiners, etc., respond positively to oil price changes, whereas less oil-related sectors, such as food, Chemical, computer, financial, general service, medical, real estate, etc., have negative or no response to oil price changes for the case of global industry sample (Nandha and Brooks 2009), US sample (Narayan and Sharma 2011; Elyasiani et al. 2011), European sample (Arouri and Nguyen 2010; Sholtens and Yurtsever 2012), and Developed Europe and G7 sample (Nandha and Brooks 2009). Further, firm-specific research enables providing additional insights into the oil/stock relationship in the sense that firm-level characteristics determine the relationship. However, firm-specific analyses are limited because they provide scarce evidence pointing to the direction that even though heterogeneity among and within stock market sectors does exist; oil-related stocks tend to be higher in value when oil prices rise.
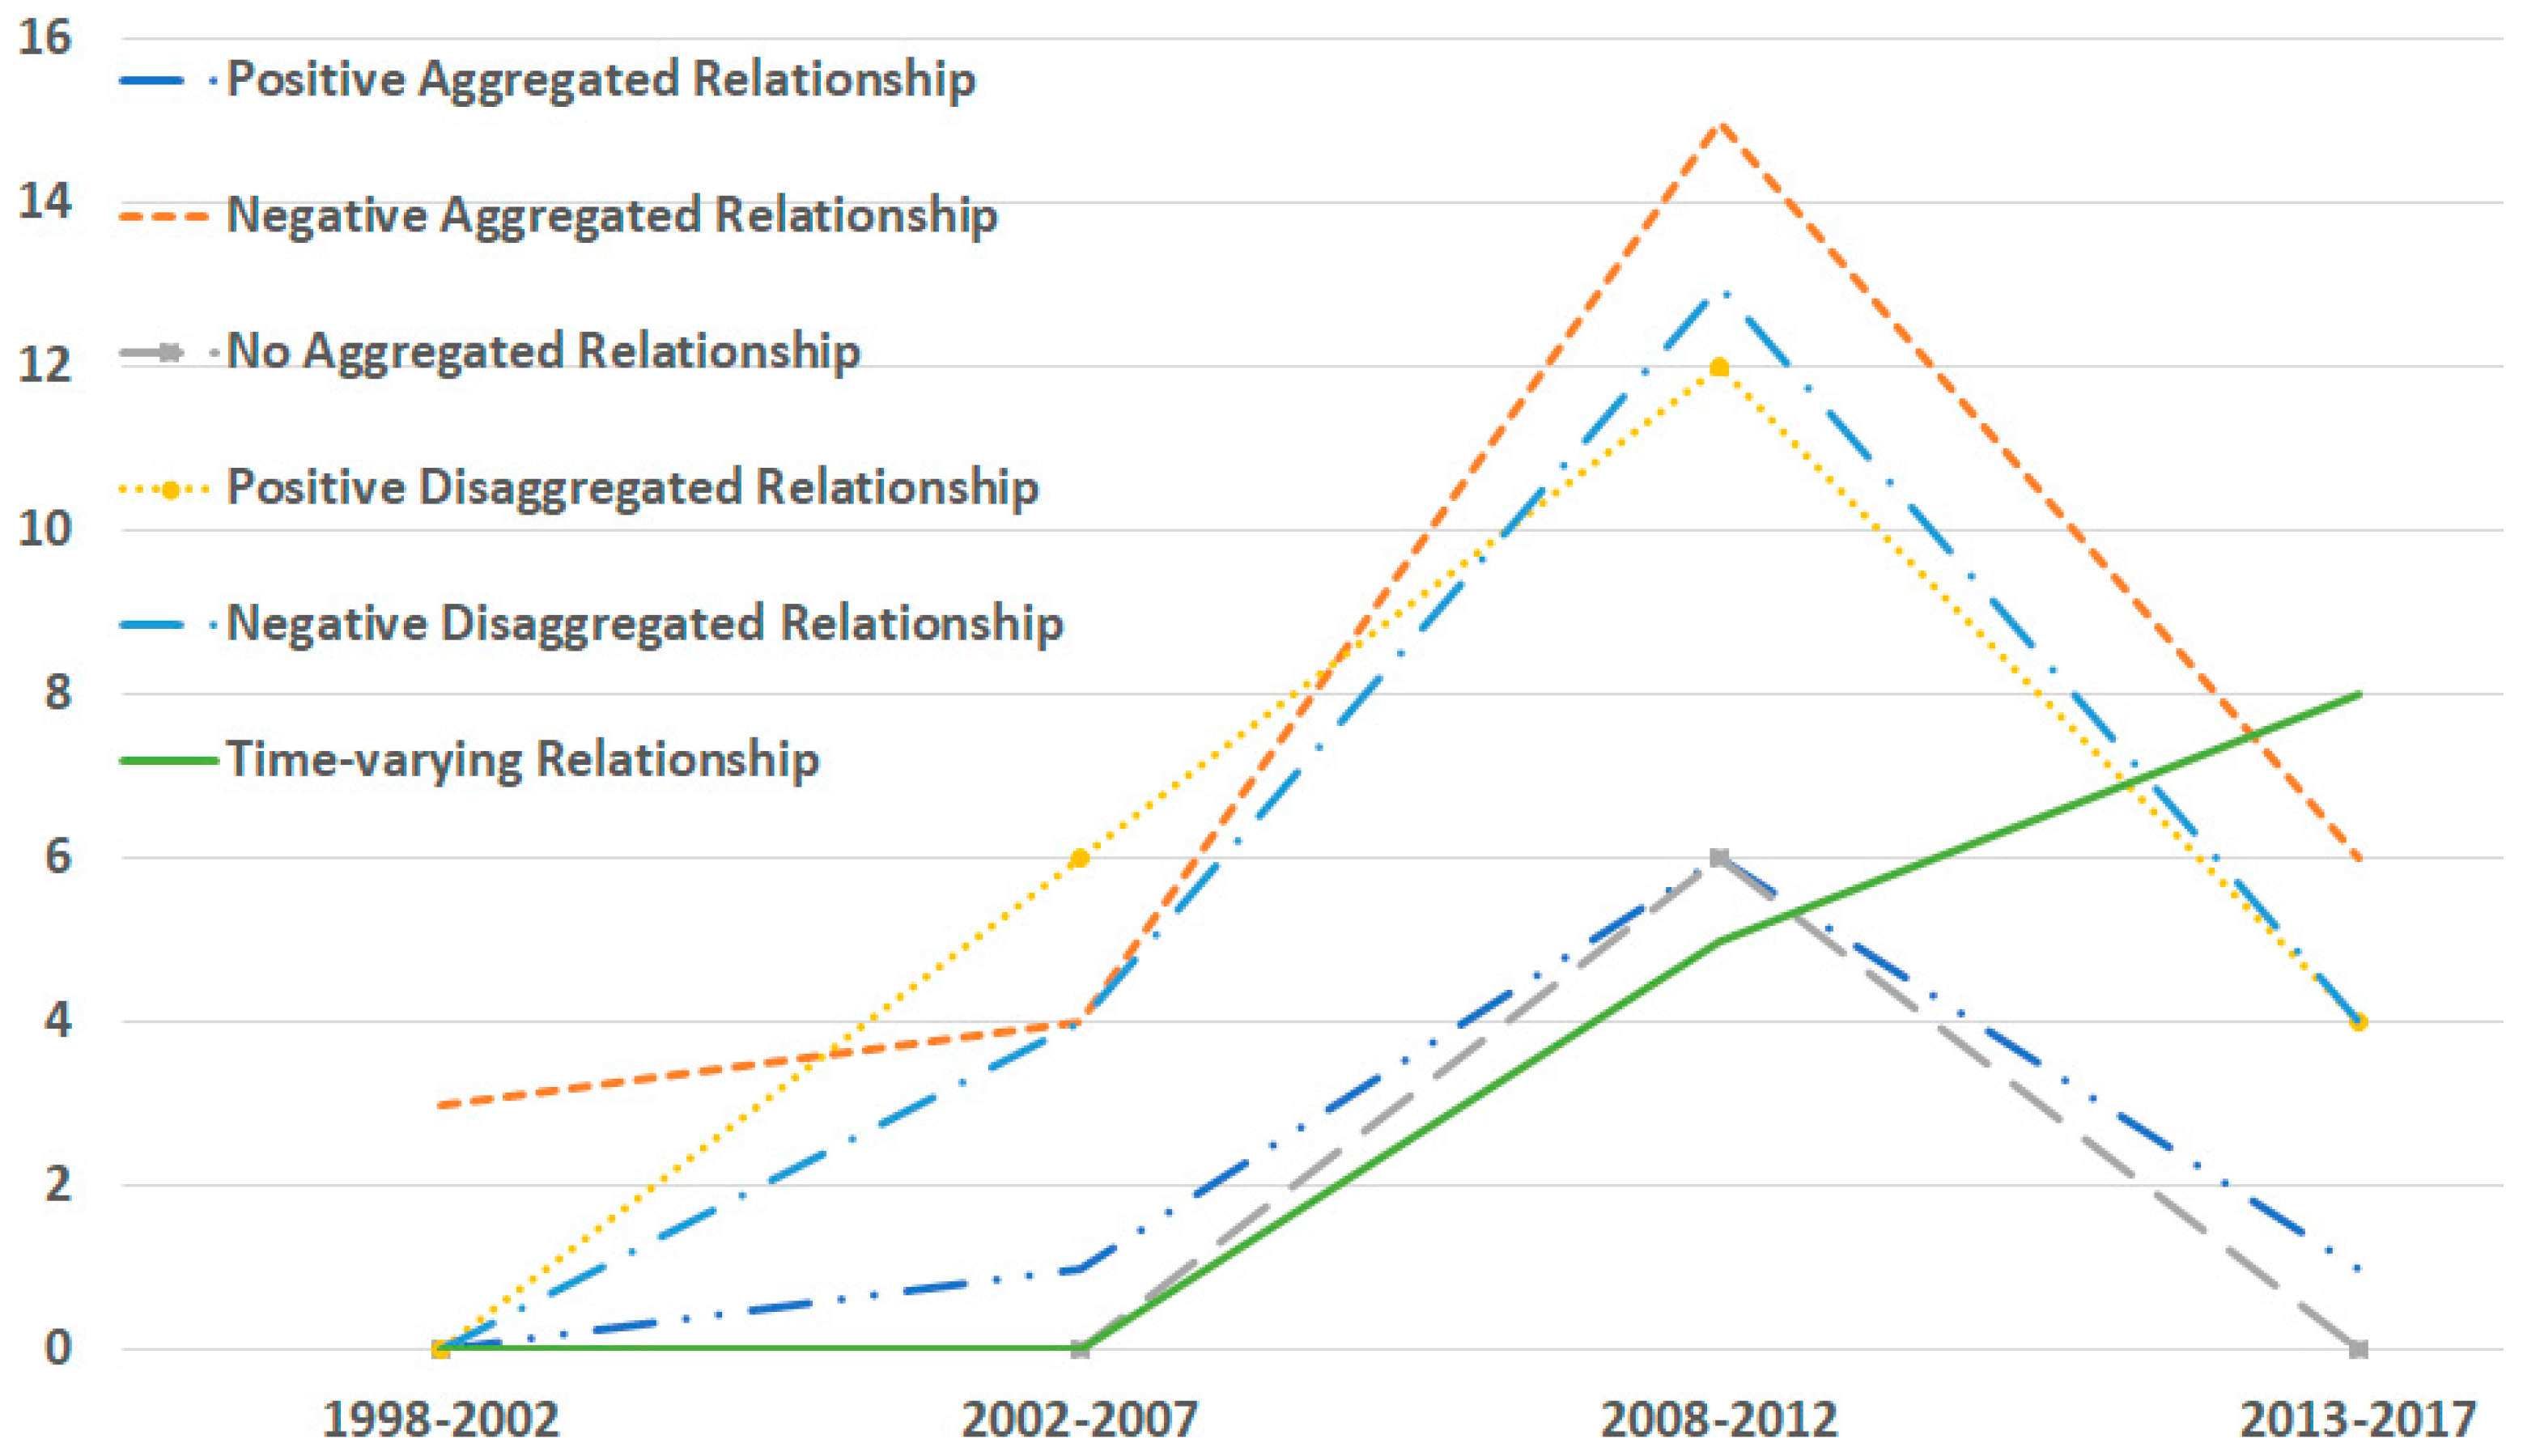
In addition to firm- or industry-specific analysis, time-specific analysis has been emerging in the oil/stock nexus. Especially since 2008, when the global financial crisis occurred, the number of publications dealing with the time-varying relationship has been growing persistently. As Figure 3 shows, according to Degiannakis et al. (2018), the number of papers finding time-varying relationships between oil and stock markets has been growing, although all other papers decreased after 2012. In particular, from 2013 to 2017, the number of articles that discovered the time-varying relationship was greater than the number of ones on all other topics. The time-varying relationship analysis mainly aims at identifying differences between the demand-side shock and the supply-side shock of oil markets. For example, Kang et al. (2015) identified that the oil shocks on the demand side of oil markets, such as the economic boom, exercised a positive effect during 1973–2012, whereas the oil shocks on the supply side of the oil market, such as oil supply capacity, have a negative effect during the early period, 1973–1980. Also, Antonakakis et al. (2013) examined whether the different oil price shocks have spillover effects on stock markets at different times. They found that the aggregate-demand shocks played a role as a net transmitter of shocks into stock markets during periods characterized by economic turbulence, while the supply-side and precautionary-demand shocks were net transmitters of shocks during geopolitical turbulence periods.
Despite the numerous studies existing in the literature on the oil/stock relationship, no empirical evidence showed a possible heterogeneous relationship between the two markets over different time periods until 2010. For example, oil market volatility was the main transmitter of volatility shocks to stock markets, rather than the reverse. Further, these spillover effects were more apparent during the financial crisis and no distinction between oil importers and exporters existed. (Arouri et al. 2011; Awartani and Maghyereh 2013; Boldanov et al. 2016; Maghyereh et al. 2016).
Overall, by considering the findings, insights, and trends of the existing literature on the oil/price relationship, our study is expected to make a significant contribution to the existing literature regarding three aspects. First, this paper deals with the oil/price relationship topic that has been brought to academic attention for requiring the need to use a time-varying spillover effect between oil and stock markets. Second, this paper is expected to provide a conclusive result on the oil/price relationship unlike most prior studies using a large open economy case. Specifically, the case of Korea with its high dependence on imported oil is more helpful for clarifying the oil/price relationship due to its structural vulnerability to international oil price volatility. Third, portfolio-specific analysis enables a better understanding of the heterogeneous effects of oil prices on disaggregate industrial portfolios rather than aggregate stock market analysis. Hence, this paper is expected to fill this gap and contribute to the existing studies by carrying out a Korean portfolio-specific investigation of time-varying volatility spillover effects from international oil prices to stock market sectoral indexes. Also, we shed light on long-term periods expanding to December 2022, which enables checking a significant change in the oil/price relationship after COVID-19 occurred because it is rare to find existing oil/price literature including the pandemic period.
3. Methodology: Data and Estimation Model
The dataset is composed of weekly data on Dubai crude oil forecast prices and stock market portfolio indexes of Korea, spanning the period from the first Friday of June (date: 13 June) in 2014 to the last Friday of December (date: 23 December) in 2022. The time span and observations are sufficient enough compared with many recent works covering even less than 8 years, such as Li et al. (2023), Mo et al. (2023), Zalfaghari et al. (2020), and so on. Also, this paper examines 20 portfolio indexes that are officially classified by the Korea Exchange Market (KRX). These portfolio index data were collected from the KisValue, which is known as a primary source of Korean stock market information. The 20 portfolios are as follows: KOSPI, large-capitalization (hereafter called as “Large-cp”), small-capitalization (hereafter “Small-cp”), food and beverages (“F&B”), textile and clothing (“T&C”), paper and woods (“P&W”), chemicals (“CHEM”), pharmaceutical (“PHRM”), non-metallic minerals (“NMM”), steel and metallic minerals (“SMM”), machinery (“MACH”), electricity and electronics (“E&E”), precision medicine (“PM”), transportation and equipment (“T&E”), distributions (“DIST”), power and gas (“P&G”), construction (“CON”), warehouse (“WRH”), telecommunication (“TEL”), financial (“FIN”) index. In addition, this paper uses the Dubai oil futures prices (Platts) from the CME group because the Dubai price represents the Asian oil markets where Korea depends highly on the imports of crude oil.
We transformed the level-based data into the return-based data by using the formula, , where denotes prices (indexes) of Dubai (the portfolio) and t is the weekly time. The total sample size for the returns during the sample period is 418, and the descriptive statistics for all the weekly return series are reported in Table 1. According to the J.B. and ADF tests, all the variables are normally distributed and statistically stationary.
In order to estimate a spillover effect from international oil markets to Korean stock market portfolios, this paper employs a diagonal BEKK model (Choi 2021; Zalfaghari et al. 2020). According to the suggestion that a diagonal BEKK is a more reliable model than DCC and full BEKK for estimating the spillovers between oil and stock markets (McAleer 2019a, 2019b; Zalfaghari et al. 2020), this paper employs a diagonal BEKK approach for expecting more reliable evidence on the oil/stock linkage than prior studies. This paper examines the relationship between two variables, oil and stock log-returns, resulting in a bivariate approach as follows:
where is the vector of log returns at time t, subscription 1 denotes the oil market, and subscription 2 denotes the stock market. can be decomposed as follows:
where and . The first term, , is the expected return for time t given the available information at the previous time at t − 1. The information set is denoted as F. The second term implies the unexpected part of the return with and . are independently identically distributed (known as iid) random vectors with a mean equal to zero. is the covariance of , which is defined as follows:
The matrix is symmetric since , and it is a positive definite at all t. Thus, a general full and diagonal BEKK model with a parameters matrix and restrictions of scalar a and b is expressed as follows:
where A and B are parameters matrices in aspiration of obtaining a positive H, and C is a lower triangular matrix. Because p = q = 1, the final model of a BEKK for this paper becomes as follows:
The background reason for p = q = 1 is that the time-series oil prices and stock price data show statistically significant (squared) standardized residuals by using GARCH (1, 1) tests through order up to 36 lags according to Choi (2021). Also, M in the above model is an indefinite matrix because . Thus, the above model allows this paper to estimate the time-varying correlation between the unexpected components of oil and stock market log returns: through the quasi-maximum likelihood estimators (QMLE). McAleer et al. (2008) proved that the QMLE of the parameters of the diagonal BEEK models were consistent and asymptotically normal. The elements of the matrices A and B reflect the impact of shocks in individual markets and the persistence of shocks in each individual market, respectively. In specific, the matrix A provides information about “direct” shock spillovers and “indirect” shock spillovers. The “direct” effect means that the conditional variance in an individual market reacts to its own lagged shocks and/or lagged shocks in other markets, and the “indirect” effect means that the conditional variance in an individual market reacts to any combination of the lagged shocks cross-terms. The matrix B not only tells the “direct” volatility spillovers, meaning that the conditional variance in an individual market responds to its own lagged volatility and/or to lagged volatility in the other markets but also the “indirect” volatility spillovers, meaning that the conditional variance in individual market responds to any lagged covariance. Market volatility, which is interpreted as the market uncertainty risk, is the key variable for the spillover effect analysis (Jurado et al. 2015; Haddad et al. 2023).
4. Empirical Results
Firstly, by estimating the matrices A and B in the diagonal BEKK model, this paper discovers the direct and indirect spillover effect from the Dubai oil market to the Korean stock market. As shown in Table 2, the covariance coefficients of matrices A and B for all the portfolios are estimated significantly at 1% and 5% levels, except for two coefficients. These results ensure the existence of direct shock spillover effects from Dubai oil prices to Korean stock portfolio returns, as well as indirect volatility spillovers from Dubai oil prices to Korean stock portfolio returns. It is important information for investors and policymakers to perceive the existence of both shock and volatility spillover effects from the international oil market to the Korean stock market because appropriate hedging strategies for oil market risks should be prepared.
For a simple robustness check, we retested a volatility spillover effect of the Dubai oil market on each portfolio return by using an extended GARCH (1, 1) as Choi (2021) suggested. The GARCH (1, 1) volatility equation is , showing that is the variance of each i’s portfolio returns as a GARCH (1, 1) process in which the conditional variance equation depends on a set of variables: its own past squared residuals (), the lagged variance term (), the variance of oil market returns (), and the lagged variance of oil market returns (). To avoid redundancy, Table 3 only shows the estimated results on and , which implies the current volatility spillover and lagged volatility spillover effect, respectively. We find that, out of the 20 portfolio indexes, 12 portfolios have statistically significant lagged volatility spillover effects () from the oil market, while only a couple of portfolios, textile, cloth, and chemical, have significant current volatility spillover effects. The results by an extended GARCH (1, 1) are unable to perfectly check the robustness of the BEKK results, but it is successful in supporting the BEKK results in the perspective that most of the Korean stock market portfolios are exposed to the oil market volatility. Furthermore, the results by an extended GARCH (1, 1) even present a better performance of the BEKK model for estimating a significant relationship between the oil market and stock market than a standard time-series model as Zalfaghari et al. (2020) argued.
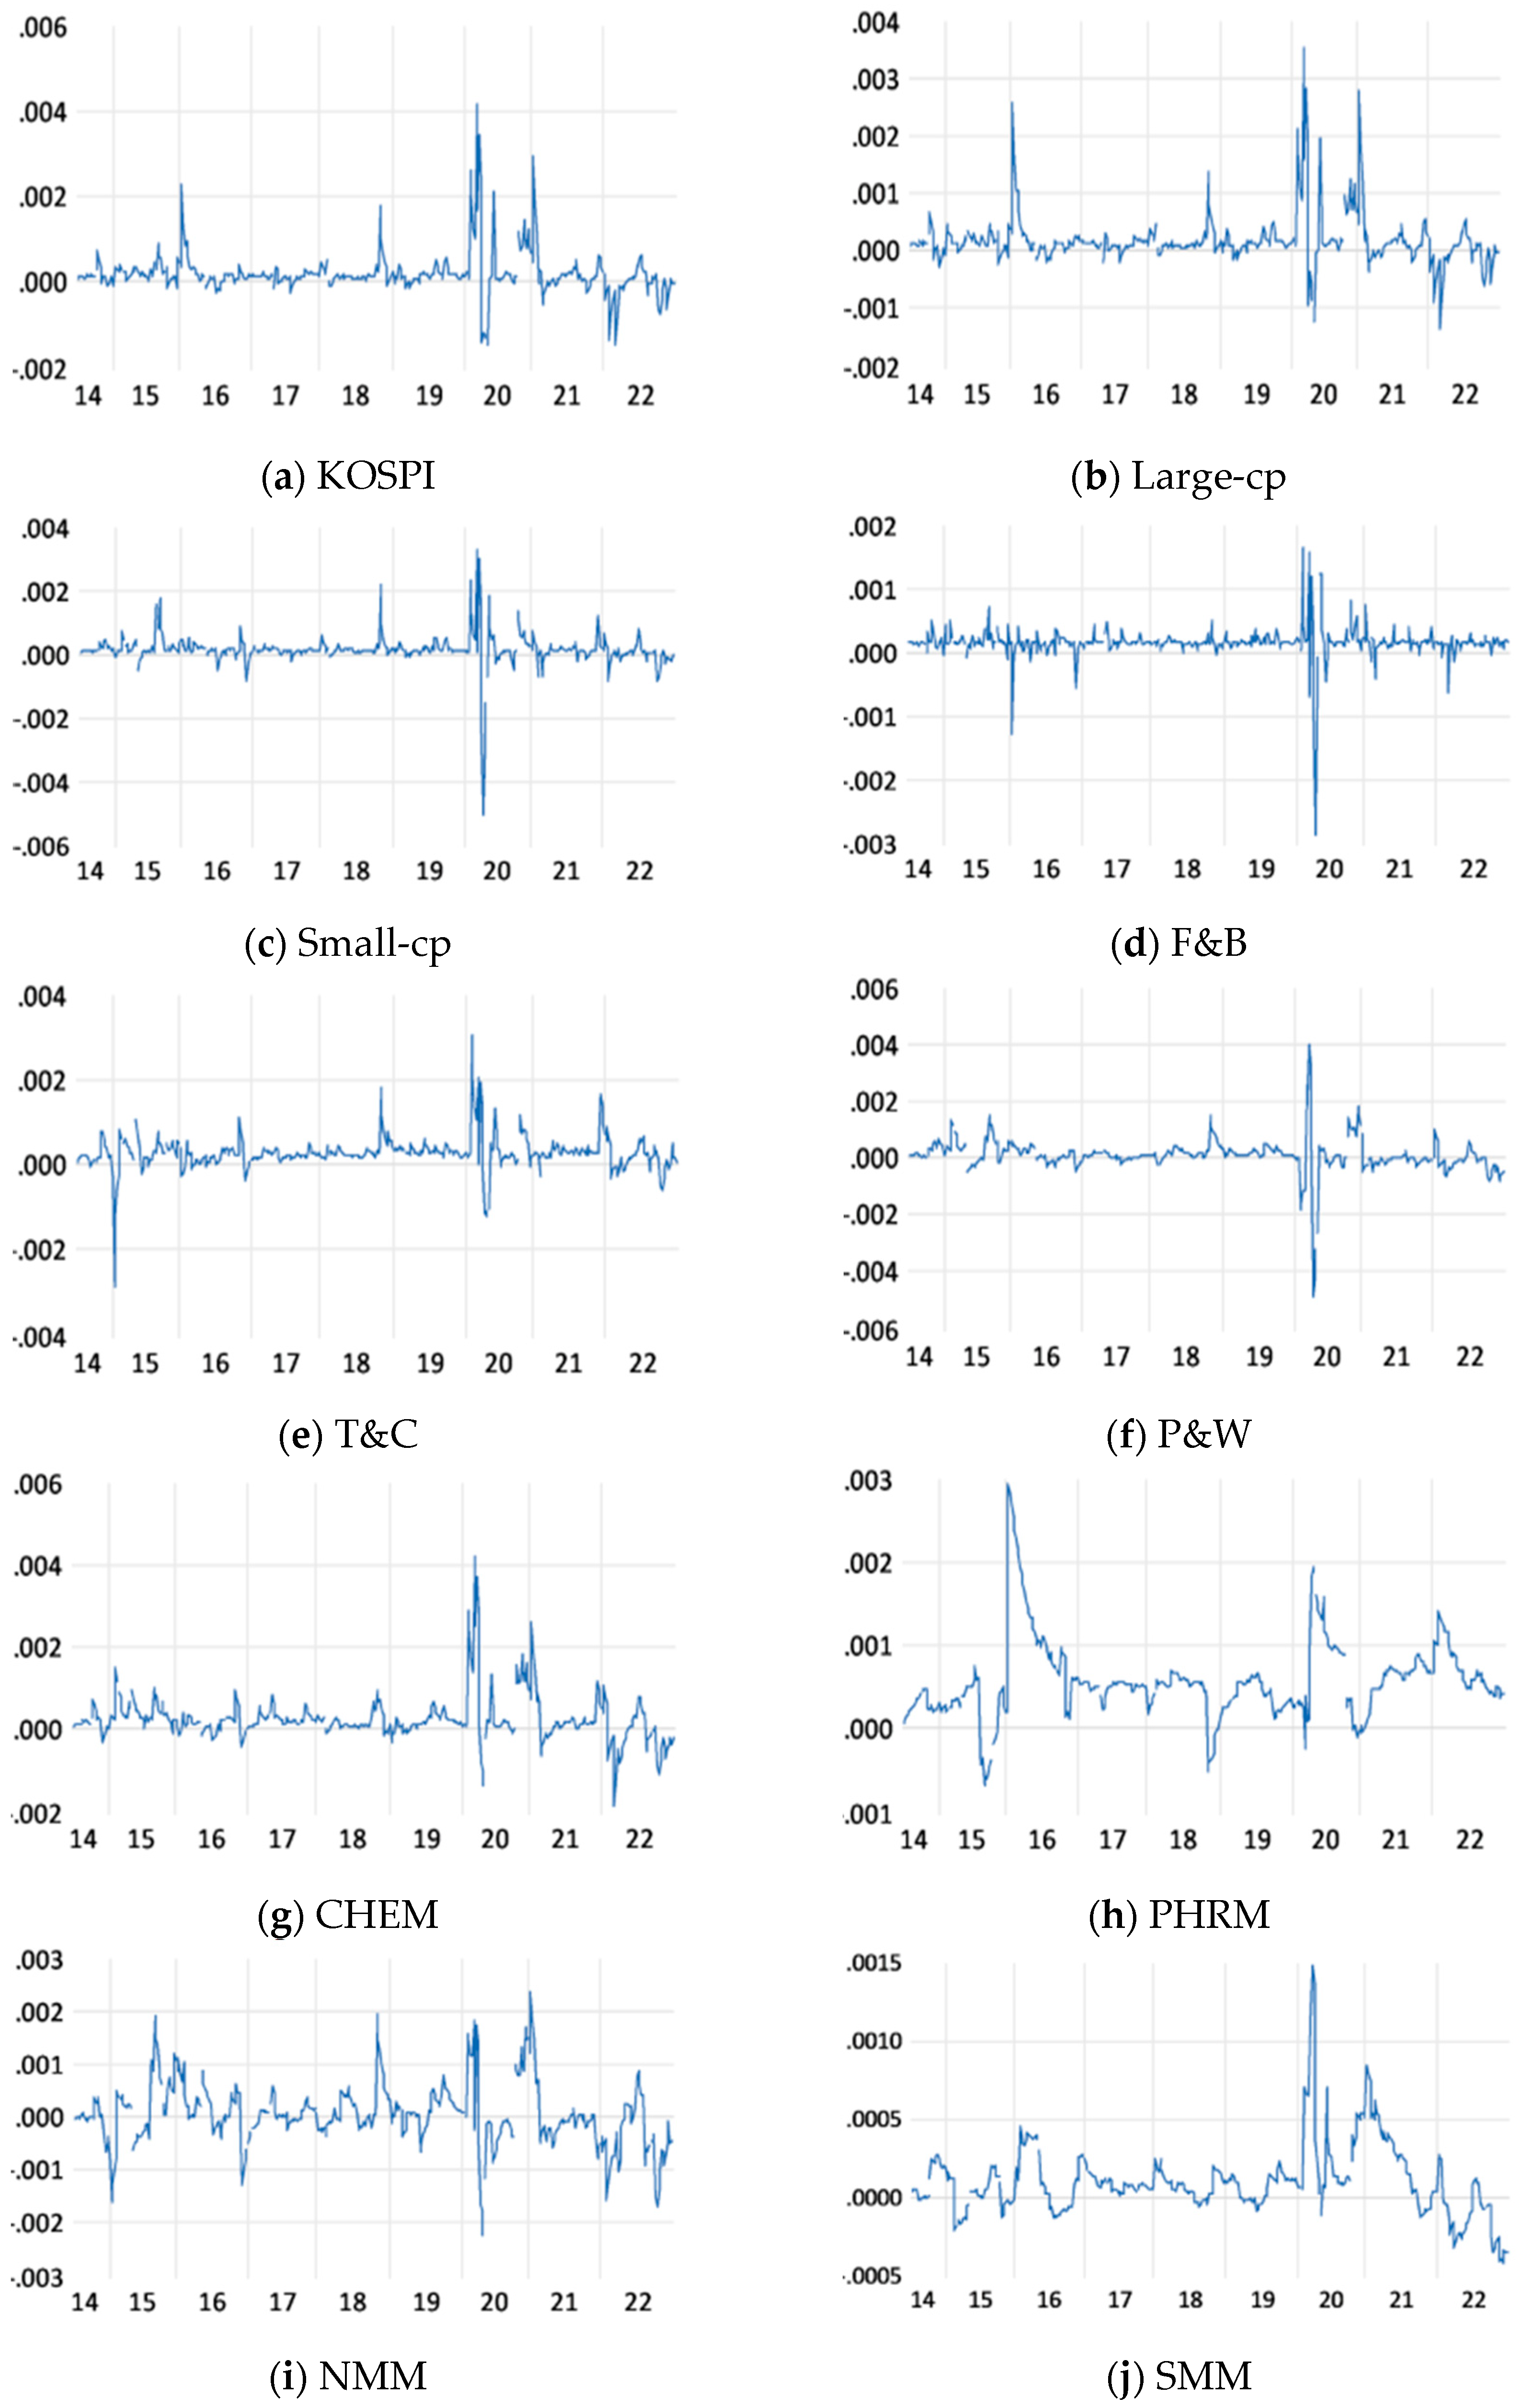
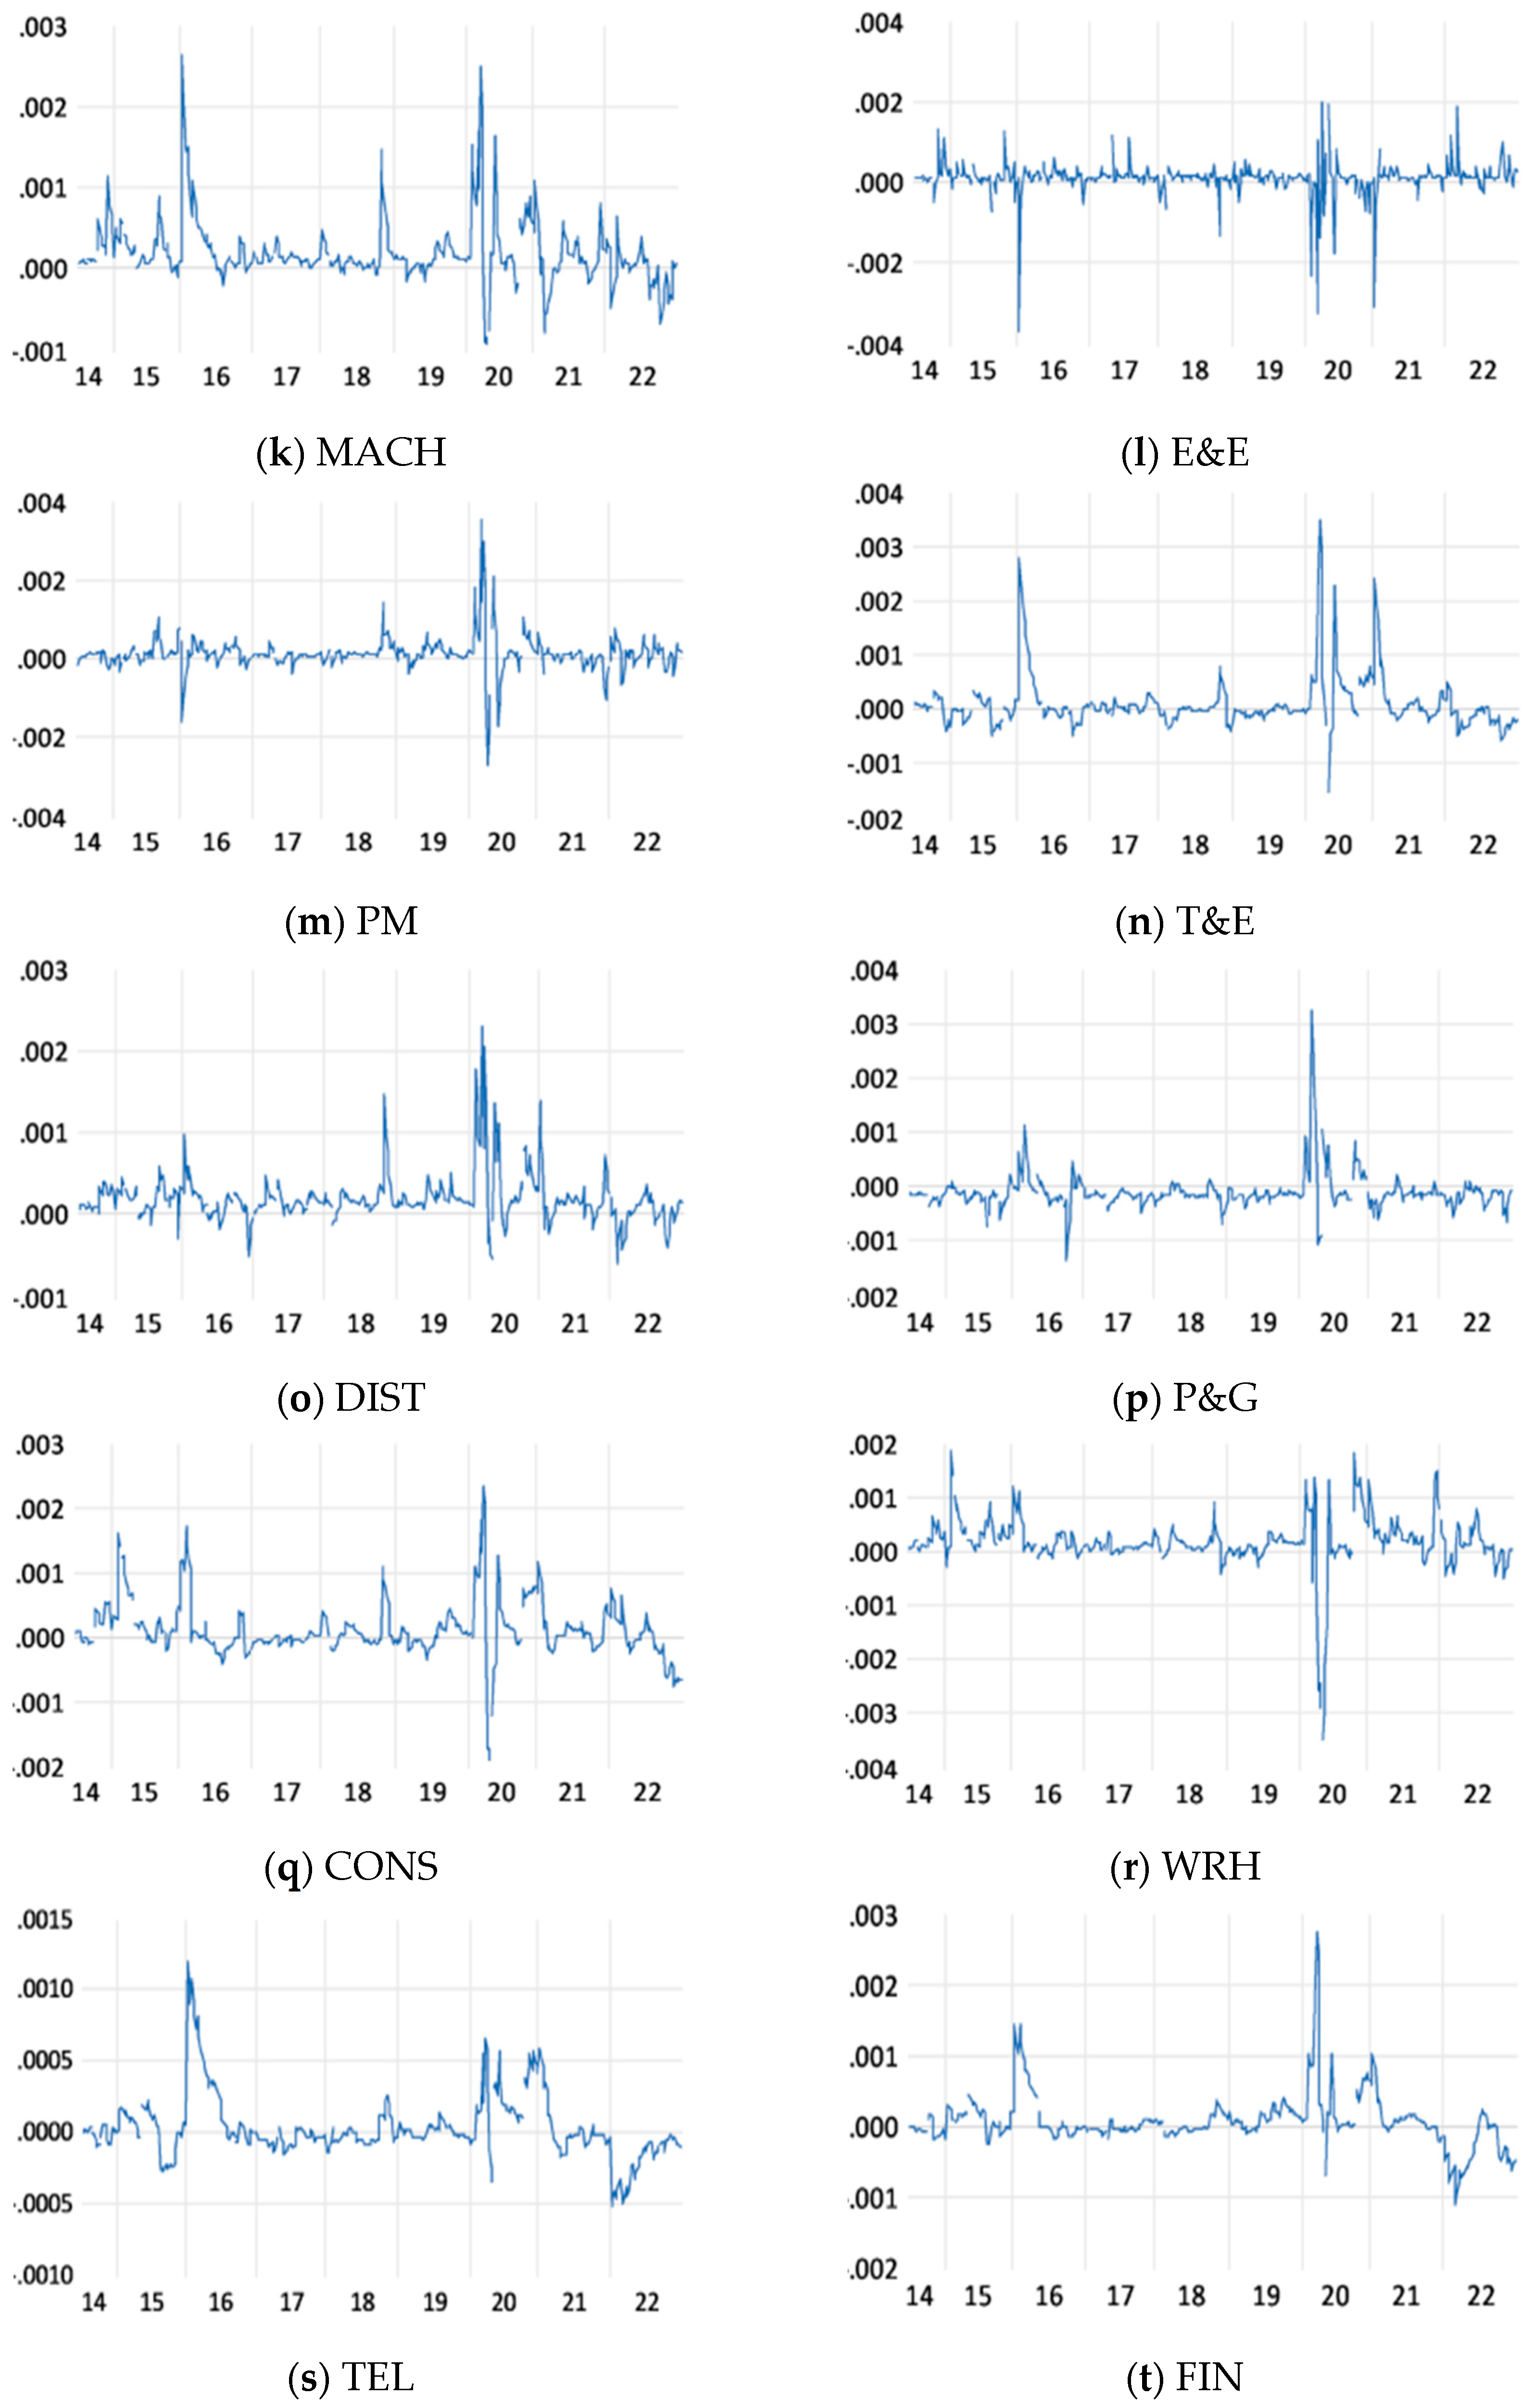
Secondly, in order to check whether the spillovers vary with time, this paper finds the time-varying conditional covariance between individual portfolio returns and Dubai oil prices from 2014 to 2022. As displayed in Figure 4, the covariance rose dramatically during the year 2020, in particular. The year 2020 was the time when COVID-19 broke out, and its threat was most serious, implying that the risk and uncertainty in international commodity and financial markets reached a peak during the recent decade. Among the portfolios, two energy-oriented portfolios, such as the power and gas portfolio and the chemical portfolio, had the greatest rise, which went over 0.03 during the year 2020. Therefore, it is concluded that the spillover effect from the international crude oil markets to the Korean stock market was the greatest in the year 2020 during the recent decade due to the greatest risk and uncertainty in the international commodity and financial markets, and the energy-oriented portfolios were the greatest over other portfolios. Thus, the sensitivity of the energy-oriented portfolio to the oil market risk reminds the investors in Korean energy industries why they should pay closer attention to the international oil markets.
Thirdly, this paper finds additional heterogeneity in the spillover effect across portfolios. It was found that small-capitalization portfolios had higher coefficients for all the matrices in relation to large-capitalization portfolios. This finding can be explained by the firm’s characteristics in operational and financial capabilities. From the perspective of business economics, it is plausible that small firms are more likely to be vulnerable to external risk and uncertainty than large firms because small firms have fewer operational and financial capabilities than large firms. Thus, the small-capitalization portfolio has a greater spillover effect from the international oil market than the large-capitalization portfolio.
5. Conclusions and Further Studies
By employing the “oil/price” diagonal BEKK model as above, this paper estimates the direct and indirect spillover effects from the Dubai oil market to the Korean stock market from the first week of June 2014 to the last week of December 2022.
The empirical results suggest that all the covariance coefficients between Dubai oil prices and individual portfolio returns are statistically significant, implying that the direct (shock) and indirect (volatility) spillover effects from Dubai oil prices to Korean stock portfolio returns exist. Also, this paper examines whether the spillover effects change by a specific time period or a specific portfolio. The time-varying conditional covariance reveals that the spillover effect dramatically increased in the year 2020 when the threat of COVID-19 was the most serious. It provides an implication that the Korean stock market tended to be affected more by the international crude oil market when the risk and uncertainty in international commodity and financial markets were greater because the economy of Korea highly depends on crude oil imports as well as international trade. Among the portfolios, the energy-oriented portfolios, such as the power and gas portfolio and the chemical portfolio, had the greatest spillover effects by taking more than 0.003 covariance values in 2020.
In addition, the portfolio-level analysis reveals that the small-capitalization portfolio has greater spillover effects than the large-capitalization portfolio. This finding is plausible because small firms have fewer operational and financial capabilities than large firms, in general. Considering the greater spillover effect for small-capitalization firms, the “fight-to-quality” phenomenon is regarded as a rational investor behavior because small-capitalization firms could be a riskier asset than large-capitalization firms.
The findings and implications of this paper are meaningful in three aspects. First, the case of Korea provides clear evidence of the oil/stock relationship because Korea is a representative economy that has a higher economic dependency on crude oil imports. Second, the portfolio-specific analysis of this paper helped detect differences in the oil/price relationships across portfolios. Third, the “oil/price” diagonal BEKK analysis and conditional covariance analysis helped check how a spillover effect varies with time, which is distinguished from the time-static analysis. Especially, since the time span for time-varying analysis included the COVID-19 pandemic years, this paper provides clear evidence of the oil/stock market linkage for the turbulent time of international commodity and financial markets.
Although this paper makes meaningful results and implications, as those above, there still exist limitations in this paper. First of all, we point out the modeling issue. Although it is often cited that a diagonal BEEK is more reliable than DCC and a full BEKK model (McAleer 2019a, 2019b; Zalfaghari et al. 2020), it is necessary to test and clarify different performances across the models for different analysis environments, such as specific time periods, country sets, events, and so on. Especially when considering the financial crisis outbreak, the contagion models, such as Forbes and Rigobon (2002) or Fry et al. (2010), could be useful as an application model. Similarly, we perceive that a “bilateral” BEKK model is limited in identifying a flow path of the oil market effect into other portfolios. For instance, it would be clarified which portfolio was affected first or last by Dubai oil price shocks and volatility if a model is developed for detecting the subsequent effects from the oil market to the stock market. Also, it is necessary to check whether Dubai oil is the best representation of the international crude oil market. Because Korea has been reducing the share of Dubai oil to total crude oil imports continuously, it is necessary to check the role of Dubai oil in Korea and compare Dubai oil prices with other benchmark crude oil prices, such as WTI, Brent, and Oman, for the best choice. Finally, since it was found that three portfolios (pharmaceuticals, machinery, and telecommunication) had the greatest conditional covariance not in 2020 but in 2015, it is necessary to find an industry-specific reason for these portfolios. These limitations remain for future research topics.
Funding
This research received no funding.
Data Availability Statement
No new data were created or analyzed in this study. Data sharing is not applicable to this article.
Conflicts of Interest
The author declares no conflict of interest.
References
- Antonakakis, Nikolaos, Ioannis Chatziantoniou, and George Filis. 2013. Dynamic co-movements of stock market returns, implied volatility and policy uncertainty. Economics Letters 120: 87–92. [Google Scholar] [CrossRef]
- Arouri, Mohamed. 2012. Stock returns and oil price changes in Europe: A sector analysis. The Manchester School 80: 237–61. [Google Scholar]
- Arouri, Mohamed, and Duc Khuong Nguyen. 2010. Oil prices, stock markets and portfolio investment: Evidence from sector analysis in Europe over the last decade. Energy Policy 38: 4528–39. [Google Scholar] [CrossRef]
- Arouri, Mohamed, Amine Lahiani, and Duc Khuong Nguyen. 2011. Return and volatility transmission between world oil prices and stock markets of the GCC countries. Economic Modelling 28: 1815–25. [Google Scholar] [CrossRef]
- Awartani, Basel, and Aktham Issa Maghyereh. 2013. Dynamic spillovers between oil and stock markets in the Gulf Cooperation Council Countries. Energy Economics 36: 28–42. [Google Scholar] [CrossRef]
- Basher, Syed, and Perry Sadorsky. 2006. Oil price risk and emerging stock markets. Global Finance Journal 17: 224–51. [Google Scholar] [CrossRef]
- Bernanke, Ben. 1983. Non-Monetary Effects of the Financial Crisis in the Propagating of the Great Depression. National Bureau of Economic Research Working Paper Series No. 1054. Cambridge, MA: National Bureau of Economic Research. [Google Scholar] [CrossRef]
- Bernanke, Ben. 2016. The Relationship between Stocks and Oil Prices. Brookings Articles. Available online: http://www.brookings.edu/articles/the-relationship-between-stocks-and-oil-prices/ (accessed on 1 January 2024).
- Boldanov, Rustam, Stavros Degiannakis, and George Filis. 2016. Time-varying correlation between oil and stock market volatilities: Evidence from oil-importing and oil-exporting countries. International Review of Financial Analysis 48: 209–20. [Google Scholar] [CrossRef]
- Boyer, Martin, and Didier Filion. 2007. Common and fundamental factors in stock returns of Canadian oil and gas companies. Energy Economics 29: 428–53. [Google Scholar] [CrossRef]
- Broadstock, David, Hong Cao, and Dayong Zhang. 2012. Oil shocks and their impact on energy related stocks in China. Energy Economics 34: 1888–95. [Google Scholar] [CrossRef]
- Broadstock, David, Rui Wang, and Dayong Zhang. 2014. Direct and indirect oil shocks and their impact upon energy related stocks. Energy Systems 38: 451–67. [Google Scholar] [CrossRef]
- Choi, Sunghee. 2021. Dynamic interrelationship between major crude oil prices: Estimation by multiple sub-periods regarding key global events and time-varying coefficient. Journal of Applied Economic Sciences 16: 21–31. [Google Scholar] [CrossRef] [PubMed]
- Degiannakis, Stavros, George Filis, and Vipin Arora. 2018. Oil prices and stock markets: A review of the theory and empirical evidence. Energy Journal 39: 85–130. [Google Scholar] [CrossRef]
- Edelstein, Paul, and Lutz Kilian. 2009. How sensitive are consumer expenditures to retail energy prices? Journal of Monetary Economics 56: 766–79. [Google Scholar] [CrossRef]
- El-Sharif, Idris, Dick Brown, Bruce Burton, Bill Nixon, and Alex Russell. 2005. Evidence on the nature and extent of the relationship between oil prices and equity values in UK. Energy Economics 27: 819–30. [Google Scholar] [CrossRef]
- Elyasiani, Elyas, Iqbal Mansur, and Babatunde Odusami. 2011. Oil price shocks and industry stock retunrs. Energy Economics 33: 966–74. [Google Scholar] [CrossRef]
- Forbes, Kristin, and Roberto Rigobon. 2002. No contagion, only interdependence: Measuring stock market comovements. Journal of Finance 57: 2223–61. [Google Scholar] [CrossRef]
- Fry, Renee, Vance Martin, and Chrismin Tang. 2010. A new class of tests of contagion with applications. Journal of Business and Economic Statistics 28: 423–37. [Google Scholar] [CrossRef]
- Gagliardone, Luca, and Mark Gertler. 2023. Oil Prices, Monetary Policy and Inflation Surges. National Bureau of Economic Research Working Paper Series No. 31263. Cambridge, MA: National Bureau of Economic Research. Available online: http://www.nber.org/papers/w31263 (accessed on 10 April 2024).
- Haddad, Heid, Imed Mezghani, Imed Medhioub, and Sohale Altamimi. 2023. Spillover effects of disaggregated macroeconomic uncertainties on U.S. real activity: Evidence from the quantile vector autoregressive connectedness approach. Empirical Economics 66: 829–58. [Google Scholar] [CrossRef]
- Hamilton, James. 1983. Oil and the macroeconomy since World War II. Journal of Political Economy 9: 228–48. [Google Scholar] [CrossRef]
- Hamilton, James. 1988. Are the macroeconomic effects of oil-price changes symmetric? A comment. Carnegie-Rochester Conference Series on Public Policy 28: 369–78. [Google Scholar] [CrossRef]
- Hamilton, James. 2003. What is an oil shock? Journal of Econometrics 113: 363–98. [Google Scholar] [CrossRef]
- Jurado, Kyle, Sydney Ludvigson, and Serena Ng. 2015. Measuring uncertainty. American Economic Review 105: 1177–216. [Google Scholar] [CrossRef]
- Kang, Wensheng, Ronald Ratti, and Kyung Hwan Yoon. 2015. The impact of oil price shocks on the US stock market return and volatility relationship. Journal of International Financial Markets, Institutions and Money 34: 41–54. [Google Scholar] [CrossRef]
- Kilian, Lutz. 2008. The economic effects of energy price shocks. Journal of Economic Literature 46: 871–909. [Google Scholar] [CrossRef]
- Kilian, Lutz, and Xiaoqing Zhou. 2022. The Impact of Rising Oil Prices on U.S. Inflation and Inflation Expectations in 2020–23. Energy Economics 113: 106228. [Google Scholar] [CrossRef]
- Li, Jingpeng, Muhammad Umar, and Jiale Huo. 2023. The spillover effect between Chinese crude oil futures market and Chinese green energy stock market. Energy Economics 119: 106568. [Google Scholar] [CrossRef]
- Maghyereh, Aktham, Basel Awartani, and Elie Bouri. 2016. The directional volatility connectedness between crude oil and equity markets: New evidence from implied volatility indexes. Energy Economics 57: 78–93. [Google Scholar] [CrossRef]
- McAleer, Michael. 2019a. What they did not tell you about algebraric (non-) existence, mathematical (IR-) regularity, and (non-) asymptotic properties of the dynamic conditional correlation (DCC) model. Journal of Risk Financial and Management 12: 61. [Google Scholar]
- McAleer, Michael. 2019b. What they did not tell you about algebraric (non-) existence, mathematical (IR-) regularity, and (non-) asymptotic properties of the full BEKK dynamic conditional covariance model. Journal of Risk Financial and Management 12: 66. [Google Scholar]
- McAleer, Michael, Felix Chan, Suhejla Hoti, and Offer Lieberman. 2008. Generalized autoregressive conditional correlation. Econometric Theory 24: 1554–83. [Google Scholar] [CrossRef]
- Ministry of Foreign Affairs of Republic of Korea. 2021. Available online: https://www.mofa.go.kr/eng/wpge/m_5657/contents.do (accessed on 30 December 2021).
- Mo, Bon, Juan Meng, and Guannan Wang. 2023. Risk dependence and risk spillovers effect from crude oil on the Chinese stock market and gold market: Implications on portfolio management. Energies 16: 2141. [Google Scholar] [CrossRef]
- Nandha, Mohan, and Robert Brooks. 2009. Oil prices and transport sector returns: An international analysis. Review of Quantitative Finance and Accounting 33: 393–409. [Google Scholar] [CrossRef]
- Narayan, Paresh, and Susan Sharma. 2011. New evidence on oil price and firm returns. Journal of Banking and Finance 35: 3253–62. [Google Scholar] [CrossRef]
- Pindyck, Robert. 2003. Volatility in Natural Gas and Oil Markets. Massachusetts Institute of Technology Working Paper 0312. Available online: http://web.mit.edu/rpindyck/www/Papers/Vol_NG.pdf (accessed on 1 January 2024).
- Sholtens, Bert, and Cenk Yurtsever. 2012. Oil price shocks and European industries. Energy Economics 34: 1187–95. [Google Scholar] [CrossRef]
- Svensson, Lars. 2005. Oil Prices and ECB Monetary Policy. Briefing Paper for the Committee on Economic and Monetary Affairs of the European Parliament. Available online: https://www.larseosvensson.se/files/papers/ep501.pdf (accessed on 1 January 2024).
- Svensson, Lars. 2006. Monetary-Policy Challenges: Monetary-Policy Responses to Oil-Price Changes. Paper presented at Bellagio Group of the G10, Washington, DC, USA, January 13–14; Available online: https://larseosvensson.se/files/papers/Bellagio601.pdf (accessed on 1 January 2024).
- Tayler, John. 1993. Discretion versus policy rules in practice. Carnegie-Rochester Conference Series on Public Policy 39: 195–214. [Google Scholar] [CrossRef]
- Zalfaghari, Mehdi, Hamed Ghoddusi, and Fatemeh Faghihian. 2020. Volatility spillovers for energy prices: A diagonal BEKK approach. Energy Economics 92: 104965. [Google Scholar] [CrossRef]
Figure 1.
Crude oil prices and the Korean stock market index: 2014–2022.

Figure 2.
The steps of existing literature review.

Figure 3.
Number of papers on the oil/price relationship over years.

Figure 4.
Time-varying conditional covariance of Dubai oil prices with each portfolio.


Table 1.
Summary statistics of the weekly return series from June 2014 to December 2022.
| Dubai | KOSPI | Large-cp | Small-cp | Industry-Specific Portfolios | |||||||
|---|---|---|---|---|---|---|---|---|---|---|---|
| F&B | T&C | P&W | CHEM | PHRM | NMM | ||||||
| Mean | −0.007 | 0.0004 | 0.0004 | 0.0006 | −0.0002 | 0.0010 | 0.0001 | 0.0006 | 0.0028 | 0.0019 | |
| Std. | 0.051 | 0.025 | 0.025 | 0.031 | 0.028 | 0.037 | 0.037 | 0.033 | 0.045 | 0.043 | |
| Max. | 0.303 | 0.128 | 0.147 | 0.111 | 0.107 | 0.177 | 0.150 | 0.145 | 0.179 | 0.178 | |
| Min. | −0.276 | −0.141 | −0.132 | −0.203 | −0.134 | −0.183 | −0.241 | −0.162 | −0.183 | −0.182 | |
| Skew. | −0.032 | −0.559 | −0.186 | −1.557 | −0.280 | 0.033 | −1.058 | −0.300 | −0.235 | −0.129 | |
| Kurtosis | 8.661 | 6.136 | 5.904 | 8.344 | 2.065 | 3.231 | 7.209 | 3.519 | 2.375 | 3.042 | |
| J.B. | 1306.42 | 677.60 | 609.62 | 1381.45 | 79.75 | 181.88 | 983.27 | 222.00 | 102.08 | 162.36 | |
| ADF. | −6.12 | −6.66 | −6.62 | −6.83 | −6.28 | −6.04 | −6.72 | −5.71 | −6.42 | −7.06 | |
| Industry-Specific Portfolios | |||||||||||
| SMM | MACH | E&E | PM | T&E | DIST | P&G | CON | WRH | TEL | FIN | |
| Mean | −0.0002 | −0.0001 | 0.0017 | 0.0002 | −0.0007 | −0.0009 | −0.0008 | −0.0013 | −0.0004 | 0.0005 | −0.0004 |
| Std. | 0.037 | 0.038 | 0.034 | 0.048 | 0.038 | 0.028 | 0.034 | 0.041 | 0.036 | 0.029 | 0.029 |
| Max. | 0.150 | 0.106 | 0.196 | 0.140 | 0.219 | 0.110 | 0.134 | 0.108 | 0.138 | 0.095 | 0.153 |
| Min. | −0.192 | −0.226 | −0.129 | −0.238 | −0.220 | −0.148 | −0.176 | −0.189 | −0.180 | −0.129 | −0.167 |
| Skew. | −0.259 | −0.913 | 0.233 | −0.456 | −0.025 | −0.477 | −0.132 | −0.356 | −0.172 | −0.572 | −0.453 |
| Kurtosis | 2.338 | 3.741 | 2.744 | 1.795 | 6.818 | 3.354 | 2.742 | 1.174 | 2.827 | 1.831 | 6.442 |
| J.B. | 99.86 | 301.74 | 134.90 | 70.64 | 809.75 | 211.76 | 132.17 | 32.83 | 141.27 | 81.22 | 737.07 |
| ADF. | 6.28 | −7.12 | −6.67 | −6.29 | −7.20 | −6.81 | −6.59 | −7.44 | −6.19 | −6.74 | −6.71 |
Table 2.
Variance coefficients of the matrices A and B in a diagonal BEKK model.
| Portfolio Index | A(1, 1) | A(2, 2) | B(1, 1) | B(2, 2) |
|---|---|---|---|---|
| KOSPI | 0.2818 (0.10) ** | 0.8213 (0.35) * | 0.9414 (0.02) ** | 0.6549 (0.14) ** |
| Large-cp | 0.6861 (0.28) ** | 0.2750 (0.09) ** | 0.6841 (0.14) ** | 0.9404 (0.02) ** |
| Small-cp | 0.7571 (0.27) ** | 0.2637 (0.19) ** | 0.4670 (0.22) * | 0.9374 (0.02) ** |
| F&B | 0.4897 (0.02) ** | 0.2458 (0.05) ** | 0.1125 (0.61) | 0.9361 (0.02) ** |
| T&C | 0.5714 (0.16) ** | 0.2389 (0.05) ** | 0.6667 (0.14) ** | 0.9412 (0.02) ** |
| P&W | 0.5704 (0.18) ** | 0.2639 (0.07) ** | 0.8284 (0.07) ** | 0.9384 (0.02) ** |
| CHEM | 0.2823 (0.08) ** | 0.6026 (0.21) ** | 0.9286 (0.03) ** | 0.7808 (0.09) ** |
| PHRM | 0.3368 (0.13) ** | −0.1625 (0.10) | 0.9426 (0.02) ** | 0.9812 (0.01) ** |
| NMM | 0.2774 (0.07) ** | 0.6140 (0.22) ** | 0.9380 (0.02) ** | 0.8489 (0.05) ** |
| SMM | 0.2361 (0.05) ** | 0.1826 (0.07) ** | 0.9470 (0.02) ** | 0.9835 (0.01) ** |
| MACH | 0.2792 (0.08) ** | 0.3892 (0.16) ** | 0.9298 (0.03) ** | 0.7888 (0.16) ** |
| E&E | 0.3080 (0.10) ** | −0.6067 (0.28)* | 0.9425 (0.02) ** | 0.2032 (0.59) |
| PM | 0.2320 (0.05) ** | 0.5491 (0.18) ** | 0.9403 (0.02) ** | 0.5657 (0.23) ** |
| T&E | 0.2348 (0.05) ** | 0.4376 (0.12) ** | 0.9435 (0.02) ** | 0.8761 (0.05) ** |
| DIST | 0.2594 (0.07) ** | 0.5560 (0.20) ** | 0.9396 (0.02) ** | 0.7021 (0.15) ** |
| P&G | 0.2656 (0.07) ** | 0.4072 (0.19) ** | 0.9344 (0.02) ** | 0.6662 (0.27) * |
| CON | 0.2123 (0.04) ** | 0.4402 (0.12) ** | 0.9479 (0.02) ** | 0.9144 (0.04) ** |
| WRH | 0.2509 (0.07) ** | 0.5621 (0.18) ** | 0.9354 (0.02) ** | 0.7656 (0.11) ** |
| TEL | 0.2577 (0.05) ** | 0.2163 (0.09) ** | 0.9278 (0.02) ** | 0.9554 (0.05) ** |
| FIN | 0.2833 (0.09) ** | 0.3245 (0.12) ** | 0.9365 (0.02) ** | 0.9371 (0.03) ** |
* and ** mean significance levels at 5% and 1%, respectively. Numbers in parentheses are standard errors.
Table 3.
Variance coefficients of an extended GARCH (1, 1) model.
| KOSPI | 0.00006 | 9.82 × 10⁻⁸ ** | MACH | 0.00298 | 2.14 × 10⁻⁷ ** |
| Large-cp | 0.00269 | 0.00000 | E&E | 0.00072 | 7.65 × 10⁻⁷ ** |
| Small-cp | 0.00155 | 2.18 × 10⁻⁸ | PM | 0.00096 | 1.84 × 10⁻⁷ ** |
| F&B | 0.00204 | 7.94 × 10⁻⁸ ** | T&E | −0.00014 | 8.16 × 10⁻⁸ ** |
| T&C | 0.00605 ** | 9.70 × 10⁻⁸ | DIST | 0.00168 | 6.50 × 10⁻⁸ * |
| P&W | 0.00031 | 0.00000 | P&G | −0.00045 | 7.63 × 10⁻⁸ ** |
| CHEM | 0.00313 * | 6.98 × 10⁻⁸ ** | CON | 0.00318 | 0.00000 |
| PHRM | 0.00383 | 8.84 × 10⁻⁸ | WRH | 0.00363 | 0.00015 ** |
| NMM | 0.00071 | 0.00000 | TEL | 0.00147 | 7.41 × 10⁻⁸ ** |
| SMM | 0.00130 | 7.24 × 10⁻⁸ ** | FIN | 0.00118 | 0.00000 |
* and ** mean significance levels at 5% and 1%, respectively.
Disclaimer/Publisher’s Note: The statements, opinions and data contained in all publications are solely those of the individual author(s) and contributor(s) and not of MDPI and/or the editor(s). MDPI and/or the editor(s) disclaim responsibility for any injury to people or property resulting from any ideas, methods, instructions or products referred to in the content. |
© 2024 by the author. Licensee MDPI, Basel, Switzerland. This article is an open access article distributed under the terms and conditions of the Creative Commons Attribution (CC BY) license (https://creativecommons.org/licenses/by/4.0/).
Share and Cite
MDPI and ACS Style
Choi, S. Estimating Spillover Effect from International Oil Market to Stock Market: Evidence from Korean Portfolio-Level Analysis. Economies 2024, 12, 92. https://doi.org/10.3390/economies12040092
AMA Style
Choi S. Estimating Spillover Effect from International Oil Market to Stock Market: Evidence from Korean Portfolio-Level Analysis. Economies. 2024; 12(4):92. https://doi.org/10.3390/economies12040092
Chicago/Turabian StyleChoi, Sunghee. 2024. "Estimating Spillover Effect from International Oil Market to Stock Market: Evidence from Korean Portfolio-Level Analysis" Economies 12, no. 4: 92. https://doi.org/10.3390/economies12040092
Note that from the first issue of 2016, this journal uses article numbers instead of page numbers. See further details here.