Article

What Factors Are Limiting Financial Inclusion and Development in Peru? Empirical Evidence

by
Sergio Luis Náñez Alonso
1,*,
Javier Jorge-Vazquez
1,
Lieslie Gallegos Arias
2 and
Noelia Muñoz del Nogal
3
1
DEKIS Research Group, Department of Economics, Faculty of Social and Legal Sciences, Catholic University of Ávila, 05005 Avila, Spain
2
Vulnerable Populations Research Group, San Pablo Catholic University, Arequipa 04001, Peru
3
ESODS Research Group, Department of Economics, Faculty of Social and Legal Sciences, Catholic University of Ávila, 05005 Avila, Spain
*
Author to whom correspondence should be addressed.
Economies 2024, 12(4), 93; https://doi.org/10.3390/economies12040093
Submission received: 14 February 2024 / Revised: 7 April 2024 / Accepted: 11 April 2024 / Published: 16 April 2024
(This article belongs to the Special Issue Economic Indicators Relating to Rural Development)

Abstract

:
Despite recent efforts in Peru to boost financial inclusion, significant issues of exclusion persist, especially among vulnerable groups. This article aims to identify and analyze areas at risk of financial exclusion using a multifaceted methodology: the Financial Access Survey (FAS) for comparative analysis (Peru versus other countries and regions), geographical-distribution analysis, and the Access to Cash Index (ACI) methodology. Findings reveal that remote rural areas of Peru, particularly those inland, as well as mountainous or jungle regions, face higher risks of financial exclusion due to low digital literacy, limited digital banking usage, sparse branch and ATM networks, and inadequate transportation infrastructure. These insights can inform targeted public policies to enhance financial inclusion in Peru, as well as the development.

1. Introduction

Financial exclusion refers to the impossibility, inability, or lack of access to the most basic financial products and services, such as savings accounts, means of payment, credit, or insurance. In contrast, financial inclusion helps reduce poverty, boosts savings and credit, and formalizes economic activities and, therefore, economic growth (World Bank 2023a; Orazi et al. 2023). In this sense, the concept of financial exclusion is defined as a universal problem that especially affects the poorest subjects motivated by various factors such as limited access in administrative processes, geographical barriers, etc. (Koku 2015).
The reasons and mechanisms for combating financial exclusion have been widely discussed in academia (Leyshon and Thrift 1995; Carbó et al. 2005; Sinclair 2013; Amidžic et al. 2014; Park and Mercado 2015; Henry et al. 2017; Caplan et al. 2020). This reality is highlighted by the fact that practically half of the world’s adult population (3.5-billion inhabitants) does not have a bank account at a financial institution (World Bank 2023a).
A distinction can be made between two types of financial exclusion: voluntary exclusion and involuntary exclusion. In voluntary exclusion, potential users of financial resources have access to financial resources but prefer not to make use of them (Mylonidis et al. 2019). This is due to a lack of need or other cultural or religious reasons (Sain et al. 2018). Involuntary exclusion is a consequence of several factors: lack of sufficient financial income, discrimination against certain groups, absence of branches because they are not commercially viable, high prices, or inadequate products (Mylonidis et al. 2019; Caplan et al. 2020; Nowacka et al. 2021). The probability of suffering financial exclusion increases for lower-income strata, women, part-time workers, the unemployed, those with a certain level of disability, pensioners, students, and single-parent families (Bramley and Besemer 2017; Caplan et al. 2020; Nowacka et al. 2021). The problem of financial exclusion is present worldwide, although it is particularly acute in underdeveloped countries where its consequences are aggravated by the inability of financing to reach the poorest strata (Bramley and Besemer 2017). Specifically, 50–80% of adults in developing countries have inadequate access to financial resources. In contrast, in more advanced countries, more than 80% of households have an account in a financial institution (Caplan et al. 2020).
In this context, this study has focused on the analysis of financial inclusion in Peru, where poverty and monetary vulnerability reach 61% of the population. By geographical area, poverty is more prevalent in rural areas (40%) than in urban areas (22%). By natural region, the highlands and jungle are poorer than the coast, due to the informality of economic activities that employ 95% of the rural labor force and 71% of the urban labor force (INEI 2022). A relevant factor is the concentration of financial services for loans and deposits and correspondent ATMs of the country’s largest banks in cities with greater economic development, such as Lima, Arequipa, La Libertad, Moquegua, and Ica, which is a limiting factor for financial inclusion, to the detriment of the less developed cities in the highlands and jungle (Bermeo 2019; Zamalloa et al. 2016; BCR 2014; Boitano and Abanto 2020).
Another relevant factor is the geographic barrier. In Peru, an improvement and expansion of road and telecommunications infrastructure is still pending, as well as internet access in the poorest strata (Vargas 2022; Zamalloa et al. 2016; Sotomayor and Talledo 2018). Thus, the gap in road and telecommunications infrastructure affects more than 50% of households in urban areas, where only 47% of households have access to internet service compared to only 9% of households in rural areas (INEI 2022). In 2014, the gap in access to financial services affected 71% of older adults who did not have a bank account. There was an absence of points of attention (offices, ATMs, correspondent ATMs, and establishment of basic operations) in 46% of the country’s districts. In addition, only 31% of households in urban areas, and 1% in rural areas, had access to internet service (SBS 2022; INEI 2022).
Under this situation, the most relevant actions in terms of inclusion policy in recent years have come from the guidelines and objectives of the Multisectoral Committee, the National Financial Inclusion Strategy (ENIF), and the National Financial Inclusion Plan (PNIF). Policies have been aimed at promoting a favorable environment for the development of microfinance with access to formal credit in areas with financial exclusion (León-Ramírez 2022; Marr et al. 2014), the opening of correspondent ATMs, the implementation of the program to promote a tax culture, the development of the financial inclusion strategy for social programs, and the regulation of the Electronic Money Law (CMIF 2021).
However, in the short term, the pandemic changed the form of access to financial services, accelerated the closure of agencies nationwide, and promoted the use of digital channels. It should be noted that in that period, 53% of households in urban areas and 91% of households in rural areas lacked access to internet service (SBS 2022; INEI 2022). The situation aggravated financial exclusion in populations whose features, such as low income, low educational level, being a woman, having informal work (Sotomayor and Talledo 2018; Bermeo 2019; Izquierdo and Tuesta 2015; Aurazo and Gasmi 2022), financial and digital illiteracy, lack of financial culture, and residing in remote populations with low population density, foster voluntary exclusion (Boitano and Abanto 2020; Vargas 2022; Garcia Bianchi et al. 2020; Aparicio and Jaramillo 2012). Other factors, such as cultural (saving through third parties), the practice of informal loans, the perception of discrimination on ethnic–racial grounds, and distrust in the financial system due to the inadequate management of some savings and credit institutions supervised by the SBS, have also limited the possibility of financial inclusion among women in the rural sector of the country (Daher et al. 2021). In 2021, the country’s financial inclusion strategy was rethought, and the timeline was extended to 2030 for the achievement of goals, such as expanding participation to 75% of the adult population with an account and extending the financial system’s coverage to 100%, through the expansion of services in remote and poor areas, the implementation of a financial education program that encourages pension savings, the digitalization of payments, the implementation of public digital-access centers, the development of telecommunications infrastructure, and the incentivization of regional and municipal governments to promote financial inclusion and education policies (ENIF 2015).
According to the World Bank (2023b), the country is still far from reaching the programmed goals since only 57% of adults in Peru have a bank account. This growth is partly explained by the government’s need to achieve monetary transfers to the vulnerable population due to the health crisis (SBS 2022; Cejudo et al. 2020). Regarding district coverage, 12% of districts are still financially excluded (SBS 2022).
Currently, the financial system’s offer is distributed among four large banks, 26 microfinance institutions, seven entities specialized in non-retail credit, and 12 entities specialized in consumer credit, among others. The progress of financial inclusion indicators in 2021 shows greater growth in access to financial services, explained by the expansion of the network of service points (branches, ATMs, correspondent ATMs, and basic operations establishments) from 648 to 1495 service points per 100,000 adult inhabitants and the increase in service channels from 90 to 232 per 1000 km2 (SBS 2022). This growth is mainly due to the constant increase in the number of correspondent ATMs. However, its evolution has been uneven among regions due to the dominance of the largest banks (SBS 2022).
The use and quality of the financial system measured by the number of debtors has not shown major changes in recent years (SBS 2022). This is due to factors such as a lack of interest of traditional banks to develop and approximate, financial products adequate to the needs of the population with geographical barriers and lower income (Carballo and Dalle-Nogare 2019), high operating costs and low profitability (Bermeo 2019), and the standardization of financial products that respond to the needs of regular customers located in cities with higher economic development (Boitano and Abanto 2020).
However, sectoral actions have not been enough to reduce the disparity in the country’s regions; there are still limitations in the southern highlands and jungle of the country to access financial services in more remote areas, with low income and geographic gaps (Carballo and Dalle-Nogare 2019; Garcia Bianchi et al. 2020; INEI 2022). In that sense, financial inclusion in Peru is linked to the reduction of poverty incidence (Grados-Smith 2021; Polloni-Silva et al. 2021; Omar and Inaba 2020; Schmied and Ana 2016).
In this context, this study has focused on the analysis of financial inclusion in Peru. First, using the standards described by the Multidimensional Index of Financial Inclusion (MIFI), regarding access to financial services through the number of personal attention points (bank branches and similar), and through the services offered by ATMs and similar outlets. This information is obtained from studies such as the “Financial Access Survey” (FAS) of the International Monetary Fund (IMF). Secondly, this measurement has been completed with the use of an ACI (Access-to-Cash Index), and those areas where financial inclusion in Peru may be compromised have been detected.
The novelty of this research lies in, firstly, applying the measurement methods approved by the IMF at the department level, secondly, complementing the previous information with the ACI method, and, thirdly, detecting those points where financial inclusion may be more compromised. This is completed with an econometric analysis. All of this provides results that can guide the future adoption of inclusive policies by Peruvian financial regulators, financial institutions, and the country’s public authorities.
The article is structured as follows: It begins with an introduction where the concept of financial exclusion is defined, and a distinction is made between two types: voluntary and involuntary. It focuses on the analysis of financial inclusion in Peru using the Multidimensional Index of Financial Inclusion (MIFI) and the Access-to-Cash Index (ACI). A review of the literature on the subject is conducted, and relevant actions in financial inclusion policies over the last two decades are described. In the Materials and Methodology section, data from the IMF’s FAS and the SBS are used to analyze indicators such as the number of bank branches and ATMs in Peru. The methodology includes a comparative analysis at the national and regional levels, as well as a geographic analysis of access points to banking services and the application of the ACI method. An econometric analysis is performed through linear regression. The results show FAS metrics in Peru and comparisons at the department level, identifying patterns related to Peruvian financial inclusion.

2. Literature Review

The context for financial inclusion in Peru is that the country faces high levels of poverty, informality, concentration of financial services, and geographic barriers in poorer regions (Boitano and Abanto 2020; Zamalloa et al. 2016). According to the Institute of Statistics and Informatics (INEI 2022), poverty and monetary vulnerability reach 61% of the population. By geographical area, poverty affects rural areas to a greater extent (40%) than urban areas (22%). By natural region, the highlands and the jungle are poorer than the coast due to the informality of economic activities that employ 95% of the rural labor force and 71% of the urban labor force (INEI 2022).
The most relevant actions in terms of inclusion policy in the last two decades have been aimed at promoting access to the financial system, with the opening of correspondent ATMs, the implementation of the program to promote tax culture, the development of the financial inclusion strategy for social programs, and the regulation of the Electronic Money Law (CMIF 2021). In the last decade, the regulatory framework, and the favorable environment for the development of microfinance (León-Ramírez 2022), allowed for access to formal credit in areas with financial exclusion (Marr et al. 2014). However, sectoral actions have not been sufficient to increase access to financial services in remote areas with low incomes, such as the departments located in the highlands and jungle of the country, nor to reduce the disparity in the country’s regions (Carballo and Dalle-Nogare 2019; Garcia Bianchi et al. 2020; INEI 2022).
In 2014, the access gap affected 71% of older adults. who did not have a bank account. There was an absence of attention points (offices, ATMs, correspondent ATMs, and basic operation establishments) in 46% of the country’s districts. In addition, only 31% of households in urban areas and 1% in rural areas had access to internet service. (SBS 2022; INEI 2022). This diagnosis motivated the formation of the public and private Multisectoral Committee, which established the guidelines of the National Financial Inclusion Strategy (ENIF) in 2015 and the National Financial Inclusion Plan (PNIF) in 2021. With ambitious goals to improve the use, access, and quality of financial services by the year 2030 through the implementation of a financial education program that encourages pension savings and the digitalization of payments, the State has arranged to digitalize payments for public services. Other relevant goals are the increase of the financial system’s service network in remote and poor areas, the reduction of information costs, the implementation of public digital-access centers, the development of telecommunications infrastructure, and the incentivization of regional and municipal governments that promote financial inclusion and education policies (CMIF 2021).
Currently, the financial system’s offer is distributed among four large banks, 26 microfinance institutions, seven entities specialized in non-retail credit, and 12 entities specialized in consumer credit, among others. The progress of the financial inclusion indicators in 2021 shows greater growth in access to financial services, explained by the expansion of the network of service points (branches, ATMs, correspondent ATMs, and basic operation establishments) from 648 to 1495 service points per 100,000 adult inhabitants and the increase in service channels from 90 to 232 per 1000 sq. km (SBS 2022).
This growth is mainly due to the constant increase in the number of correspondent ATMs (SBS 2022). However, their evolution has been uneven among regions due to their concentration in large cities with greater economic development such as Lima, Arequipa, La Libertad, Moquegua, Ica, and, to a lesser extent, in poor highland and jungle regions (Bermeo 2019; Zamalloa et al. 2016). This is due to the representativeness of the country’s largest banks, their dominance in the loan and deposit market, and their 80% share of correspondent ATMs (Boitano and Abanto 2020; BCR 2014).
The use and quality of the financial system measured by the number of debtors has not shown major changes in recent years (SBS 2022). This is due to factors such as a lack of interest of traditional banks in developing and approximating financial products suitable to the needs of the population with geographical barriers and lower income (Carballo and Dalle-Nogare 2019) and high operating costs and low profitability (Bermeo 2019), as well as the lack of interest in standardizing financial products that respond to the needs of regular customers located in cities with higher economic development (Boitano and Abanto 2020).
According to (World Bank 2023b), only 57% of adults in Peru have a bank account, far from the ENIF target of including at least 75% of the population. In part, the growth in access to bank accounts has been promoted by the government’s need to achieve cash transfers to the vulnerable population due to the health crisis (SBS 2022; Cejudo et al. 2020). Also, the district coverage proposed as an ENIF objective for 2021 to reach 100% of the districts with the financial system has not been met; 12% of the districts are still financially excluded (SBS 2022).
The pandemic, in the short term, changed the form of access to financial services, accelerated the closure of agencies nationwide, and promoted the use of digital channels. It should be noted that in that period, only 47% of households in urban areas and 9% in rural areas had access to internet service (SBS 2022; INEI 2022). This situation aggravates financial exclusion in populations whose factors such as low income, low educational level, being a woman, having informal work, (Sotomayor and Talledo 2018; Bermeo 2019; Izquierdo and Tuesta 2015; Aurazo and Gasmi 2022), financial and digital illiteracy, lack of financial culture, distrust in the financial system, and residing in remote populations with low population density foster voluntary exclusion (Boitano and Abanto 2020; Vargas 2022; Garcia Bianchi et al. 2020; Aparicio and Jaramillo 2012).
In Peru, the improvement and expansion of road and telecommunications infrastructure, as well as internet access in the poorest strata, to ensure greater financial inclusion is still pending (Vargas 2022; Zamalloa et al. 2016; Sotomayor and Talledo 2018). Under this context, financial inclusion in Peru is linked to the reduction of poverty incidence (Grados-Smith 2021; Polloni-Silva et al. 2021; Omar and Inaba 2020; Schmied and Ana 2016).
In turn, between 2011 and 2021, in economies such as Peru, account ownership in a banking institution increased by more than 25%. Moreover, the gender gap narrowed significantly after 2017, as between 2017 and 2021, account ownership by women increased by almost 60%. In Peru, more than 60% of unbanked adults cited cost as an obstacle, followed by distance, according to the latest published GF data.

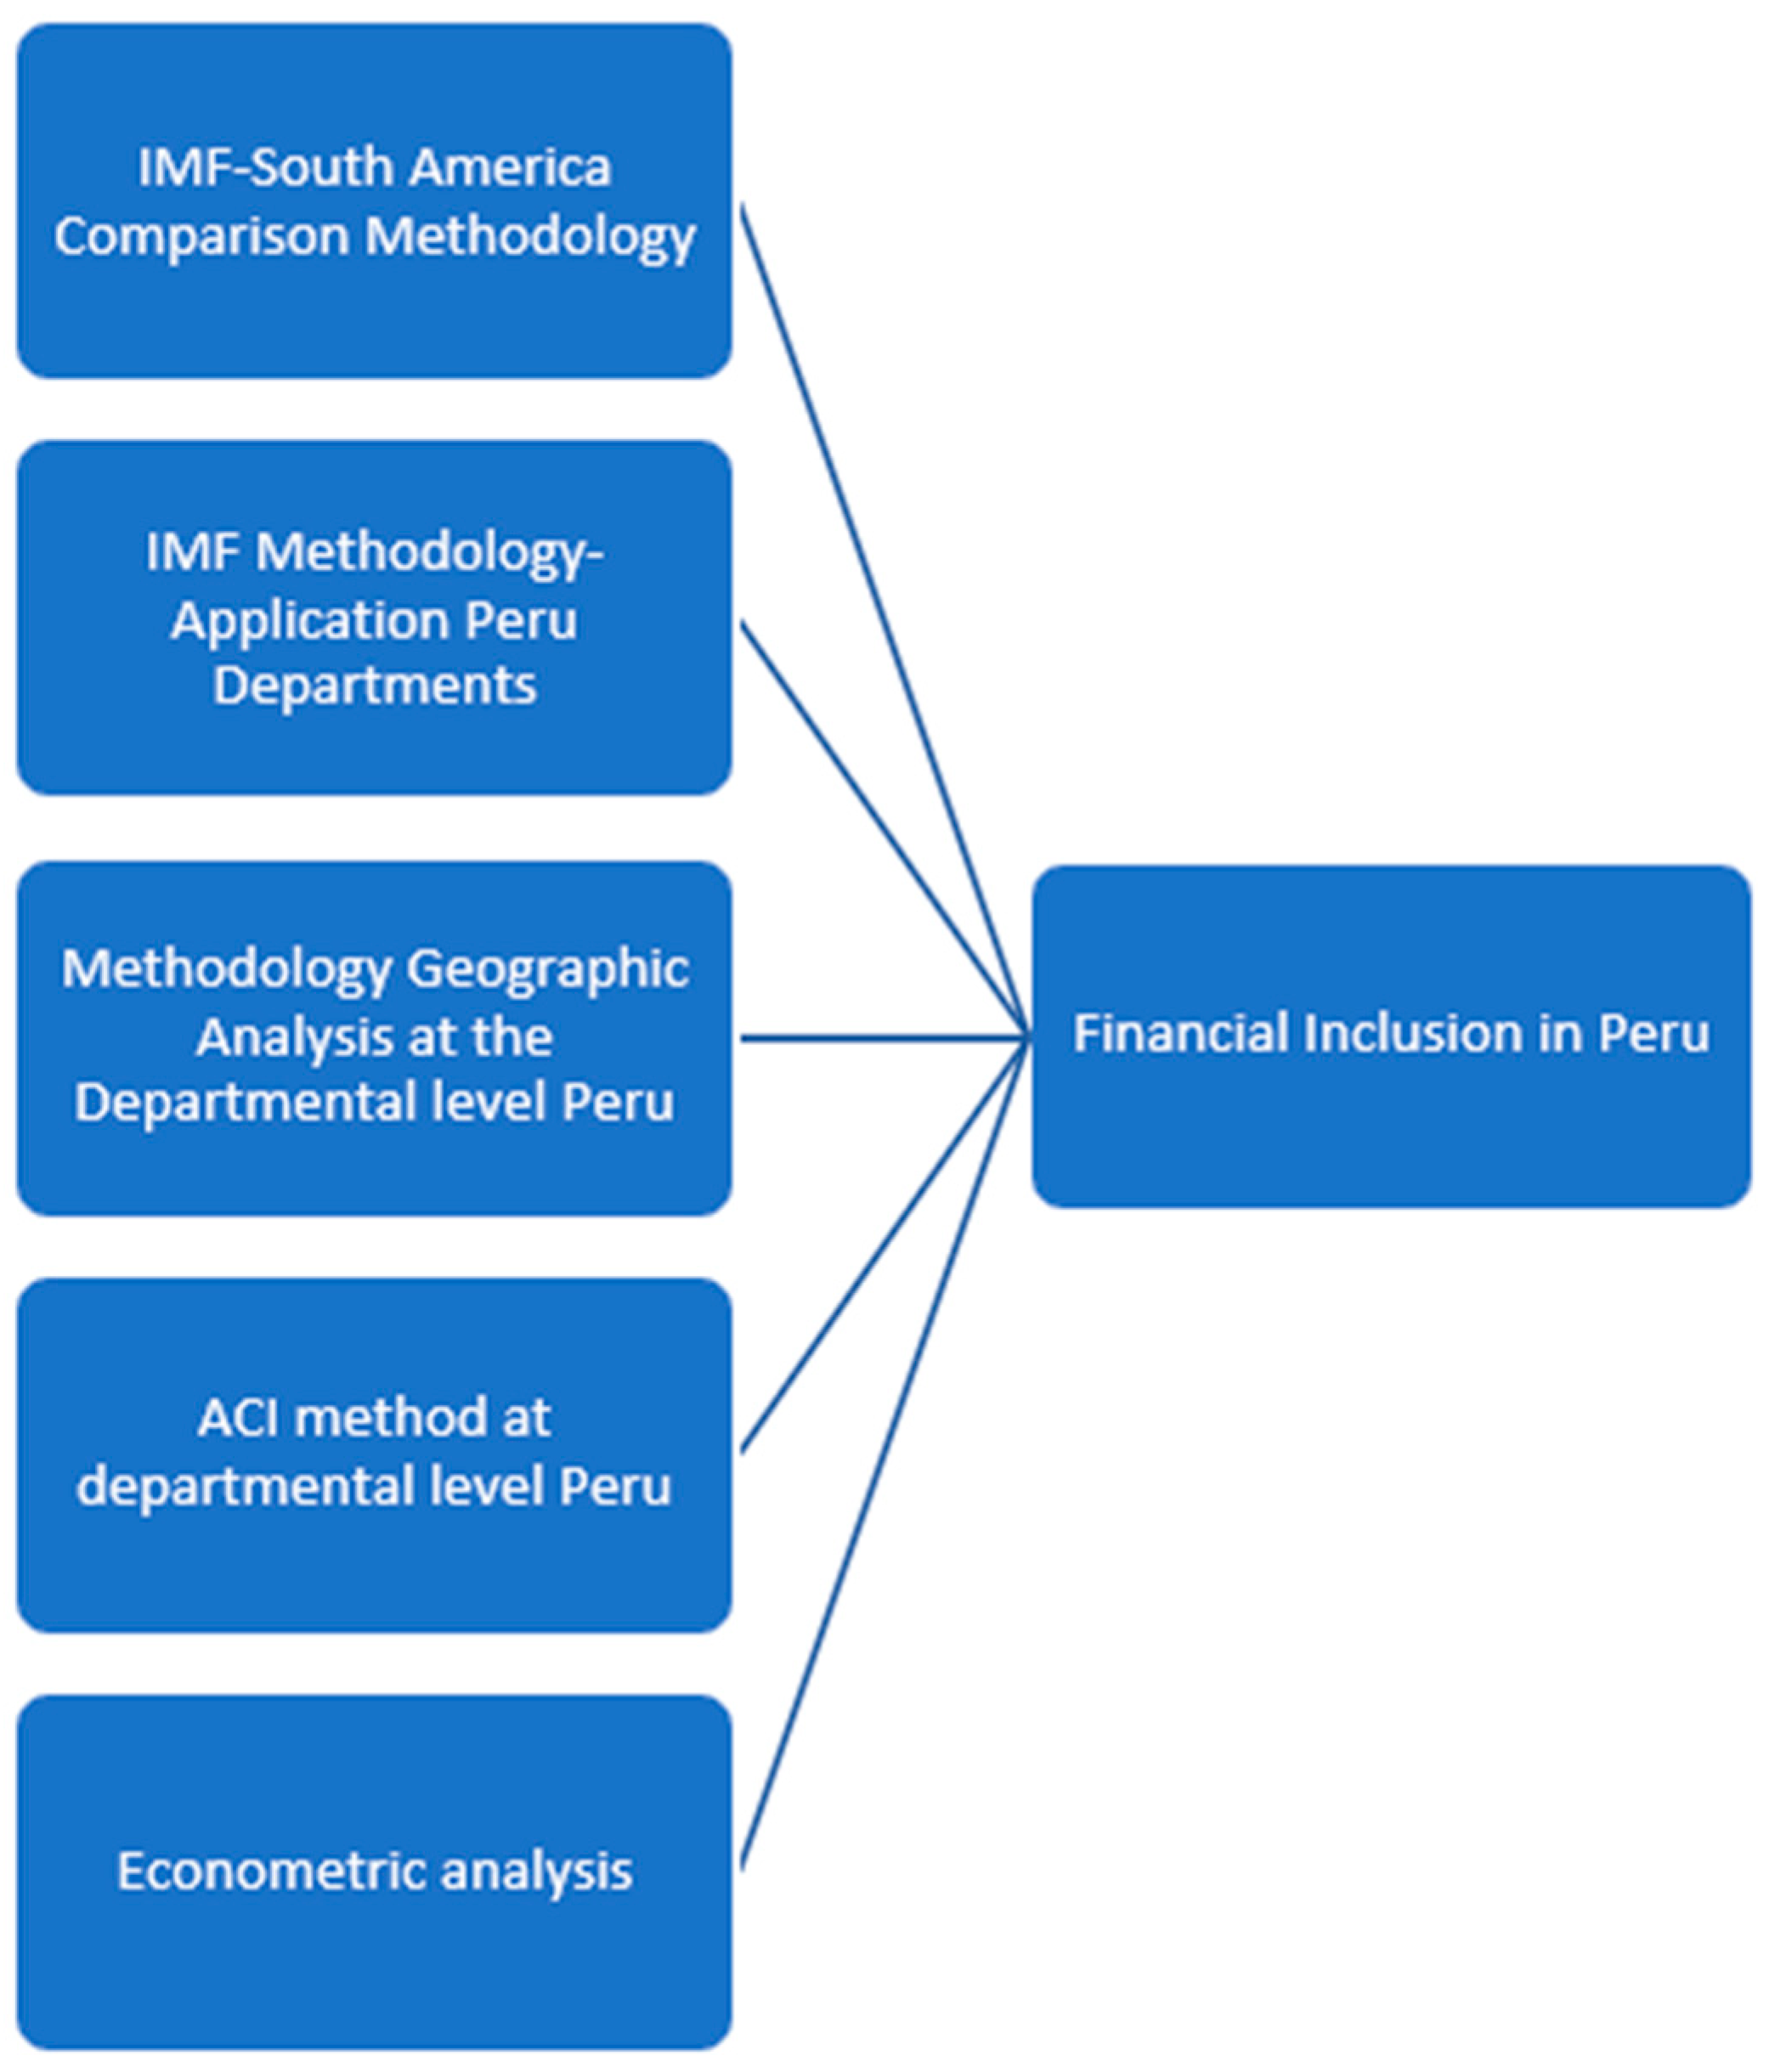
3. Materials and Methodology

3.1. Materials

First, we have taken the IMF’s FAS data for the four fundamental indicators (IMF 2022) for the case of Peru, the territorial unit under study. These indicators are shown in Table 1.
Secondly, data were extracted from the Superintendency of Banking, Insurance and Private Pension Fund Administrators (SBS) through its website with an advanced data search engine and a direct request (SBS 2022). After extracting data on bank offices by department, province, district, and address, as well as on offices with ATMs, a dataset was generated with 3764 records on bank offices and another with 6067 records on ATMs (available in data statement section).

3.2. Methodology

A five-fold methodology was used in the analysis. First, the method used by the IMF (2022) has been applied, and a comparative analysis has been made between South American countries based on the four selected variables (see Table 1). This method has been widely employed in the literature: Inoue and Hamori (2016) in Sub-Saharan Africa; Rajamohan and Subha (2011) in India; Świecka and Wyszkowska-Kaniewska (2019) in Poland, Korczak (2019) in Germany, or Omar and Inaba (2020) in Asia.
Secondly, the previous methodology is replicated, but at the regional level, and the four selected variables are analyzed, but at the department level based on data extracted from the SBS (2022). This type of analysis from a regional perspective has also been recurrently applied in other previous studies: Kumar and Beck (2005) in Brazil; Carlson et al. (2015) in Nigeria; Elouaourti and Ezzahid (2022) in Morocco; Higgs et al. (2022) in Wales; Náñez Alonso et al. (2022b) in Spain; Barbieri et al. (2021) in Italy, or He and Yeung (2011) in China.
Thirdly, a geographical representation of the physical access points to banking services (through bank branches or ATMs) has been conducted. A similar analysis approach can be found in other background research, such as the studies by Elouaourti and Ezzahid (2022) in Morocco; Evans et al. (2020) and Higgs et al. (2022) in Wales; Náñez Alonso et al. (2022a) in Poland; Cadete de Matos and D’Aguiar (2018) in Portugal; Trütsch (2022) in Switzerland; Stix (2020a) and Stix (2020b) in Austria; or Chen and Strathearn (2020) in Canada.
Fourthly, the application of the ACI method has been conducted in the different departments of Peru. To do this, the points of access to financial services were taken, adopting the methodology described in the third point and assigning a score to each form of access. This methodology initially applied by Tischer et al. (2019) for the case of the city of Bristol (U.K.) has also been adopted in other subsequent research: Delaney et al. (2019) and Caddy and Zhang (2021) in Australia; Náñez Alonso et al. (2022a) in Poland; or by institutions such as the Banque de France (2022). Equation (1) shows the ACI index:
( A C I ) = i = 1   n ( X 1 × Y 1 ) + ( X 2 × Y 2 ) + ( X n × Y n )
where X1 is the number of existing bank offices in each Peruvian department; X2 is the number of ATMs in each Peruvian department; Y1 is the score assigned to access to banking services through a bank office, which is denoted by X1; and Y2 is the score assigned to access to banking services through an ATM. Therefore, the summation after application of the formula denoted above will yield a numerical result for each department, combining access through physical points (bank offices and ATMs), which will make it possible to detect the areas with the lowest access value (and, therefore, the highest risk of financial exclusion) for each department. For the construction of the index, the type of infrastructure (bank branches, ATMs, etc.) was multiplied by a score established for each type of facility based on the cost and accessibility to cash withdrawal of that type of infrastructure. This is subsequently reflected in the following equation (Equation (2)). The score assigned to ATMs and bank branches responds to three criteria: (i) temporary availability, (ii) universal availability, and (iii) need to conduct another type of transaction when accessing cash. In terms of temporal availability when assigning a score, this refers to the number of hours that said element is available for use by people who want to access the banking service. ATMs are available 24 h a day, 365 days a year, while post offices and bank branches are subject to time restrictions that are usually determined by business hours, as well as closure during some days of the week. As for universal availability, it refers to the existence of transaction costs when the user is not a customer of the entity offering the service. In the case of bank branches, a score of 1 has been assigned when constructing the ACI since there is a time limitation (they are only open during business hours); they normally only provide services to customers of the bank (use is limited or restricted); and, in the case of accepting other customers, they may charge commissions.
This same score was assigned for these reasons in other previous studies (Tischer et al. 2019; Evans et al. 2020; Caddy and Zhang 2021; Náñez Alonso et al. 2022a; Náñez Alonso et al. 2022b). In the case of ATMs, a score of 3 was assigned when constructing the ACI since they are available and operational 24 h a day; they are available to anyone, not only to the bank’s own customers. There is no cost (withdrawal fee or similar) for customers of the bank operating the ATM, although they may charge a fee to customers of other banks. Therefore, the ACI would be defined as follows, as shown in Equation (2):
( A C I ) = i = 1   n ( X 1 × 1 ) + ( X 1 × 3 ) + ( X n × Y n )
Fifth, considering the objective of the study, an econometric analysis was performed through linear regression. This method allows us to generate a composite Financial Inclusion Index (FII) that was developed by Yadav and Sharma (2016) and subsequently replicated in other studies such as those of Demir et al. (2020), Nizam et al. (2020), Nizam et al. (2021), or Salah Uddin and Begum (2023), among others. The basic equation estimated by regression is:
y i j = + β G D P + δ H D I + μ B b 1 + ρ A T M 1   + ε i j
where yij is the dependent variable representing the values for Individual i in Country j of the variable we use as measures of financial inclusion: percentage of adults with a bank account. The explanatory variables refer to individual characteristics of citizens, and the objective of the econometric analysis is to estimate the values of the parameters that accompany them. εij is a normally distributed error term with zero mean and variance equal to 1. In our case, GDP is the GDP per capita per department; HDI would be the human development index of each department. Bb1 would be bank offices per 100,000 inhabitants, while ATM1 would be ATMs per 100,000 inhabitants. All of these variables (along with others that have been discarded), are listed in Table A1 of Appendix A.
Figure 1 shows the five-fold methodology used to measure and analyze the financial inclusion situation in Peru, both at the country level and compared to other South American countries, but especially at the departmental level. The results obtained for each department after the application of Equation No. two are available online in open format as complementary material (see data statement section).

4. Results

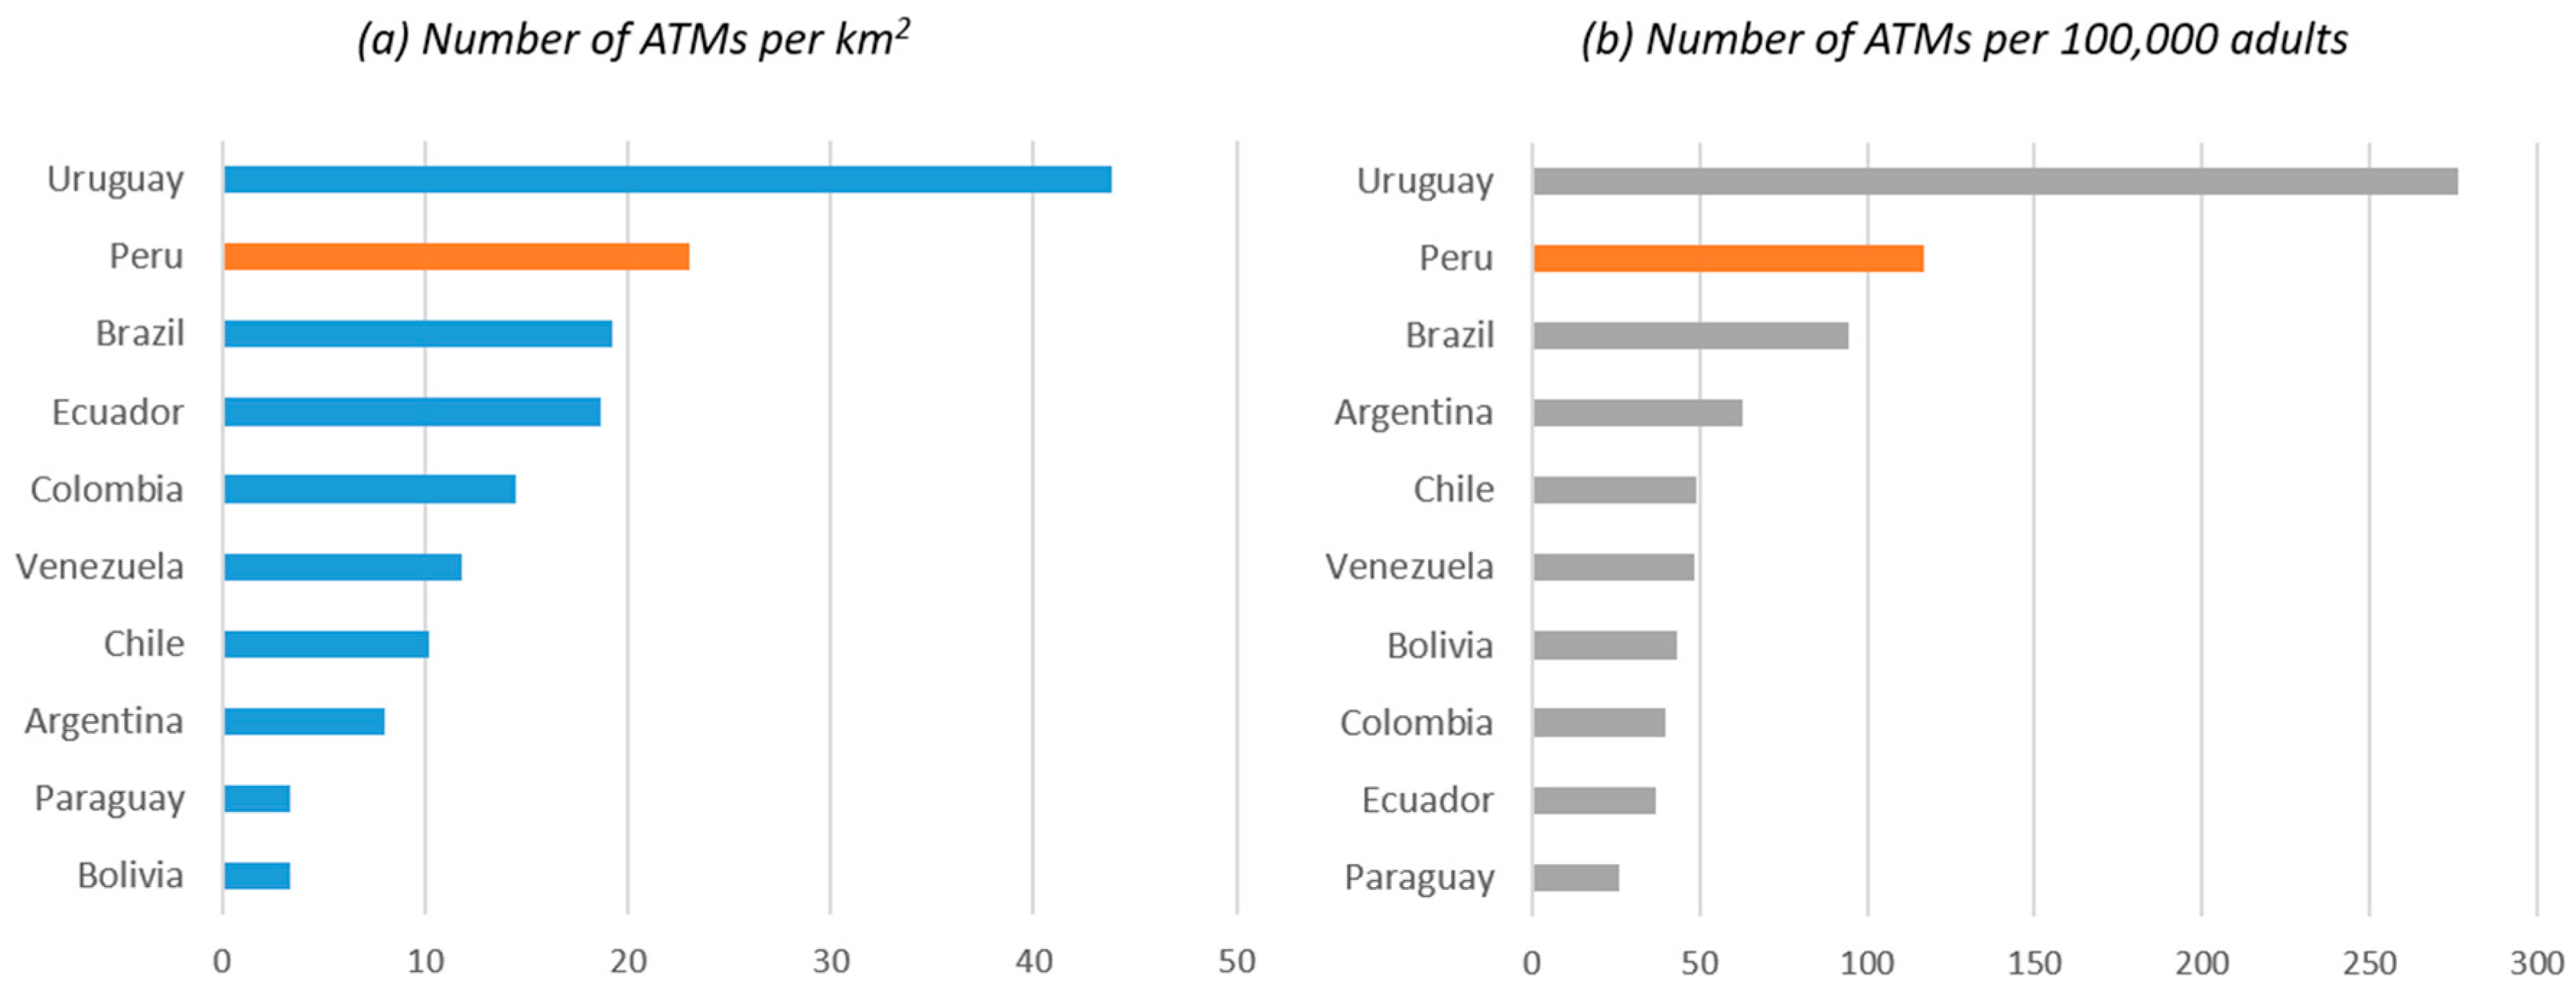
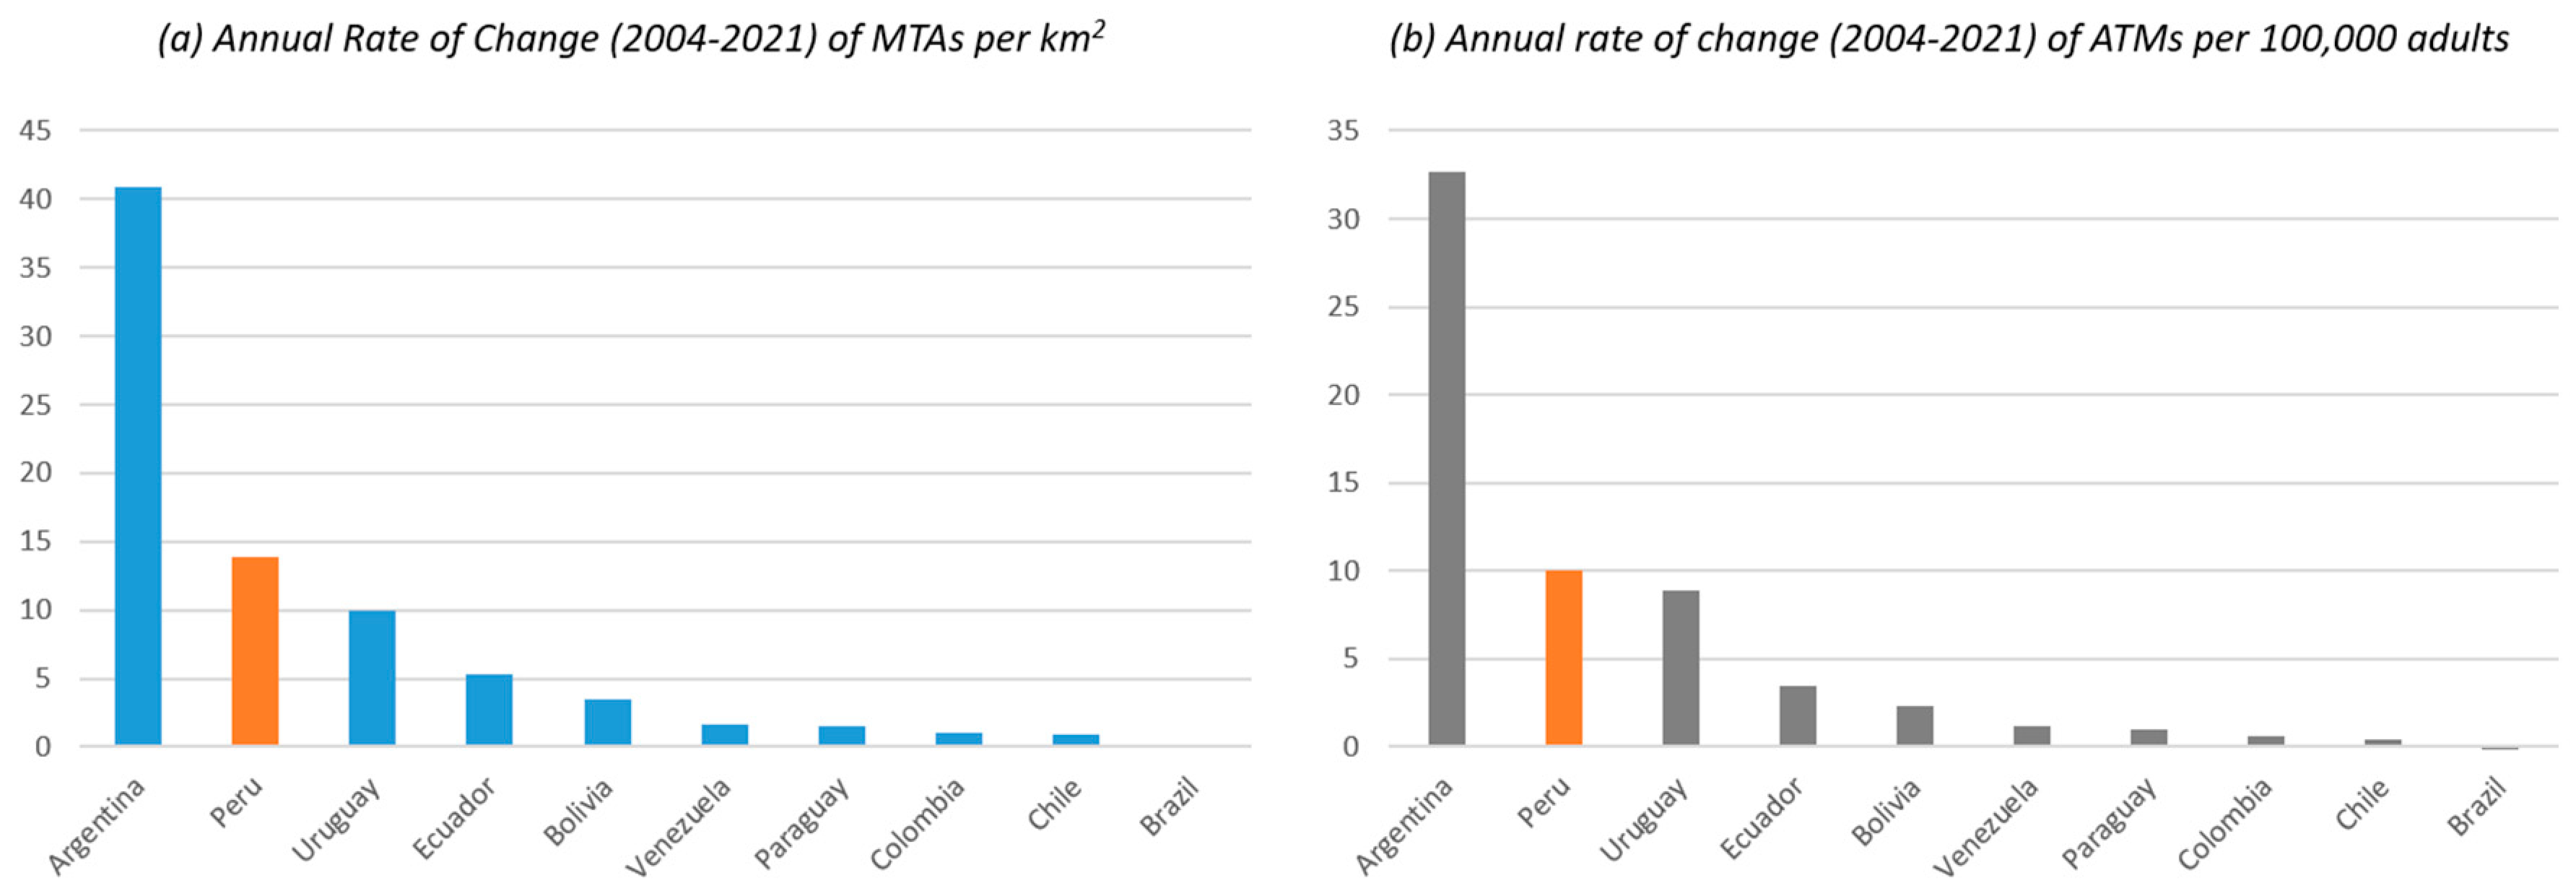
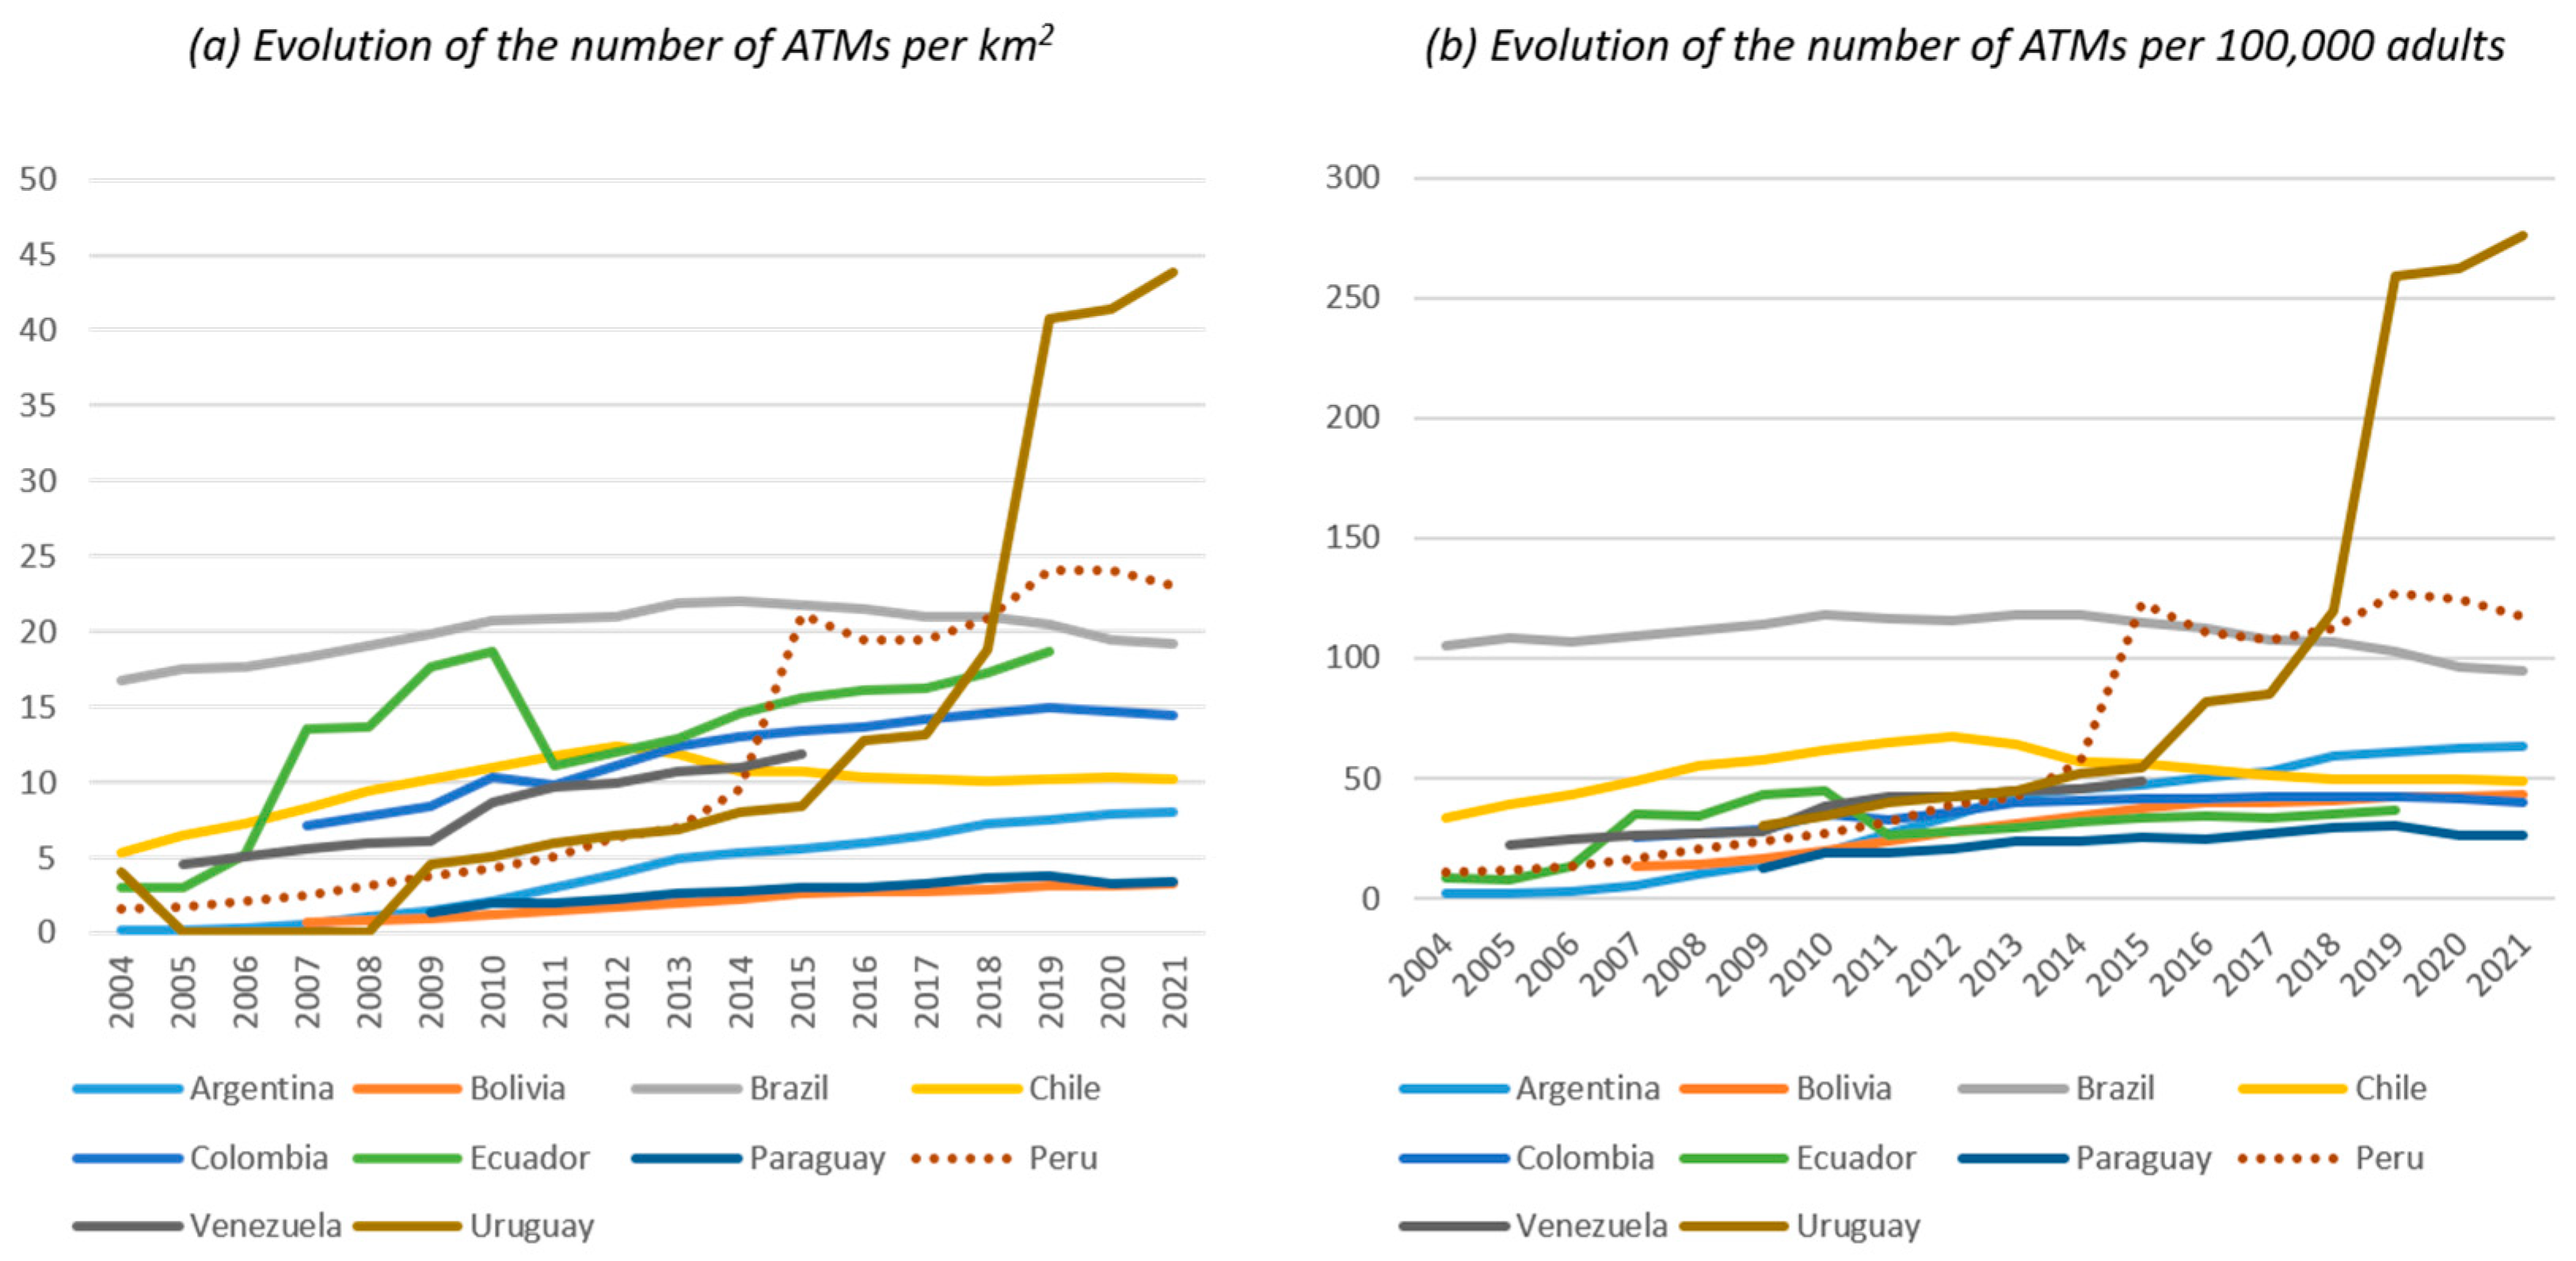
4.1. Results Derived from the Application of FAS Metrics in Peru and South America Comparison

In order to identify the main common and divergent characteristics of Peru in the area of financial inclusion with respect to other surrounding economies, a comparative analysis was conducted at the international level based on macroeconomic and financial data provided by the IMF in the FAS. In particular, the analysis was conducted while taking South America as a reference area, with the selected countries being Uruguay, Brazil, Ecuador, Colombia, Venezuela, Chile, Argentina, Paraguay, and Bolivia. The time unit of analysis covered the period from 2004 to 2021. The variables selected for this benchmarking exercise were the four key indicators collected by IMF (2022) (see Table 1).
First, to evaluate the degree of spatial coverage of ATMs, the number of ATMs per square kilometer was analyzed. As shown in Figure 2, in relation to the number of ATMs per square kilometer, Peru maintains a prominent position in comparison with the rest of the countries analyzed in the region. In particular, in Peru, 23 ATMs per square kilometer were registered in 2021, which is above the average of the South American countries analyzed (15.6 ATMs per square kilometer) and seven times the number registered in Bolivia, the country with the highest ATM deficit. Only Uruguay has a higher number than Peru.
In terms of the number of ATMs per 100,000 adults, the figures reveal that Peru provides better access among its population. In particular, in the year 2021, it reached a figure of over 117 ATMs/100,000 adults, which is around 48% more ATMs than the average of the countries that comprise the territorial unit of analysis of this study and 4.5 times more than the number registered in Paraguay, the country with the worst ATM coverage per capita (adult population). These figures place Peru as the economy with the second-best access to ATMs by population, only behind Uruguay.
Looking at the time dimension, an analysis of the evolution of the number of ATMs per sq. km and per 100,000 adults reveals the effort made by Peru throughout the 2014–2021 period to improve the population’s access to this type of service. In particular, as shown in Figure 3, during this time, the number of ATMs per sq. km and per 100,000 adults increased by around 14% and 10%, making Peru the country with the second-highest cumulative variation rate, only behind Argentina and well above countries such as Brazil or Chile.
Regarding the evolution of the number of available ATMs, a relatively homogeneous trend can be observed in the set of South American countries analyzed, whose turning point is found in the world economic crisis of 2008. Prior to this crisis, there was a growing trend in the improvement of the population’s financial access through the increase in the number of ATMs available, which stagnated in the years after 2008. Once the effects of the financial crisis had been overcome, there was again an improvement in the financial coverage ratio of the population through a greater availability of ATMs (see Figure 4).
Although Peru’s position in relation to the ATM indicator is remarkably good in comparison with the surrounding countries, the same is not true when analyzing the number of bank branches available. Both the supply of financial branches per sq. km and per 100,000 adults reveal a certain deficit in the Andean country, which may be an obstacle to achieving an improvement in the financial inclusion of the population. As Figure 5 shows, Peru is the country with the worst coverage of bank branches both spatially and per capita (adult population).
Despite this situation, as shown in Figure 6, throughout the period 2004–2019, Peru made a greater effort than most other countries to maintain and sensibly increase the supply of bank branches among the population. However, in the context of the COVID-19 pandemic, the supply of branches clearly contracted in 2020 due to the closure of bank offices and the rise of digital financial services (SBS 2022).
Finally, with regard to the evolution of the number of bank branches available, as shown in Figure 7, there is an increasing trend until 2016, after which there is a change in behavior with a gradual reduction in the number of bank branches and a less increasing trend in branches per capita in relation to the increase in the adult population.

4.2. Results Derived from the Application of FAS Metrics at the Department Level in Peru

The IMF methodology (FAS) is replicated using the four selected key indicators (see Table 1). This results in the following figures.
Figure 8 shows the existence of greater access to ATMs per 100,000 inhabitants in departments with greater economic and social development, such as the department of Lima (61.10 ATMs per 100,000 adult inhabitants), with the highest value at the departmental level. It is followed by Arequipa, with a result of 47.22, and Moquegua, with a result of 45.59; these are departments located in the coastal region of the country. The departments with the least access to ATMs in the country are located in the highlands and Amazon jungle regions, such as Huancavelica (7.34), Ayacucho (12.19), Apurimac (13.66), Huanuco (13.97), Loreto (14.70), and Amazonas (14.74).
According to Figure 9, access to financial services through bank branches in Peru is concentrated in the central and southern departments of the country. Moquegua (32.68), Arequipa (22.99), Tacna (21.47), Ica (19.88), and Lima (19.34) stand out as departments with greater access to bank branches per 100,000 inhabitants and, coincidentally, are more competitive and less poor, according to the Regional Competitiveness Index (INCORE) of 2022, which measures and compares the economic, social, and poverty-related performance of the country’s departments based on the analysis of indicators such as economic environment, infrastructure, health, education, labor, and institutions. On the other hand, Loreto (8.50), Huancavelica (10.9), and Ancash (11.90) have the lowest concentration of bank branches and, according to INCORE, are the least competitive in the country and the poorest.
In Peru, the most populated department is Lima (approximately 10-million inhabitants). In particular, Metropolitan Lima and the Constitutional Province of Callao represent approximately 30% of the population in Peru. This has an impact on their population density (5047 inhabitants/sq. km in Lima). This explains the findings shown in Figure 10: Access to ATMs per sq. km by department is highly concentrated in Lima, and they are mainly located on the coast. This is the most competitive department in the country. In the highlands and, to a greater extent, in the jungle, the precariousness of ATM access is aggravated. Thus, in Loreto and Madre de Dios, the measurement of ATM access per Sq. km represents 0.000 access points, followed by Ucayali, Amazonas, Pasco Huancavelica, and Ayacucho with 0.001 ATM points per sq. km.
In terms of branch coverage per sq. km, Figure 11 confirms the concentration of financial entities in the departments with the largest economic environment, such as Lima with 0.5851 and the Constitutional Province of El Callao with 0.0411. Far below these values are the departments of Loreto (0.0001), Madre de Dios (0.0003), and Ucayali (0.0005), located in the Amazon jungle region, which also have low levels of competitiveness in terms of the economic environment, infrastructure, health, education, and labor environment.

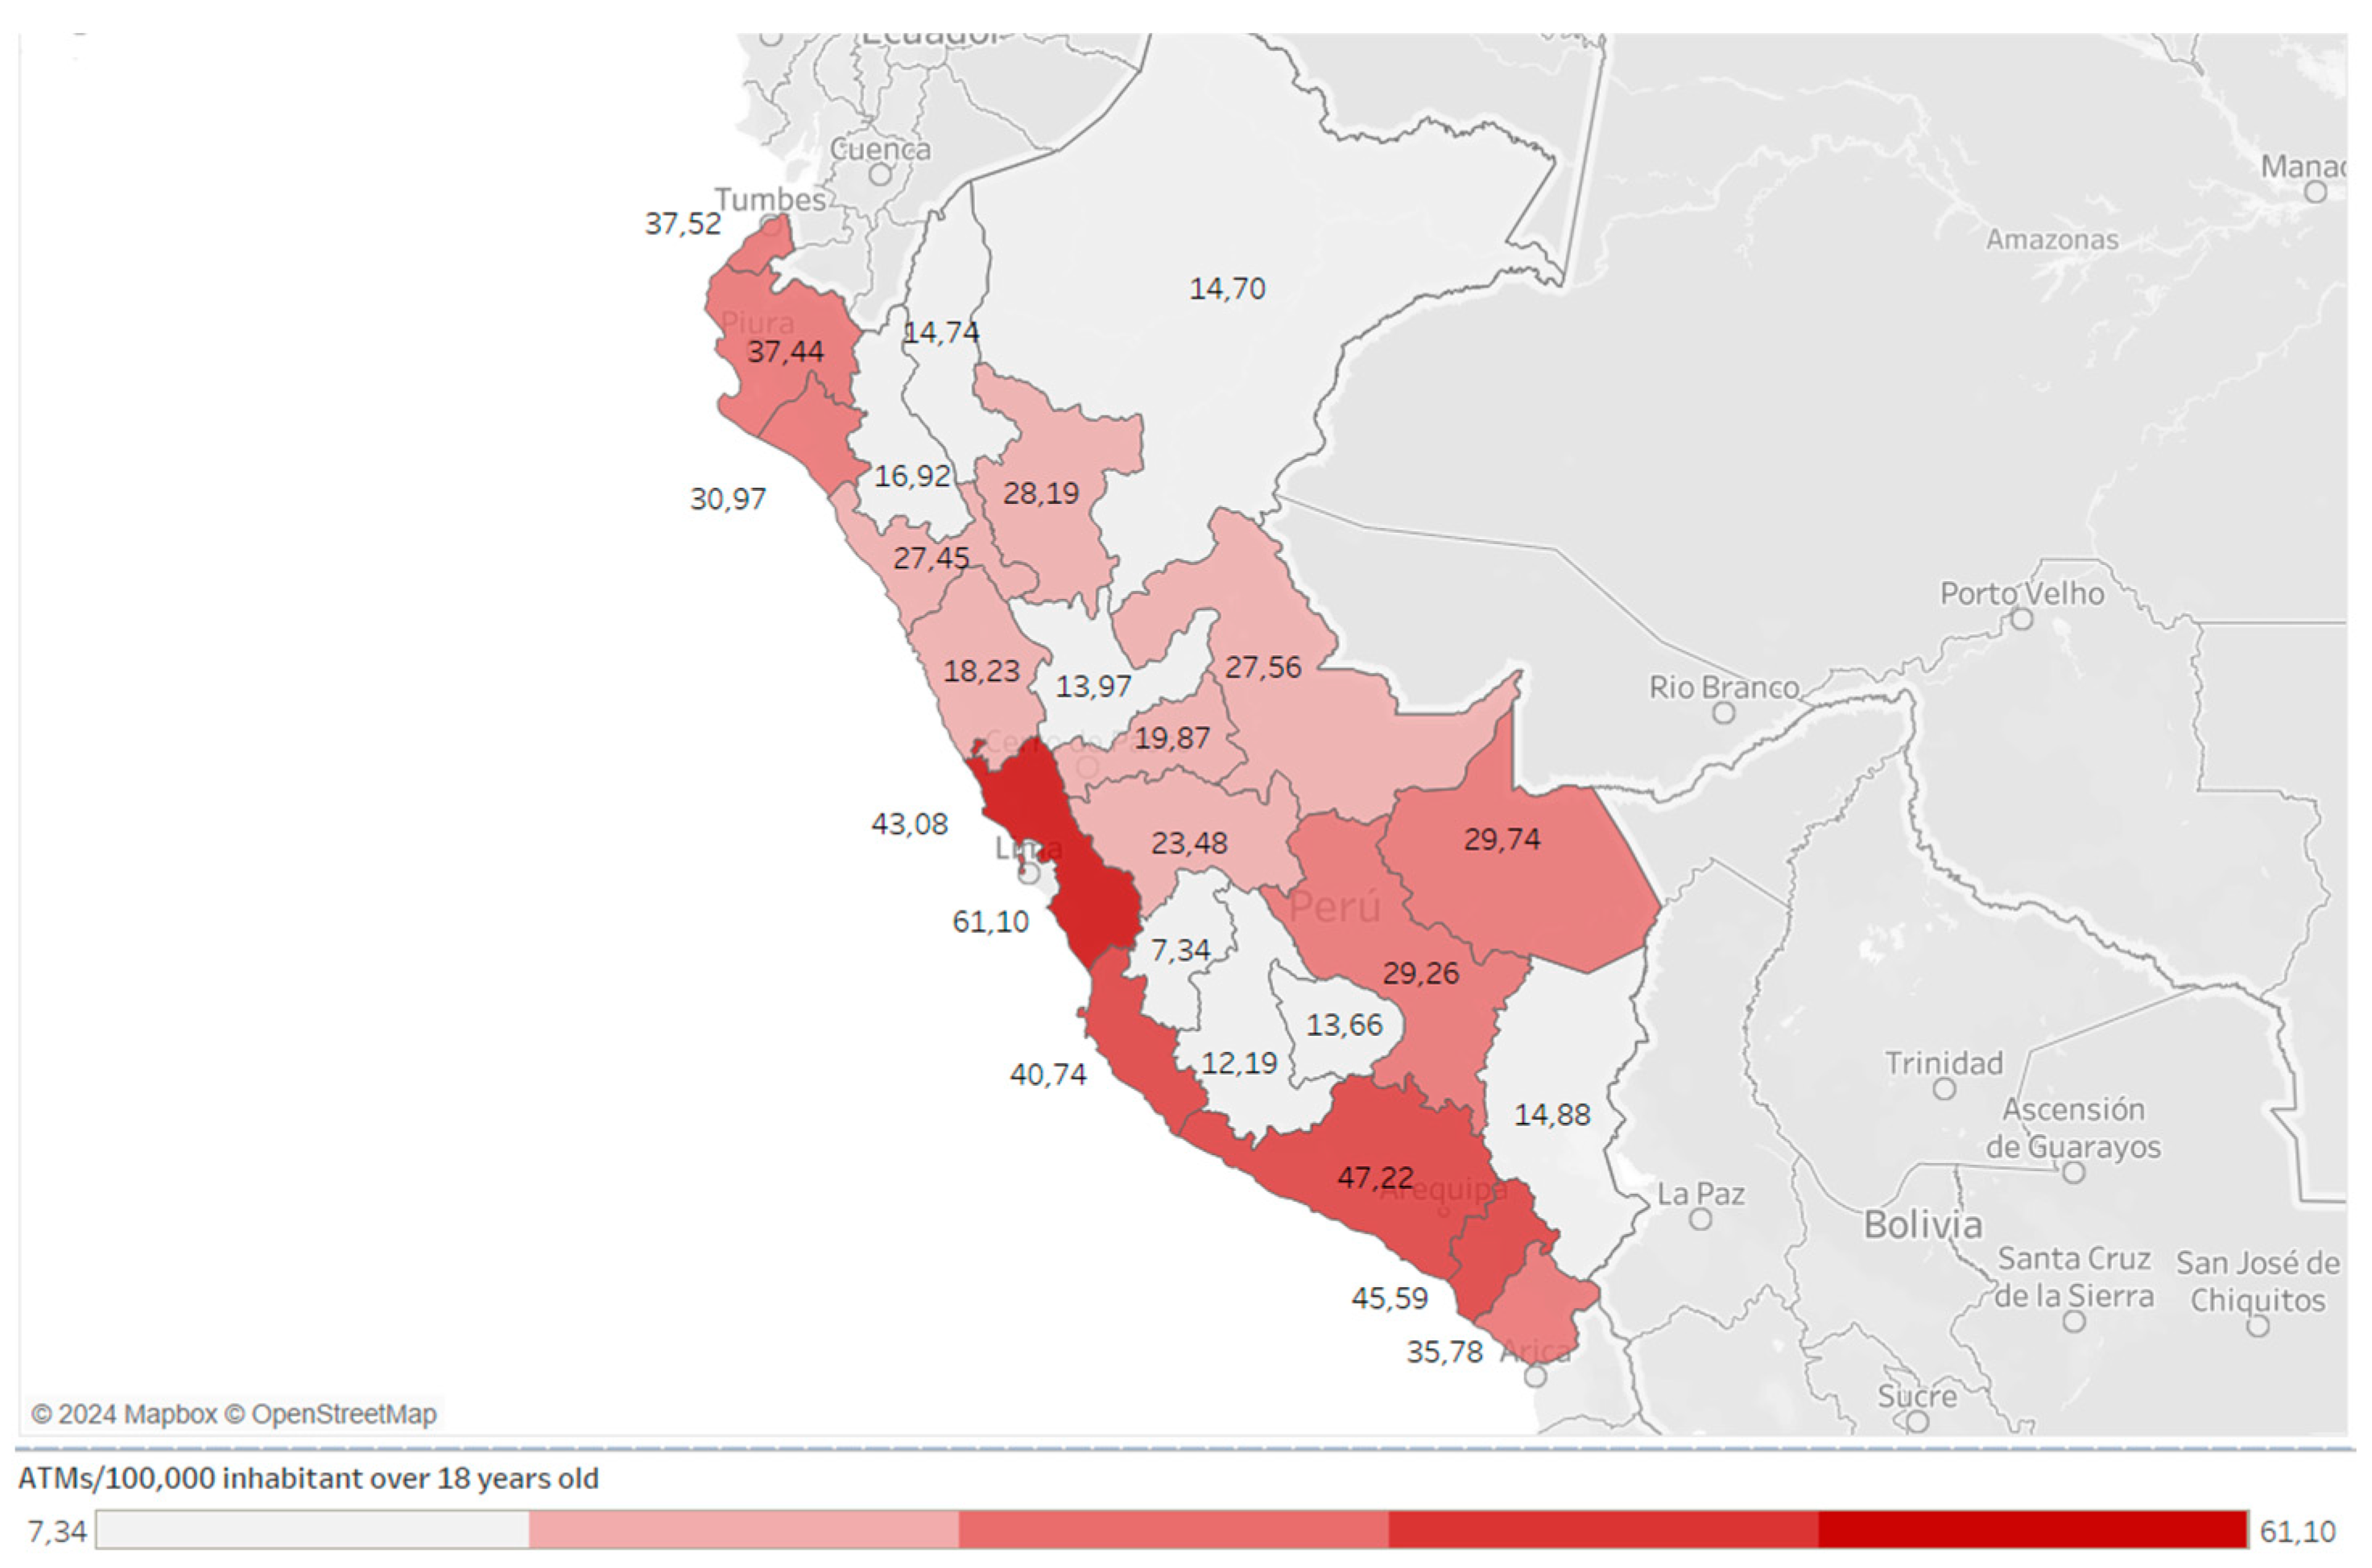
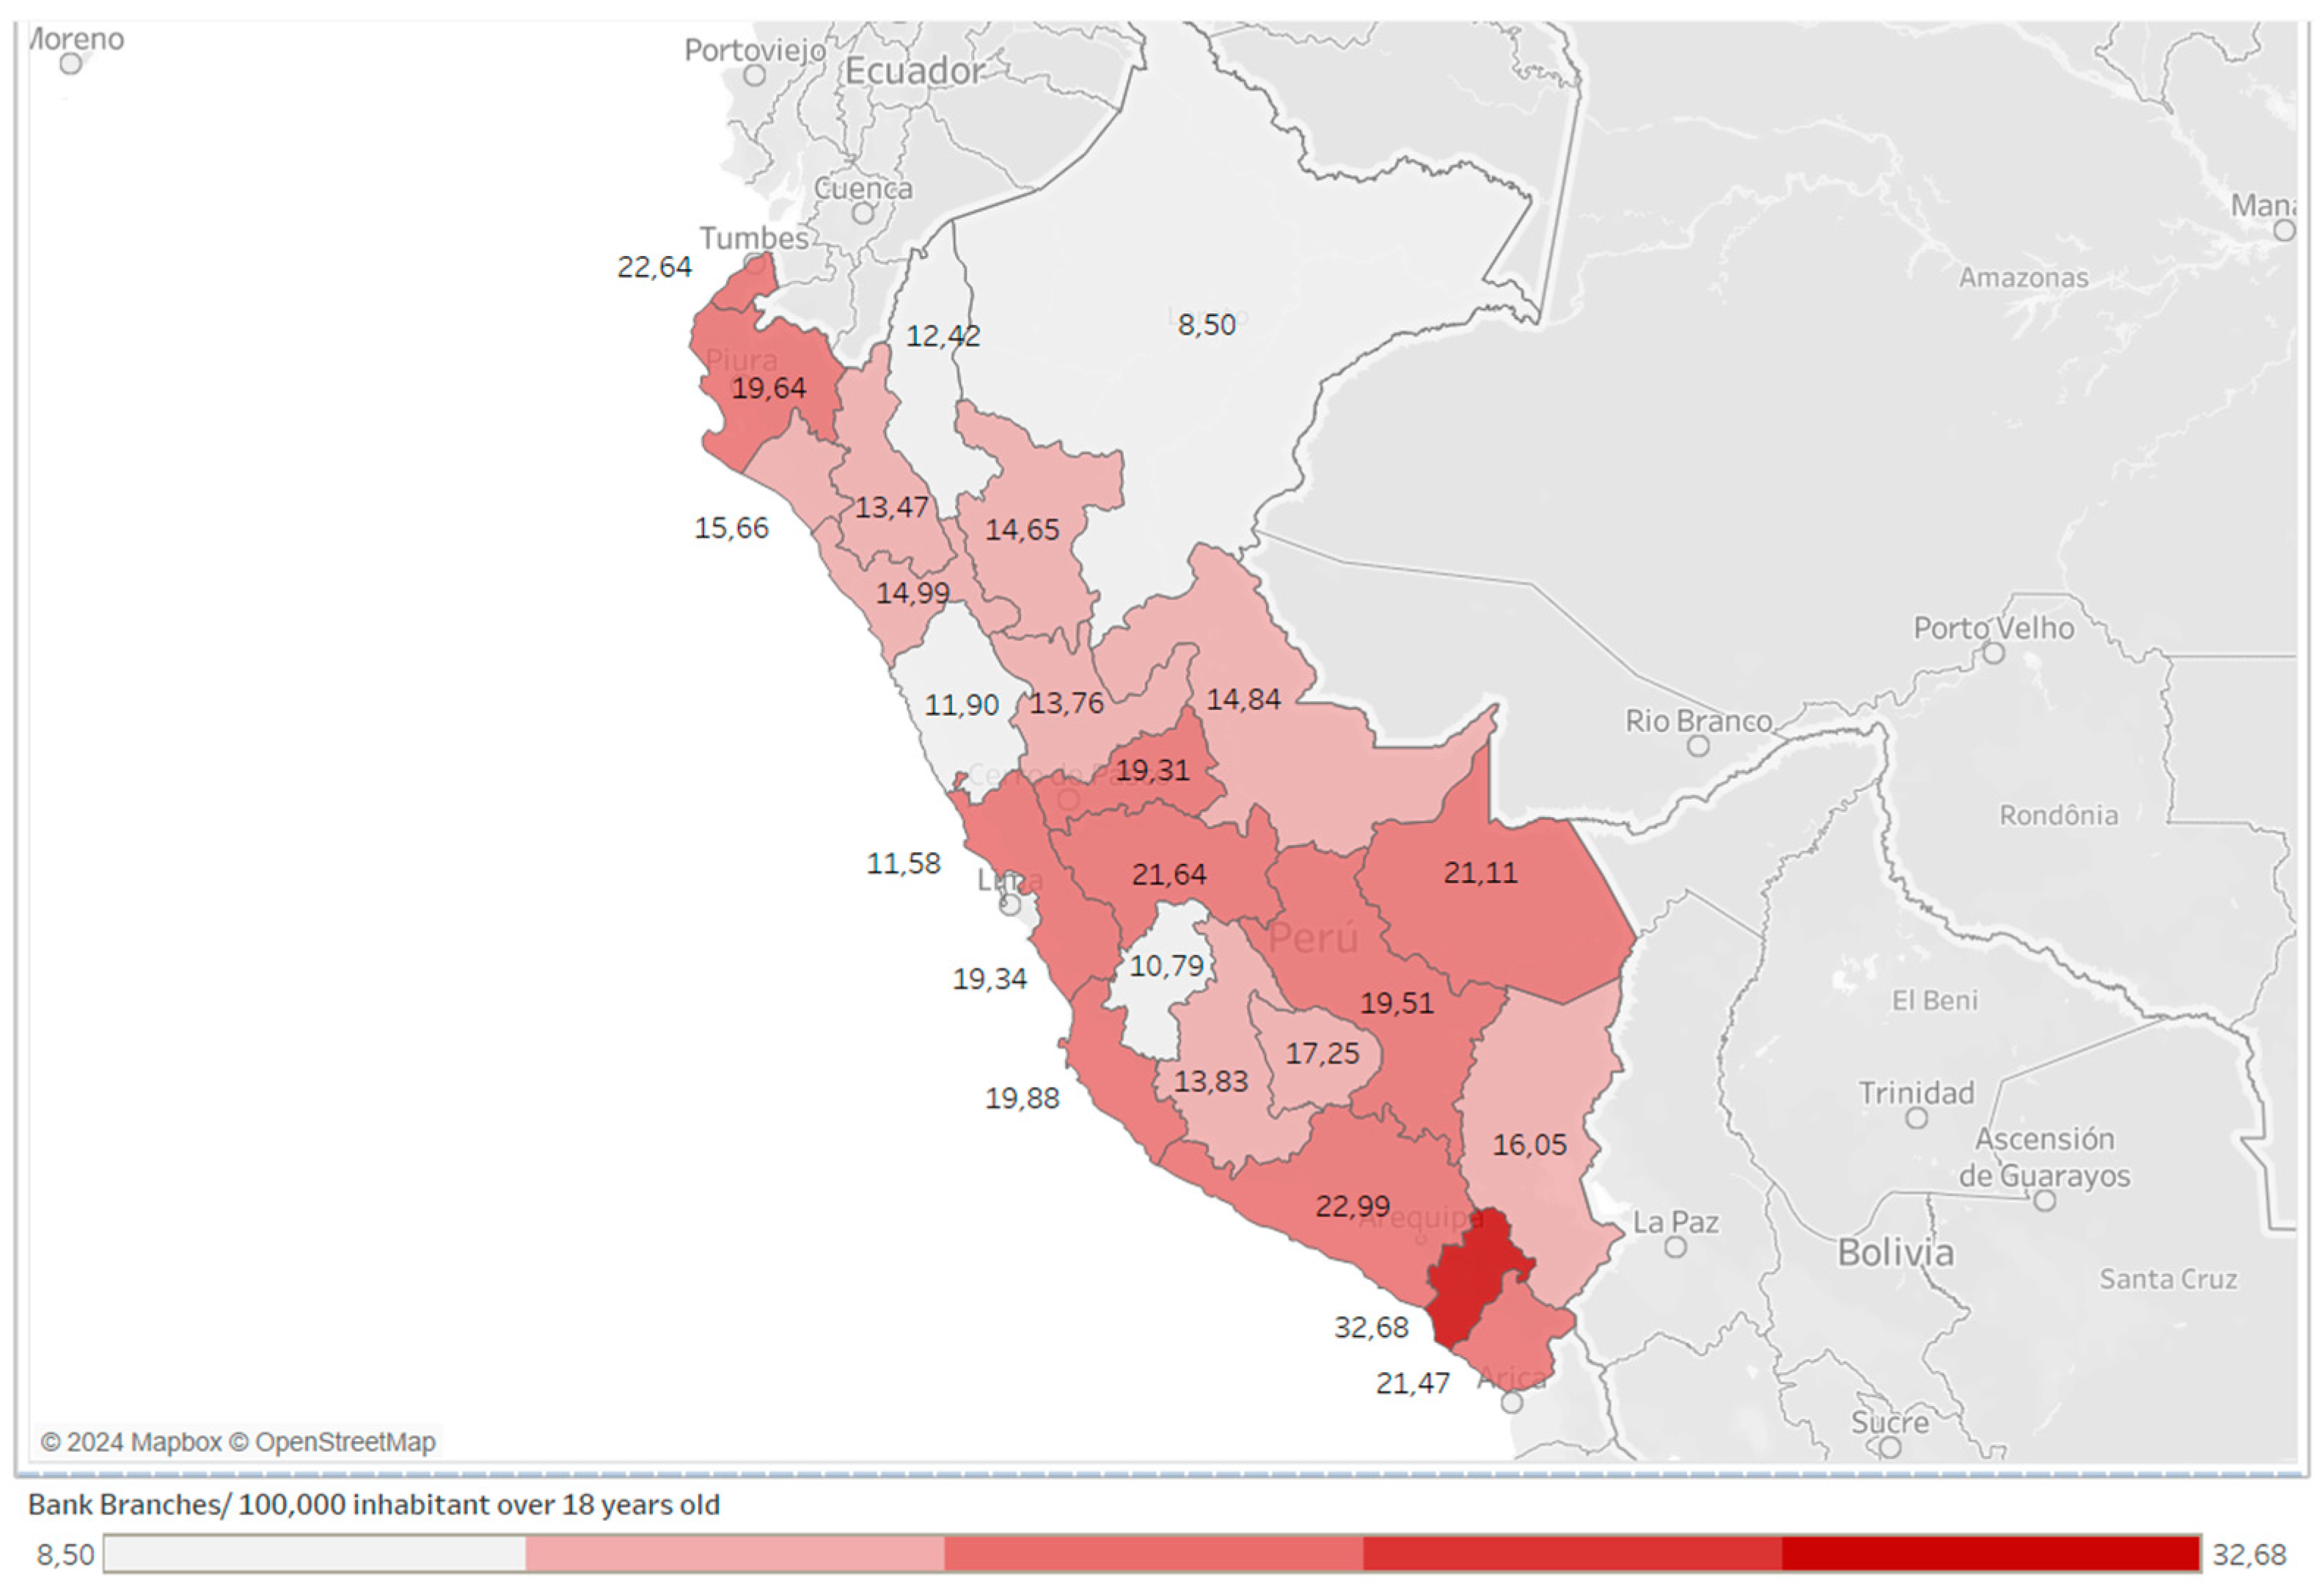
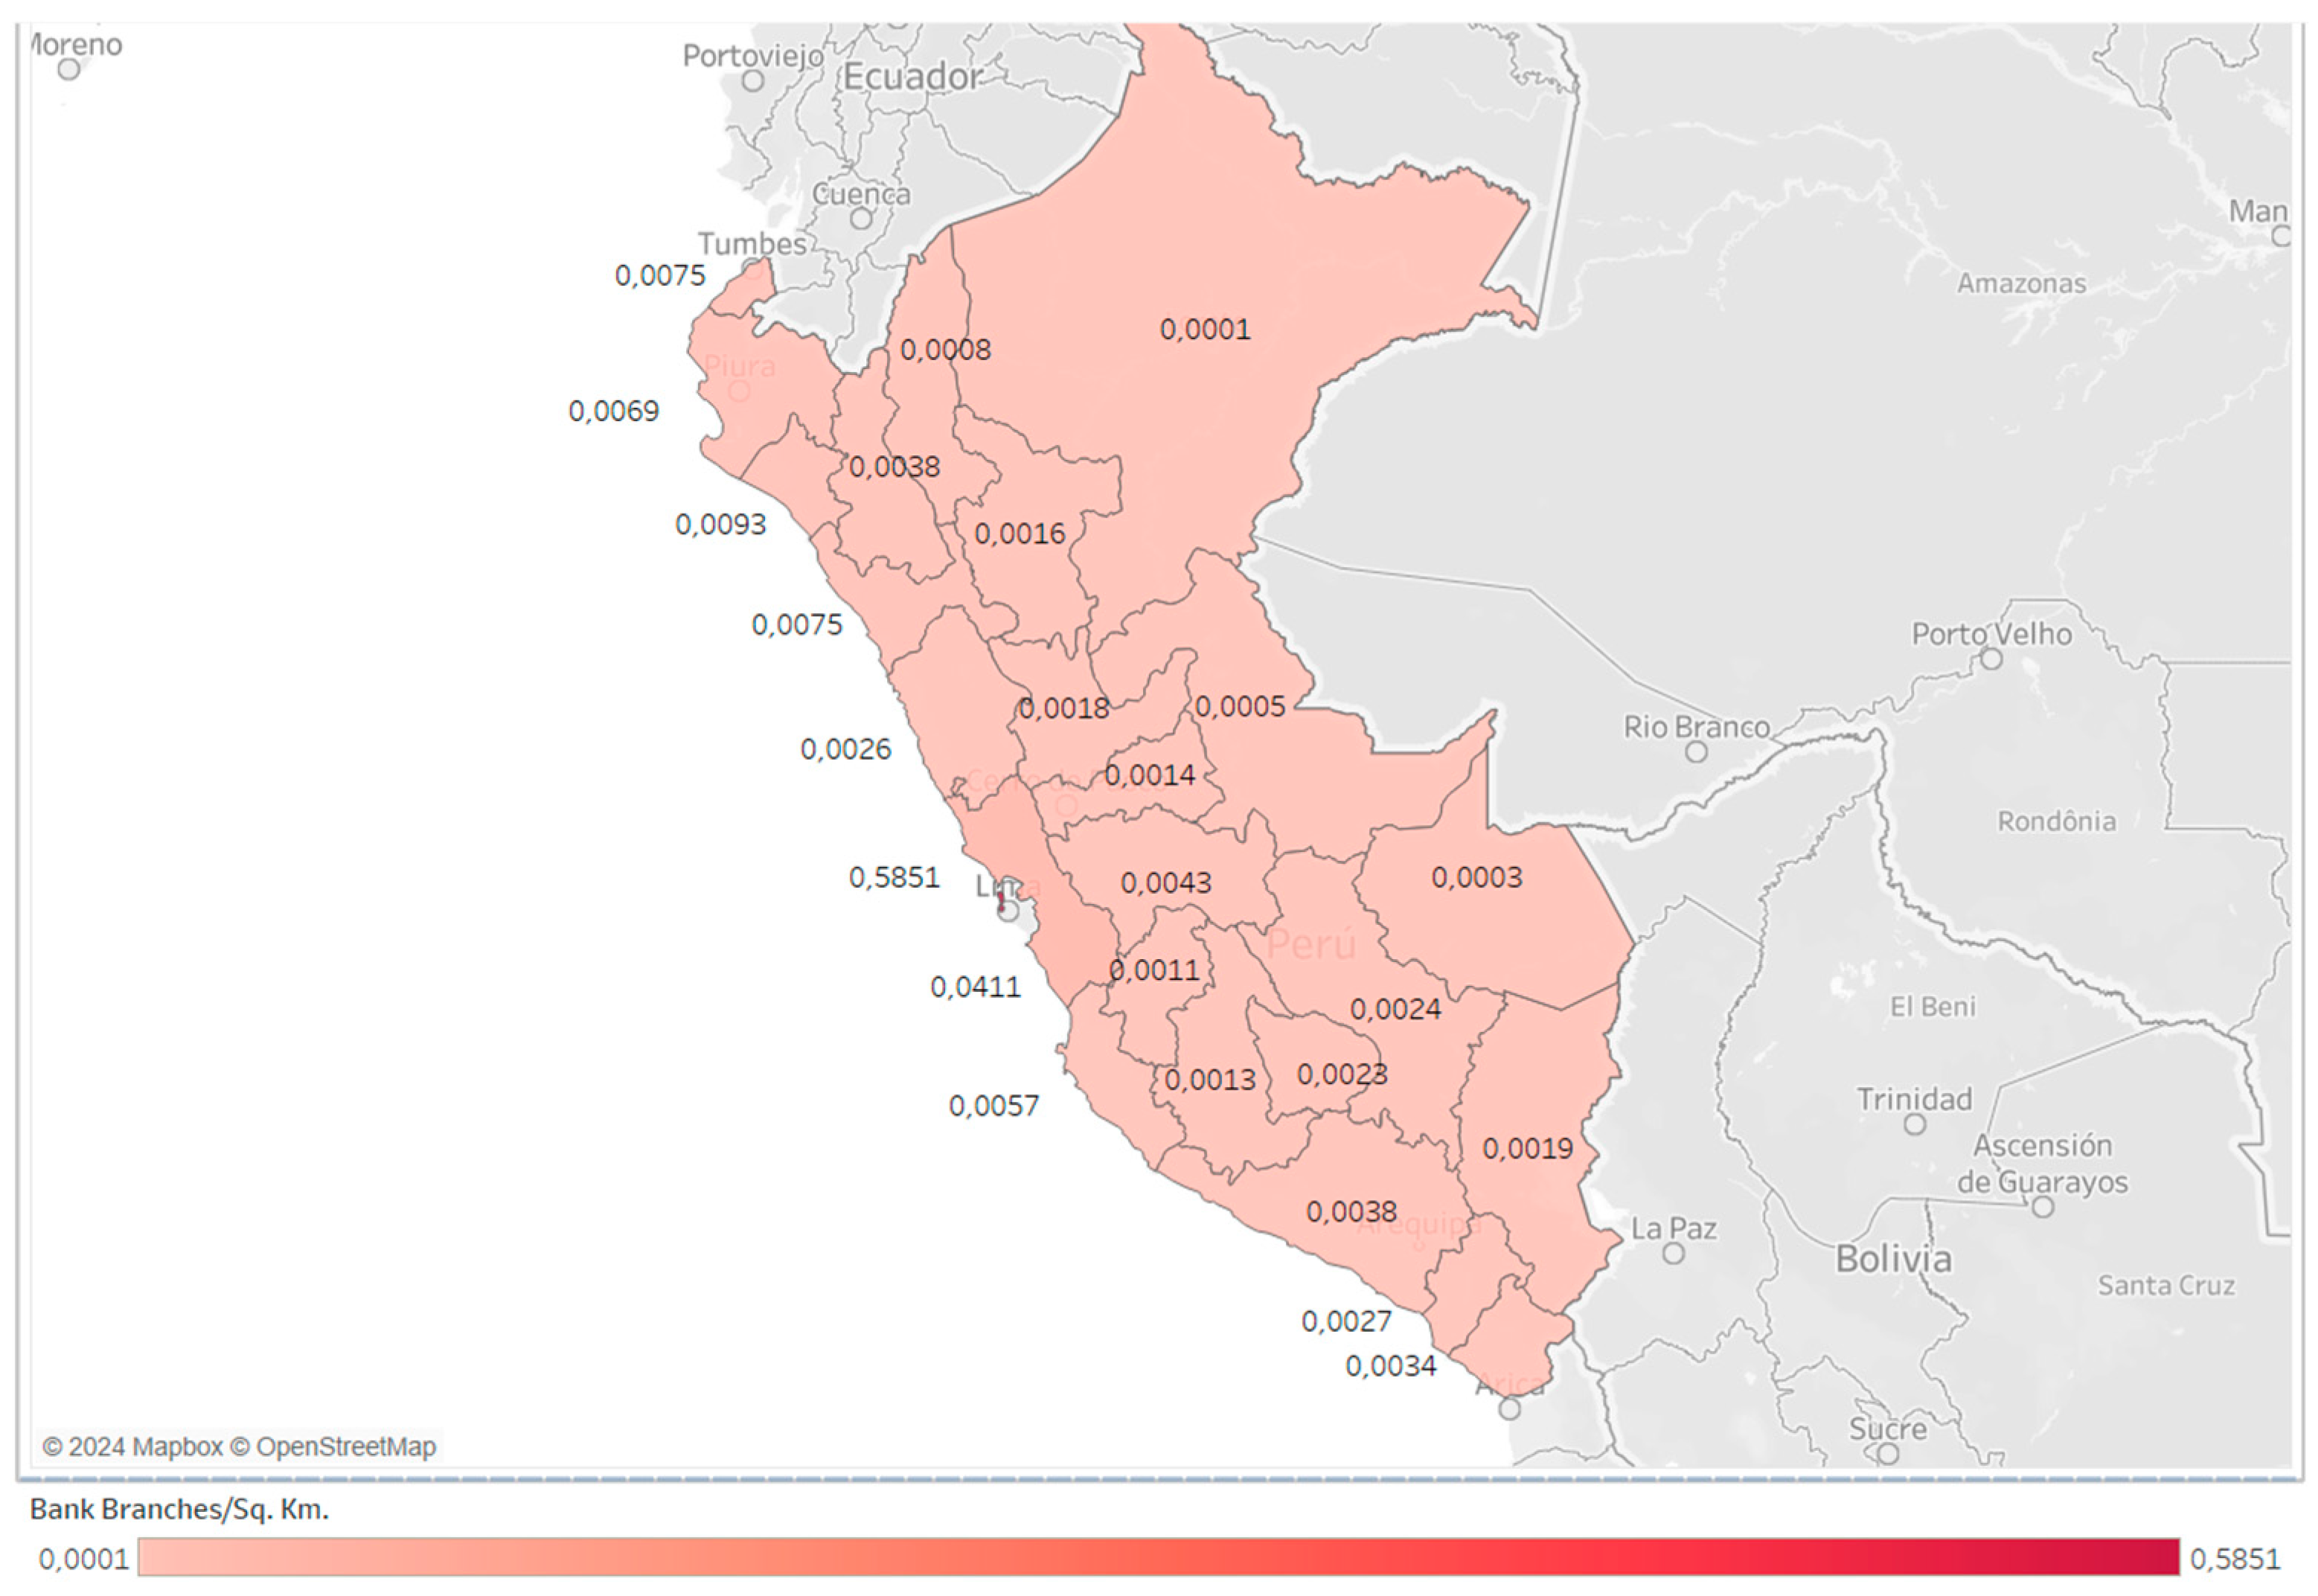
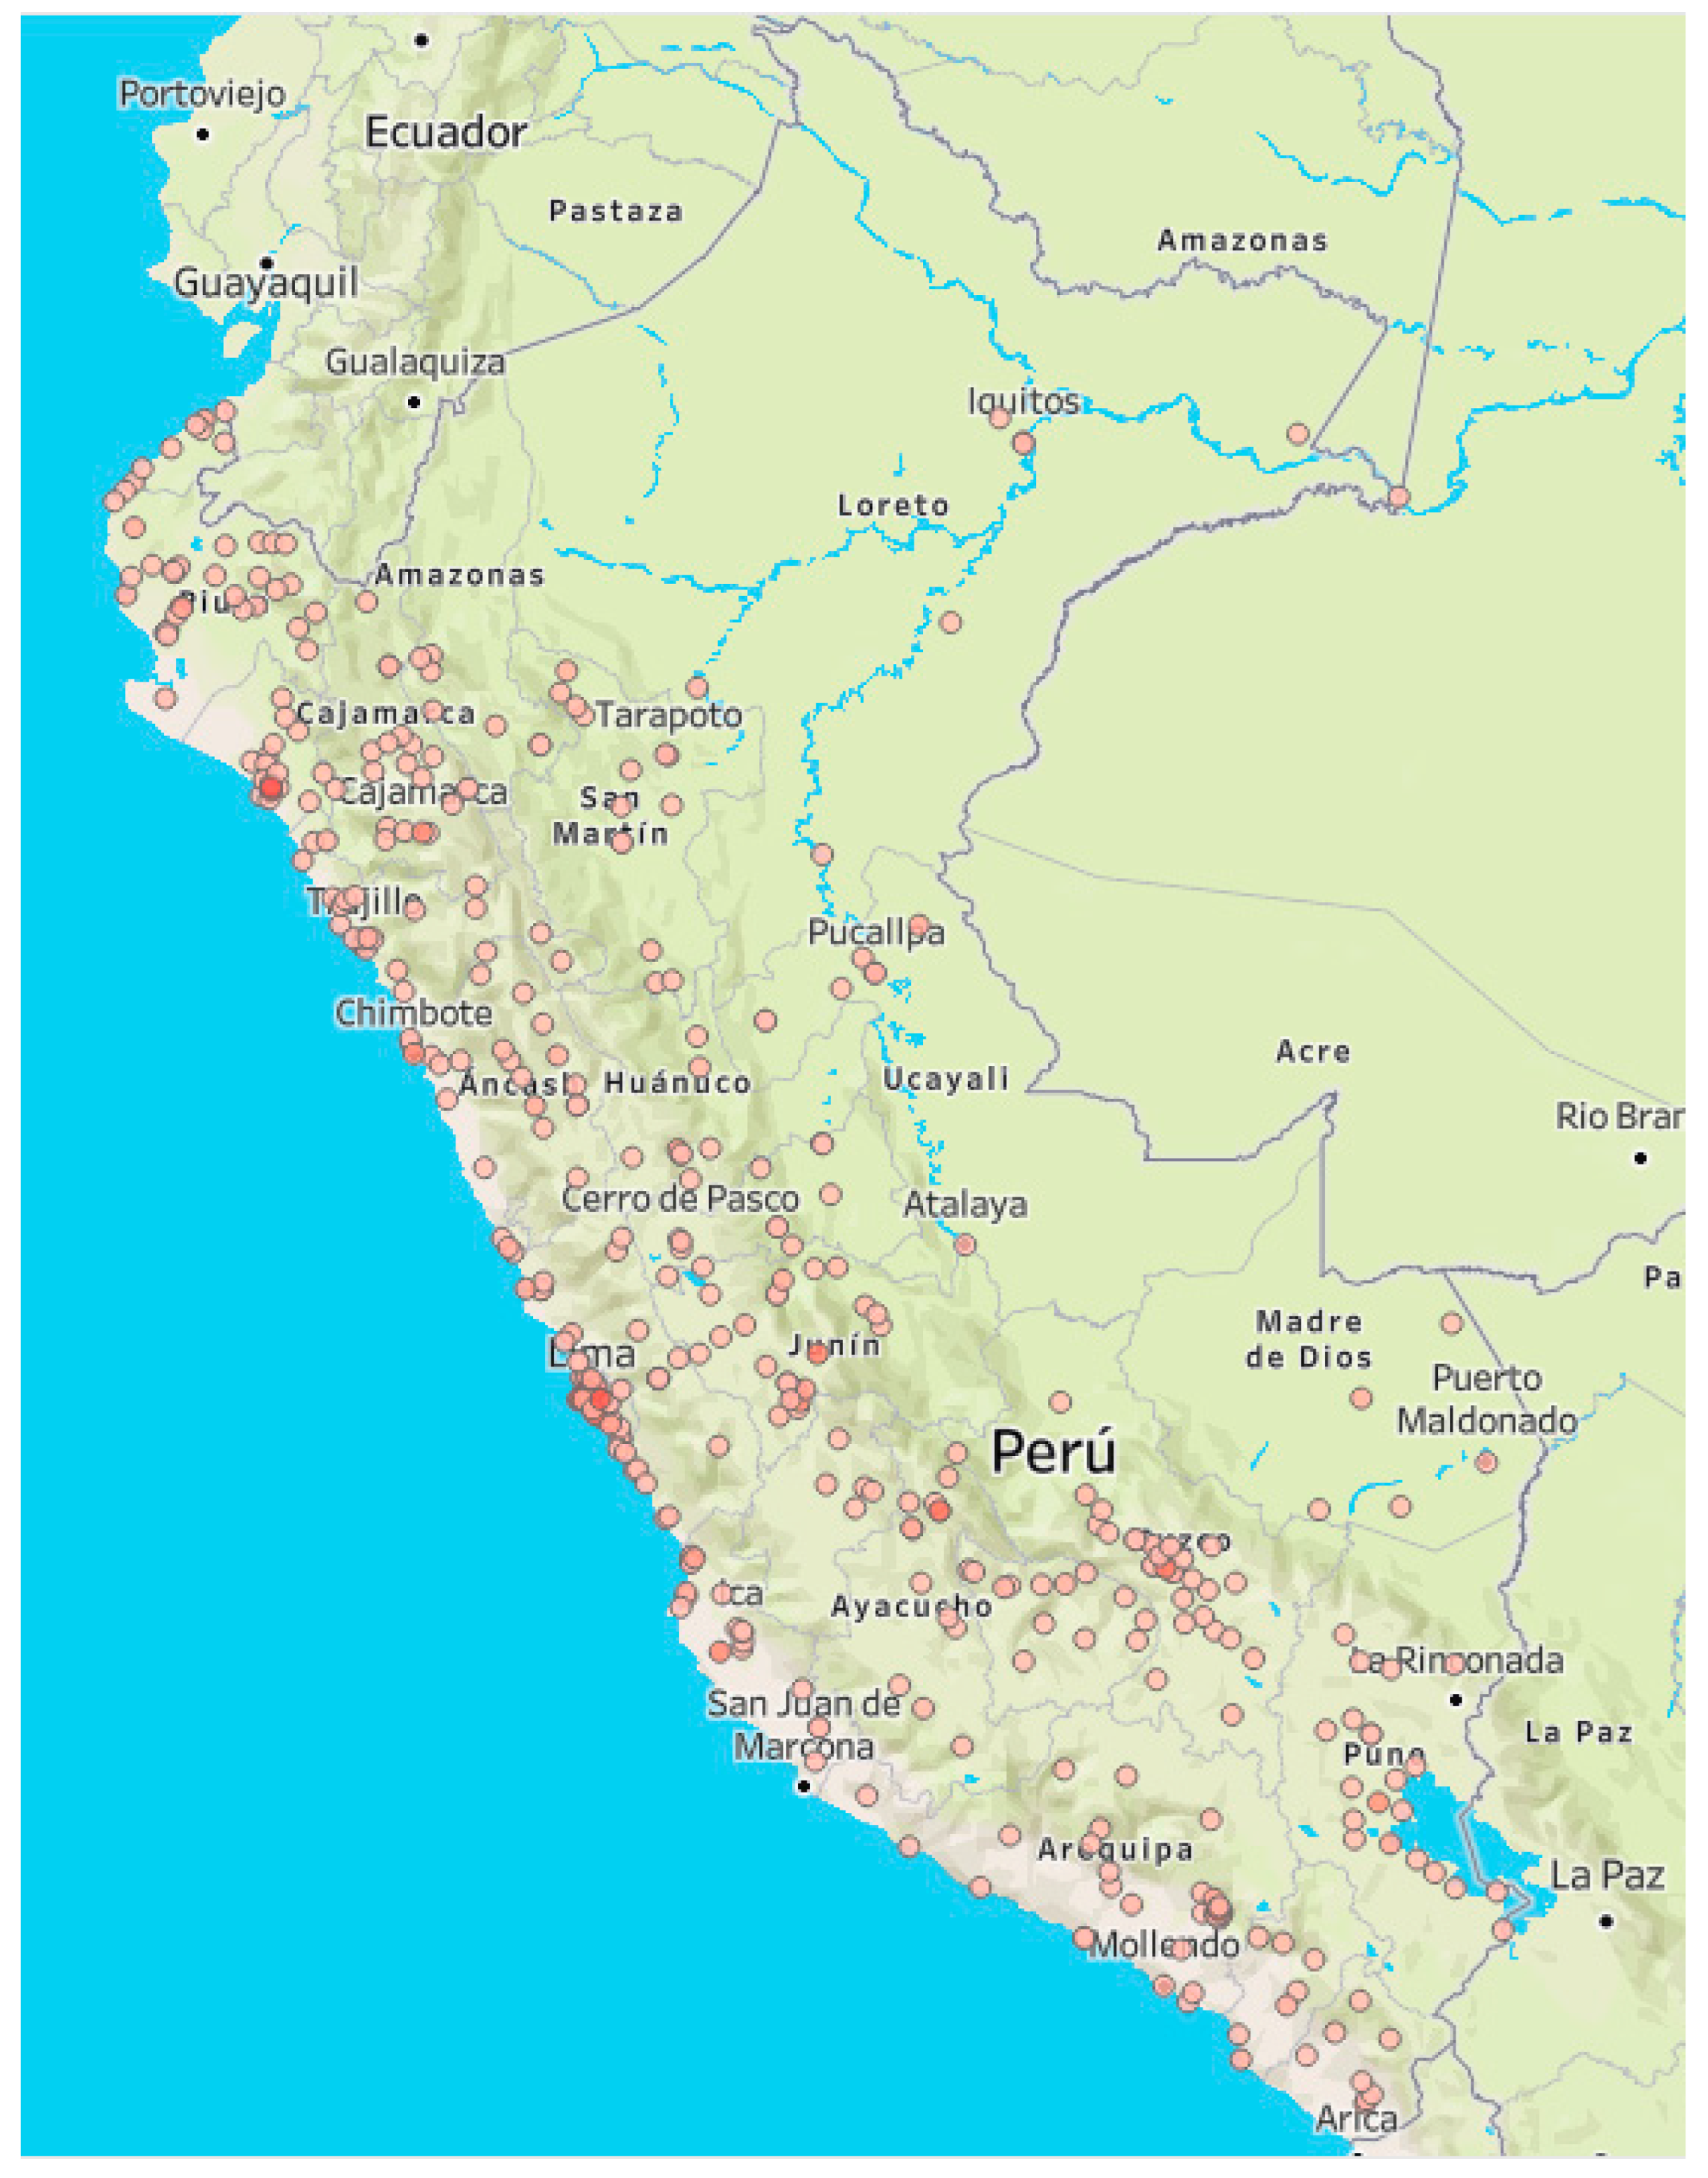
4.3. Geographic Distribution Analysis Results

Using data extracted from the INEI (2022) and the SBS (2022), the points where Peruvian citizens can access financial services, either through a bank office or an ATM, have been represented through the data-analysis program TDP- Edition. All of this is represented at an aggregate level by department, making up the total for Peru (see Figure 12), with each of the red dots showing at least one option for accessing financial services.
Access through bank offices and/or ATMs in Peru is facilitated in the departments located on the Peruvian coast, as shown in Figure 12. From north to south, the concentration is emphasized in departmental capitals, provinces, and districts, hubs of economic activities marked by greater dynamism in their economic environment, such as Lima, Arequipa, Moquegua, Ica, Piura, and Tumbes. On the other hand, access is generally poorer in the departments of the jungle zone, followed by the highland or mountainous zones. Some highland departments stand out, such as Arequipa (highlands) and Cusco, with the latter being characterized by the development of tourism activity and standing out for the development of the tourism sector. This situation is related to the distance of the departments from Lima, the capital of the country.

4.4. Results of ACI Methodology Application

Figure 13 below shows the results derived from the application of the ACI methodology.
As noted above, the most populated department in Peru is Lima, with a little more than 11-million inhabitants (30% of Peru’s population and a population density of 5047 inhabitants/sq. km). The results obtained after applying the ACI methodology are conditioned by this circumstance. According to Figure 13, the highest score was obtained by Lima (5957). Therefore, it is the department with the highest degree of financial inclusion. It is followed, in order of importance, by Arequipa (736), Piura (715), La Libertad (538), Cusco (430), and Callao (406). All of these departments share a common characteristic: with the exception of Cusco, they are all located on the coastline. The lowest scores on the coastline are obtained by Tumbes in the north (93) and Moquegua in the south (103).
On the other hand, the lowest values are obtained by Huancavelica (42), Madre de Dios (53), Pasco (71), Amazonas (70), and Apurímac (86), followed by Tumbes (93). All of these departments, with the exception of Tumbes, are located in the interior of the highlands and jungle regions. In many of them, the orography is also complicated, so these are departments with limited access to banking services.

4.5. Results from the Econometric Analysis

Derived from the econometric analysis performed using the equation included in the methodology and based on the Financial Inclusion Composite Index (IFI), we observe the results obtained by the equation model in Table 2.
As we can see in Table 2, the R2 value is 0.678. This implies that approximately 67.8% of the variability of our dependent variable (percentage of adults with a bank account) is explained by the independent variables included in the model.
Regarding the standard error of the estimation, it is 5.31, which is relatively low. The information criteria are measures to compare models. In this case, we took the Akaike (AIC), Amemiya prediction criterion (APC), Mallow’s prediction criterion (MPC), and Schwarz Bayesian criterion (BIC). As can be seen in Table 2, the values of the selection criteria are 87.94 (AIC), 0.48 (APC), 5.0 (MPC), and 94.04 (BIC), respectively; these values suggest that the model is adequate. Table 3 shows the results obtained in ANOVA for our model.
As observed in Table 3, the p-value of the model is less than 0.05 (0.001), indicating that the results are statistically significant. Additionally, the F-statistic of 10.50 falls within acceptable ranges, further supporting the significance of the model. Thus, the statistical findings are consistent and suggest that the model significantly influences the dependent variable (percentage of adults with a bank account). Furthermore, the ANOVA results indicate that the regression explains a significant portion of the variance in the dependent variable. The regression sum of squares is 1186.87, with a root mean squared error of 296.71. The model’s overall explanatory power is underscored by these metrics.
In Appendix A, Table A2 presents the coefficients of the model, along with the significance (p) of each variable and the collinearity statistics as measured by the variance inflation factor (VIF). All variables in the model exhibit p-values of less than 0.05, signifying their statistical significance. Regarding the tolerance and variance inflation factor (VIF), a tolerance less than 0.1 or a VIF greater than 10 suggests problematic collinearity. All of the tolerances listed in Table A2 of Appendix A are greater than 0.1, suggesting that there are no collinearity problems.

5. Discussion of Results and Conclusions

Despite the efforts made in Peru to increase the financial inclusion of its citizens, especially the most disadvantaged, there is still a long way to go to achieve SDG 8.10, “Strengthen the capacity of national financial institutions to promote and expand access to banking, financial, and insurance services for all”. The progress of the financial inclusion indicators shows greater growth in access to financial services, explained by the expansion of the network of service points (offices and ATMs) (SBS 2022). However, according to the 2021 GFI, only 57% of adults in Peru had a bank account, far from the ENIF target of including at least 75% of the population (ENIF 2015). Regarding the econometric analysis model, the results obtained are good. The R2 value is 0.678. This implies that approximately 67.8% of the variability of our dependent variable (percentage of adults with a bank account) is explained by the independent variables included in the model. According to Ozili (2023), an R-squared between 0.10 and 0.50 (or between 10 and 50 percent if expressed as a percentage) is acceptable in social science research only when some or most of the explanatory variables are statistically significant. In our case, it is 0.678 (67.8%), so it perfectly meets this criterion. This is despite the fact that some of the variables in the model are not significant, as indicated in the results section. As limitations of our research, we can point out the following. First, although the timeline is long (2004–2021), it may not reflect recent changes in the financial sector. However, the most current data are available from the GFI, and at the country level in Peru. The study mentions the impact of the COVID-19 pandemic on bank branch closures and the rise of digital financial services in 2020, but the analysis may not fully reflect ongoing effects or adaptations in the post-pandemic period. Second, with respect to findings and interpretations based on statistical analyses and modeling techniques, other unobserved factors or omitted variables could confound the relationships identified in the analysis.
In this study, and according to the description of the context faced by the country, it has been found that financial inclusion in Peru is threatened due to the concurrence of several factors: high levels of poverty, informality, concentration of financial services, and geographic barriers in the regions. These factors are aligned with those obtained in previous studies (Boitano and Abanto 2020; Zamalloa et al. 2016). In Peru, poverty and monetary vulnerability reach 61% of the population. By geographical area, poverty is more prevalent in rural areas (40%) than in urban areas (22%). By natural region, the highlands and jungle are poorer than the coast due to the informality of economic activities that employ 95% of the rural labor force and 71% of the urban labor force (INEI 2022). Actions have been implemented in recent years to increase inclusion, such as the greater opening of ATMs (CMIF 2021) and regulatory framework for the development of microfinance to promote access to credit in rural areas (León-Ramírez 2022). However, as can be seen in this study, precisely the areas that show the greatest exclusion in any of the indicators analyzed continue to be rural and hard-to-reach areas. This result supports the conclusions obtained in other previous research (Carballo and Dalle-Nogare 2019; Garcia Bianchi et al. 2020; Náñez Alonso et al. 2023) regarding the limitation of sectoral actions implemented to increase access to financial services in the most isolated and lower-income regions. The most relevant actions in terms of inclusion policy in the last two decades have been aimed at promoting access to the financial system, with the opening of correspondent ATMs, the implementation of the program to promote tax culture (Náñez Alonso 2018), the development of the financial inclusion strategy for social programs and the regulation of the Electronic Money Law (CMIF 2021). In the last decade, the regulatory framework, and the favorable environment for the development of microfinance (León-Ramírez 2022) allowed for access to formal credit in areas with financial exclusion (Marr et al. 2014). However, this did not prevent the existing gap between the different regions of the country from remaining.
The second factor is related to the concentration of financial services. Despite the growth of offices and ATMs, these have been concentrated in places where spatial or territorial financial inclusion was not threatened: large cities with greater economic development such as Lima, Arequipa, La Libertad, Moquegua, Ica, and, to a lesser extent, in poor regions of the highlands and jungle. This same trend was also evidenced in other previous studies (Bermeo 2019; Zamalloa et al. 2016; Jorge-Vázquez et al. 2022). The main determinants of this situation are to be found in the high operating costs and low profitability of these areas (Bermeo 2019) together with a lack of adequacy of financial products for the people living in rural areas (Boitano and Abanto 2020).
According to GF 2021, only 57% of adults in Peru had a bank account, far from the ENIF target of including at least 75% of the population (ENIF 2015). In part, the growth in access to bank accounts has been promoted by the government’s need to achieve cash transfers to the vulnerable population due to the health crisis (SBS 2022; Cejudo et al. 2020). Also, the district coverage proposed as an ENIF objective for 2021 to reach 100% of the districts with the financial system has not been met; 12% of the districts are still in financial exclusion (SBS 2022).
The third factor is the lack of digitalization and digital skills for the use of digital banking. The pandemic changed the way of accessing financial services. The fear of contagion promoted the use of digital channels, which has led to the closure of agencies nationwide (SBS 2022). On the one hand, this situation aggravates financial exclusion in those populations characterized by low income, low educational levels, higher percentages of informal work, (Sotomayor and Talledo 2018; Bermeo 2019; Izquierdo and Tuesta 2015; Aurazo and Gasmi 2022), financial and digital illiteracy, lack of financial culture, greater distrust in the financial system, and those residing in remote populations with low population density. All of this encourages voluntary exclusion (Boitano and Abanto 2020; Vargas 2022; Garcia Bianchi et al. 2020; Aparicio and Jaramillo 2012). In other words, distrust in the means of payment and virtual transfers generated a delay in their adoption, a situation that still persists. It is necessary to promote policies that commit public and private sector efforts in a sustainable manner in order to maintain vigorous financial inclusion processes adapted to new technologies (Carballo and Dalle-Nogare 2019; Velazquez et al. 2022).
The last factor is the difficulty of travel in some rural and mountainous areas. If there is no ATM or office, the population has to travel. In Peru, the improvement and expansion of road and telecommunications infrastructure, as well as internet access in the poorest strata to ensure greater financial inclusion is still pending (Vargas 2022; Zamalloa et al. 2016; Sotomayor and Talledo 2018). Under this context, financial inclusion in Peru is linked to the reduction of poverty incidence (Grados-Smith 2021; Polloni-Silva et al. 2021; Omar and Inaba 2020; Schmied and Ana 2016).
Finally, it can be noted that despite the efforts made in Peru to increase financial inclusion, and despite having improved some indicators, there is still much work to be done, especially in rural areas, outside the coastline, and in jungle and mountain environments. Residents of these areas present a three-fold difficulty in improving their financial inclusion. First, the lack of infrastructure (bank office or ATM) in their place of residence causes the need to travel to other areas. However, secondly, the poor road infrastructure and the Peruvian orography make this difficult. These results can contribute to the improvement of the orientation of public policies to promote financial inclusion in Peru. As Ozili (2022) points out, there is a broad consensus in the scientific literature on the link between financial inclusion and sustainable development.
Considering the limitations and findings of our study, there is one area of research that could be explored in the future to deepen the understanding of financial inclusion in Peru: The Impact of Financial Technology (Fintech). Due to the growing role of technology in accessing financial services, an interesting line of research would be to examine the impact of fintech innovations on financial inclusion in Peru. This would involve investigating how mobile payment platforms, banking apps, and other technological solutions are affecting access and participation in the financial system, especially in geographically remote or underserved areas. However, the possible “financial exclusion” effect that digital means of payment may generate should also be considered, especially in the population with lower income levels or lower education levels (Albert et al. 2024).
In conclusion, our research has revealed that financial inclusion in Peru faces significant obstacles in rural and geographically inaccessible regions. It is in these areas where the lack of financial infrastructure and limited connectivity hinder the population’s access to financial services. This geographic disparity raises the need for specific policies aimed at improving infrastructure and connectivity in these areas. Our research also points to a trend of concentration of financial services in urban areas, especially in major coastal cities such as Lima and Arequipa. Therefore, it is crucial to implement policies that encourage the expansion of financial services in less developed areas, thus promoting equity and economic inclusion throughout the country. The pandemic has accelerated the adoption of digital financial services. But it has also highlighted disparities in financial and digital literacy, especially in populations with low income and education levels. It is critical to implement financial and digital literacy programs to train citizens in the use of financial technologies. This will bring about a reduction in the digital divide and promote greater financial inclusion in all segments of the population. Finally, we found that the lack of access to financial services is closely related to the lack of transportation and communications infrastructure. Therefore, significant investments in road, telecommunications, and internet infrastructure are required to facilitate equitable access to financial services throughout the country.

Author Contributions

Conceptualization, S.L.N.A.; Literature Review, S.L.N.A., J.J.-V. and L.G.A.; methodology, S.L.N.A. and N.M.d.N.; research, S.L.N.A., J.J.-V. and L.G.A.; resources, J.J.-V.; software, S.L.N.A.; formal analysis, S.L.N.A., L.G.A. and N.M.d.N.; data curation, L.G.A. and N.M.d.N.; data cleaning, S.L.N.A.; visualization, S.L.N.A. and J.J.-V.; supervision, S.L.N.A. and L.G.A.; writing-original draft preparation, S.L.N.A., J.J.-V. and L.G.A.; writing-revision and editing; S.L.N.A., J.J.-V., L.G.A. and N.M.d.N.; Funding, S.L.N.A. All authors have read and agreed to the published version of the manuscript.

Funding

Research supported by project Finance for all (F4A), funded by the “Institución Gran Duque de Alba” and “Diputación provincial de Ávila”; under the grant 3364/2022 and by the Incentive granted to the authors by the Catholic University of Ávila.

Informed Consent Statement

Not applicable.

Data Availability Statement

The data presented in this study are available in open format in the institutional repository of the Catholic University of Avila, at the following link: https://portalcientifico.ucavila.es/datos/661a9a8c3189766057024e15.

Acknowledgments

We wish to express our thanks to Universidad Católica de Ávila and Institución Gran Duque de Alba for their support. Secondly, we would like to thank the reviewers. Their valuable contributions and suggestions have made this article much better.

Conflicts of Interest

The authors declare no conflicts of interest.

Appendix A

Table A1. Variables by Peruvian department.
Departments% of Adults with Bank Account GDP per Capita per Department (USD)Unemployment RateDHIMobile InternetPopulation Sq. KmPovertyBank Offices 100,000 InhabATMs 100,000 InhabBank Offices Sq. Km.ATMS Sq. Km.Bank Offices Department
Amazonas 57.136942.30.418262,80939,24928.67.79.10.00080.001032
Ancash 46.0687563.10.516868,46935,91518.68.112.40.00260.003992
Apurímac 40.9879181.80.411341,53720,8969.311.39.00.00230.001848
Arequipa 55.1810,0655.50.6431,391,10663,3459.716.533.90.00380.0078241
Ayacucho 43.1246273.30.433518,03443,81518.59.18.00.00130.001259
Cajamarca36.9342682.30.425988,36133,31817.68.811.00.00380.0047125
Callao63.6211,6647.80.64892,7201477.38.230.60.58512.177286
Cusco 45.1170202.80.5121,067,06571,98711.713.119.60.00240.0036172
Huancavelica 48.8455112.20.384248,97622,13120.26.84.60.00110.000825
Huánuco 40.9743392.80.454553,77636,84928.48.88.90.00180.001867
Ica54.2711,0923.80.6787,32221,32812.013.527.80.00570.0116121
Junín 45.2455473.60.5111,020,14944,19722.014.415.60.00430.0046189
La Libertad 48.6557703.20.5481,569,53625,50011.010.118.40.00750.0136190
Lambayeque 50.148274.80.534959,52314,2317.810.621.00.00930.0183132
Loreto47.5538193.10.483535,361368,85252.54.98.50.00010.00021432
Madre de Dios 29.4447232.70.614236,78085,30127.213.619.20.00030.000448
Moquegua 59.5222,2907.50.659185,48515,7348.923.633.00.00270.003822
Pasco 52.9797342.70.478195,42425,32023.812.913.20.00140.001443
Piura 48.3649143.60.5131,340,89735,89221.312.724.30.00690.013135
Puno 31.6245073.30.4661,016,89771,99918.611.210.40.00190.0018246
San Martín44.2831862.20.483600,69251,25332.89.317.90.00160.0030137
Tacna 49.1490103.60.59313,08416,0767.015.525.80.00340.005680
Tumbes 45.0354744.00.555193,190466921.514.924.70.00750.012454
Ucayali37.7737392.00.484366,076102,41142.98.916.60.00050.000935
Lima 61.2710,1143.40.7079,385,23034,8029.214.144.60.04110.130049
Source: own elaboration based on data extracted from INEI (2022) and SBS (2022) and SPSS v.28.
Table A2. Coefficients, confidence intervals, and collinearity.
Non-Standardized CoefficientsStandardized CoefficientstSig.95.0% Confidence Interval for BColinearity Statistics
BErrorBetaLower LimitUpper LimitToleranceVIF
(Constant)69.26813.695 5.0580.00040.70097.836
GDP per capita per department (USD)0.0020.0000.8104.2430.0000.0010.0030.4422.261
DHI−68.85235.964−0.691−1.9140.007−143.8726.1680.1248.089
Bank Offices 100,000 inhab−1.4690.434−0.673−3.3880.003−2.373−0.5650.4092.444
ATMs 100,000 inhab1.0170.3111.1823.2740.0040.3691.6640.1248.087
Source: own elaboration based on data extracted from INEI (2022) and SBS (2022) and SPSS v.28.

References

  1. Albert, Juan Francisco, Nerea Gómez Fernández, and Sergio Luis Náñez Alonso. 2024. Monedas sociales en la era digital: Retos y oportunidades. CIRIEC-España, Revista de Economía Pública, Social y Cooperativa 110: 163. [Google Scholar] [CrossRef]
  2. Amidžic, Goran, Alexander Massara, and Andre Mialou. 2014. Assessing Countries’ Financial Inclusion Standing: A New Composite Index. Washington, DC: IMF. [Google Scholar]
  3. Aparicio, Carlos, and Miguel Jaramillo. 2012. Determinantes de la inclusión al sistema financiero: ¿Cómo hacer para que el Perú alcance los menores estándares a nivel internacional? (Documento de trabajo); Lima: SBS. Available online: https://www.sbs.gob.pe/Portals/0/jer/ddt_ano2012/DT-4-2012_Aparicio_Jaramillo.pdf (accessed on 22 December 2023).
  4. Aurazo, Jose, and Farid Gasmi. 2022. Labor Informality and Financial Inclusion Transitions: Evidence from Peru. Available online: https://www.bcrp.gob.pe/docs/Publicaciones/Documentos-de-Trabajo/2023/documento-de-trabajo-007-2023.pdf (accessed on 15 November 2023).
  5. Banco Central de Reserva del Perú [BCR]. 2014. Evolución de los cajeros corresponsables en el Perú. Available online: https://www.bcrp.gob.pe/docs/Publicaciones/Reporte-Estabilidad-Financiera/2014/Mayo/ref-mayo-2014-recuadro-6.pdf (accessed on 11 September 2023).
  6. Banque de France. 2022. Report on Public Access to Cash in Metropolitan France. Paris: Banque de France, December 15, Available online: https://www.banque-france.fr/sites/default/files/medias/documents/464ta22_2022_07_12_cp-rapport_accessibilite_cp.pdf (accessed on 14 October 2023).
  7. Barbieri, Larua, Mariarosa Borroni, Andrea Lippi, Mariacristina Piva, and Simone Rossi. 2021. Determinants of Bank Branch Presence in Local Areas: A Comparison Between North and South of Italy. International Journal of Economics and Finance 13: 1–15. [Google Scholar] [CrossRef]
  8. Bermeo, Elizabeth. 2019. Determinants of Financial Inclusion: Results of Multilevel Analyses. Ph.D. thesis, University of Bristol, Bristol, UK. Archivo Digital. Available online: https://research-information.bris.ac.uk/ws/portalfiles/portal/213422942/Final_Copy_2019_10_19_Bermeo_E_PhD.pdf (accessed on 10 August 2023).
  9. Boitano, Guillermo, and Deyvi Franco Abanto. 2020. Desafíos de las políticas de inclusión financiera en el Perú. Revista Finanzas y Política 12: 89–117. [Google Scholar] [CrossRef]
  10. Bramley, Glen, and Kirsten Besemer. 2017. Poverty and Social Exclusion in the UK: Vol. 2: The Dimensions of Disadvantage. Bristol: Policy Press. [Google Scholar]
  11. Caddy, James, and Zhan Zhang. 2021. How Far Do Australians Need to Travel to Access Cash? Reserve Bank of Australia, June 17. Available online: https://www.rba.gov.au/publications/bulletin/2021/jun/how-far-do-australians-need-to-travel-to-access-cash.html (accessed on 22 July 2023).
  12. Cadete de Matos, João, and Luis D’Aguiar. 2018. Assessing financial inclusion in Portugal from the central bank’s perspective. In The Role of Data in Supporting Financial Inclusion Policy. Basel: Bank for International Settlements. Available online: https://econpapers.repec.org/bookchap/bisbisifc/47-03.htm (accessed on 21 August 2023).
  13. Caplan, Mary A., Julie Birkenmaier, and Junghee Bae. 2020. Financial exclusion in OECD countries: A scoping review*. International Journal of Social Welfare 30: 58–71. [Google Scholar] [CrossRef]
  14. Carballo, Ignacio Esteban, and Facundo Dalle-Nogare. 2019. Fintech e inclusión financiera: Los casos de México, Chile y Perú. Revista CEA 5: 11–34. [Google Scholar] [CrossRef]
  15. Carbó, Santiago, Edward P. M. Gardener, and Philip Molyneux. 2005. Financial Exclusion in the UK. In Financial Exclusion. London: Palgrave Macmillan, pp. 14–44. [Google Scholar]
  16. Carlson, Stacy, Era Dabla-Norris, Mika Saito, and Yu Shi. 2015. Household financial access and risk sharing in Nigeria. SSRN Electronic Journal. [Google Scholar] [CrossRef]
  17. Cejudo, Guillermo, Cynthia Michel, and Pablo de los Cobos. 2020. Respuestas para enfrentar la pandemia en América Latina y el Caribe: El uso de programas de transferencias monetarias y de sistemas de información de protección social. New York: Programa de las Naciones Unidas para el Desarrollo (PNUD). Available online: https://www.undp.org/sites/g/files/zskgke326/files/migration/latinamerica/undp-rblac-CD19-PDS-Number24-transferencias-ES.pdf (accessed on 22 July 2023).
  18. Chen, Heng, and Matthew Strathearn. 2020. A Spatial Model of Bank Branches in Canada. Staff Working Paper 2020-4. Ottawa: Bank of Canada. [Google Scholar]
  19. Comisión Multisectorial de Inclusión Financiera [CMIF]. 2021. Política Nacional de Inclusión Financiera; Superintendencia de Banca, Seguros y Administradoras Privadas de Fondos de Pensiones-Ministerio de Economía y Finanzas. Available online: https://www.sbs.gob.pe/Portals/4/jer/EST-MONITOREO-ENIF/Documento%20Resumen_PNIF.PDF (accessed on 15 September 2023).
  20. Daher, Marianne, Antonia Rosati, and Andrea Jaramillo. 2021. Saving as a path for female empowerment and entrepreneurship in rural Peru. Progress in Development Studies 22: 32–55. [Google Scholar] [CrossRef]
  21. Delaney, Luc, Aidan O’Hara, and Richard Finlay. 2019. Cash Withdrawal Symptoms, Bulletin–June 2019 Payments; Sydney: Reserve Bank of Australia. Available online: https://www.rba.gov.au/publications/bulletin/2019/jun/cash-withdrawal-symptoms.html (accessed on 16 September 2023).
  22. Demir, Ayse, Vanesa Pesqué-Cela, Yener Altunbas, and Víctor Murinde. 2020. Fintech, financial inclusion and income inequality: A quantile regression approach. The European Journal of Finance 28: 86–107. [Google Scholar] [CrossRef]
  23. Elouaourti, Zakaria, and Elhadj Ezzahid. 2022. Factors of regional financial inclusion in Morocco. Regional Science Policy & Practice 16: 12516. [Google Scholar] [CrossRef]
  24. Estrategia Nacional de Inclusión Financiera. [ENIF]. 2015. Estrategia Nacional de Inclusión Financiera. Available online: https://www.sbs.gob.pe/inclusion-financiera-principal/politica-nacional-de-inclusion-financiera/antecedentes (accessed on 23 October 2023).
  25. Evans, Jamie C. N., Daniel Tischer, and Sarah V. Davies. 2020. Geographies of access to Cash–Identifying Vulnerable Communities in a Case Study of South Wales. Bristol: University of Bristol. Available online: https://research-information.bris.ac.uk/en/publications/geographies-of-access-to-cash-identifying-vulnerable-communities (accessed on 23 October 2023).
  26. Garcia Bianchi, Antonella, Rubi Santillan Leiba, and Narda Sotomayor Valenzuela. 2020. Determinantes del Ahorro Voluntario en el Perú: Evidencia de una Encuesta de Demanda (Documento de trabajo); Lima: Superintendencia de Banca, Seguros y Administradoras Privadas de Fondos de Pensiones (SBS). Available online: https://www.sbs.gob.pe/Portals/4/jer/PUB-ESTUDIOS-INVESTIGACIONES/Determinantes%20del%20ahorro%20voluntario%20en%20el%20Peru_DT-001-2020_2.pdf (accessed on 15 October 2023).
  27. Grados-Smith, Pedro Luis. 2021. Implications of Financial Inclusion and Informal Employment on Monetary Poverty of Peru Departments. Revista Finanzas y Política Económica 13: 545–69. [Google Scholar]
  28. He, Canfey, and Godfrey Yeung. 2011. The locational distribution of foreign banks in China: A disaggregated analysis. Regional Studies 45: 733–54. [Google Scholar] [CrossRef]
  29. Henry, Nick, Jane Pollard, Paul Sissons, Jennifer Ferreira, and Mike Coombes. 2017. Banking on exclusion: Data disclosure and geographies of UK personal lending markets. Environment and Planning A 49: 2046–64. [Google Scholar] [CrossRef]
  30. Higgs, Gary, Andrew Price, and Mitchel Langford. 2022. Investigating the impact of bank branch closures on access to financial services in the early stages of the COVID-19 pandemic. Journal of Rural Studies 95: 1–14. [Google Scholar] [CrossRef] [PubMed]
  31. Inoue, Takeshi, and Shigeyuki Hamori. 2016. Financial access and economic growth: Evidence from sub-saharan Africa. Emerging Markets Finance and Trade 52: 743–53. [Google Scholar] [CrossRef]
  32. Instituto Nacional de Estadística e Informática [INEI]. 2022. Pobreza Monetaria 2021. Available online: https://www.inei.gob.pe/media/MenuRecursivo/publicaciones_digitales/Est/pobreza2021/Pobreza2021.pdf (accessed on 12 November 2023).
  33. International Monetary Fund [IMF]. 2022. Financial Access Survey (FAS). IMF Data. International Monetary Fund: Available online: https://data.imf.org/?sk=E5DCAB7E-A5CA-4892-A6EA-598B5463A34C (accessed on 2 October 2023).
  34. Izquierdo, Noelia Cámara, and David Tuesta. 2015. Factors that matter for financial inclusion: Evidence from Peru. Aestimatio: The IEB International Journal of Finance 10: 10–31. [Google Scholar]
  35. Jorge-Vázquez, Javier, Sergio Luis Náñez Alonso, Konrad Kolegowicz, and Jarosław Kaczmarek. 2022. Technological entrepreneurship and rural development: A binomial to combat depopulation in Spain. Journal of Public Governance 59: 41–52. [Google Scholar] [CrossRef]
  36. Koku, Paul Sergius. 2015. Financial exclusion of the poor: A literature review. International Journal of Bank Marketing 33: 654–68. [Google Scholar] [CrossRef]
  37. Korczak, Dieter. 2019. Financial education and financial literacy in Germany. An Overview. In Financial Literacy and Financial Education. Berlin: De Gruyter, pp. 53–64. [Google Scholar] [CrossRef]
  38. Kumar, Anjali, and Thorsten Beck. 2005. Assessing Financial Access in Brazil. Washington, DC: The World Bank. [Google Scholar] [CrossRef]
  39. León-Ramírez, Segundo Víctor. 2022. Social programs and their contribution to financial inclusion in Peru. Journal of Positive School Psychology 6: 1665–71. Available online: https://journalppw.com/index.php/jpsp/article/view/1709 (accessed on 12 September 2023).
  40. Leyshon, Andrew, and Nigel Thrift. 1995. Geographies of Financial Exclusion: Financial Abandonment in Britain and the United States. Transactions of the Institute of British Geographers 20: 312. [Google Scholar] [CrossRef]
  41. Marr, Ana, Janina León, and Fátima Ponce. 2014. Financial inclusion of the poor in Peru: Explanatory factors and determinants. Applied Econometrics and International Development 14: 101–22. [Google Scholar]
  42. Mylonidis, Nikolaos, Michael Chletsos, and Vanessa Barbagianni. 2019. Financial exclusion in the USA: Looking beyond demographics. Journal of Financial Stability 40: 144–58. [Google Scholar] [CrossRef]
  43. Náñez Alonso, Sergio Luis. 2018. Análisis del beneficio fiscal a favor de la familia en los tributos cedidos en la España de las autonomías: Periodo 2000–15. Derecho PUCP 80: 461–95. [Google Scholar] [CrossRef]
  44. Náñez Alonso, Sergio Luis, Javier Jorge-Vazquez, Miguel Ángel Echarte Fernández, Konrad Kolegowicz, and Wojciech Szymla. 2022a. Financial exclusion in rural and urban contexts in Poland: A threat to achieving SDG eight? Land 11: 539. [Google Scholar] [CrossRef]
  45. Náñez Alonso, Sergio Luis, Javier Jorge-Vazquez, Ricardo Francisco Reier Forradellas, and Elena Ahijado Dochado. 2022b. Solutions to Financial Exclusion in Rural and Depopulated Areas: Evidence Based in Castilla y León (Spain). Land 11: 74. [Google Scholar] [CrossRef]
  46. Náñez Alonso, Sergio Luis, Javier Jorge-Vázquez, Beatriz Sastre-Hernández, and Bernard Ziębicki. 2023. Do credit unions contribute to financial inclusion and local economic development? Empirical evidence from Poland. Economics & Sociology 16: 110–29. [Google Scholar] [CrossRef]
  47. Nizam, Rosmah, Zulkefly Abdul Karim, Tamat Sarmidi, and Aisyah Abdul Rahman. 2020. Financial inclusion and firms growth in manufacturing sector: A threshold regression analysis in selected Asean countries. Economies 8: 80. [Google Scholar] [CrossRef]
  48. Nizam, Rosmah, Zulkefly Abdul Karim, Tamat Sarmidi, and Aisyah Abdul Rahman. 2021. Financial inclusion and firm growth in Asean-5 countries: A new evidence using threshold regression. Finance Research Letters 41: 101861. [Google Scholar] [CrossRef]
  49. Nowacka, Anna, Mariola Szewczyk-Jarocka, and Izabela Zawiślińska. 2021. Socio-demographic determinants of financial exclusion of the unemployed on the local labour market: A case study. Ekonomia i Prawo 20: 155. [Google Scholar] [CrossRef]
  50. Omar, Abdullah, and Kazuo Inaba. 2020. Does financial inclusion reduce poverty and income inequality in developing countries? A panel data analysis. Journal of Economic Structures 9: 37. [Google Scholar] [CrossRef]
  51. Orazi, Sofía, Lisana B. Martinez, and Hernán P. Vigier. 2023. Determinants and evolution of financial inclusion in Latin America: A demand side analysis. Quantitative Finance and Economics 7: 187–206. [Google Scholar] [CrossRef]
  52. Ozili, Peterson K. 2022. Financial inclusion and sustainable development: An empirical association. Journal of Money and Business 2: 186–98. [Google Scholar] [CrossRef]
  53. Ozili, Peterson K. 2023. The acceptable r-square in empirical modelling for social science research. In Social Research Methodology and Publishing Results. Hershey: IGI Global, pp. 134–43. [Google Scholar] [CrossRef]
  54. Park, Cyn-Young, and Rogelio Mercado. 2015. Financial Inclusion, Poverty, and Income Inequality in Developing Asia. SSRN Electronic Journal. [Google Scholar] [CrossRef]
  55. Polloni-Silva, Eduardo, Naijela da Costa, Herick Fernando Moralles, and Mario Sacomano Neto. 2021. Does financial inclusion diminish poverty and inequality? A panel data analysis for Latin American countries. Social Indicators Research 158: 889–925. [Google Scholar] [CrossRef] [PubMed]
  56. Rajamohan, Selam, and K. Subha. 2011. Financial inclusion in India: An overview. Indian Journal of Applied Research 4: 299–300. [Google Scholar] [CrossRef]
  57. Sain, Mohamed, Rosli Mohamed, Mohammad M. Rahman, and Rasheda Khanam. 2018. Financial Exclusion and the Role of Islamic Finance in Australia: A Case Study in Queensland. Australasian Accounting, Business and Finance Journal 12: 23–42. [Google Scholar] [CrossRef]
  58. Salah Uddin, K. M., and Tahmina Begum. 2023. Financial inclusion: Factors influencing on customer adoption of mobile banking services in Bangladesh. International Journal of Business and Management 18: 1. [Google Scholar] [CrossRef]
  59. Schmied, Julian, and Marr Ana. 2016. Financial inclusion and poverty: The case of Peru. Regional and Sectoral Economic Studies 16: 29–40. [Google Scholar]
  60. Sinclair, Stephen. 2013. Financial Exclusion: An Introductory Survey. Edimburgh: CRSIS, Edinburgh College of Art/Heriot Watt University. [Google Scholar]
  61. Sotomayor, Narda, and Jacqueline Talledo. 2018. Determinantes de la inclusión financiera en el Perú: Evidencia reciente; (Documento de trabajo). Lima: Superintendencia de Banca, Seguros y Administradoras Privadas de Fondos de Pensiones (SBS). Available online: https://www.sbs.gob.pe/Portals/0/jer/DDT_ANO2018/DT-001-2018%20(esp).pdf (accessed on 15 October 2023).
  62. Stix, Helmut. 2020a. A spatial analysis of access to ATMs in Austria. Monetary Policy & the Economy 20: 39–59. [Google Scholar]
  63. Stix, Helmut. 2020b. The Austrian bank branch network from 2000 to 2019 from a spatial perspective. Financial Stability Report 40: 87–101. [Google Scholar]
  64. Superintendencia de Banca, Seguros y Administradoras Privadas de Fondos de Pensiones–SBS. 2022. Gobierno Del Perú. Lima. Available online: https://www.gob.pe/sbs (accessed on 10 August 2023).
  65. Świecka, Beata Ś., and Olga Wyszkowska-Kaniewska. 2019. Financial literacy and financial education in Poland. An overview. In Financial Literacy and Financial Education. Berlin: De Gruyter, pp. 30–52. [Google Scholar] [CrossRef]
  66. Tischer, Daniel, Jamie Evans, and Sara Davies. 2019. Mapping the Availability of Cash—A Case Study of Bristol’s Financial Infrastructure. Bristol: University of Bristol. Available online: https://research-information.bris.ac.uk/en/publications/mapping-the-availability-of-cash-a-case-study-of-bristols-financi (accessed on 2 September 2023).
  67. Trütsch, Tobias. 2022. Swiss Money Map 2022: A spatial analysis of cash access points in Switzerland. SSRN Electronic Journal. [Google Scholar] [CrossRef]
  68. Vargas, Jorge. 2022. Brechas de la inclusión financiera digital en Perú, en un contexto de crisis económica y sanitaria por el COVID-19, usando el análisis de componentes principales; Lima: Instituto Nacional de Estadística e Informática. Available online: https://www.inei.gob.pe/media/MenuRecursivo/investigaciones/brecha.pdf (accessed on 5 September 2023).
  69. Velazquez, Patricia Vilcanqui, Vito Bobek, Romana Korez Vide, and Tatjana Horvat. 2022. Lessons from remarkable fintech companies for the financial inclusion in Peru. Journal of Risk and Financial Management 15: 62. [Google Scholar] [CrossRef]
  70. World Bank. 2023a. The World Bank Financial Inclusion: Overview. Washington, DC: World Bank. Available online: https://www.worldbank.org/en/topic/financialinclusion/overview#1 (accessed on 12 August 2023).
  71. World Bank. 2023b. The Global Findex 2021. Washington, DC: World Bank Group. Available online: https://www.worldbank.org/en/publication/globalfindex/Data. (accessed on 12 August 2023).
  72. Yadav, Priyanka, and Anil Kumar Sharma. 2016. Financial inclusion in India: An application of TOPSIS. Humanomics 32: 328–51. [Google Scholar] [CrossRef]
  73. Zamalloa, Juan Carlos, Ena Cecilia Obando Peralta, and Vladimir Cairo. 2016. Inclusión financiera en distritos de Perú: Enfoque multidimensional y factores determinantes. Quipukamayoc 24: 111–26. Available online: https://pdfs.semanticscholar.org/8a92/d95a395664df9a563b39b8dfdbbab182780a.pdf (accessed on 15 September 2023). [CrossRef]
Figure 1. Methodology applied: five-fold measurement of financial inclusion in Peru. Source: own elaboration.
Economies 12 00093 g001
Figure 2. Number of ATMs in South America (2021). Source: own elaboration based on data from IMF (2022). Financial access survey. Note: Latest data available for Ecuador: 2019 and for the Bolivarian Republic of Venezuela: 2015.
Economies 12 00093 g002
Figure 3. Cumulative Rate of Change (CAV) of ATMs in South America (2004–2021). Source: Prepared by the authors based on data from IMF (2022). Financial access survey. Note: Calculation period of CAV (exceptions): Ecuador (2004–2019); Bolivia (2007–2021); Venezuela (2005–2015); and Colombia (2007–2021).
Economies 12 00093 g003
Figure 4. Evolution of ATMs in South America (2004–2021). Source: prepared by the authors based on data from IMF (2022). Financial Access Survey.
Economies 12 00093 g004
Figure 5. Number of bank branches in South America (2021). Source: prepared by the authors based on data from IMF (2022). Financial access survey. Note: latest available data for Ecuador: 2019; for the Bolivarian Republic of Venezuela: 2015.
Economies 12 00093 g005
Figure 6. Cumulative rate of change (CAV) of bank branches in South America (2004–2021). Source: prepared by the authors based on IMF (2022). Financial access survey. Note: HCR calculation period (exceptions): Ecuador (2004–2019); Venezuela (2005–2015); and Colombia (2008–2021).
Economies 12 00093 g006
Figure 7. Evolution of bank branches in South America (2004–2021). Source: prepared by the authors based on IMF (2022). Financial access survey.
Economies 12 00093 g007
Figure 8. ATMs per 100,000 Inhabitants over 18 years old. Source: Own elaboration based on (INEI 2022), (SBS 2022) and Tableau Desktop Professional Edition.
Economies 12 00093 g008
Figure 9. Bank branches per 100,000 inhabitants over 18 years old. Source: own elaboration based on (INEI 2022), (SBS 2022) and Tableau Desktop Professional Edition.
Economies 12 00093 g009
Figure 10. ATMs per Sq. km. Source: own elaboration based on (INEI 2022) (SBS 2022) and Tableau Desktop Professional Edition.
Economies 12 00093 g010
Figure 11. Bank branches per sq. km. Source: own elaboration based on (INEI 2022) (SBS 2022) and Tableau Desktop Professional Edition.
Economies 12 00093 g011
Figure 12. Results derived from the geographic distribution analysis. Source: own elaboration based on (INEI 2022) (SBS 2022) and Tableau Desktop Professional Edition.
Economies 12 00093 g012
Figure 13. Results derived from the ACI methodology at the departmental level. Source: own elaboration based on (INEI 2022) (SBS 2022) and Tableau Desktop Professional Edition.
Economies 12 00093 g013
Table 1. Essential indicators of the FAS.
1No. of ATMs per 100,000 adult population
2No. of bank branches per 100,000 adult population
3No. of ATMs per 1000 sq. mt.
4No. of bank branches per 1000 sq. meters
Source: Prepared by the authors based on FAS data.
Table 2. Composite Financial Inclusion Index (IFI) model.
ModelRR2Standard Estimation ErrorSelection Criteria
Akaike Information CriteriaAmemiya Prediction CriteriaMallows Prediction CriteriaSchwarz Bayesian Criterion
10.823 a0.6785.3187.940.485.0094.04
a Dependent variable: percentage of adults with bank account. Predictors: (Constant), ATMs × 100,000 inhabitants, Poverty, GDP per capita per department in USD, HDI, and bank branches per 100,000 inhabitants. Source: own elaboration based on data extracted from INEI (2022) and SBS (2022) and SPSS v.29.
Table 3. ANOVA.
Table 3. ANOVA.
ModelSum of SquaresglRoot Mean SquaredFSig.
1Regression1186.874296.7110.50<0.001 b
Residual564.942028.24
Total1751.8224
Dependent variable: percentage of adults with bank account. b Predictors: (Constant), ATMs × 100,000 inhabitants, Poverty, GDP per capita per department in USD, HDI and bank branches 100,000 inhabitants. Source: own elaboration based on data extracted from INEI (2022) and SBS (2022) and SPSS v.29.
Disclaimer/Publisher’s Note: The statements, opinions and data contained in all publications are solely those of the individual author(s) and contributor(s) and not of MDPI and/or the editor(s). MDPI and/or the editor(s) disclaim responsibility for any injury to people or property resulting from any ideas, methods, instructions or products referred to in the content.

