Article

Exploring the Nexus between Employment and Economic Contribution: A Study of the Travel and Tourism Industry in the Context of COVID-19

by
Petra Vašaničová
* and
Katarína Bartók
Department of Finance, Accounting and Mathematical Methods, Faculty of Management and Business, University of Presov, 080 01 Presov, Slovakia
*
Author to whom correspondence should be addressed.
Economies 2024, 12(6), 136; https://doi.org/10.3390/economies12060136
Submission received: 30 April 2024 / Revised: 23 May 2024 / Accepted: 27 May 2024 / Published: 30 May 2024

Abstract

:
The travel and tourism industry plays a crucial role in economies around the world. The impact of the COVID-19 pandemic on the tourism industry has been very pronounced. This paper aims to study the relationship between the country’s T&T industry Share of Employment (TTEMPL) and the country’s T&T industry Share of Gross Domestic Product (TTGDP). This study is specific because we do not focus on the development of indicators over time; instead, we propose the models for 117 countries using the quantile regression (QR) while comparing models in the context of COVID-19 (between 2019 and 2021). The results of the QR determined that individual percentiles of the TTGDP are more affected by the TTEMPL than other percentiles of the TTGDP, which is then reflected in the changes in regression coefficients. In addition, we compare analyzed indicators among countries according to region and income group. The study reveals that the tourism downturn caused by COVID-19 has adverse effects on the TTEMPL and the TTGDP. In addition, the results show that the impact of COVID-19 on the tourism industry appears to be varied among countries, regions, and income groups.

1. Introduction

The travel and tourism industry serves as a primary contributor to employment, government income, and foreign currency earnings for the economy. Tourism activities are significantly dependent on external factors, rendering the industry exceptionally susceptible to impacts such as terrorist attacks, climate change, natural disasters, economic downturns, and pandemics (Duro et al. 2021; Monterrubio 2022). The COVID-19 pandemic served as a crucial instance of a crisis capable of overturning entire socioeconomic systems worldwide (Jencova et al. 2021; Yepez and Leimgruber 2024).
Since the beginning of the COVID-19 crisis, the impact of the pandemic on the tourism industry has been very pronounced. The tourism sector experienced one of the first, and probably most severe, shocks to be caused by the international spread of COVID-19 (Mariolis et al. 2021). During the health crisis and economic downturn caused by COVID-19, the tourism and hospitality sectors have been severely affected, primarily due to various interconnected factors such as travel restrictions, nationwide lockdowns, business shutdowns, and the consequent effects on lives and livelihoods (Peterson and DiPietro 2021; Šenková et al. 2021). Measures to contain the virus in terms of lockdowns, travel restrictions, border closures, and mobility constraints have significantly affected the economic structure of many countries, especially those which have tourist-dependent economies (Tandrayen-Ragoobur et al. 2022). Countries whose tourism sectors contribute a high share of GDP are facing considerable economic impact, as the tourism sector plays a vital role in driving economic progress (Henseler et al. 2022). The occasions connected with the crisis led to significant declines in both revenue and employment opportunities on a global scale (Seabra and Bhatt 2022).
Therefore, it is crucial to assess the economic influence of tourism and its contribution to the GDP. Consequently, policy briefs, industry reports, and scientific articles frequently commence by presenting statistics regarding the travel and tourism share of GDP (Figini and Patuelli 2022). Moreover, in addition to its significant role in enhancing the overall welfare of contemporary societies, employment stands as a crucial phenomenon and a topic that cannot be overlooked in macroeconomic scrutiny.
The existence of the relationship between employment and GDP has been verified in many studies (Burggraeve et al. 2015; Klinger and Weber 2020). The relationship between these indicators is frequently investigated using time series data (Ghosh 2009; Klinger and Weber 2020; Scarlett 2021). However, the connection between these specific indicators within the field of tourism is rarely explored. This paper innovatively contributes to the extant literature on the nexus of economic growth (GDP) and employment in the tourism industry by employing a quantile regression (QR) model for 117 countries while comparing models in the context of COVID-19. Specifically, this paper aims to study the relationship between the country’s T&T industry Share of Employment (TTEMPL) and the country’s T&T industry Share of GDP (TTGDP). Only a few studies use both indicators (Bulin 2014; Radovanov et al. 2020); thus, we aim to fill this research gap.

2. Literature Review

Studies on the tourism–growth nexus provide insights into the existence of a long-term and/or short-term relationship between tourism and economic growth. They also examine the adjustment mechanisms that restore equilibrium following a disruption in tourism and analyze how these relationships behave after shocks or regime changes (Ahmad et al. 2020). Ahmad et al. (2020) performed a systematic literature review of the tourism–growth nexus and focused mainly on the causality nexus. The studies analyzed utilized time series data. From an economic perspective, the focus was on the country’s overall economic indicators, e.g., real GDP (Dogan et al. 2017; Dogru and Bulut 2018), GDP per capita (Paramati et al. 2017), and industrial production (Antonakakis et al. 2015). From a tourism perspective, studies usually dealt with international tourist arrivals (Antonakakis et al. 2015; Dogan et al. 2017), international tourism receipts (Dogru and Bulut 2018), and international tourism receipts per capita (Tang and Tan 2015; Paramati et al. 2017). The studies analyzed by Ahmad et al. (2020) have not yet included events related to the COVID-19 pandemic. Our study differs in three respects. First, it analyzes cross-sectional data instead of time series. Second, we analyze cross-sectional data for 2019 (before COVID-19) and 2021 (during COVID-19). Third, we consider the economic indicators directly related to tourism—TTGDP and TTEMPL.
It is now clear that the pandemic has had an unprecedented impact on the tourism industry worldwide. The discussion about the impacts of the spread of the disease on national economies continues. As stated by Škare et al. (2021), at their time of writing, several empirical studies had evaluated the impact of the pandemic outbreak on the tourism industry. Nowadays, there are already significantly more studies on this topic. Existing studies usually deal with impacts in a particular country, e.g., Greece (Mariolis et al. 2021), Spain (Moreno-Luna et al. 2021), Portugal (de Fátima Brilhante and Rocha 2023), Australia (Pham et al. 2021; Munawar et al. 2021; Solarin et al. 2024), Ethiopia (Bogale et al. 2020), Tanzania (Henseler et al. 2022), Mauritius (Tandrayen-Ragoobur et al. 2022), Sri Lanka (Wickramasinghe and Naranpanawa 2023), Guangdong Province, China (Wu et al. 2022), Macao (Lim and To 2022); or in a particular region, e.g., Latin America and the Caribbean (Mulder 2020), Indonesia (Sun et al. 2021; Pham and Nugroho 2022), Germany and Spain (Rodousakis and Soklis 2022), Spanish provinces (Duro et al. 2021), Andalusia (Cardenete et al. 2022), Europe (Pasieka et al. 2022), European regions (Curtale et al. 2023), the Central and Eastern European region (Nagaj and Žuromskaitė 2021), Europe, the USA, and China (Islam and Fatema 2020), the Chengdu-Chongqing region in China (Ding et al. 2024).
The tourism industry serves as a significant generator of foreign exchange revenues, playing a pivotal role in driving economic growth through various channels, as evidenced by numerous studies (Ramlall 2024). Before the pandemic, tourism development was utilized to generate significant advantages for the macro-level economy, such as enhancing foreign receipts, stimulating service exports, and playing a crucial part in driving growth in the domestic economy through tourism-led initiatives (Sun et al. 2022; Brida et al. 2016). The tourism industry constitutes a vital source of income and employment (Kavya Lekshmi and Mallick 2022; Navarro-Chávez et al. 2023; Sánchez López 2024). Furthermore, tourism has a positive impact on currency circulation, employment rates, balance of payment, and investment in the development of necessary infrastructure, all of which facilitate the execution of tourism-related activities. Additionally, it contributes to bolstering the state budget by increasing government expenditure via public services and government revenue through the collection of both direct and indirect taxes (Tabash et al. 2023).
Tourism, being reliant on labor, offers numerous opportunities for both skilled and unskilled workers (Sun et al. 2022). Expanding employment opportunities is the most important effect of economic growth (Kožić and Sever 2022). In tourism, employment demand depends on the number of tourist arrivals, assuming that there is a positive relationship (Walmsley 2017). Tourism is seen as a significant driver of economic development in many developing countries, particularly for tackling poverty. It stands out as a major sector in these countries, as it is capable of fostering economic growth and enhancing social well-being at a regional level (Kavya Lekshmi and Mallick 2022; Monterrubio 2022). Moreover, given tourism’s intersectoral connections, it can be seen as a potential catalyst for development in regions conducive to tourism activities (Sánchez López 2024).
Economic vulnerability and job instability in tourism have led to the inevitable onset of economic troubles (Sun et al. 2022). Islam (2021) noted that employment was expected to correspond with the economy’s output level, meaning that as output decreases due to the pandemic, there is a potential for decreased employment and an increase in the unemployment rate. Sun et al. (2022) evaluate how reduced international tourism consumption affects tourism employment.
The impact of tourism on economic activity fluctuates based on the income levels and institutional characteristics of the host countries (Tang and Tan 2017; Borrego-Domínguez et al. 2022). Unfortunately, typically, standard economic impact analyses present findings through aggregate data, often lacking essential details to identify the countries that are most susceptible to economic vulnerability.

3. Methodology

We study the relationship between the country’s TTEMPL and the country’s TTGDP. Both indicators express the economic importance of tourism in a specific region or country. The TTEMPL shows how many people are employed in industries related to tourism. A higher TTEMPL means that tourism provides a significant number of jobs. The TTGDP shows how much tourism contributes to overall economic activity. A higher TTGDP means that tourism is a significant source of income and has a large economic impact. The link between these two indicators arises because industries that contribute to GDP through tourism also create jobs. For example, hotels, restaurants, and travel agencies need employees to provide services to tourists. Therefore, the economic contribution (GDP) and employment in tourism interact and often show similar trends. A high TTGDP often correlates with a high TTEMPL, as a greater economic contribution usually means more job opportunities are created.
Considering the aim of the paper, this study is specific because we do not focus on the development of indicators over time (time series), but we propose models for 117 countries considering conditional quantiles of the dependent variable. Therefore, we use QR. For comparison, we present results obtained by the ordinary least square (OLS) method.
A linear regression model determines parameters that minimize the sum of squared errors. When the residuals are normally distributed, the OLS estimator is the best linear unbiased estimate. Inference is made on the conditional mean and is used to determine whether to accept or reject the null hypothesis, which states that there is no relationship between the predictor x and the outcome variable y. In QR, parameters are identified for each quantile by minimizing the sum of absolute residuals. This method does not assume a specific distribution for the error terms, giving it nonparametric characteristics and making it robust to outliers. Unlike the linear regression model, which has a single set of parameters, the QR model produces a different set of parameters for each quantile. It allows for inferences at various quantiles, and statistical tests at each quantile can determine whether to accept or reject the null hypothesis (Li 2015).
We also visually compare linear regression lines concerning regions or income groups of analyzed countries. To enrich the study, this paper also compares the TTEMPL and the TTGDP among regions and income groups and examines differences in these indicators before and during COVID-19. The investigation, together with geographic and economic aspects, will allow for a better understanding of this complex relationship.

3.1. Data

The data were collected via a database of the Travel and Tourism Development Index 2021, which was published by the World Economic Forum in May 2022 (Uppink Calderwood and Soshkin 2022). Specifically, the Tourism Satellite Account Research of the World Travel & Tourism Council is the source of both analyzed indicators the TTEMPL (% of total employment) and the TTGDP (% of total GDP). We compare data and results for 2019 (before COVID-19) and 2021 (during COVID-19). We chose this period because we drew the data from the Travel and Tourism Development Index 2021 database, in which available data are only for these two years.
Data are available for 117 countries, which are further divided into two categories, namely region (Asia–Pacific, Europe and Eurasia, Middle East and North Africa, Sub-Saharan Africa, the Americas) and income group (high, upper-middle, lower-middle, and low-income economies). These categories are also derived from the database known as the Travel and Tourism Development Index. The countries are listed according to region and income group in Appendix A (Table A1 and Table A2).
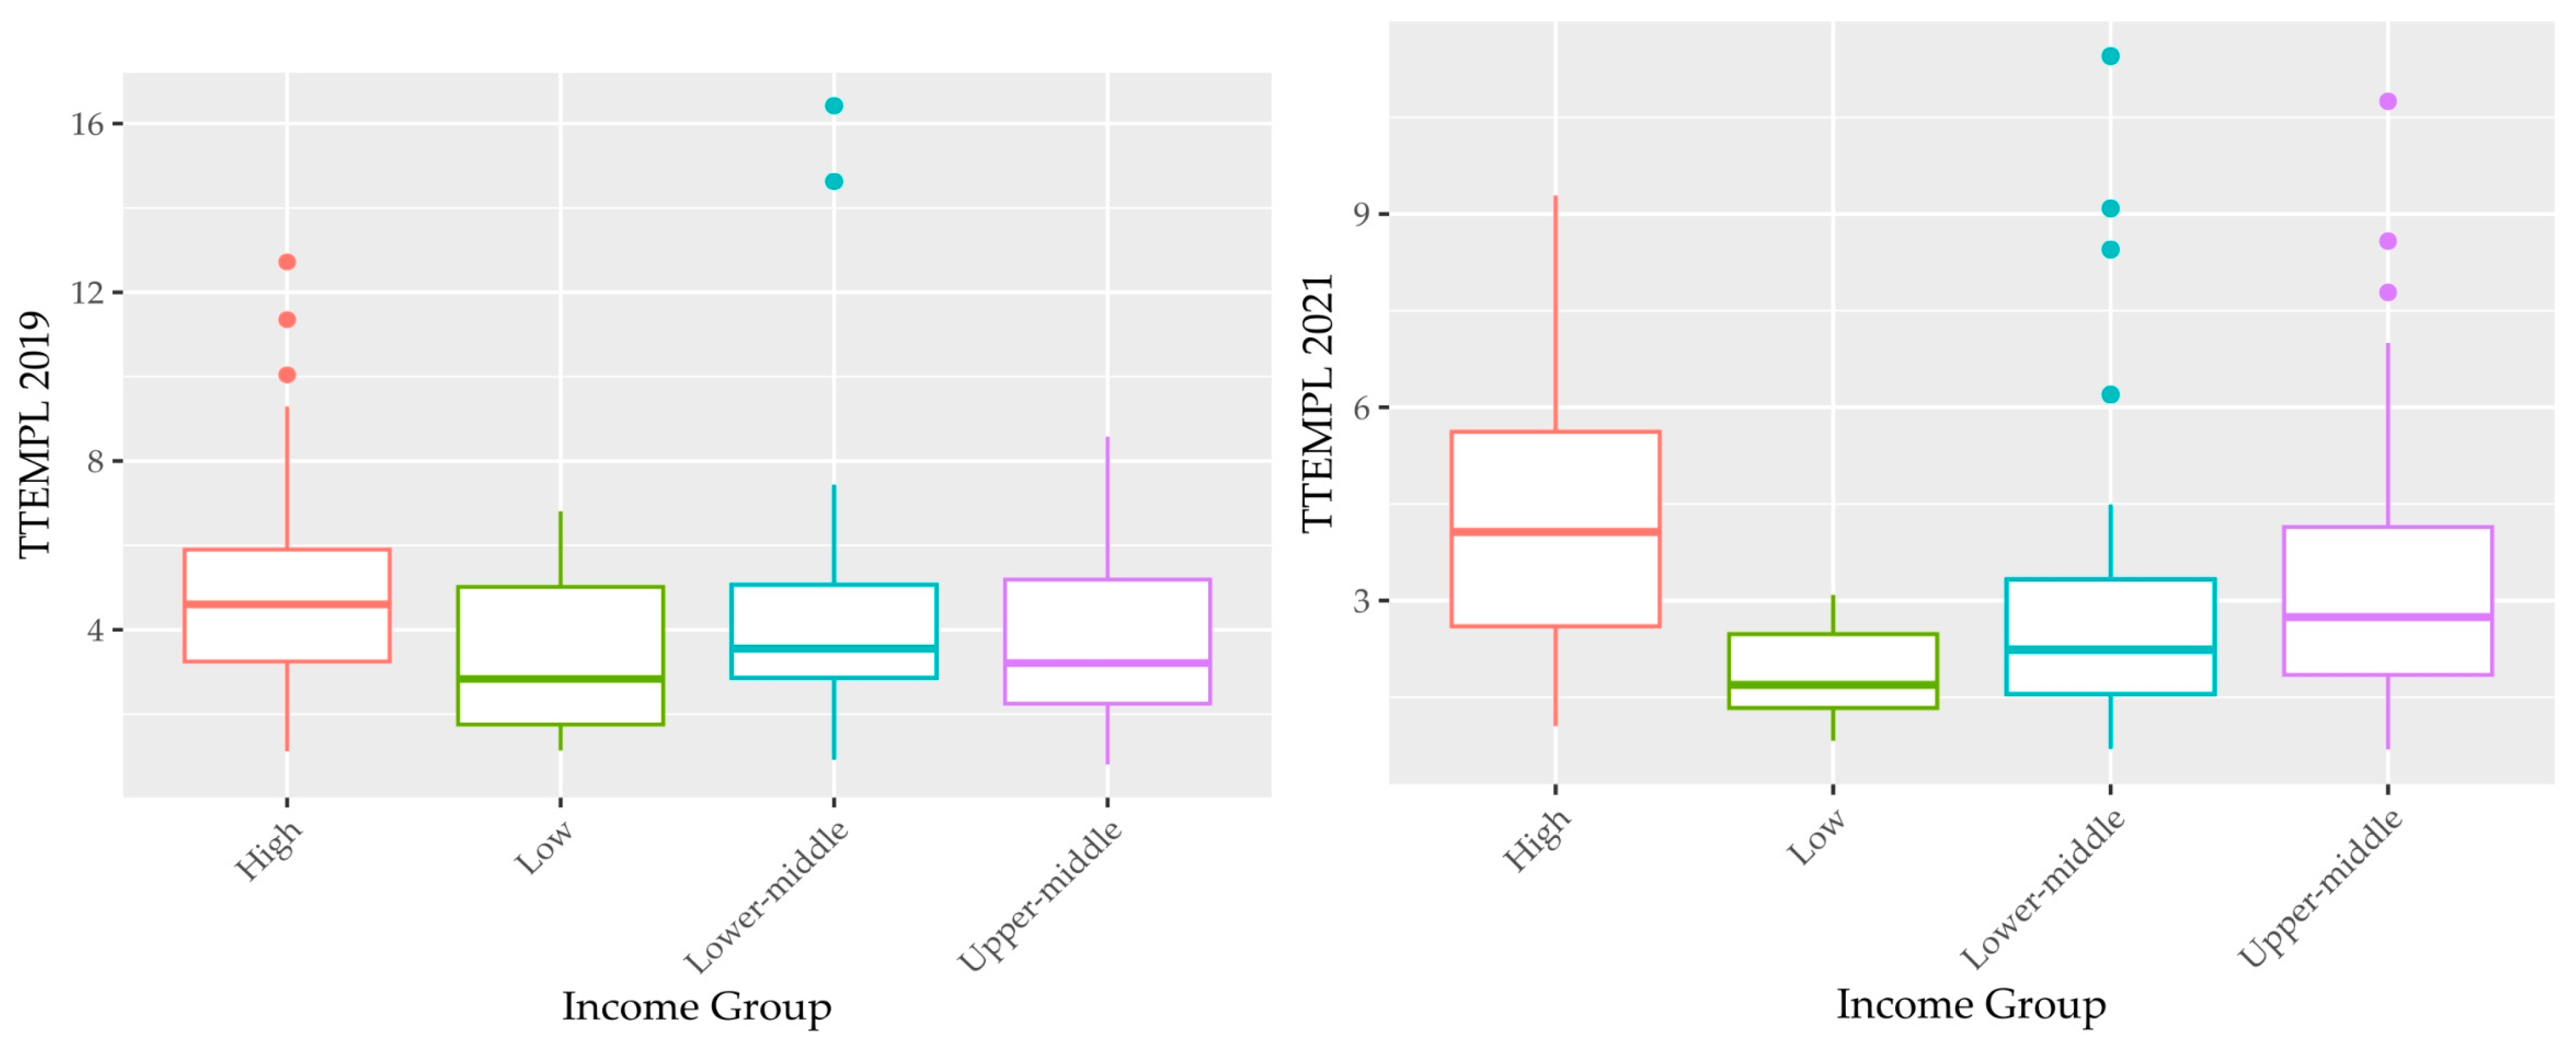
Table 1 and Table 2 present descriptive statistics of the TTEMPL according to region and income group. Figure 1 and Figure 2 visualize boxplots of the TTEMPL according to region and income group.
We see (in Figure 1 and Table 1) the highest median of the TTEMPL in the Middle East and North Africa region in both periods (5.41% in 2019 and 3.97% in 2021). The lowest median of the TTEMPL is in the Sub-Saharan Africa region (3.09% in 2019 and 1.82% in 2021). Moreover, we see some outliers. In 2019, they correspond to Cambodia (14.46%) and New Zealand (9.30%) in the Asia–Pacific region; Greece (12.72%) in the Europe and Eurasia region; Cape Verde (16.42%) in the Sub-Saharan Africa region; Uruguay (9.06%) and Mexico (8.57%) in The Americas region. In 2021, the outliers are the Philippines (11.45%) and Thailand (10.75%) in the Asia–Pacific region, Cape Verde (9.09%) and Mauritius (6.20%) in the Sub-Saharan Africa region, and Uruguay (6.39%) and Mexico (5.45%) in the Americas region.
According to the income group, we see (in Figure 2 and Table 2) the highest median of the TTEMPL in the high-income economies (4.60% in 2019 and 4.07% in 2021) and the lowest median in the low-income economies (2.83% in 2019 and 1.69% in 2021). Considering outliers, in 2019, the outliers are Greece (12.72%), Malta (11.35%), and Croatia (10.04%) in the high-income countries; Cape Verde (16.42%) and Cambodia (14.63%) in lower-middle-income countries. In 2021, the outliers are the Philippines (11.45%), Cape Verde (9.09%), Cambodia (8.44%), and Mauritius (6.20%) in lower-middle-income countries, and Thailand (10.75%), Georgia (8.58%), and Malaysia (7.78%) in upper-middle-income countries.
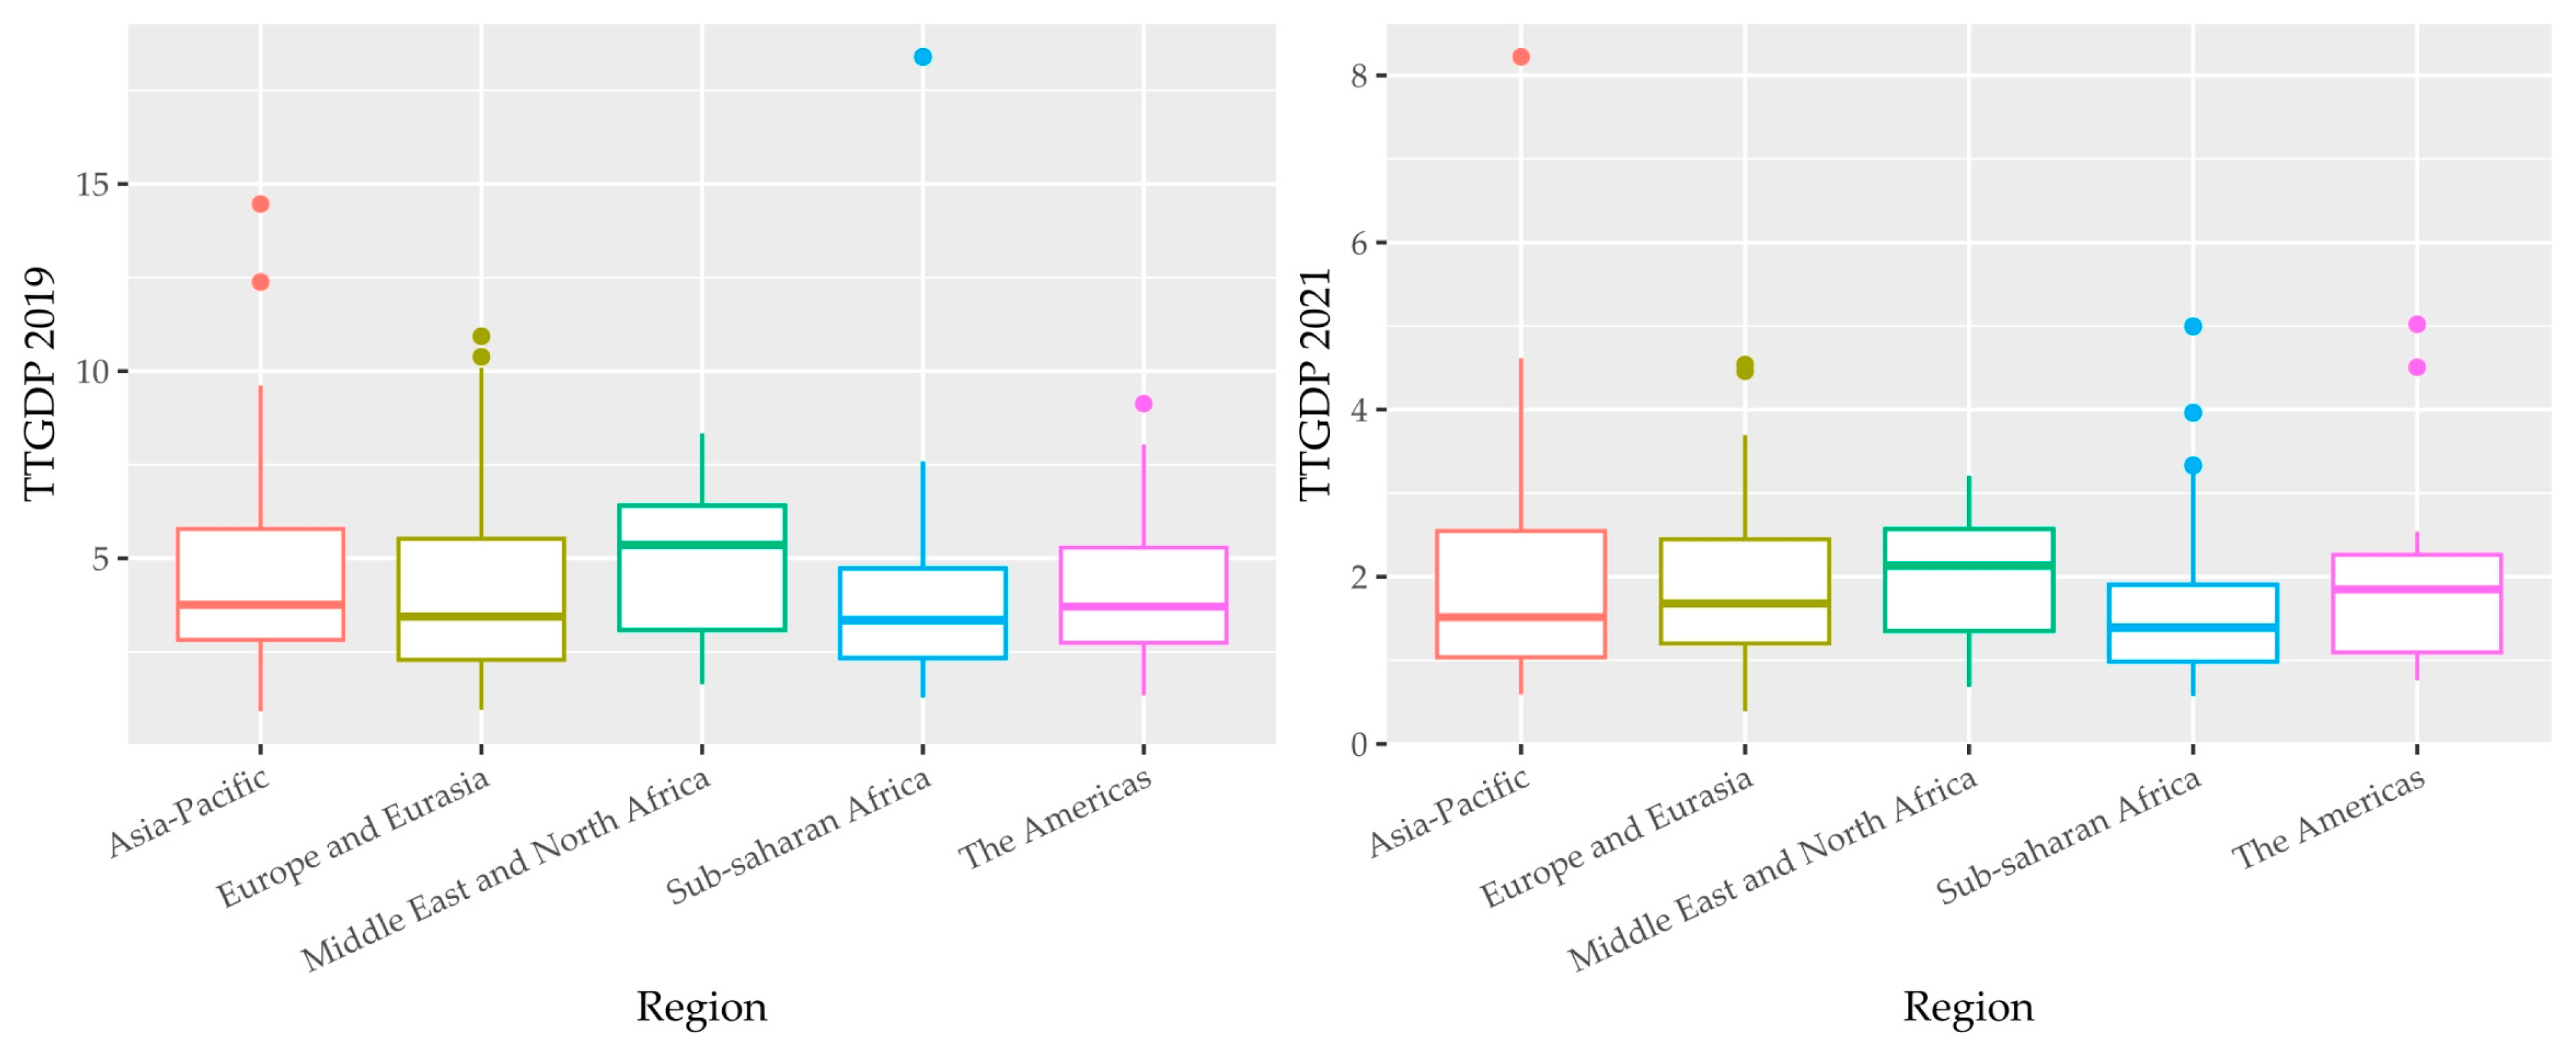
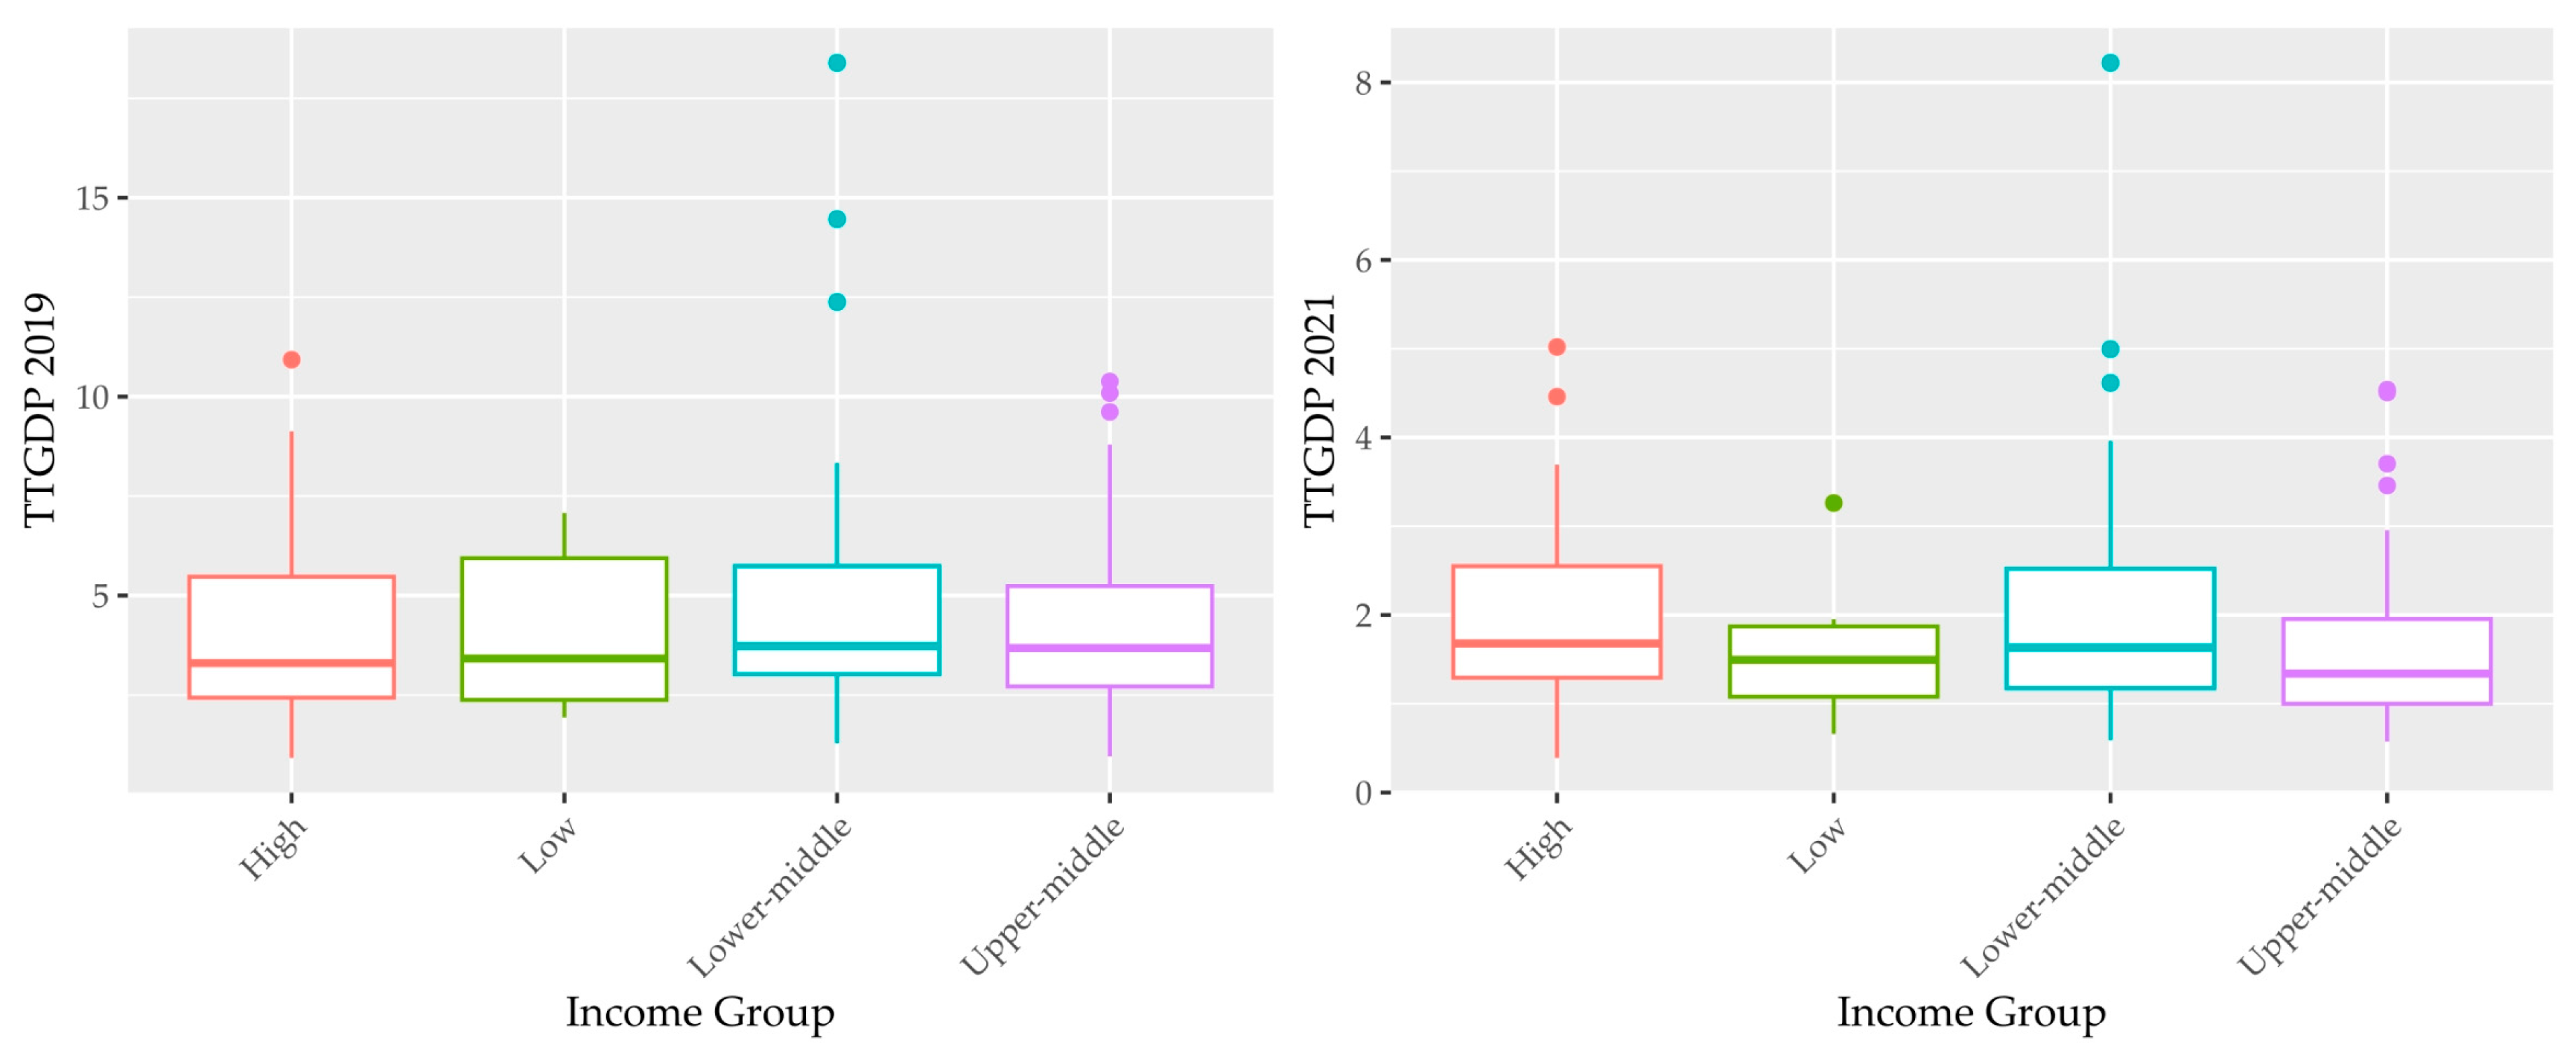
Table 3 and Table 4 present descriptive statistics of the TTGDP according to region and income group. Figure 3 and Figure 4 visualize boxplots of the TTGDP according to region and income group.
We see (in Figure 3 and Table 3) the highest median of the TTGDP in the Middle East and North Africa region in both periods (5.36% in 2019 and 2.13% in 2021). The lowest median of the TTGDP is in the Sub-Saharan Africa region (3.35% in 2019 and 1.39% in 2021). Moreover, we see some outliers. In the Asia–Pacific region, they correspond to Cambodia (14.46%) and the Philippines (12.38%) in 2019 and the Philippines (8.22%) in 2021. In the Europe and Eurasia region, the outliers are Croatia (10.93%), Montenegro (10.38%) in 2019, Albania (4.54%), and Croatia (4.46%) in 2021. In the Sub-Saharan Africa region, the highest TTGDP was in Cape Verde (18.39%) in 2019 and Cape Verde (5.00%), Mauritius (3.96%), and Namibia (3.33%) in 2021. In the Americas region, the outliers are Uruguay (9.12%) in 2019 and Uruguay (5.02%), and Mexico (4.51%) in 2021.
According to the income group, we see (in Figure 4 and Table 4) that the median of the TTGDP is variable in time. In terms of outliers, in high-income economies, they correspond to Croatia (10.93%) in 2019, Uruguay (5.02%), and Croatia (4.46%) in 2021. In low-income economies, we see only one outlier in 2021, in Lesotho (3.26%). In lower-middle-income economies, outliers correspond to Cape Verde (18.39%), Cambodia (14.46%), and the Philippines (12.38%) in 2019, and the Philippines (8.22%), Cape Verde (5.00%), and Cambodia (4.62%) in 2021. In upper-middle-income economies, the outliers are Montenegro (10.38%), Georgia (10.09%), and Thailand (6.62%) in 2019, and Albania (4.54%), Mexico (4.54%), and Thailand (3.70%) in 2021.

3.2. Quantile Regresiion

To meet the research aim, we use QR. The description is based on that provided by Kalina and Vidnerová (2019, p. 25), Vašaničová and Jenčová (2022, p. 387), and Vašaničová and Miškufová (2023, p. 416). In the standard linear regression model
Y i = β 0 + β 1 X i 1 + + β p X i p + ε i , i = 1 , , n ,
the regression τ-quantile for τ ( 0 , 1 ) is defined as a (regression) line with parameters obtained as
arg min b p i = 1 n ρ τ Y i X i T b ,
where X i = X i 1 , , X i p T denotes the i-th observation and ρ τ (defined in Koenker (2005) as loss function) is considered in the form
ρ τ x = x τ 1 x < 0 , x ,
with indicator function denoted by 1. Alternatively, ρ τ may be formulated as
ρ τ x = τ x if   x 0 , τ 1 x if   x < 0 .
If we assume that the quantile τ of the conditional distribution of the dependent variable Yi is a linear function of the vector of independent variables (Xi), then we can write the quantile conditional regression as (Kováč 2013):
Y i = β 0 + β τ X i + ε i τ , i = 1 , , n ,
A specific feature of QR is that the estimated coefficients of the independent variables, β τ , can be significantly different in various quantiles, which may indicate a heterogeneous conditional distribution of the dependent variable (Cupák et al. 2016). The advantage of QR is that it is the most suitable tool for modeling heteroscedastic data (Kalina and Vidnerová 2019, p. 25; Koenker 2005).
To meet the aim of this paper, the model for the OLS is as follows:
T T G D P i = β 0 + β 1 T T E M P L i + ε i , i = 1 , , n
while for QR, we consider the model according to (5) and the sequence of estimated coefficients is from τ = 0.05 to τ = 0.95 by 0.05. We test the presence of heteroscedasticity by the Breusch–Pagan test. If the residuals are heteroskedastic in the regression model, we use a paired bootstrap to compute p-values. To estimate the regression parameters of the QR model, we use the RStudio and the quantreg package, which was created as described by Koenker (2005) and Koenker et al. (2017). To test whether the slope coefficients of the models are identical, we use ANOVA and the anova.rq package.

4. Results

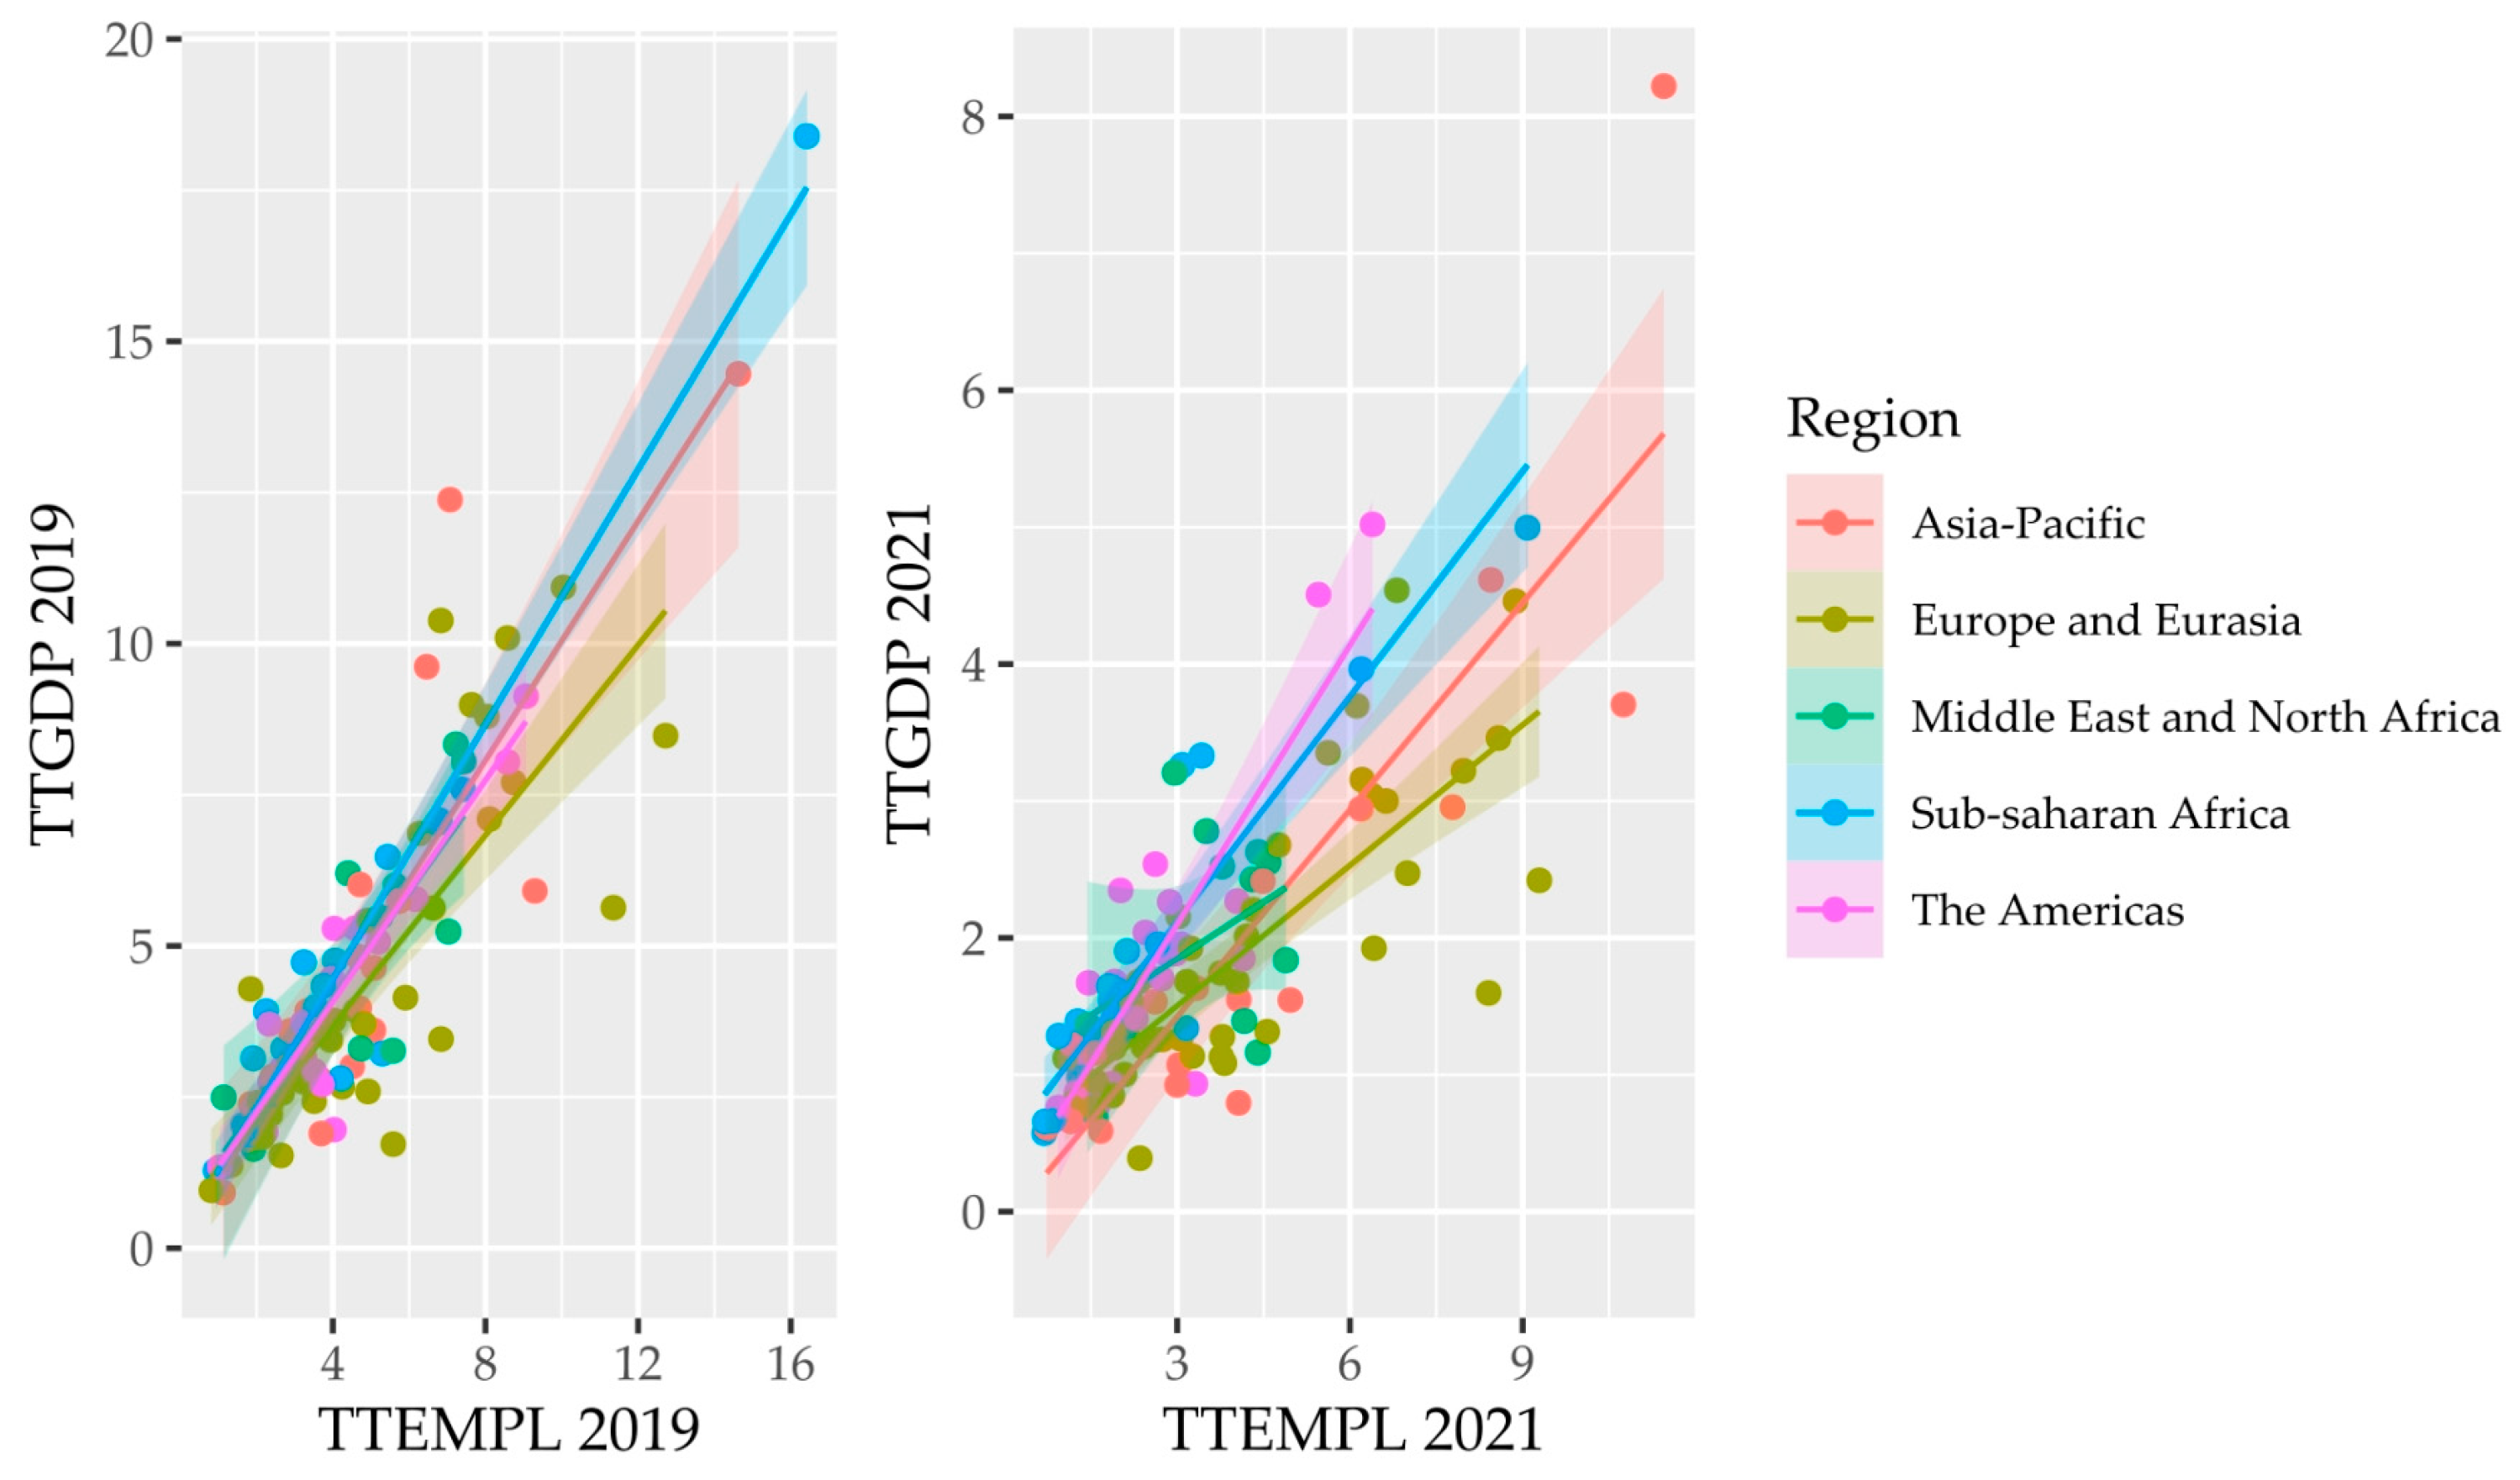
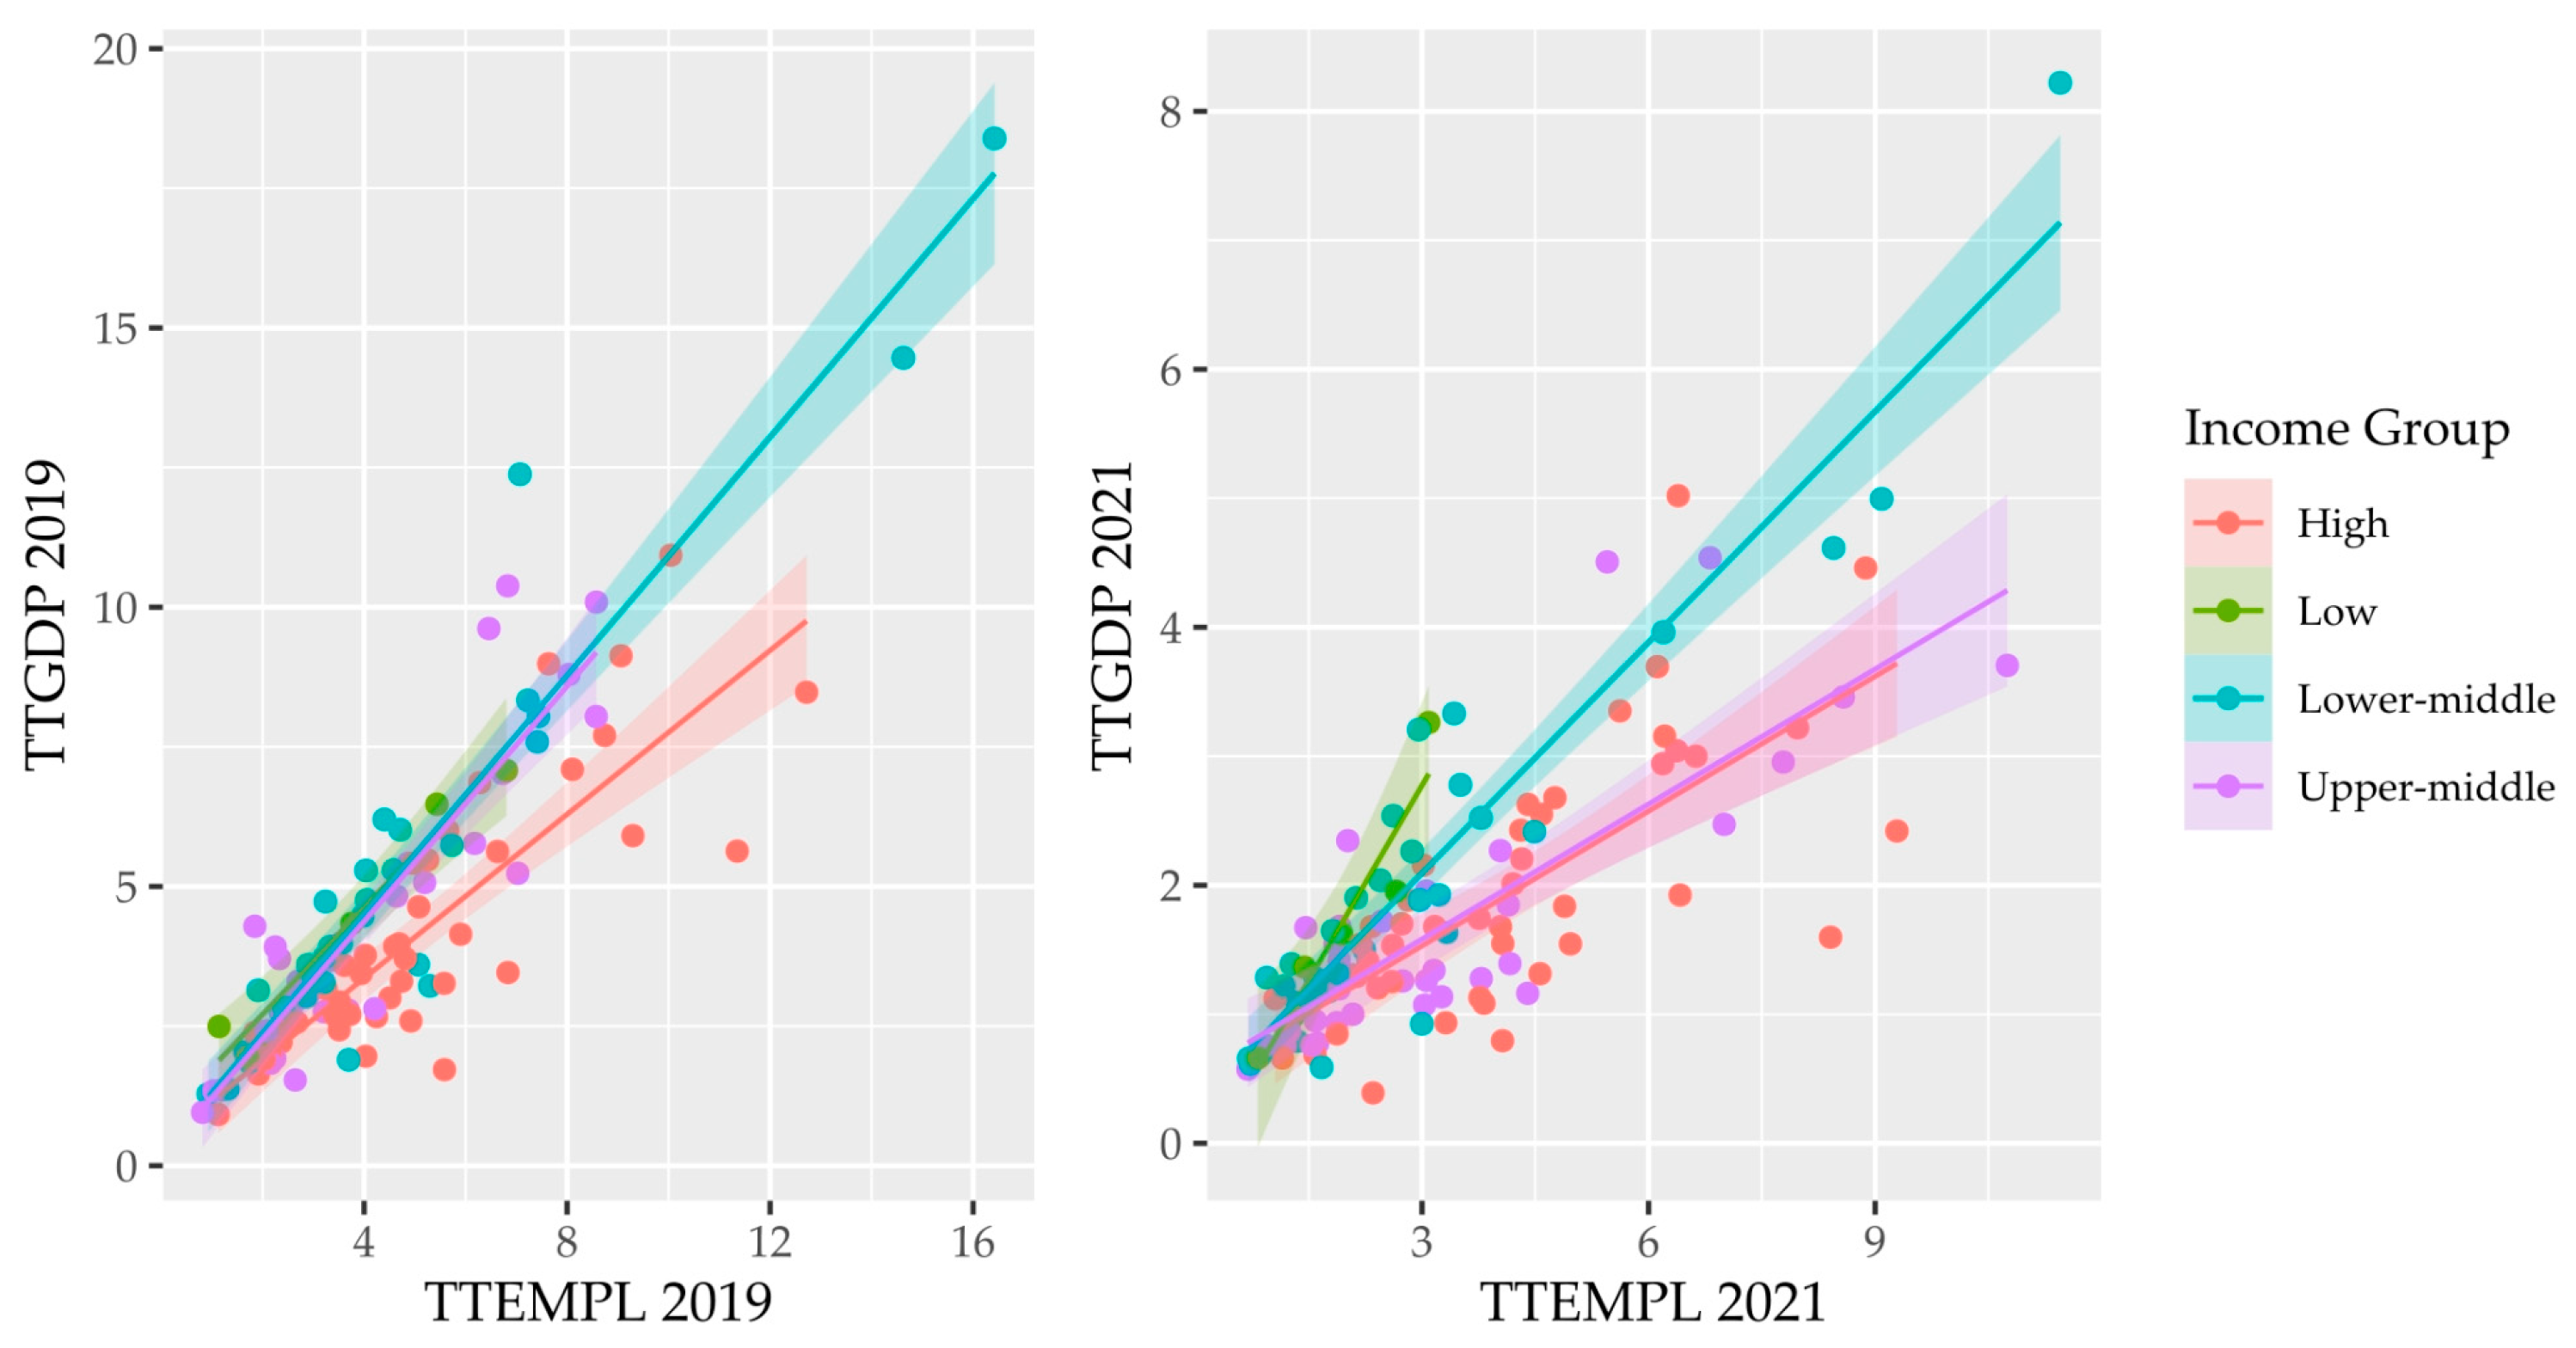
Figure 5 and Figure 6 depict scatterplots that point to the relationship between the TTGDP and the TTEMPL in 2019 and 2021. Countries (dots) are color-coded by region (Figure 5) and income group (Figure 6). Our aim is not to point out the coefficients of the individual regression lines, but only to show that the regression lines (with 95% confidence intervals marked by region or income group) differ across groups. In all cases, the relationship is positive. Countries with low levels of the TTEMPL also have low levels of the TTGDP and vice versa. We see that the slopes of the regression lines vary across the years analyzed.
Table 5 presents the estimates of QR and OLS models for 2019 and 2021. The results of the ANOVA test detected that QR estimates significantly differ across quantiles. The regression model parameter estimates obtained using OLS were statistically significant, and the model explained up to 76.43% (in 2019) and 62.21% (in 2021) of the variability of the TTGDP. However, we indicated the presence of heteroskedasticity, which we confirmed through the Breuch–Pagan test (in 2019, BP = 23.670, p = 0.0000; in 2021, BP = 32.508, p = 0.0000). Therefore, the use of quantile regression is justified. The results of QR show that the TTEMPL is statistically significant at each quantile level. Moreover, the coefficients differ between the models for 2019 and 2021. However, in both cases, as the quantile grows, the coefficient grows.
Figure 7 presents the sequence of estimated coefficients from τ = 0.05 to τ = 0.95 by 0.05. Each panel represents a covariate in the model; the horizontal axes display the quantiles, while the estimated effects are reported on the vertical axes (Costanzo and Desimoni 2017; Vašaničová and Jenčová 2022). The horizontal black solid line parallel to the x-axis denotes zero value; the red solid line corresponds to the OLS coefficient along with the 95% confidence interval (red dashed lines). Each black dot is the slope coefficient for the quantile indicated on the x-axis with 95% confidence bands marked by a gray color (Vasanicova et al. 2021; Vašaničová and Miškufová 2023). As stated by Costanzo and Desimoni (2017, p. 14), a joint inspection of the QR coefficients and the corresponding confidence bands, along with the OLS confidence intervals, permit an understanding of whether the effect of predictors is significantly different across the conditional distribution of the TTGDP values compared to the OLS estimate.
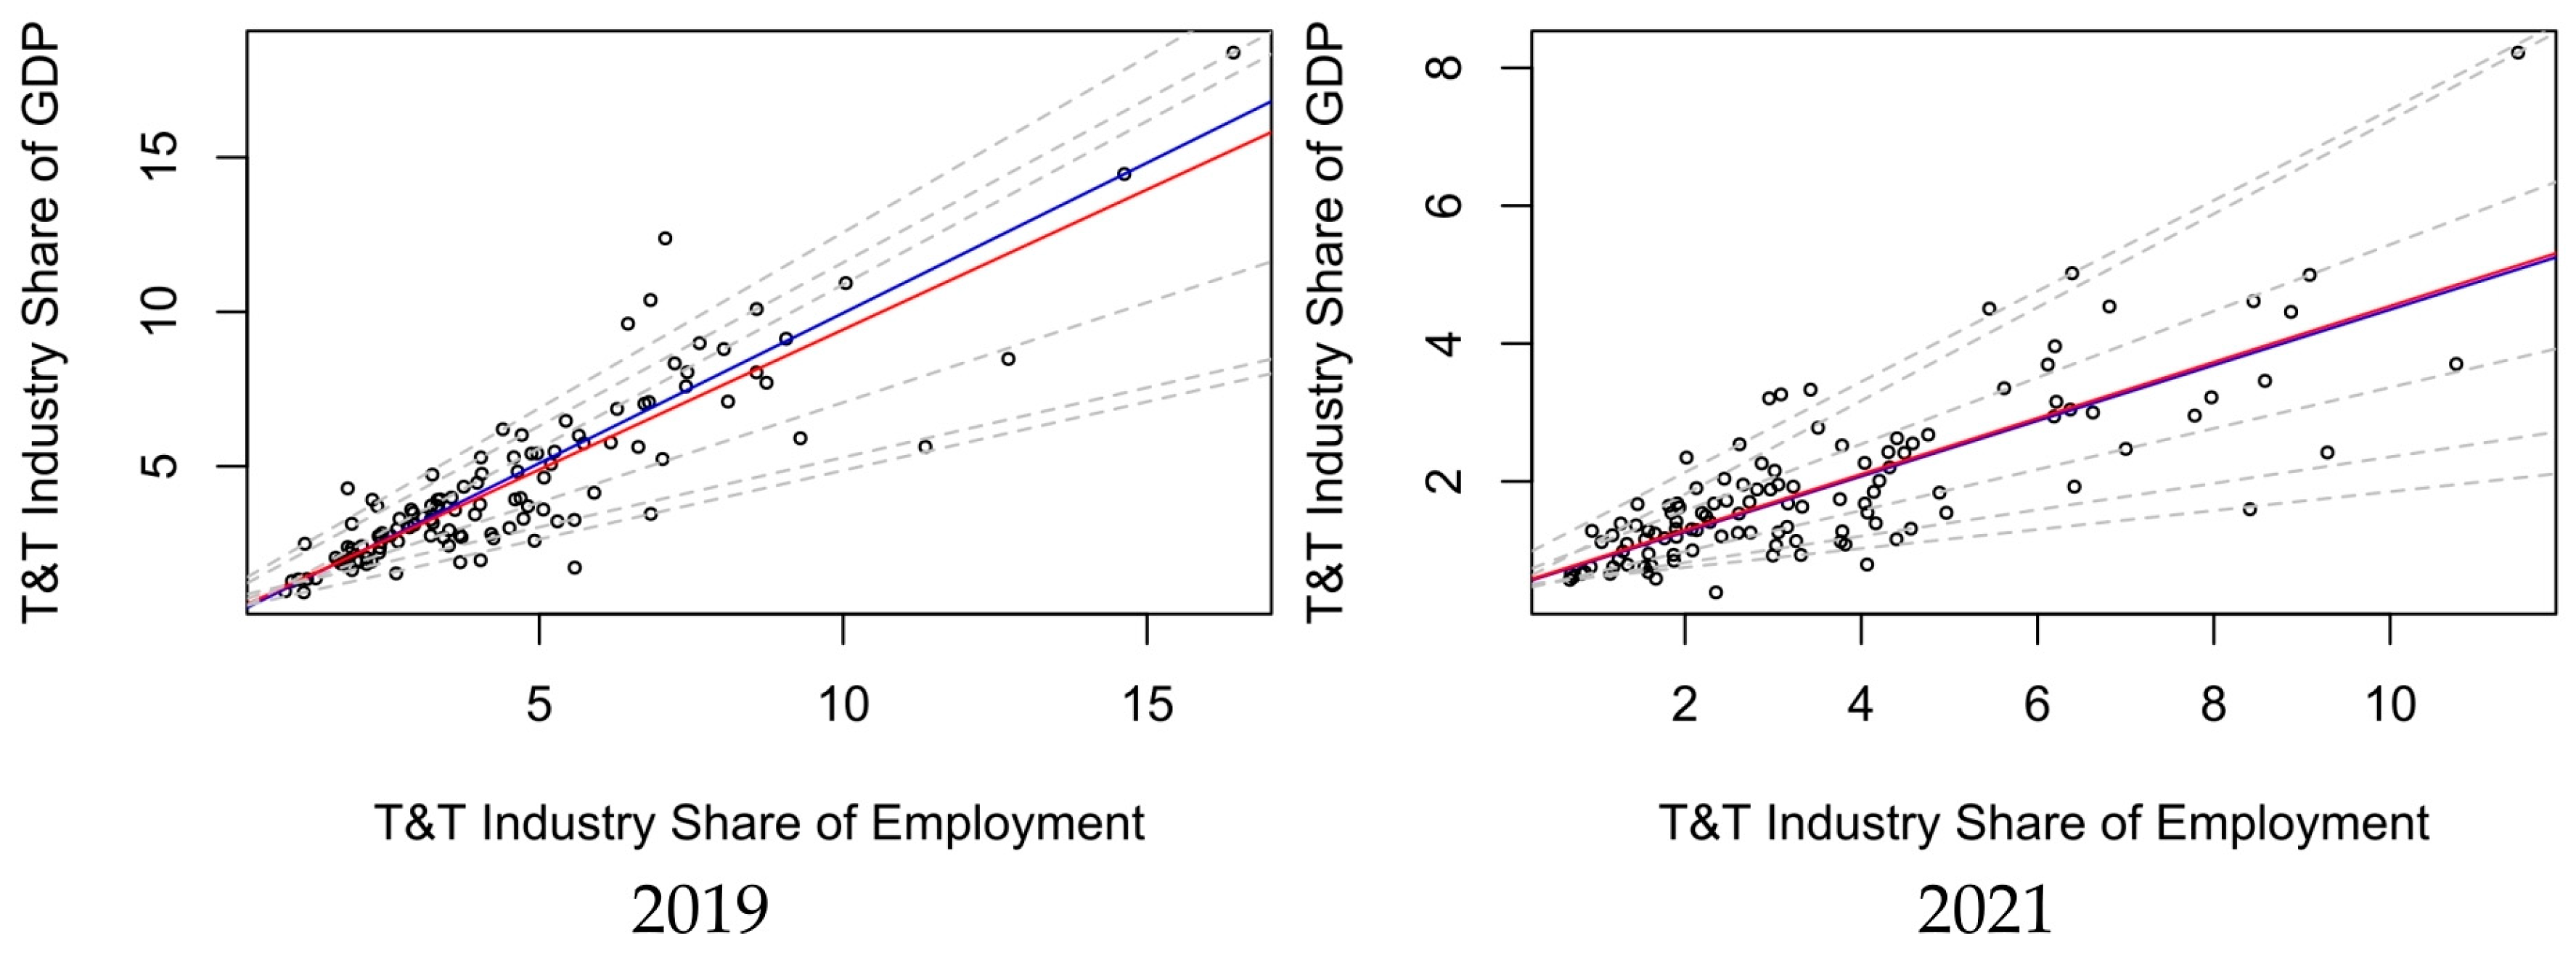
Figure 8 shows the scatterplots, OLS and QR fits for different taus for 2019 and 2021. Superimposed on the plot are the τ = 0.05, τ = 0.10, τ = 0.25, τ = 0.75, τ = 0.90, τ = 0.95 quantile regression lines in gray, the median fit in solid blue, and the least squares estimate of the conditional mean function is represented by the solid red line.
Through QR, we found out which percentiles of the TTGDP may be more affected by the TTEMPL (we see high coefficients for high quantile levels). In general (in both models), as the quantile grows, the coefficients grow. First, we interpret the results for the first model (2019) (see Table 5). For example, for the median (τ = 0.50), we see that the 1% increase in the TTEMPL is associated with the growth of the TTGDP by 0.97230%; for the third quartile (τ = 0.75), we see that the 1% increase in the TTEMPL is associated with the growth of the TTGDP by 1.05847%. On the other hand, although in the second model (2021), the coefficients also increase with quartile growth, the values are significantly lower. In this case, for the median (τ = 0.50), we see that the 1% increase in the TTEMPL is associated with the growth of the TTGDP by 0.40312%; for the third quartile (τ = 0.75), we see that the 1% increase in the TTEMPL is associated with the growth of the TTGDP by 0.48243%. Therefore, we examine whether the QR coefficients (for given τ) statistically significantly differ between 2019 and 2021. Wilcoxon’s signed rank test shows that differences exist. The results are shown in Table 6.
Finally, we report which countries experienced the highest declines in the examined indicators as a result of the COVID-19 pandemic. Summary results of differences between 2021 and 2019 within the TTEMPL and the TTGDP for each of the 117 countries are in Table A3 in Appendix B. The highest decrease in the TTEMPL caused by COVID-19 was recorded in Cape Verde (−7.34%, Sub-Saharan Africa, lower-middle-income group), Greece (−6.35%, Europe and Eurasia, high-income group), Cambodia (−6.18%, Asia–Pacific, lower-middle-income group). The highest decrease in the TTGDP occurred in Cape Verde (−13.40%, Sub-Saharan Africa, lower-middle-income group), Cambodia (−9.85%, Asia–Pacific, lower-middle-income group), and Montenegro (−7.91%, Europe and Eurasia, upper-middle-income group).
Surprisingly, in some countries, despite the pandemic, the indicators have increased. We see the highest increase of the TTEMPL in the Philippines (4.38%, Asia–Pacific, lower-middle-income group), Thailand (4.29%, Asia–Pacific, upper-middle-income group), and Netherlands (4.38%, Europe and Eurasia, high-income group). There was an increase in another 18 countries. The Philippine government has implemented several initiatives to encourage job creation and retention, including wage subsidies and the cash-for-work program (Furio et al. 2023). The paradox of Thailand’s success in controlling COVID-19 was described by Tangkitvanich (2021). Thailand prioritized soft loans to ease the cash constraints of small and medium enterprises, with earmarked allocations for travel and tourism companies (ILO Brief 2021). The Netherlands managed to maintain relatively stable employment levels during the COVID-19 pandemic because the Dutch government took measures to prevent employers from releasing employees (Bussink et al. 2022).
Considering the TTGDP, increases occurred in four countries, i.e., the Netherlands (0.70%, Europe and Eurasia, high-income group), Kyrgyz Republic (0.55%, Europe and Eurasia, lower-middle-income group), Moldova (0.18%, Europe and Eurasia, upper-middle-income group), and Namibia (0.11%, Sub-Saharan Africa, lower-middle-income group). The effective strategies employed by the Dutch government were also reflected in GDP performance (Bussink et al. 2022). The Kyrgyz government provided financial assistance and relief measures to tourism businesses to help them survive during the pandemic-induced downturn. This support aimed to prevent widespread closures and job losses in the tourism industry, thereby safeguarding tourism GDP (Grant 2024). The implementation of a fiscal stimulus aimed to cushion the impact of the pandemic in Namibia was examined by Julius et al. (2022).

5. Discussion

The term “crisis” has become increasingly common lately, owing to the adverse events that have affected various industries and societies worldwide (Lim and To 2022).
The study reveals that the tourism downturn caused by COVID-19 has adverse effects on direct employment in tourism. These outcomes highlight the depth and complexity of tourism. Although resources freed up from the tourism industry could potentially be absorbed by other industries, it is improbable that these resources could be extensively utilized by non-tourism industries given the current circumstances. The findings of this study concerning the macroeconomic effects of reduced tourism GDP and employment can help formulate specific policies to stimulate the industry. According to Sun et al. (2022), the observation of global tourism job losses reflects the social issue of inequality. Understanding potential mediators and moderators that may influence the relationship under investigation, e.g., government response effectiveness, health infrastructure, and dependency on tourism flows, can provide valuable insights for policymakers in designing effective strategies to support tourism employment and promote sustainable economic growth in tourism-dependent economies. Effective government responses can play a crucial role in maintaining both tourism GDP and employment levels. For instance, during economic downturns or crises like the COVID-19 pandemic, government interventions such as financial aid, wage subsidies, and job retention schemes can directly influence the stability of tourism employment, which in turn supports tourism GDP (Barišić and Kovač 2022). Good health infrastructure can manage health crises effectively, reducing the impact on tourism activities (Xiong and Tang 2023) and thus stabilizing the TTEMPL and the TTGDP. Dependency on tourism flows could be also considered an important factor. For instance, in highly tourism-dependent economies, a drop in tourist arrivals directly leads to job losses, while tourism growth can rapidly boost employment. In more diversified economies, other sectors can buffer the impact of fluctuations in tourism GDP on employment, thus moderating this relationship (Schubert 2021).
Our results show the impact of COVID-19 on the tourism industry appears to be varied among countries. It corresponds to the results of Lim and To (2022). However, their research focused on tourism during the pandemic from a different perspective. They studied the effects of the COVID-19 pandemic on the gambling sector, focusing on Macao, the world’s largest destination-dependent gambling center. Moreover, we have shown that COVID-19 had a devastating impact on the GDP and employment. It corresponds to the research by Seabra and Bhatt (2022), who provided a literature review connected with the negative and positive effects of COVID-19 on the global tourism industry. The devastating impact of COVID-19 on global GDP and employment has revealed that external factors can significantly curtail one of the key industries of the national and global economy.
Even though variables related to GDP (e.g., per capita) and employment (e.g., employment rate or total employment) have been considered in many existing studies (e.g., Dogru and Sirakaya-Turk 2017; Manzoor et al. 2019; Henseler et al. 2022; Solarin et al. 2024), we are not aware of any research that examines the relationship between the country’s TTEMPL and the country’s TTGDP. One of the contributions of this paper is exploring this in relation to the COVID-19 pandemic.
From the existing research, these indicators were used by Radovanov et al. (2020) when investigating factors affecting the relative tourism efficiency using Tobit regression and an output-oriented data envelopment analysis. Radovanov et al. (2020) showed that the degree of sustainable tourism development significantly and positively impacts the efficiency of tourism. The coefficient for the TTGDP remains significant and positive in terms of overall efficiency, indicating that countries that prioritize the tourism sector tend to be more efficient. On the other hand, they excluded the TTEMPL indicator from their model. Bulin (2014) used the TTEMPL and the TTGDP when calculating the tourism multipliers and efficiency in European Union countries and used cluster analysis to categorize the countries into groups. His research is distinct because it did not address the analysis of relationships between indicators.
Other authors used only one of the two indicators. The TTGDP was used by Lee (2015) when modeling travel and tourism competitiveness. The TTGDP was regarded as one of the statistically significant variables influencing travel and tourism competitiveness. Results indicated that countries with a larger, more viable tourism industry and those that are wealthier tend to be more competitive in the global tourism market. Figini and Patuelli (2022) used the TTEMPL when comparing European Union countries. Their research focused only on the TTEMPL values achieved by the analyzed countries and did not explore any relationships.
Most tourism studies report these indicators at a global level when assessing the importance of tourism to the economy, i.e., how tourism contributes to the world’s GDP or employment (Vernekar 2015). At present, it is often connected with the level related to COVID-19 (e.g., Bogale et al. 2020; Islam and Fatema 2020; Duro et al. 2021; Cardenete et al. 2022; Pham and Nugroho 2022; Akamavi et al. 2023; de Fátima Brilhante and Rocha 2023). If the studies are focused on a specific country or region, these indicators are also mentioned (e.g., Sultana 2016; Manzoor et al. 2019; Mariolis et al. 2021; Moreno-Luna et al. 2021; Peterson and DiPietro 2021; Sun et al. 2021; Škare et al. 2021; Tandrayen-Ragoobur et al. 2022; Ramlall 2024). However, only their values in the given period are presented and are not used in the research part of the publications.
In summary, our study addresses a notable research gap by integrating indicators of TTEMPL and TTGDP within the context of COVID-19. We confirm the existence of the relationship between the country’s TTEMPL and the country’s TTGDP. The results emphasize differences in indicators across regions and income groups within the countries under analysis. The findings from the QR showed that specific percentiles of the TTGDP are influenced to a greater extent by the TTEMPL compared to other percentiles of the TTGDP, leading to alterations in regression coefficients. By adopting this approach, we contribute to a more nuanced understanding of the interplay between tourism, economic activity, and workforce dynamics. This endeavor not only enhances the depth of scholarly inquiry but also offers practical implications for policymakers and industry stakeholders in navigating the challenges and opportunities within the tourism sector.
Fiscal (targeted financial support, investment in infrastructure, promotion, and marketing, diversification support, workforce training, and development) and monetary (exchange rate management, credit facilities, financial incentives, collaboration with financial institutions) policies could support highly tourism-dependent economies, drawing from successful strategies observed in countries that have demonstrated resilience or quick recovery (Şengel et al. 2023). Successful examples of these policies can be observed in various countries. Japan introduced a domestic travel subsidy program called “Go-To Travel” to stimulate the domestic tourism demand during the COVID-19 pandemic. The program provided subsidies covering a portion of travel expenses to encourage domestic travel and boost spending in the tourism sector (Miyawaki et al. 2021). New Zealand implemented a targeted financial support package for tourism businesses during the COVID-19 pandemic, including wage subsidies and grants (Hyslop et al. 2023). Spain launched extensive marketing campaigns to promote tourism recovery, including the “Spain for Sure” campaign to reassure travelers and rebuild confidence in the country as a safe destination (Martín-Critikián et al. 2021). Portugal provided financial incentives for tourism businesses to invest in sustainability measures, such as energy efficiency and waste reduction, to enhance long-term resilience and competitiveness (Turismo de Portugal 2023). Greece introduced targeted financial incentives and tax relief measures for tourism businesses, such as reduced VAT rates for accommodation and catering services, to stimulate demand and support the recovery of the tourism sector following the global financial crisis (European Commission 2023).

6. Conclusions

The COVID-19 pandemic exemplified a global crisis capable of disrupting entire socioeconomic systems worldwide. The tourism industry was no exception. During the initial phases of the pandemic, the tourism industry experienced near-complete halts. Currently, tourism is gradually adapting to new conditions.
We examined the relationship between the country’s TTEMPL and the country’s TTGDP. By focusing on these two indicators, the research underscores the intertwined nature of economic contribution and employment within the tourism sector. Our paper is specific because we did not focus on the development of indicators over time, but we proposed models for the 117 countries using QR. The paper highlighted differences in indicators among regions and income groups of analyzed countries. Importantly, we assessed and compared different results caused by COVID-19. This comparative analysis enhances our understanding of how tourism contributes to economic activity and employment differently in various contexts, thus providing a more comprehensive framework for future research. Moreover, the paper illustrated differences between 2021 and 2019 within the TTEMPL and the TTGDP for each of the 117 countries.
Our results contribute to the existing literature on the nexus between tourism employment and tourism GDP in the context of COVID-19. Our findings show the importance of understanding the intricate dynamics between economic growth and employment within the tourism industry, an area that has received limited attention in the existing literature. Our findings underscore the critical role of external shocks in disrupting the tourism sector and highlight the intricate dynamics between economic growth and employment within this industry. The methodological contribution using QR enriches the theoretical toolkit available for examining economic indicators within the tourism industry, suggesting that traditional linear models may not fully capture the complexity of these relationships. Moreover, this approach reveals varying impacts across the distribution, offering deeper insights into how tourism employment and GDP interact under different economic conditions.
From a practical perspective, the insights from this study have several implications for policymakers or industry stakeholders. We emphasize the necessity for effective crisis management strategies (e.g., rapid response mechanisms, financial support packages, and job retention schemes, wage subsidies) to mitigate the adverse effects of external shocks on tourism employment and GDP. Recognizing the variations in tourism’s economic impact across different regions and income groups, policymakers should tailor their strategies to the unique characteristics of each area. Strengthening health infrastructure is also crucial for managing health crises effectively. Our results can help businesses forecast and manage potential disruptions, ensuring better resilience. Finally, utilizing advanced analytical methods like QR can provide more detailed insights into regional economic dynamics, aiding in the development of more effective regional development plans.
Regarding the circumstances stemming from the COVID-19 pandemic, research by Kožić and Sever (2022) indicates that the heavily affected employment in the tourism sector should begin to rebound once the health risks and travel impediments diminish. To efficiently address and alleviate the social repercussions of COVID-19, robust and credible evidence is essential to inform policy interventions.
In light of these findings, it is evident that further research could provide more comprehensive insights into the evolving dynamics of the travel and tourism industry. Examining the impact of other variables can further enhance our understanding of the tourism sector’s dynamics. Expanding the scope of research to include more diverse geographical and economic contexts will also contribute to a more comprehensive understanding of tourism’s economic impact. If this study is repeated after some time when more data are available, the study will yield more detailed results.
While this study provides valuable insights into the relationship between the TTEMPL and the TTGDP, several limitations should be acknowledged. The study relies on data from 117 countries, but the data quality may vary significantly across different regions. Some countries may lack comprehensive or up-to-date information, which can affect the accuracy of the analysis. While the study examines the impact of COVID-19, it does not deeply explore the long-term effects of the pandemic on the tourism industry. Future research could extend the analysis to cover post-pandemic recovery phases. The impact of global events (e.g., international travel restrictions) versus local factors (e.g., domestic tourism policies) is not distinctly analyzed. A more detailed examination of these influences could offer better policy recommendations. By acknowledging these limitations, future research can address these gaps, leading to a more comprehensive understanding of the dynamics between the TTEMPL and the TTGDP.

Author Contributions

Conceptualization, P.V. and K.B.; methodology, P.V.; software, P.V.; validation, P.V.; formal analysis, P.V. and K.B.; investigation, P.V.; resources, P.V.; data curation, P.V.; writing—original draft preparation, P.V.; writing—review and editing, P.V. and K.B.; visualization, P.V.; supervision, P.V.; project administration, P.V.; funding acquisition, K.B. and P.V. All authors have read and agreed to the published version of the manuscript.

Funding

This research was funded by the Cultural and Educational Grant Agency of the Ministry of Education, Science, Research, and Sport of the Slovak Republic, grant No. 001PU-4/2022–KEGA.

Informed Consent Statement

Not applicable.

Data Availability Statement

For requests concerning the data, please contact the corresponding author.

Conflicts of Interest

The authors declare no conflicts of interest.

Appendix A

Table A1. Countries according to region.
Asia–PacificEurope and EurasiaMiddle East and North AfricaSub-Saharan AfricaThe Americas
AUSLKAALBESPISLNLDAREAGOMWIARGMEX
BGDMNGARMESTITAPOLBHRBENNAMBOLNIC
HKGMYSAUTFINKAZPRTEGYBWANGABRAPAN
CHNNPLAZEFRAKGZROUISRCIVRWACANPER
IDNNZLBELGBRLTUSRBJORCMRSENCOLPRY
INDPAKBGRGEOLUXSVKKWTCPVSLECRISLV
JPNPHLBIHGRCLVASVNLBNGHATCDDOMTTO
KHMSGPCYPHRVMDASWEMARKENTZAECUURY
KORTHACZEHUNMKDTJKQATLSOZAFGTMUSA
LAOVNMDEUCHEMLTTURSAUMLIZMBHNDVEN
DNKIRLMNE TUNMUS CHL
YEM
Source: own processing. Note: countries’ codes are according to Alpha-3.
Table A2. Countries according to income group.
HighLowLower-MiddleUpper-Middle
AREFINISRPOLGHABENKGZNPLAGODOMMLI
AUSFRAITAPRTLSOBGDKHMPAKALBECUMNE
AUTGBRJPNQATRWABOLLAOPHLARGGEOMYS
BELGRCKORSAUSENBWALKASLVARMGTMPAN
BHRHKGKWTSGPSLECIVMARTCDAZECHNPER
CANHRVLTUSVKYEMCPVMNGTJKBGRJORPRY
CYPHUNLUXSVN EGYMUSTUNBIHKAZROU
CZECHELVASWE HNDMWITZABRALBNSRB
DEUCHLMLTTTO IDNNAMVENCMRMDATHA
DNKIRLNLDURY INDNGAVNMCOLMEXTUR
ESPISLNZLUSA KENNICZMBCRIMKDZAF
EST
Source: own processing. Note: countries’ codes are according to Alpha-3.

Appendix B

Table A3. Differences in the TTEMPL and the TTGDP (2021–2019).
CountryΔTTEMPLΔTTGDPCountryΔTTEMPLΔTTGDPCountryΔTTEMPLΔTTGDPCountryΔTTEMPLΔTTGDP
CPV−7.34−13.40MWI−1.34−2.21LTU−0.80−0.68PRY−0.11−0.58
GRC−6.35−5.43SWE−1.32−0.89BRA−0.75−1.28ZMB−0.10−1.49
KHM−6.18−9.85ARG−1.30−1.37CAN−0.72−1.03SVK−0.07−1.31
TUN−4.48−4.84AZE−1.25−2.68IDN−0.70−0.97DNK−0.05−0.69
MAR−3.72−5.55PAK−1.24−1.62ECU−0.68−1.82FIN−0.02−0.75
LSO−3.71−3.82TTO−1.23−1.52CHN−0.65−1.71ITA0.00−2.63
LKA−3.49−4.24ALB−1.22−4.26ESP−0.64−3.21GEO0.00−6.63
MEX−3.12−3.54MUS−1.22−3.63COL−0.62−1.15KOR0.03−0.26
NZL−3.11−2.97QAT−1.17−0.64EGY−0.62−3.68BEL0.05−1.01
MLT−2.94−4.03NIC−1.17−3.02GHA−0.62−1.35MKD0.11−0.76
JOR−2.86−3.84HRV−1.17−6.47VEN−0.60−1.19BGR0.12−1.84
RWA−2.78−4.52BGD−1.16−1.59SRB−0.49−1.47LVA0.15−1.85
URY−2.67−4.11GTM−1.13−1.85AGO−0.48−0.78SAU0.15−1.47
AUT−2.62−4.01ROU−1.10−0.77BIH−0.47−1.50MNE0.17−7.91
TZA−2.61−2.70HUN−1.10−1.51AUS−0.44−1.46SGP0.27−2.43
CYP−2.51−5.73BHR−1.07−3.45CHL−0.43−1.29YEM0.30−1.13
LBN−2.33−5.86ZAF−1.05−1.47DEU−0.42−1.53IRL0.31−1.55
HND−2.13−3.25BOL−1.01−1.65FRA−0.40−1.92ARM0.42−2.65
CRI−2.13−3.12HKG−1.01−3.84MLI−0.35−2.50TUR0.62−2.57
PAN−2.03−3.92SLV−1.01−2.58ISR−0.33−0.96JPN0.76−0.85
BWA−1.97−3.34EST−1.01−1.61KWT−0.32−1.25SVN0.82−0.76
CIV−1.92−2.85USA−0.99−1.01BEN−0.30−1.25KGZ1.910.55
NAM−1.870.11KAZ−0.97−1.08LUX−0.28−0.79MDA2.440.18
SEN−1.82−2.71TJK−0.97−1.71CHE−0.26−1.01MYS3.14−1.87
IND−1.74−1.97ARE−0.94−3.05GBR−0.25−2.39NLD3.710.70
LAO−1.56−2.74SLE−0.88−1.28TCD−0.23−0.63THA4.29−5.91
MNG−1.54−2.69PER−0.87−2.04VNM−0.22−3.60PHL4.38−4.16
KEN−1.43−2.11NGA−0.87−1.17CZE−0.21−0.99
ISL−1.42−5.83CMR−0.85−1.76POL−0.15−1.06
NPL−1.34−2.44DOM−0.83−3.15PRT−0.13−3.88
Source: own processing. Note: a higher drop is indicated by a deeper red color.

References

  1. Ahmad, Nisar, Angeliki N. Menegaki, and Saeed Al-Muharrami. 2020. Systematic literature review of tourism growth nexus: An overview of the literature and a content analysis of 100 most influential papers. Journal of Economic Surveys 34: 1068–110. [Google Scholar] [CrossRef]
  2. Akamavi, Raphaël K., Fahad Ibrahim, and Raymond Swaray. 2023. Tourism and troubles: Effects of security threats on the global travel and tourism industry performance. Journal of Travel Research 62: 1755–800. [Google Scholar] [CrossRef]
  3. Antonakakis, Nikolaos, Mina Dragouni, and George Filis. 2015. How strong is the linkage between tourism and economic growth in Europe? Economic Modelling 44: 142–55. [Google Scholar] [CrossRef]
  4. Barišić, Patrik, and Tibor Kovač. 2022. The effectiveness of the fiscal policy response to COVID-19 through the lens of short and long run labor market effects of COVID-19 measures. Public Sector Economics 46: 43–81. [Google Scholar] [CrossRef]
  5. Bogale, Mekonnen, Shimekit Kelkay, and Wubishet Mengesha. 2020. COVID-19 pandemic and tourism sector in Ethiopia. Horn of African Journal of Business and Economics 1: 1–9. [Google Scholar]
  6. Borrego-Domínguez, Susana, Fernanda Isla-Castillo, and Mercedes Rodríguez-Fernández. 2022. Determinants of Tourism Demand in Spain: A European Perspective from 2000–2020. Economies 10: 276. [Google Scholar] [CrossRef]
  7. Brida, Juan Gabriel, Isabel Cortes-Jimenez, and Manuela Pulina. 2016. Has the tourism-led growth hypothesis been validated? A literature review. Current Issues in Tourism 19: 394–430. [Google Scholar] [CrossRef]
  8. Bulin, Daniel. 2014. EU Travel and Tourism Industry-A Cluster Analysis of Impact and Competitiveness. Global Economic Observer 2: 150–62. [Google Scholar]
  9. Burggraeve, Koen, Grégory de Walque, and Helene Zimmer. 2015. The relationship between economic growth and employment. Economic Review 1: 32–52. [Google Scholar]
  10. Bussink, Henri, Tobias Vervliet, and Bas Ter Weel. 2022. The short-term effect of the COVID-19 crisis on employment probabilities of labour-market entrants in the Netherlands. De Economist 170: 279–303. [Google Scholar] [CrossRef]
  11. Cardenete, Manuel Alejandro, María del Carmen Delgado, and Paula Villegas. 2022. Impact assessment of COVID-19 on the tourism sector in Andalusia: An economic approach. Current Issues in Tourism 25: 2029–35. [Google Scholar] [CrossRef]
  12. Costanzo, Antonella, and Marta Desimoni. 2017. Beyond the mean estimate: A quantile regression analysis of inequalities in educational outcomes using INVALSI survey data. Large-Scale Assessments in Education 5: 1–25. [Google Scholar] [CrossRef]
  13. Cupák, Andrej, Ján Pokrivčák, and Martin Rizov. 2016. Diverzita spotreby potravín na Slovensku. Politická Ekonomie 64: 608–26. [Google Scholar] [CrossRef]
  14. Curtale, Riccardo, Filipe Batista e Silva, Paola Proietti, and Ricardo Barranco. 2023. Impact of COVID-19 on tourism demand in European regions-An analysis of the factors affecting loss in number of guest nights. Annals of Tourism Research Empirical Insights 4: 100112. [Google Scholar] [CrossRef]
  15. de Fátima Brilhante, Maria, and Maria Luísa Rocha. 2023. COVID-19 pre-pandemic tourism forecasts and post-pandemic signs of recovery assessment for Portugal. Research in Globalization 7: 100167. [Google Scholar] [CrossRef]
  16. Ding, Chenhao, Xin Gao, and Zhiyang Xie. 2024. Analysing the differential impact of the COVID-19 pandemic on the resilience of the tourism economy: A case study of the Chengdu-Chongqing urban agglomeration in China. International Journal of Disaster Risk Reduction 102: 104255. [Google Scholar] [CrossRef]
  17. Dogan, Eyup, Fahri Seker, and Serap Bulbul. 2017. Investigating the impacts of energy consumption, real GDP, tourism and trade on CO2 emissions by accounting for cross-sectional dependence: A panel study of OECD countries. Current Issues in Tourism 20: 1701–19. [Google Scholar] [CrossRef]
  18. Dogru, Tarik, and Ercan Sirakaya-Turk. 2017. Engines of tourism’s growth: An examination of efficacy of shift-share regression analysis in South Carolina. Tourism Management 58: 205–14. [Google Scholar] [CrossRef]
  19. Dogru, Tarik, and Umit Bulut. 2018. Is tourism an engine for economic recovery? Theory and empirical evidence. Tourism Management 67: 425–34. [Google Scholar] [CrossRef]
  20. Duro, Juan Antonio, Alejandro Perez-Laborda, Judith Turrion-Prats, and Melchor Fernández-Fernández. 2021. COVID-19 and tourism vulnerability. Tourism Management Perspectives 38: 100819. [Google Scholar] [CrossRef]
  21. European Commission. 2023. 2023 Country Report—Greece. Available online: https://economy-finance.ec.europa.eu/system/files/2023-05/EL_SWD_2023_608_en.pdf (accessed on 21 May 2024).
  22. Figini, Paolo, and Roberto Patuelli. 2022. Estimating the economic impact of tourism in the European Union: Review and computation. Journal of Travel Research 61: 1409–23. [Google Scholar] [CrossRef]
  23. Furio, Maria Cecilia G., Rowena V. Lumandas, Florinda G. Vigonte, and Marmelo V. Abante. 2023. Exploring the Complexities of the Philippine Economy: An In-Depth Analysis of Its Challenges during COVID-19 Pandemic. Available online: https://papers.ssrn.com/sol3/papers.cfm?abstract_id=4441323 (accessed on 21 May 2024).
  24. Ghosh, Sajal. 2009. Electricity supply, employment and real GDP in India: Evidence from cointegration and Granger-causality tests. Energy Policy 37: 2926–29. [Google Scholar] [CrossRef]
  25. Grant, Lewis R. 2024. Lessons Learned from the Kyrgyz Republic’s Public Health Response to COVID-19. Health Security 22. [Google Scholar] [CrossRef]
  26. Henseler, Martin, Helene Maisonnave, and Asiya Maskaeva. 2022. Economic impacts of COVID-19 on the tourism sector in Tanzania. Annals of Tourism Research Empirical Insights 3: 100042. [Google Scholar] [CrossRef]
  27. Hyslop, Dean, David C. Maré, and Shannon Minehan. 2023. COVID-19 Wage Subsidy: Outcome Evaluation; Wellington: Motu Economic and Public Policy Research Trust. Available online: https://www.msd.govt.nz/documents/about-msd-and-our-work/publications-resources/statistics/covid-19/wage-subsidy-evaluation-reports/wage-subsidy-scheme-outcomes-evaluation.pdf (accessed on 21 May 2024).
  28. ILO Brief. 2021. COVID-19 and Employment in the Tourism Sector in the Asia–Pacific Region. Available online: https://www.ilo.org/resource/brief/covid-19-and-employment-tourism-sector-asia-pacific-region (accessed on 21 May 2024).
  29. Islam, Anisul M. 2021. Impact of COVID-19 pandemic on global output, employment and prices: An assessment. Transnational Corporations Review 13: 189–201. [Google Scholar] [CrossRef]
  30. Islam, Mohammad Monirul, and Farha Fatema. 2020. COVID-19 and sustainable tourism: Macroeconomic effect and policy comparison among Europe, the USA and China. Asian Business Review 10: 53–60. [Google Scholar] [CrossRef]
  31. Jencova, Sylvia, Igor Petruska, and Marta Lukacova. 2021. Relationship between ROA and total indebtedness by threshold regression model. Montenegrin Journal of Economics 17: 37–46. [Google Scholar] [CrossRef]
  32. Julius, Evelina, Samuel Nuugulu, and Lukas Julius. 2022. Forecasting the Economic Impacts of COVID-19: A Case for the Namibian Economy. In COVID-19 and a World of Ad Hoc Geographies. Edited by Stanley D. Brunn and Donna Gilbreath. Cham: Springer International Publishing, vol. 1, pp. 1445–66. [Google Scholar] [CrossRef]
  33. Kalina, Jan, and Petra Vidnerová. 2019. Implicitly weighted robust estimation of quantiles in linear regression. In Conference Proceedings of the 37th International Conference on Mathematical Methods in Economics 2019. Paper presented at the 37th International Conference on Mathematical Methods in Economics 2019, České Budějovice, Czech Republic, September 11–13. České Budejovice: University of South Bohemia. [Google Scholar]
  34. Kavya Lekshmi, R. S., and Hrushikesh Mallick. 2022. Contribution of international tourism to economic growth of Kerala: A subnational-level analysis in India. Journal of Policy Research in Tourism, Leisure and Events 14: 165–82. [Google Scholar] [CrossRef]
  35. Klinger, Sabine, and Enzo Weber. 2020. GDP-employment decoupling in Germany. Structural Change and Economic Dynamics 52: 82–98. [Google Scholar] [CrossRef]
  36. Koenker, Roger. 2005. Quantile Regression. New York: Cambridge University Press. [Google Scholar]
  37. Koenker, Roger, Victor Chernozhukov, Xuming He, and Limin Peng. 2017. Handbook of Quantile Regression. Boca Ranton: CCR Press. [Google Scholar]
  38. Kováč, Štefan. 2013. Vybrané faktory predlženosti podnikov v podmienkach SR. Forum Statisticum Slovacum 7: 79–85. [Google Scholar]
  39. Kožić, Ivan, and Ivan Sever. 2022. Can tourism activity stabilize cyclical employment? Annals of Tourism Research Empirical Insights 3: 100043. [Google Scholar] [CrossRef]
  40. Lee, Seojin. 2015. Research note: Quality of government and tourism destination competitiveness. Tourism Economics 21: 881–88. [Google Scholar] [CrossRef]
  41. Li, Mingxiang. 2015. Moving beyond the linear regression model: Advantages of the quantile regression model. Journal of Management 41: 71–98. [Google Scholar] [CrossRef]
  42. Lim, Weng Marc, and Wai-Ming To. 2022. The economic impact of a global pandemic on the tourism economy: The case of COVID-19 and Macao’s destination-and gambling-dependent economy. Current Issues in Tourism 25: 1258–69. [Google Scholar] [CrossRef]
  43. Manzoor, Faiza, Longbao Wei, Muhammad Asif, Muhammad Zia ul Haq, and Hafiz ur Rehman. 2019. The contribution of sustainable tourism to economic growth and employment in Pakistan. International Journal of Environmental Research and Public Health 16: 3785. [Google Scholar] [CrossRef]
  44. Mariolis, Theodore, Nikolaos Rodousakis, and George Soklis. 2021. The COVID-19 multiplier effects of tourism on the Greek economy. Tourism Economics 27: 1848–55. [Google Scholar] [CrossRef]
  45. Martín-Critikián, Davina, José Rodríguez-Terceño, Juan Enrique Gonzálvez-Vallés, and Mónica Viñarás-Abad. 2021. Tourism advertising in times of crisis: The case of Spain and COVID-19. Administrative Sciences 11: 101. [Google Scholar] [CrossRef]
  46. Miyawaki, Atsushi, Takahiro Tabuchi, Yasutake Tomata, and Yusuke Tsugawa. 2021. Association between participation in the government subsidy programme for domestic travel and symptoms indicative of COVID-19 infection in Japan: Cross-sectional study. BMJ Open 11: e049069. [Google Scholar] [CrossRef] [PubMed]
  47. Monterrubio, Carlos. 2022. The informal tourism economy, COVID-19 and socioeconomic vulnerability in Mexico. Journal of Policy Research in Tourism, Leisure and Events 14: 20–34. [Google Scholar] [CrossRef]
  48. Moreno-Luna, Libertad, Rafael Robina-Ramírez, Marcelo Sánchez-Oro Sánchez, and José Castro-Serrano. 2021. Tourism and sustainability in times of COVID-19: The case of Spain. International Journal of Environmental Research and Public Health 18: 1859. [Google Scholar] [CrossRef]
  49. Mulder, Nanno. 2020. The impact of the COVID-19 pandemic on the tourism sector in Latin America and the Caribbean, and options for a sustainable and resilient recovery. In International Trade Series 157. Santiago: Economic Commission for Latin America and the Caribbean. [Google Scholar]
  50. Munawar, Hafiz Suliman, Sara Imran Khan, Fahim Ullah, Abbas Z. Kouzani, and M. A. Parvez Mahmud. 2021. Effects of COVID-19 on the Australian economy: Insights into the mobility and unemployment rates in education and tourism sectors. Sustainability 13: 11300. [Google Scholar] [CrossRef]
  51. Nagaj, Rafał, and Brigita Žuromskaitė. 2021. Tourism in the Era of COVID-19 and Its Impact on the Environment. Energies 14: 2000. [Google Scholar] [CrossRef]
  52. Navarro-Chávez, César Lenin, Francisco Javier Ayvar-Campos, and Celeste Camacho-Cortez. 2023. Tourism, Economic Growth, and Environmental Pollution in APEC Economies, 1995–2020: An Econometric Analysis of the Kuznets Hypothesis. Economies 11: 264. [Google Scholar] [CrossRef]
  53. Paramati, Sudharshan Reddy, Md Samsul Alam, and Ching-Fu Chen. 2017. The effects of tourism on economic growth and CO2 emissions: A comparison between developed and developing economies. Journal of Travel Research 56: 712–24. [Google Scholar] [CrossRef]
  54. Pasieka, Stanislava, Oleksandr Kirdan, Oksana Braslavska, Inna Kosmidailo, Olga Oliinyk, Inna Povorozniuk, and Maryna Drobotova. 2022. The Economic Role of Tourism in European Countries’ Sustainable Development. Management Theory and Studies for Rural Business and Infrastructure Development 44: 323–37. [Google Scholar] [CrossRef]
  55. Peterson, Ryan R., and Robin B. DiPietro. 2021. Exploring the impact of the COVID-19 pandemic on the perceptions and sentiments of tourism employees: Evidence from a small island tourism economy in the Caribbean. International Hospitality Review 35: 156–70. [Google Scholar] [CrossRef]
  56. Pham, Tien, and Anda Nugroho. 2022. Tourism-induced poverty impacts of COVID-19 in Indonesia. Annals of Tourism Research Empirical Insights 3: 100069. [Google Scholar] [CrossRef]
  57. Pham, Tien Duc, Larry Dwyer, Jen-Je Su, and Tramy Ngo. 2021. COVID-19 impacts of inbound tourism on Australian economy. Annals of Tourism Research 88: 103179. [Google Scholar] [CrossRef] [PubMed]
  58. Radovanov, Boris, Branislav Dudic, Michal Gregus, Aleksandra Marcikic Horvat, and Vincent Karovic. 2020. Using a two-stage DEA model to measure tourism potentials of EU countries and Western Balkan countries: An approach to sustainable development. Sustainability 12: 4903. [Google Scholar] [CrossRef]
  59. Ramlall, Indranarain. 2024. Modeling the impact of COVID-19 on the tourism sector in Mauritius: A dynamic stochastic general equilibrium analysis. Annals of Tourism Research Empirical Insights 5: 100130. [Google Scholar] [CrossRef]
  60. Rodousakis, Nikolaos, and George Soklis. 2022. The COVID-19 multiplier effects of tourism on the German and Spanish economies. Evolutionary and Institutional Economics Review 19: 497–510. [Google Scholar] [CrossRef]
  61. Sánchez López, Fernando. 2024. Tourism and Economic Misery: Theory and Empirical Evidence from Mexico. Economies 12: 88. [Google Scholar] [CrossRef]
  62. Scarlett, Hubert G. 2021. Tourism recovery and the economic impact: A panel assessment. Research in Globalization 3: 100044. [Google Scholar] [CrossRef]
  63. Schubert, Stefan Franz. 2021. COVID-19: Economic consequences for a small tourism dependent economy. Revista Brasileira de Pesquisa em Turismo 15: 2297. [Google Scholar] [CrossRef]
  64. Seabra, Cláudia, and Ketan Bhatt. 2022. Tourism sustainability and COVID-19 pandemic: Is there a positive side? Sustainability 14: 8723. [Google Scholar] [CrossRef]
  65. Şengel, Ümit, Merve Işkın, Mustafa Çevrimkaya, and Gökhan Genç. 2023. Fiscal and monetary policies supporting the tourism industry during COVID-19. Journal of Hospitality and Tourism Insights 6: 1485–501. [Google Scholar] [CrossRef]
  66. Šenková, Anna, Martina Košíková, Daniela Matušíková, Kristína Šambronská, Ivana Kravčáková Vozárová, and Rastislav Kotulič. 2021. Time series modeling analysis of the development and impact of the COVID-19 pandemic on spa tourism in Slovakia. Sustainability 13: 11476. [Google Scholar] [CrossRef]
  67. Škare, Marinko, Domingo Riberio Soriano, and Małgorzata Porada-Rochoń. 2021. Impact of COVID-19 on the travel and tourism industry. Technological Forecasting and Social Change 163: 120469. [Google Scholar] [CrossRef] [PubMed]
  68. Solarin, Sakiru Adebola, Gloria Claudio-Quiroga, and Luis A. Gil-Alana. 2024. Persistence in Australian tourism employment industries. Current Issues in Tourism 27: 754–67. [Google Scholar] [CrossRef]
  69. Sultana, Sharmin. 2016. Economic contribution of tourism industry in Bangladesh. Journal of Tourism, Hospitality and Sports 22: 45–54. [Google Scholar]
  70. Sun, Ya-Yen, Lintje Sie, Futu Faturay, Ilmiawan Auwalin, and Jie Wang. 2021. Who are vulnerable in a tourism crisis? A tourism employment vulnerability analysis for the COVID-19 management. Journal of Hospitality and Tourism Management 49: 304–8. [Google Scholar] [CrossRef]
  71. Sun, Ya-Yen, Mengyu Li, Manfred Lenzen, Arunima Malik, and Francesco Pomponi. 2022. Tourism, job vulnerability and income inequality during the COVID-19 pandemic: A global perspective. Annals of Tourism Research Empirical Insights 3: 100046. [Google Scholar] [CrossRef]
  72. Tabash, Mosab I., Suhaib Anagreh, Balal Haider Subhani, Mamdouh Abdulaziz Saleh Al-Faryan, and Krzysztof Drachal. 2023. Tourism, remittances, and foreign investment as determinants of economic growth: Empirical evidence from selected Asian economies. Economies 11: 54. [Google Scholar] [CrossRef]
  73. Tandrayen-Ragoobur, Verena, Neha Devi Tengur, and Sheereen Fauzel. 2022. COVID-19 and Mauritius’ tourism industry: An island perspective. Journal of Policy Research in Tourism, Leisure and Events 1: 1–17. [Google Scholar] [CrossRef]
  74. Tang, Chor Foon, and Eu Chye Tan. 2015. Does tourism effectively stimulate Malaysia’s economic growth? Tourism Management 46: 158–63. [Google Scholar] [CrossRef]
  75. Tang, Chor Foon, and Eu Chye Tan. 2017. Tourism-Led Growth Hypothesis: A New Global Evidence. Cornell Hospitality Quarterly 59: 304–11. [Google Scholar] [CrossRef]
  76. Tangkitvanich, Poum. 2021. The paradox of Thailand’s success in controlling COVID-19. Asian Economic Papers 20: 175–99. [Google Scholar] [CrossRef]
  77. Turismo de Portugal. 2023. Government Materialises a Funding Line with 50 Million Euros for Investments in Sustainability. Available online: https://business.turismodeportugal.pt/en/noticias/Pages/turismo-de-portugal-cria-linha-credito-investimentos-sustentabilidade.aspx (accessed on 21 May 2024).
  78. Uppink Calderwood, Lauren, and Maksim Soshkin. 2022. Travel & Tourism Development Index 2021: Rebuilding for a Sustainable and Resilient Future. Geneva: World Economic Forum. [Google Scholar]
  79. Vašaničová, Petra, and Marta Miškufová. 2023. Portfolio Cash Flow on Peer-to-Peer (P2P) Lending Platform: The Quantile Regression Approach. In Conference Proceedings of the 41th International Conference on Mathematical Methods in Economics 2023. Paper presented at the 41th International Conference on Mathematical Methods in Economics 2023, Prague, Czech Republic, September 13–15. Prague: Prague University of Economics and Business. [Google Scholar]
  80. Vašaničová, Petra, and Sylvia Jenčová. 2022. Determinants of International Tourism Inbound Receipts: The Quantile Regression Approach. In Conference Proceedings of the 40th International Conference on Mathematical Methods in Economics 2022. Paper presented at the 40th International Conference on Mathematical Methods in Economics 2022, Jihlava, Czech Republic, September 7–9. Jihlava: College of Polytechnics Jihlava. [Google Scholar]
  81. Vasanicova, Petra, Sylvia Jencova, Beata Gavurova, and Radovan Bacik. 2021. Cultural and Natural Resources as Determinants of Travel and Tourism Competitivenes. Transformations in Business & Economics 20: 300–16. [Google Scholar]
  82. Vernekar, Shradha. 2015. The Growth of Travel and Tourism: An Overview. Journal of Commerce and Management Thought 6: 547–57. [Google Scholar] [CrossRef]
  83. Walmsley, Andreas. 2017. Overtourism and underemployment: A modern labour market dilemma. Paper presented at the 13th International Conference on Responsible Tourism in Destinations, Reykjavik, Iceland, September 29–30; Reykjavik: Icelandic Tourism Research Centre. [Google Scholar]
  84. Wickramasinghe, Kanchana, and Athula Naranpanawa. 2023. Tourism and COVID-19: An economy-wide assessment. Journal of Hospitality and Tourism Management 55: 131–38. [Google Scholar] [CrossRef]
  85. Wu, Doris Chenguang, Chenyu Cao, Wei Liu, and Jason Li Chen. 2022. Impact of domestic tourism on economy under COVID-19: The perspective of tourism satellite accounts. Annals of Tourism Research Empirical Insights 3: 100055. [Google Scholar] [CrossRef]
  86. Xiong, Yu, and Xiaohan Tang. 2023. Tourism during health disasters: Exploring the role of health system quality, transport infrastructure, and environmental expenditures in the revival of the global tourism industry. PLoS ONE 18: e0290252. [Google Scholar] [CrossRef] [PubMed]
  87. Yepez, Carlos, and Walter Leimgruber. 2024. The evolving landscape of tourism, travel, and global trade since the COVID-19 pandemic. Research in Globalization, 100207, in press. [Google Scholar] [CrossRef]
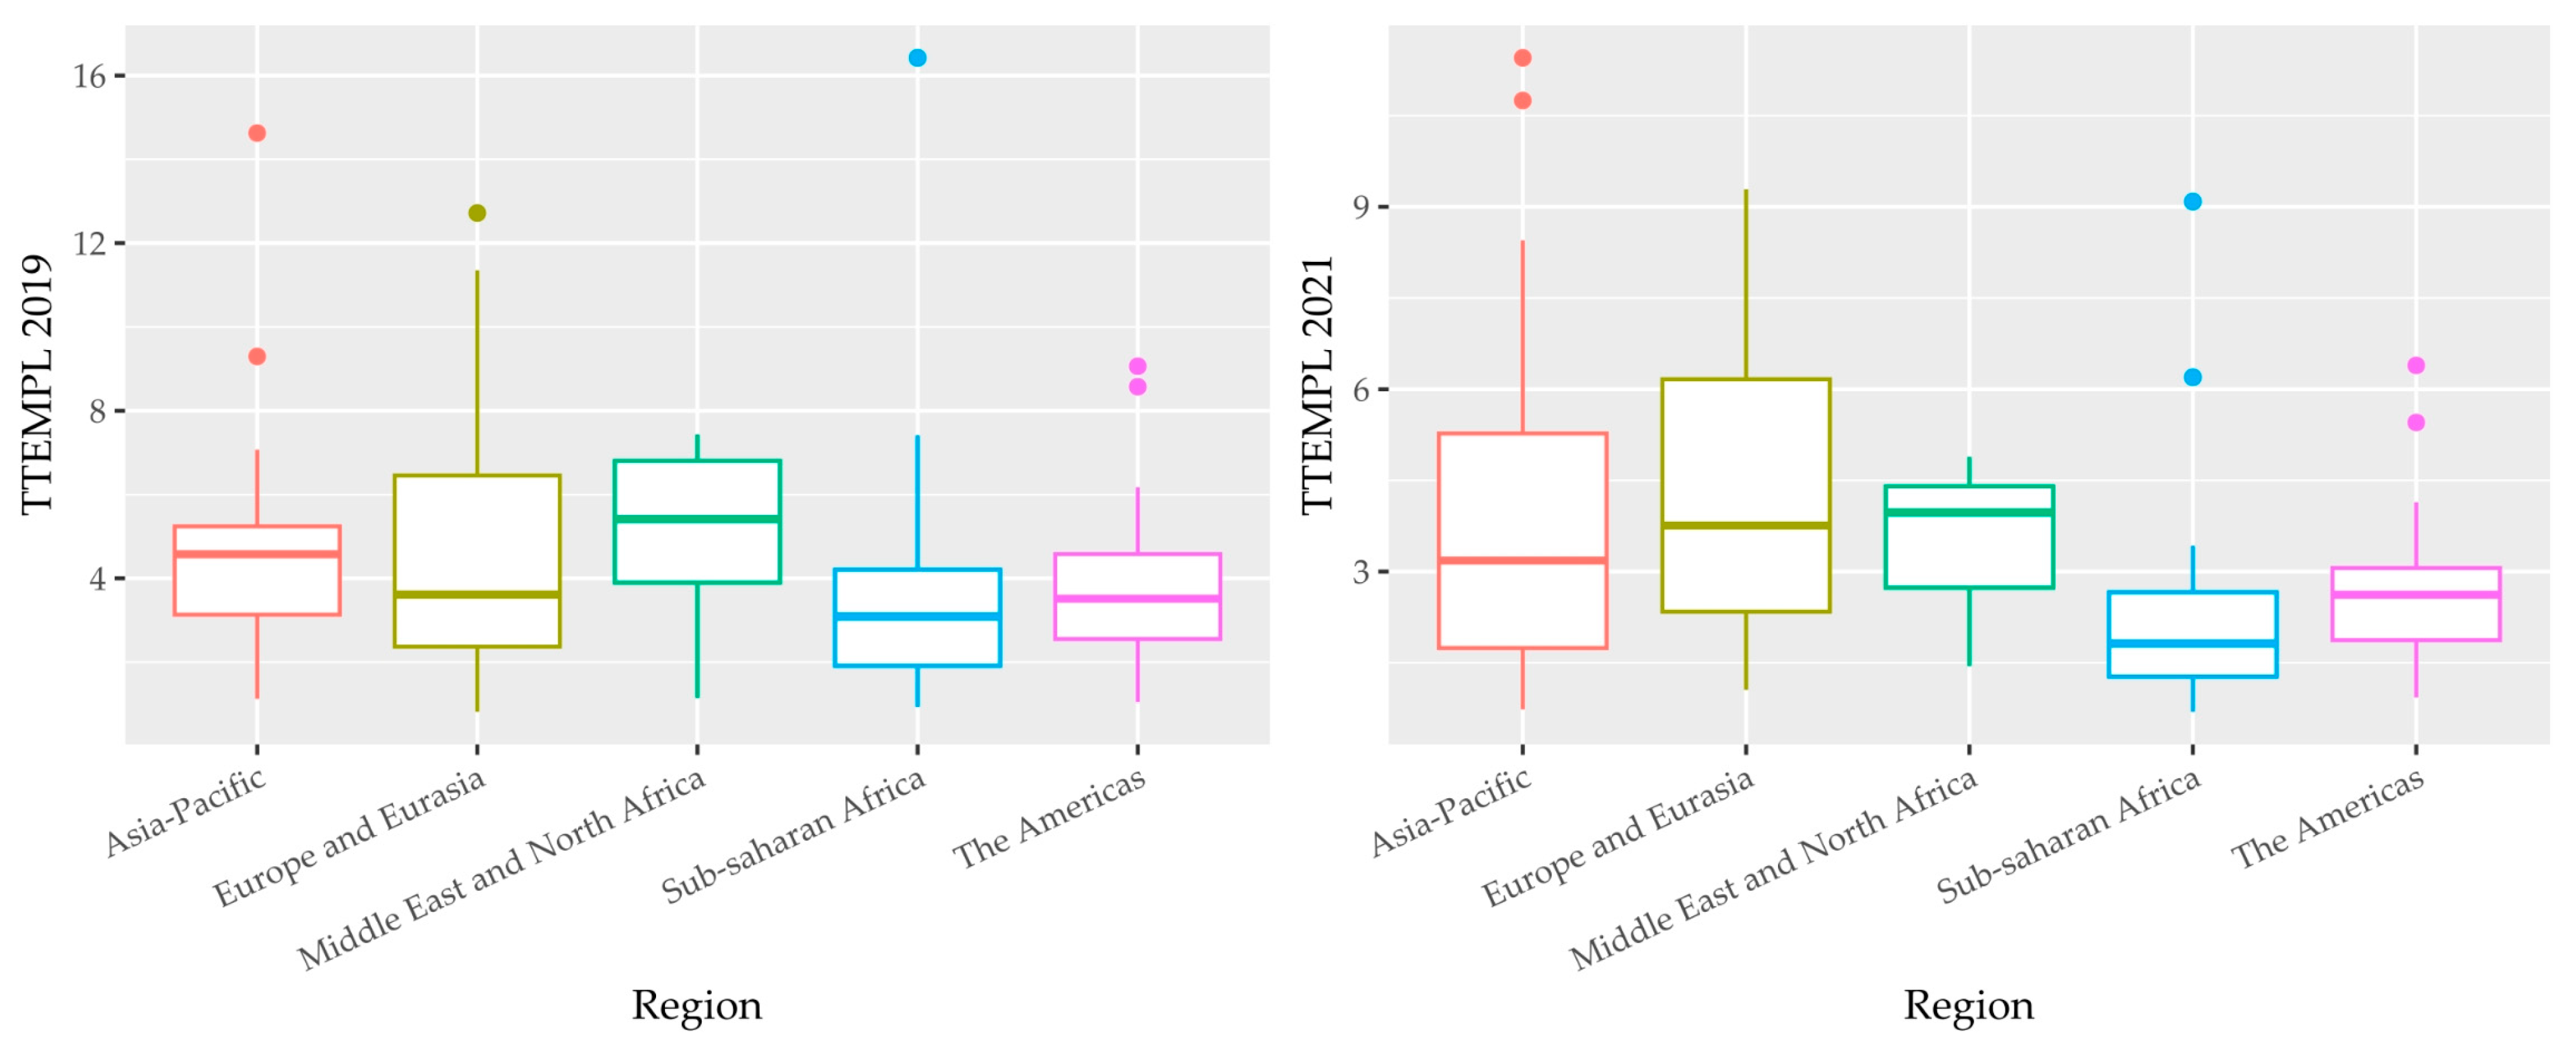
Figure 1. Boxplots of the TTEMPL according to region. Source: own processing using R.
Economies 12 00136 g001
Figure 2. Boxplots of the TTEMPL according to income group. Source: own processing using R.
Economies 12 00136 g002
Figure 3. Boxplots of the TTGDP according to region. Source: own processing using R.
Economies 12 00136 g003
Figure 4. Boxplots of the TTGDP according to income group. Source: own processing using R.
Economies 12 00136 g004
Figure 5. Relationship between the TTGDP and the TTEMPL according to region. Source: own processing using R.
Economies 12 00136 g005
Figure 6. Relationship between the TTGDP and the TTEMPL according to income group. Source: own processing using R.
Economies 12 00136 g006
Figure 7. Estimates of model parameters by quantile level (in 2019 and 2021). Source: own processing using R.
Economies 12 00136 g007
Figure 8. OLS and QR fit for different taus (in 2019 and 2021). Source: own processing using R.
Economies 12 00136 g008
Table 1. Descriptive statistics of the TTEMPL according to region.
Asia–Pacific
(20)
Europe
and Eurasia (43)
Middle East
and North Africa (12)
Sub-Saharan
Africa (21)
The
Americas (21)
2019202120192021201920212019202120192021
Mean4.804.224.634.174.963.513.912.313.962.74
S.D.3.023.172.842.312.141.213.372.002.001.37
Min1.120.730.821.051.141.450.930.691.040.93
Q13.131.742.372.343.902.741.911.272.551.87
Median4.573.183.613.765.413.973.091.823.522.62
Q35.245.276.456.166.804.404.212.664.583.06
Max14.6311.4512.729.297.444.8916.429.099.066.39
Source: own processing using R.
Table 2. Descriptive statistics of the TTEMPL according to income group.
High (45)Low (6)Lower-Middle (33)Upper-Middle (33)
20192021201920212019202120192021
Mean4.964.243.461.884.492.983.873.38
S.D.2.672.062.280.863.342.482.252.40
Min1.121.051.140.830.930.700.820.69
Q13.252.601.761.332.861.552.251.85
Median4.604.072.831.693.552.243.212.74
Q35.905.625.022.485.073.335.194.14
Max12.729.296.803.0916.4211.458.5810.75
Source: own processing using R.
Table 3. Descriptive statistics of the TTGDP according to region.
Asia–Pacific
(20)
Europe
and Eurasia (43)
Middle East
and North Africa (12)
Sub-Saharan
Africa (21)
The
Americas (21)
2019202120192021201920212019202120192021
Mean4.902.044.181.904.961.994.351.744.041.92
S.D.3.491.812.711.012.270.793.661.181.971.09
Min0.920.590.960.391.640.681.280.571.340.76
Q12.821.042.291.203.091.352.340.982.741.09
Median3.761.523.441.685.362.133.351.393.711.85
Q35.782.555.522.456.412.574.731.905.292.26
Max14.468.2210.934.548.333.2118.395.009.135.02
Source: own processing using R.
Table 4. Descriptive statistics of the TTGDP according to income group.
High (45)Low (6)Lower-Middle (33)Upper-Middle (33)
20192021201920212019202120192021
Mean4.061.964.111.645.042.084.241.71
S.D.2.321.002.230.923.761.572.621.05
Min0.920.391.940.661.280.590.960.57
Q12.431.292.381.083.021.182.711.00
Median3.301.683.421.493.731.633.681.34
Q35.482.555.941.875.742.525.241.95
Max10.935.027.083.2618.398.2210.384.54
Source: own processing using R.
Table 5. Estimates of model parameters (in 2019 and 2021).
Dependent Variable: TTGDP
Model 2019Model 2021
QuantileInterceptp-ValueTTEMPLp-ValueInterceptp-ValueTTEMPLp-Value
0.050.418250.34680.444870.00390.478710.02340.137480.0043
0.100.776400.00630.451320.00000.440070.00000.191630.0000
0.150.592950.04900.571880.00000.416250.00000.227440.0000
0.200.563240.29850.606700.00000.445720.00000.230460.0000
0.250.595180.00090.647140.00000.389710.00000.297460.0000
0.300.373050.00220.772840.00000.418800.00070.305630.0000
0.350.261660.12250.851940.00000.375550.00220.355620.0000
0.400.282230.12870.888880.00000.427670.00030.353390.0000
0.450.241040.11430.944410.00000.470220.00010.381790.0000
0.500.240710.14620.972300.00000.462920.00020.403120.0000
0.550.335190.03630.970510.00000.493800.00020.428480.0000
0.600.317530.01770.996680.00000.495270.00030.446710.0000
0.650.265770.03571.037540.00000.587530.00000.436320.0000
0.700.239920.06621.062490.00000.491780.00010.488000.0000
0.750.300170.26941.058470.00000.612320.00000.482430.0000
0.800.240370.36041.105390.00000.632030.00010.499850.0000
0.850.345320.40891.105180.00000.663930.00340.532250.0000
0.901.016470.12411.058130.00000.460110.11660.677750.0000
0.951.194840.22471.137640.00040.816360.00470.657680.0000
ANOVA p-value = 0.0000ANOVA p-value = 0.0000
OLS0.361650.14300.906590.00000.478970.00020.406550.0000
BP = 23.670 (p-value = 0.0000); R2 = 0.7643BP = 32.508 (p-value = 0.0000); R2 = 0.6221
Source: own processing using R. Note: The p-values marked bold indicate the statistical significance at the significance level of 0.05.
Table 6. Differences in quantile regression coefficients between 2019 and 2021—Wilcoxon’s signed-rank test.
VariablesnW+W−zp-Value
QR coefficients 2019
QR coefficients 2021
1919003.80290.0001
Source: own processing using R.
Disclaimer/Publisher’s Note: The statements, opinions and data contained in all publications are solely those of the individual author(s) and contributor(s) and not of MDPI and/or the editor(s). MDPI and/or the editor(s) disclaim responsibility for any injury to people or property resulting from any ideas, methods, instructions or products referred to in the content.