The Role of Comparative Advantage in Enhancing Trade in Value-Added Using a Dynamic GMM Model
Abstract
:1. Introduction
2. Literature Review
3. Methodology
3.1. Data Description
3.2. Measuring Trade in Value Added
3.3. Measuring Comparative Advantage
3.4. Dynamic GMM Model Specification
4. Empirical Results and Discussion
4.1. Summary Statistics
4.2. Unit-Root-Test Result
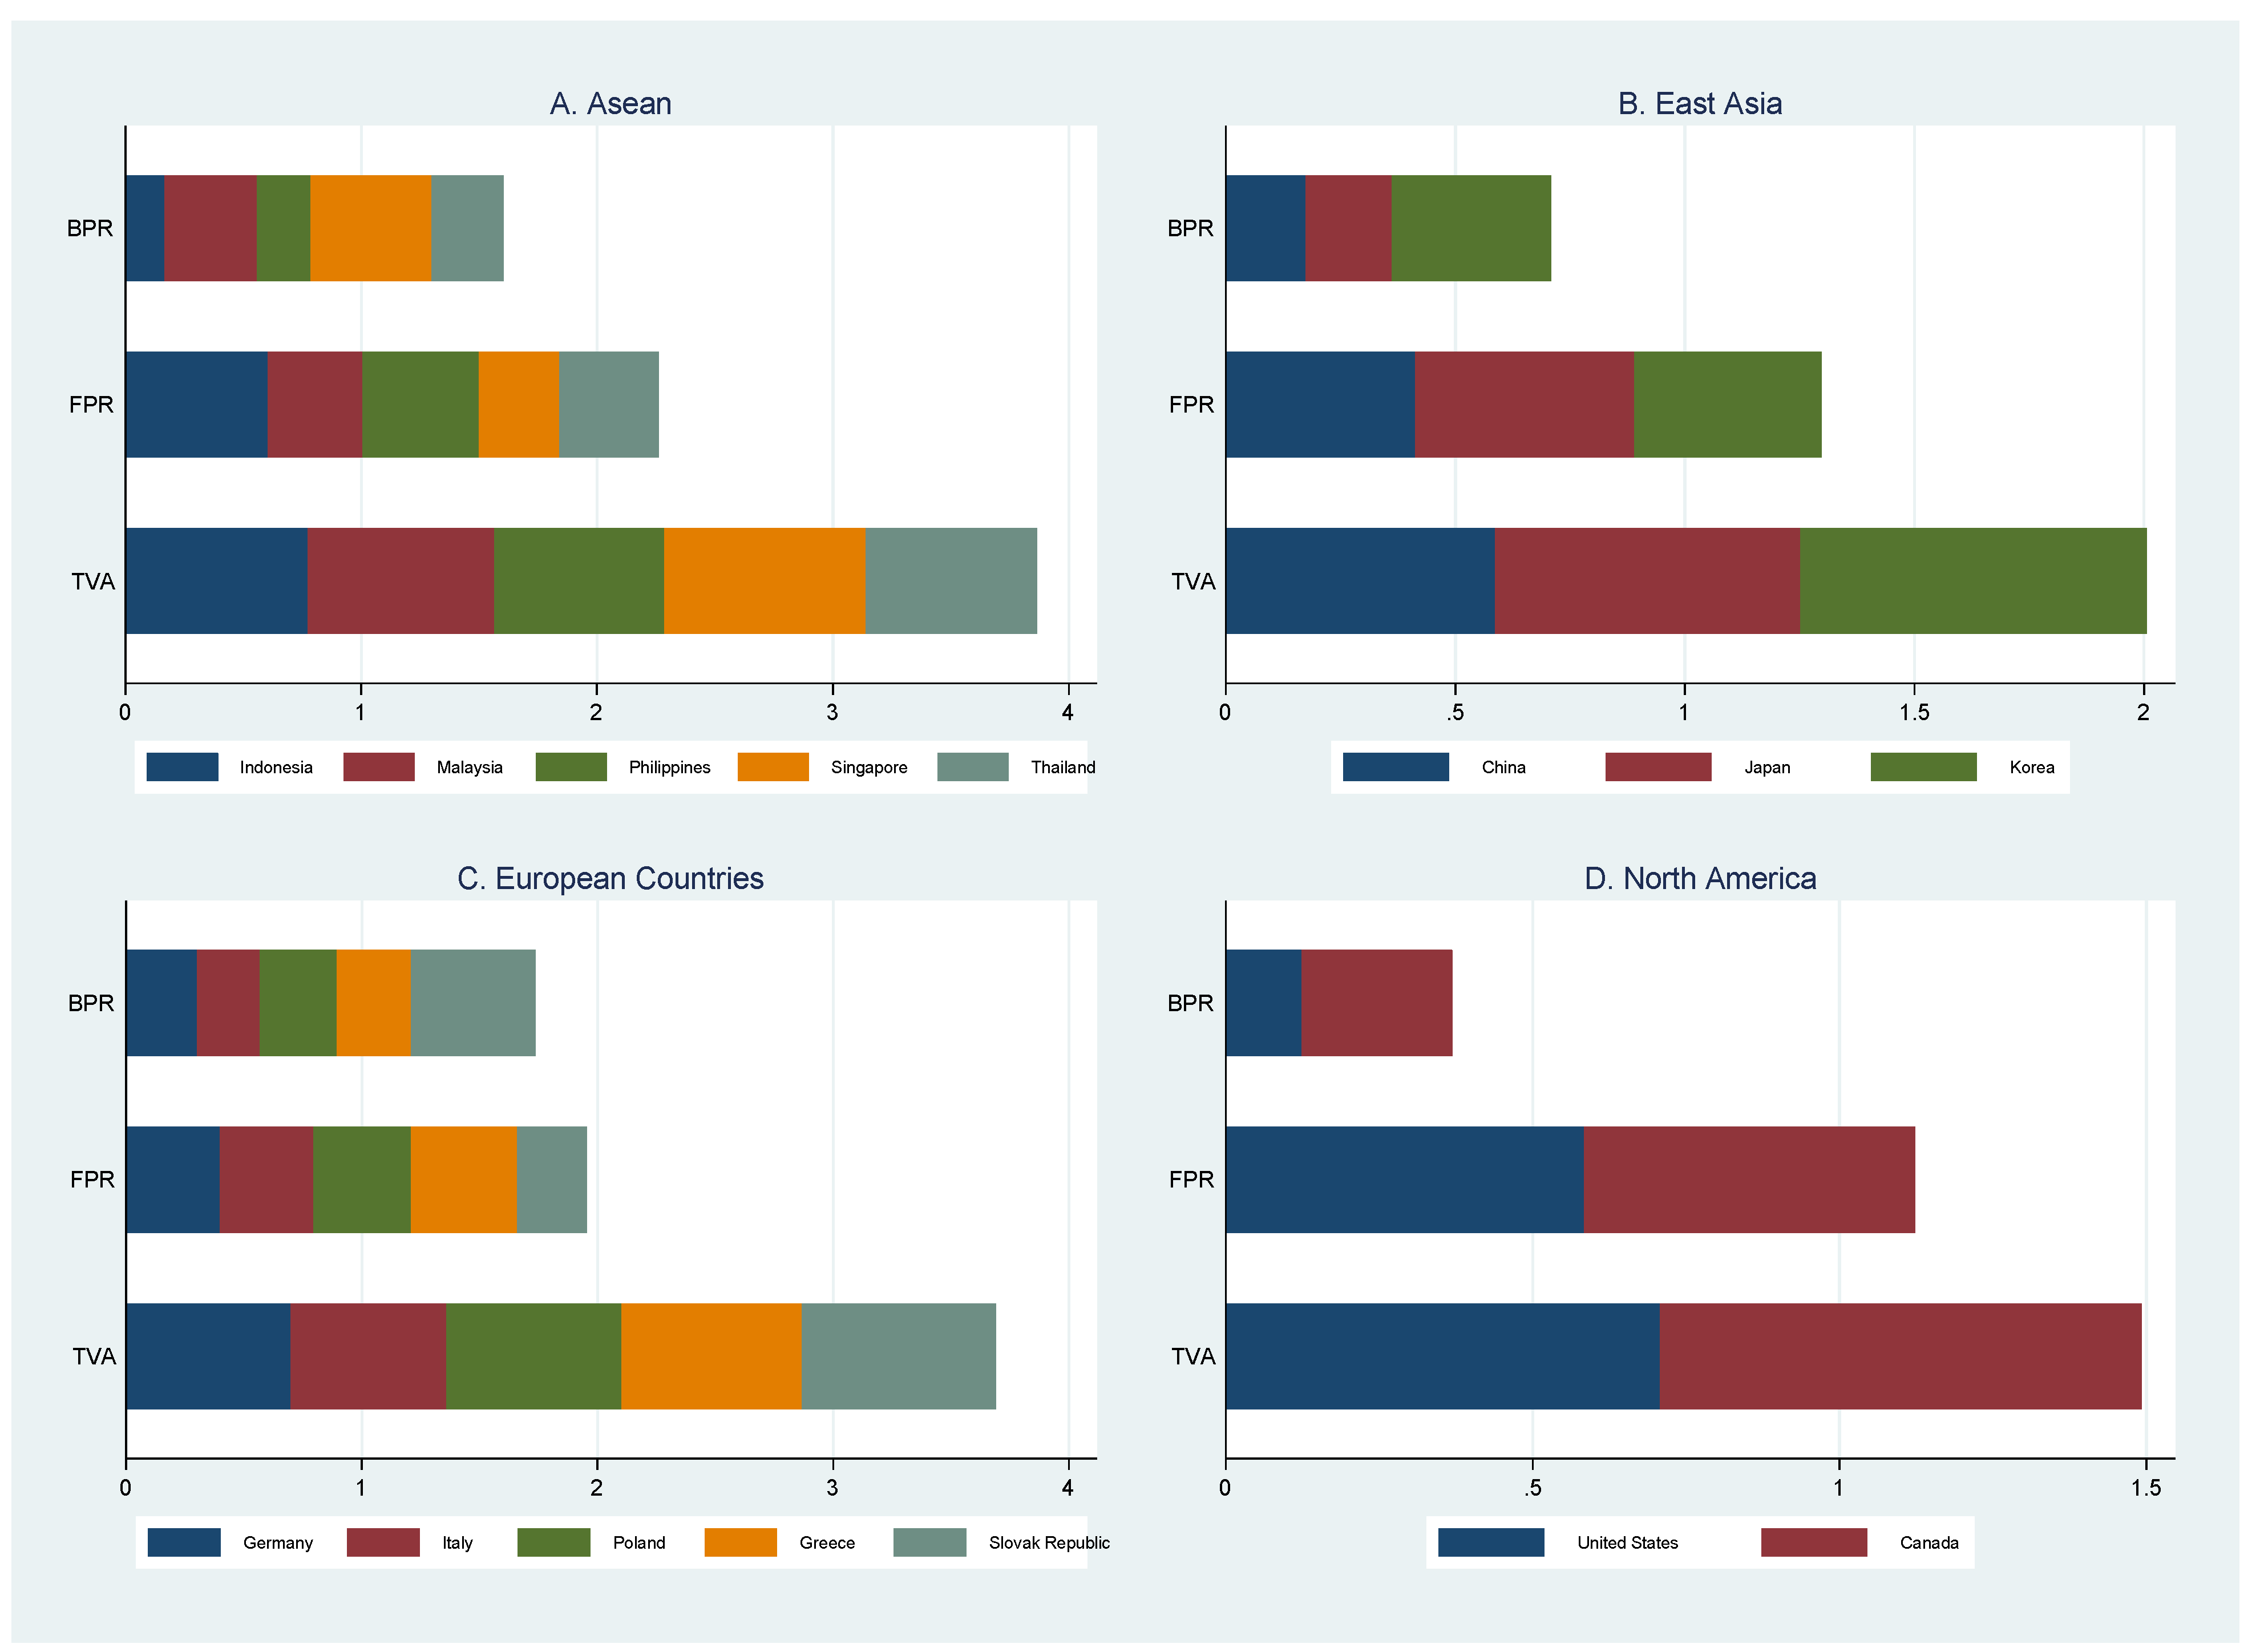
4.3. Value-Added Trade in ASEAN and Developed Countries
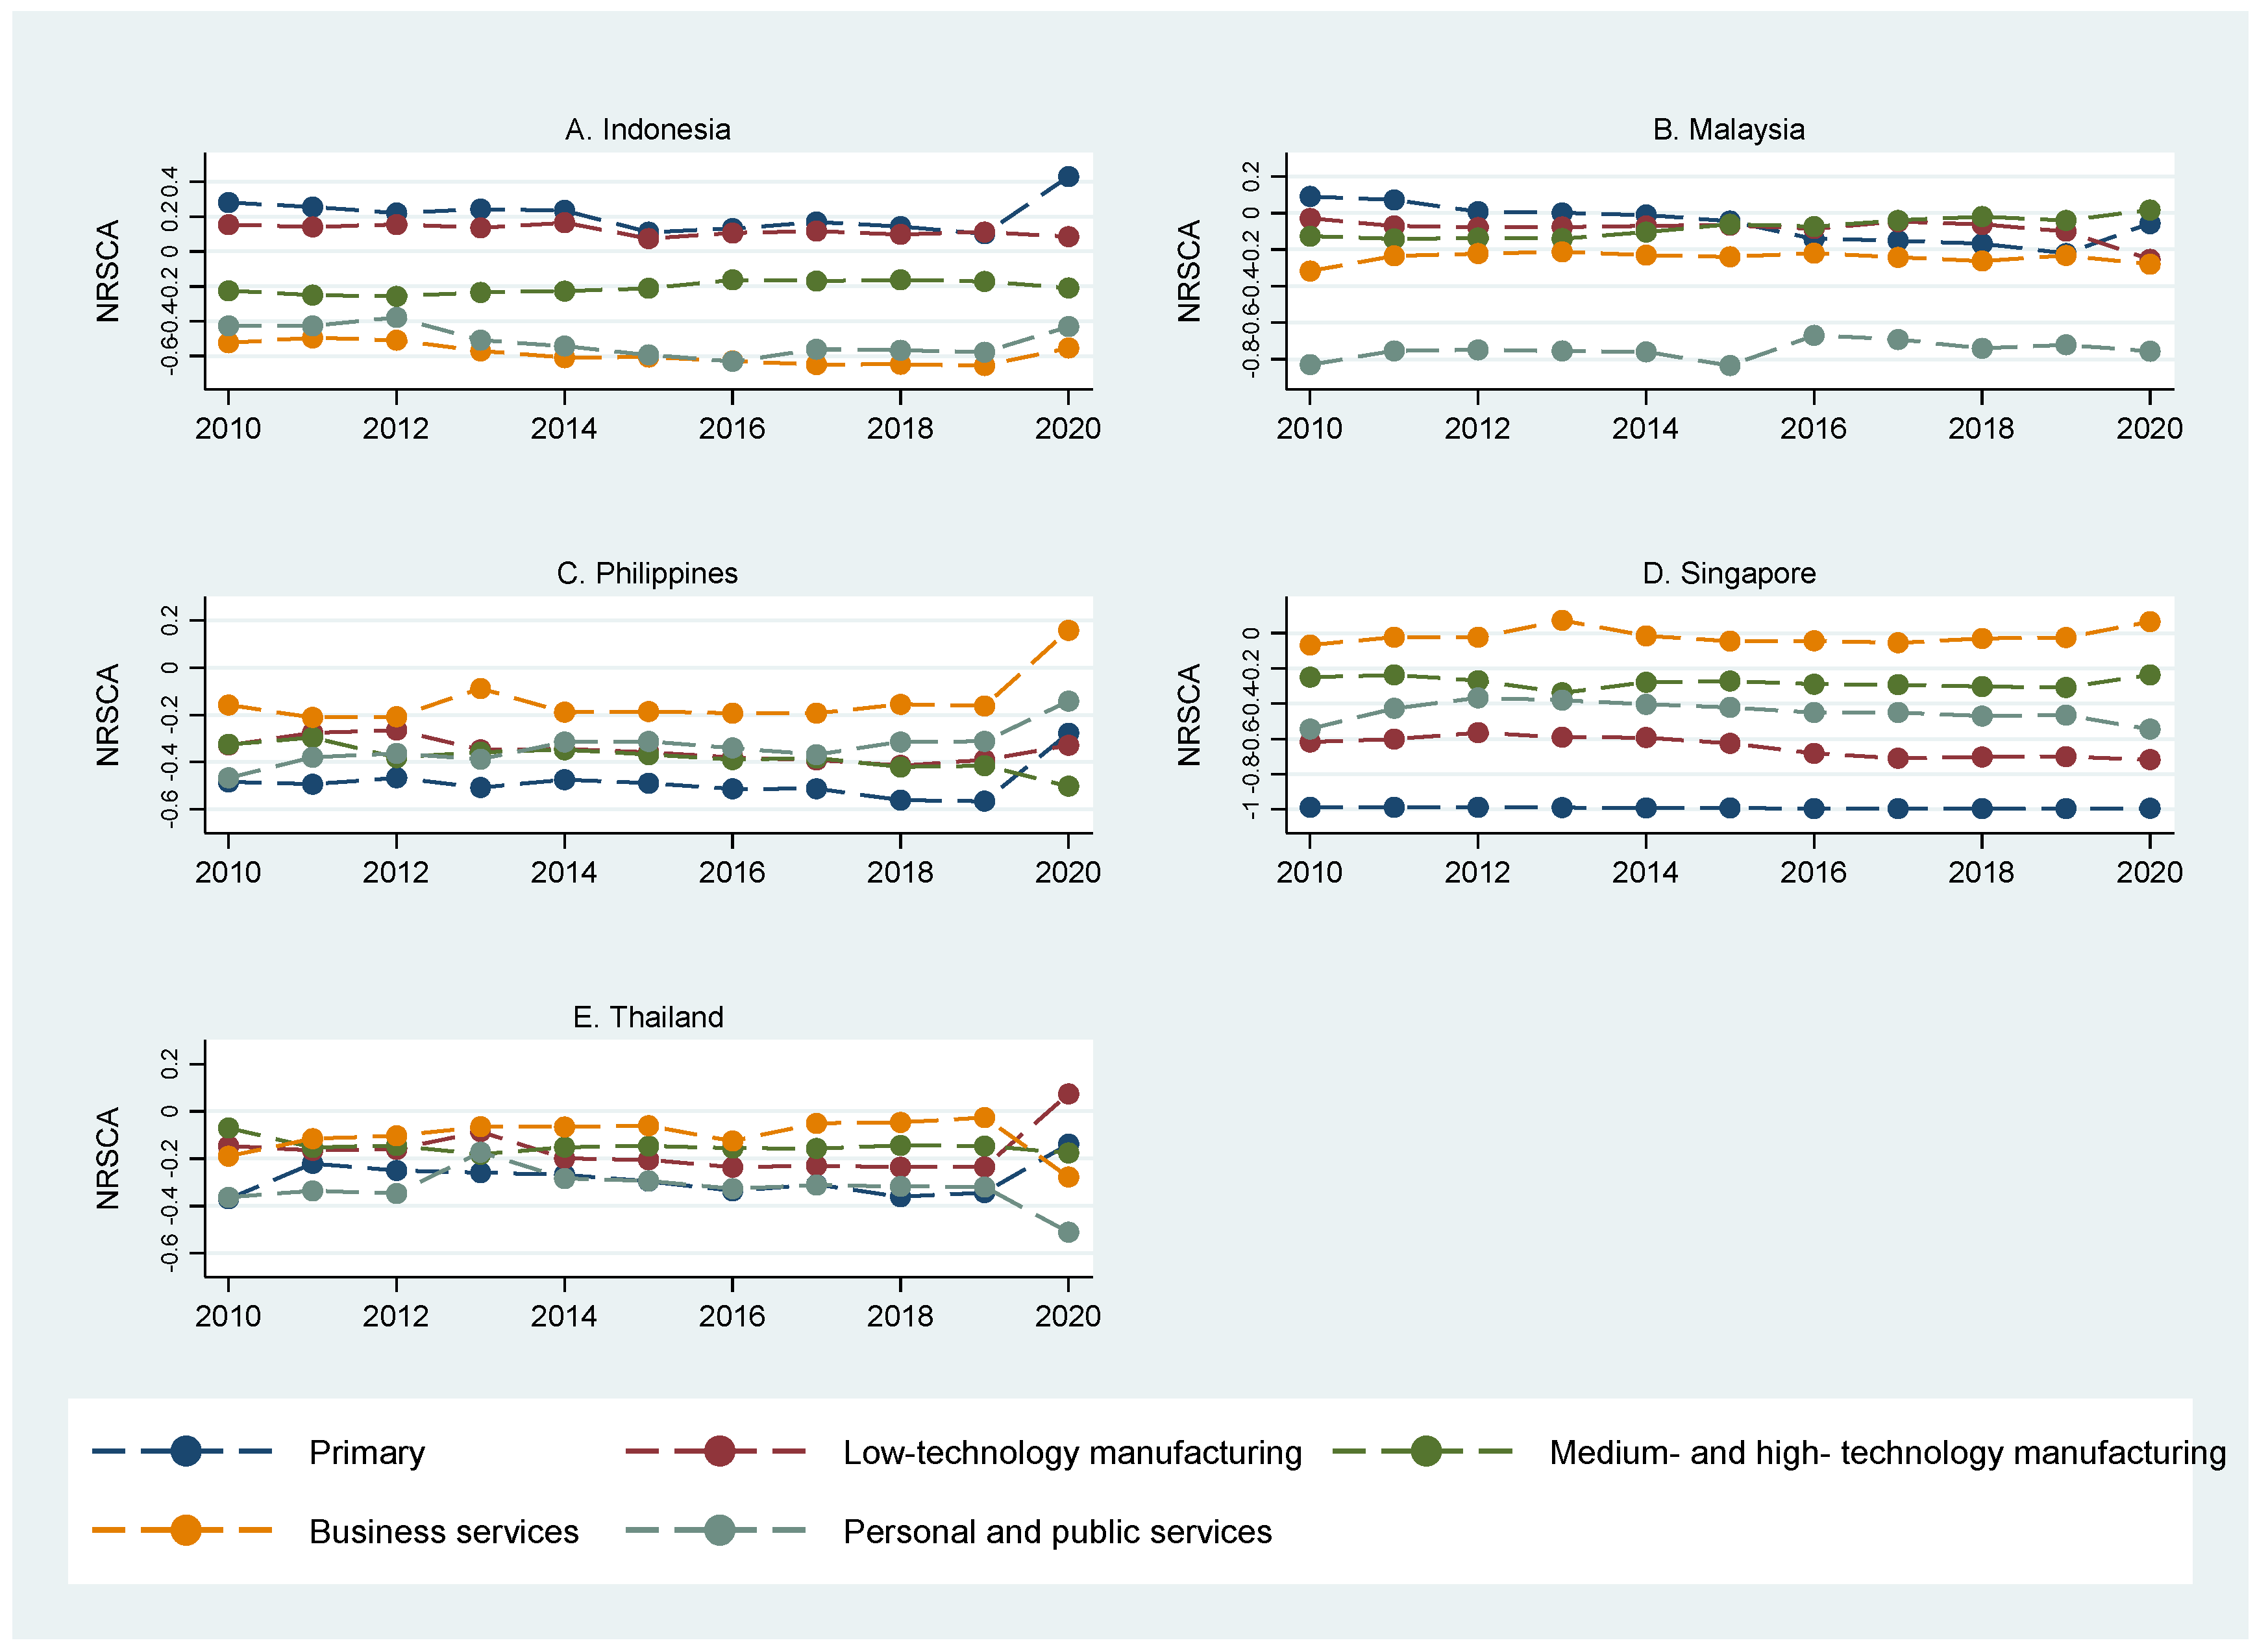
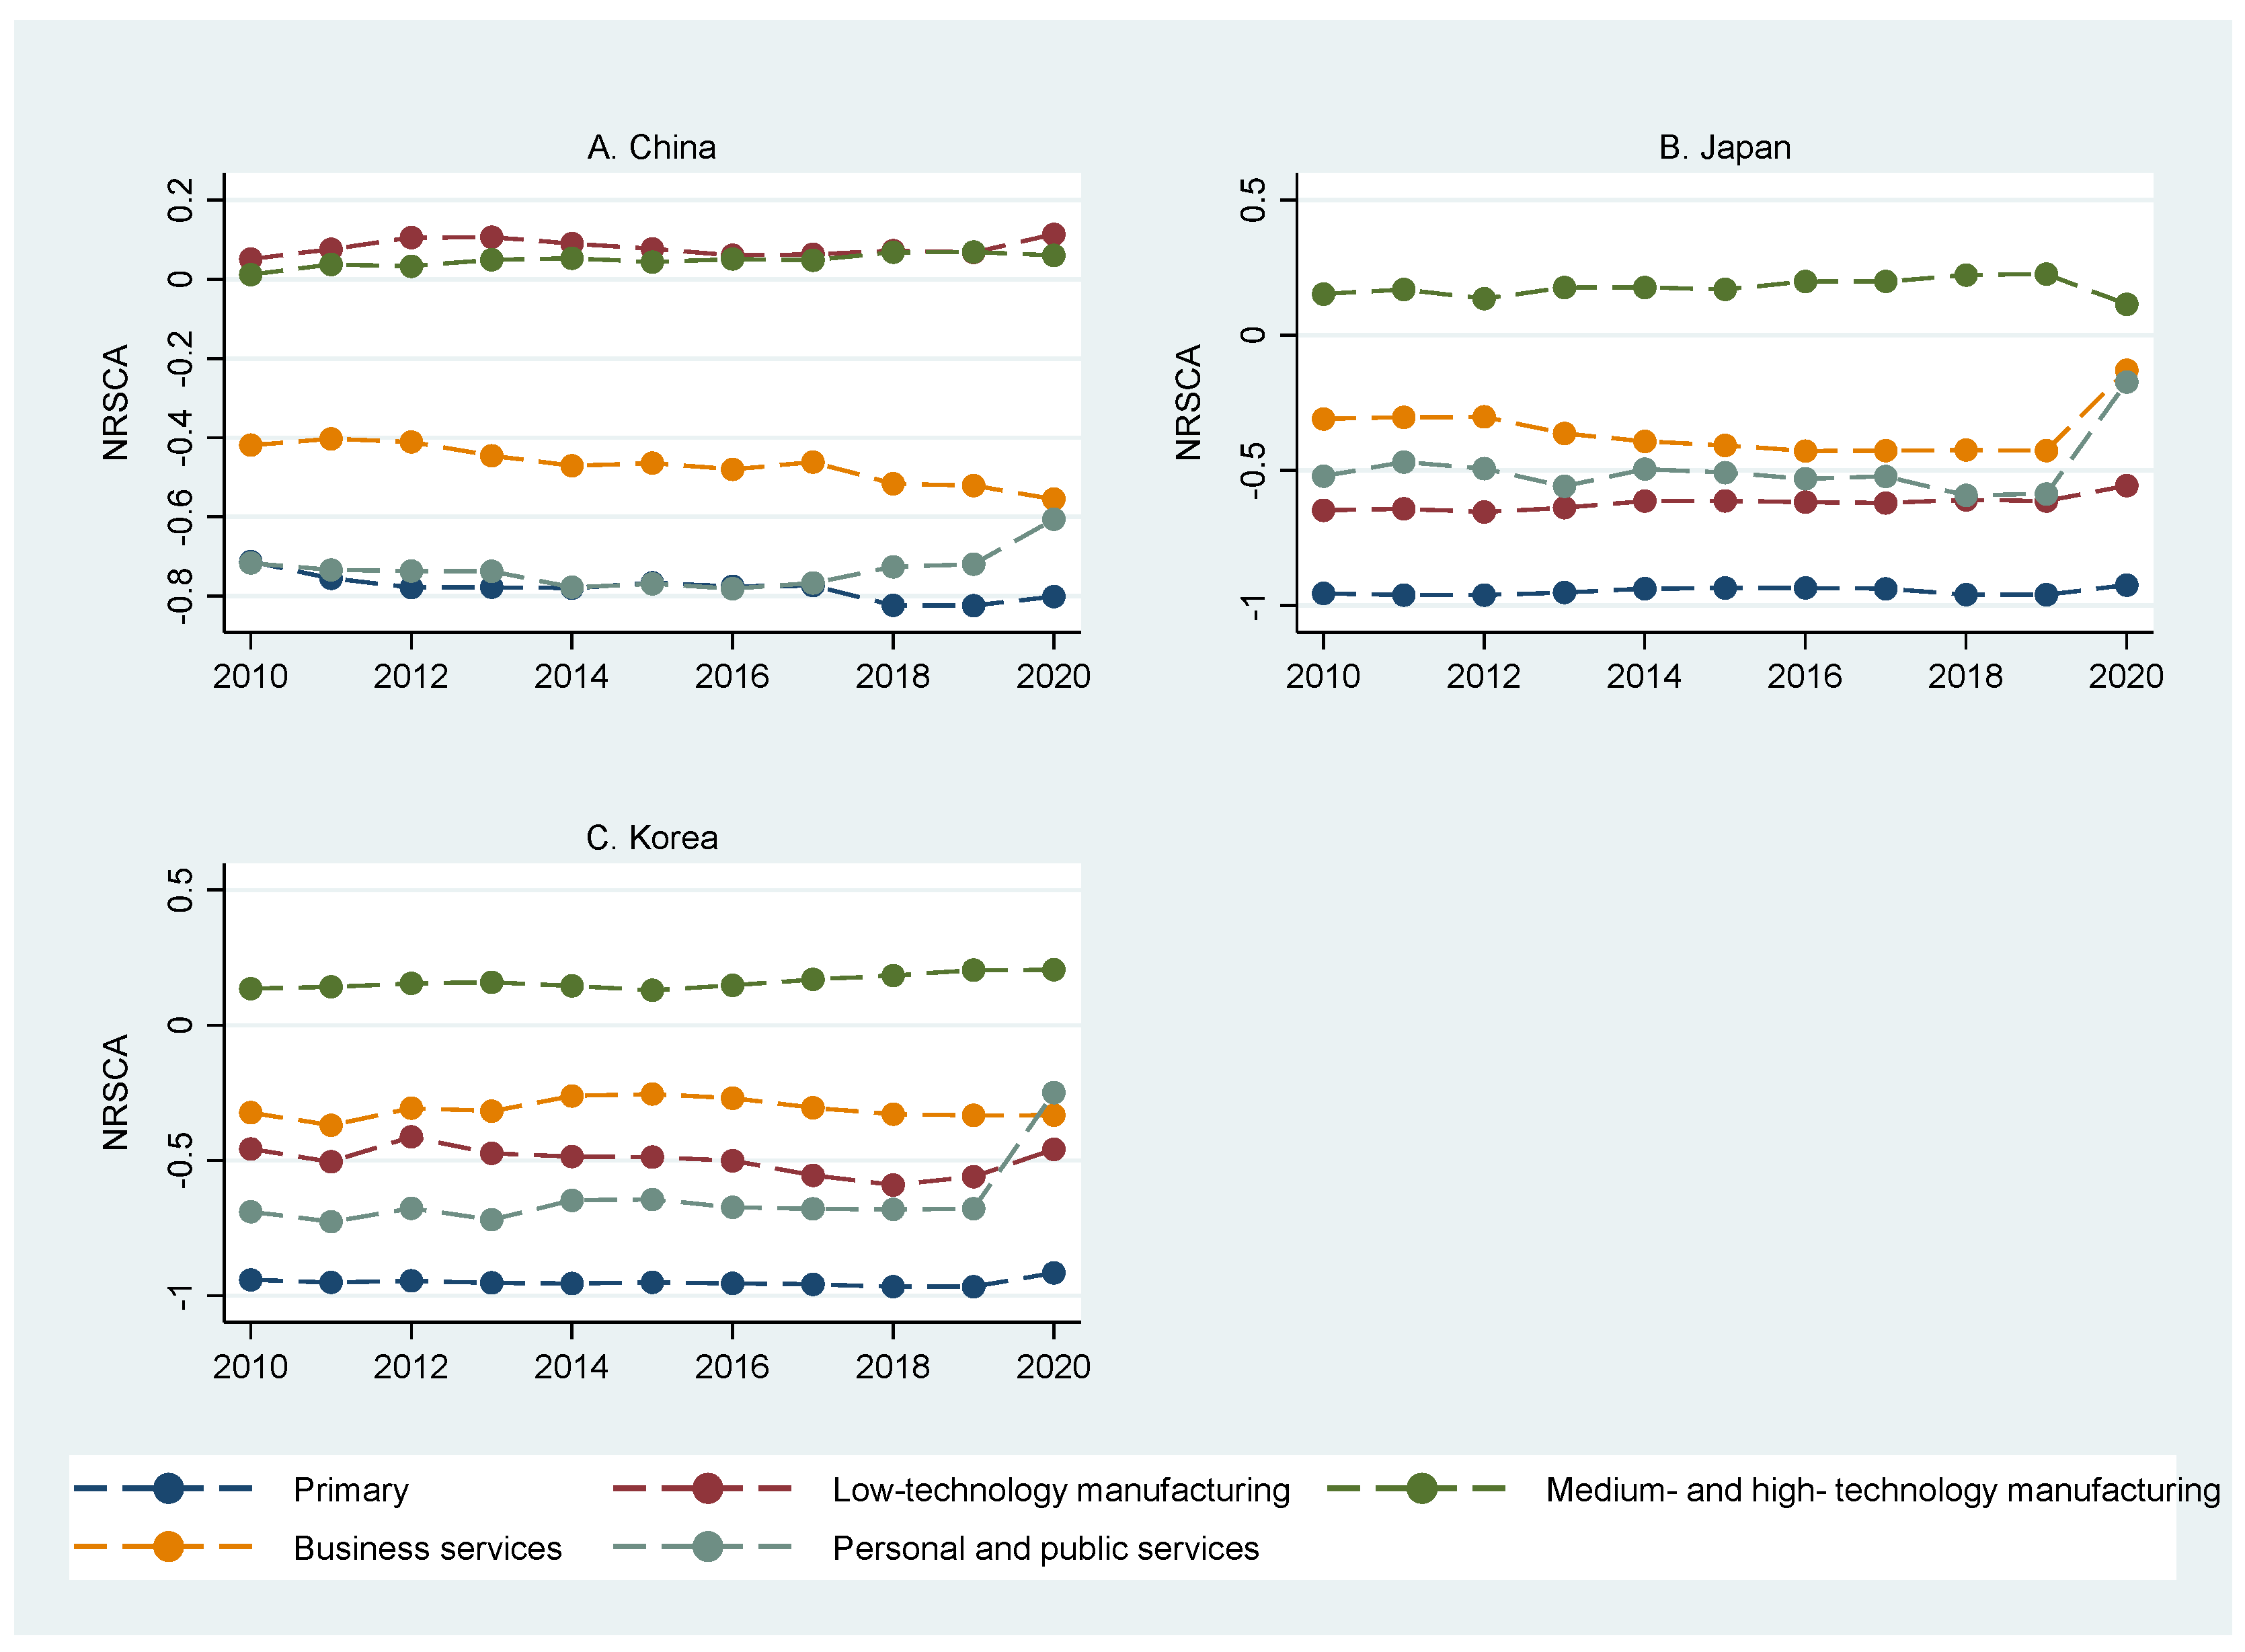
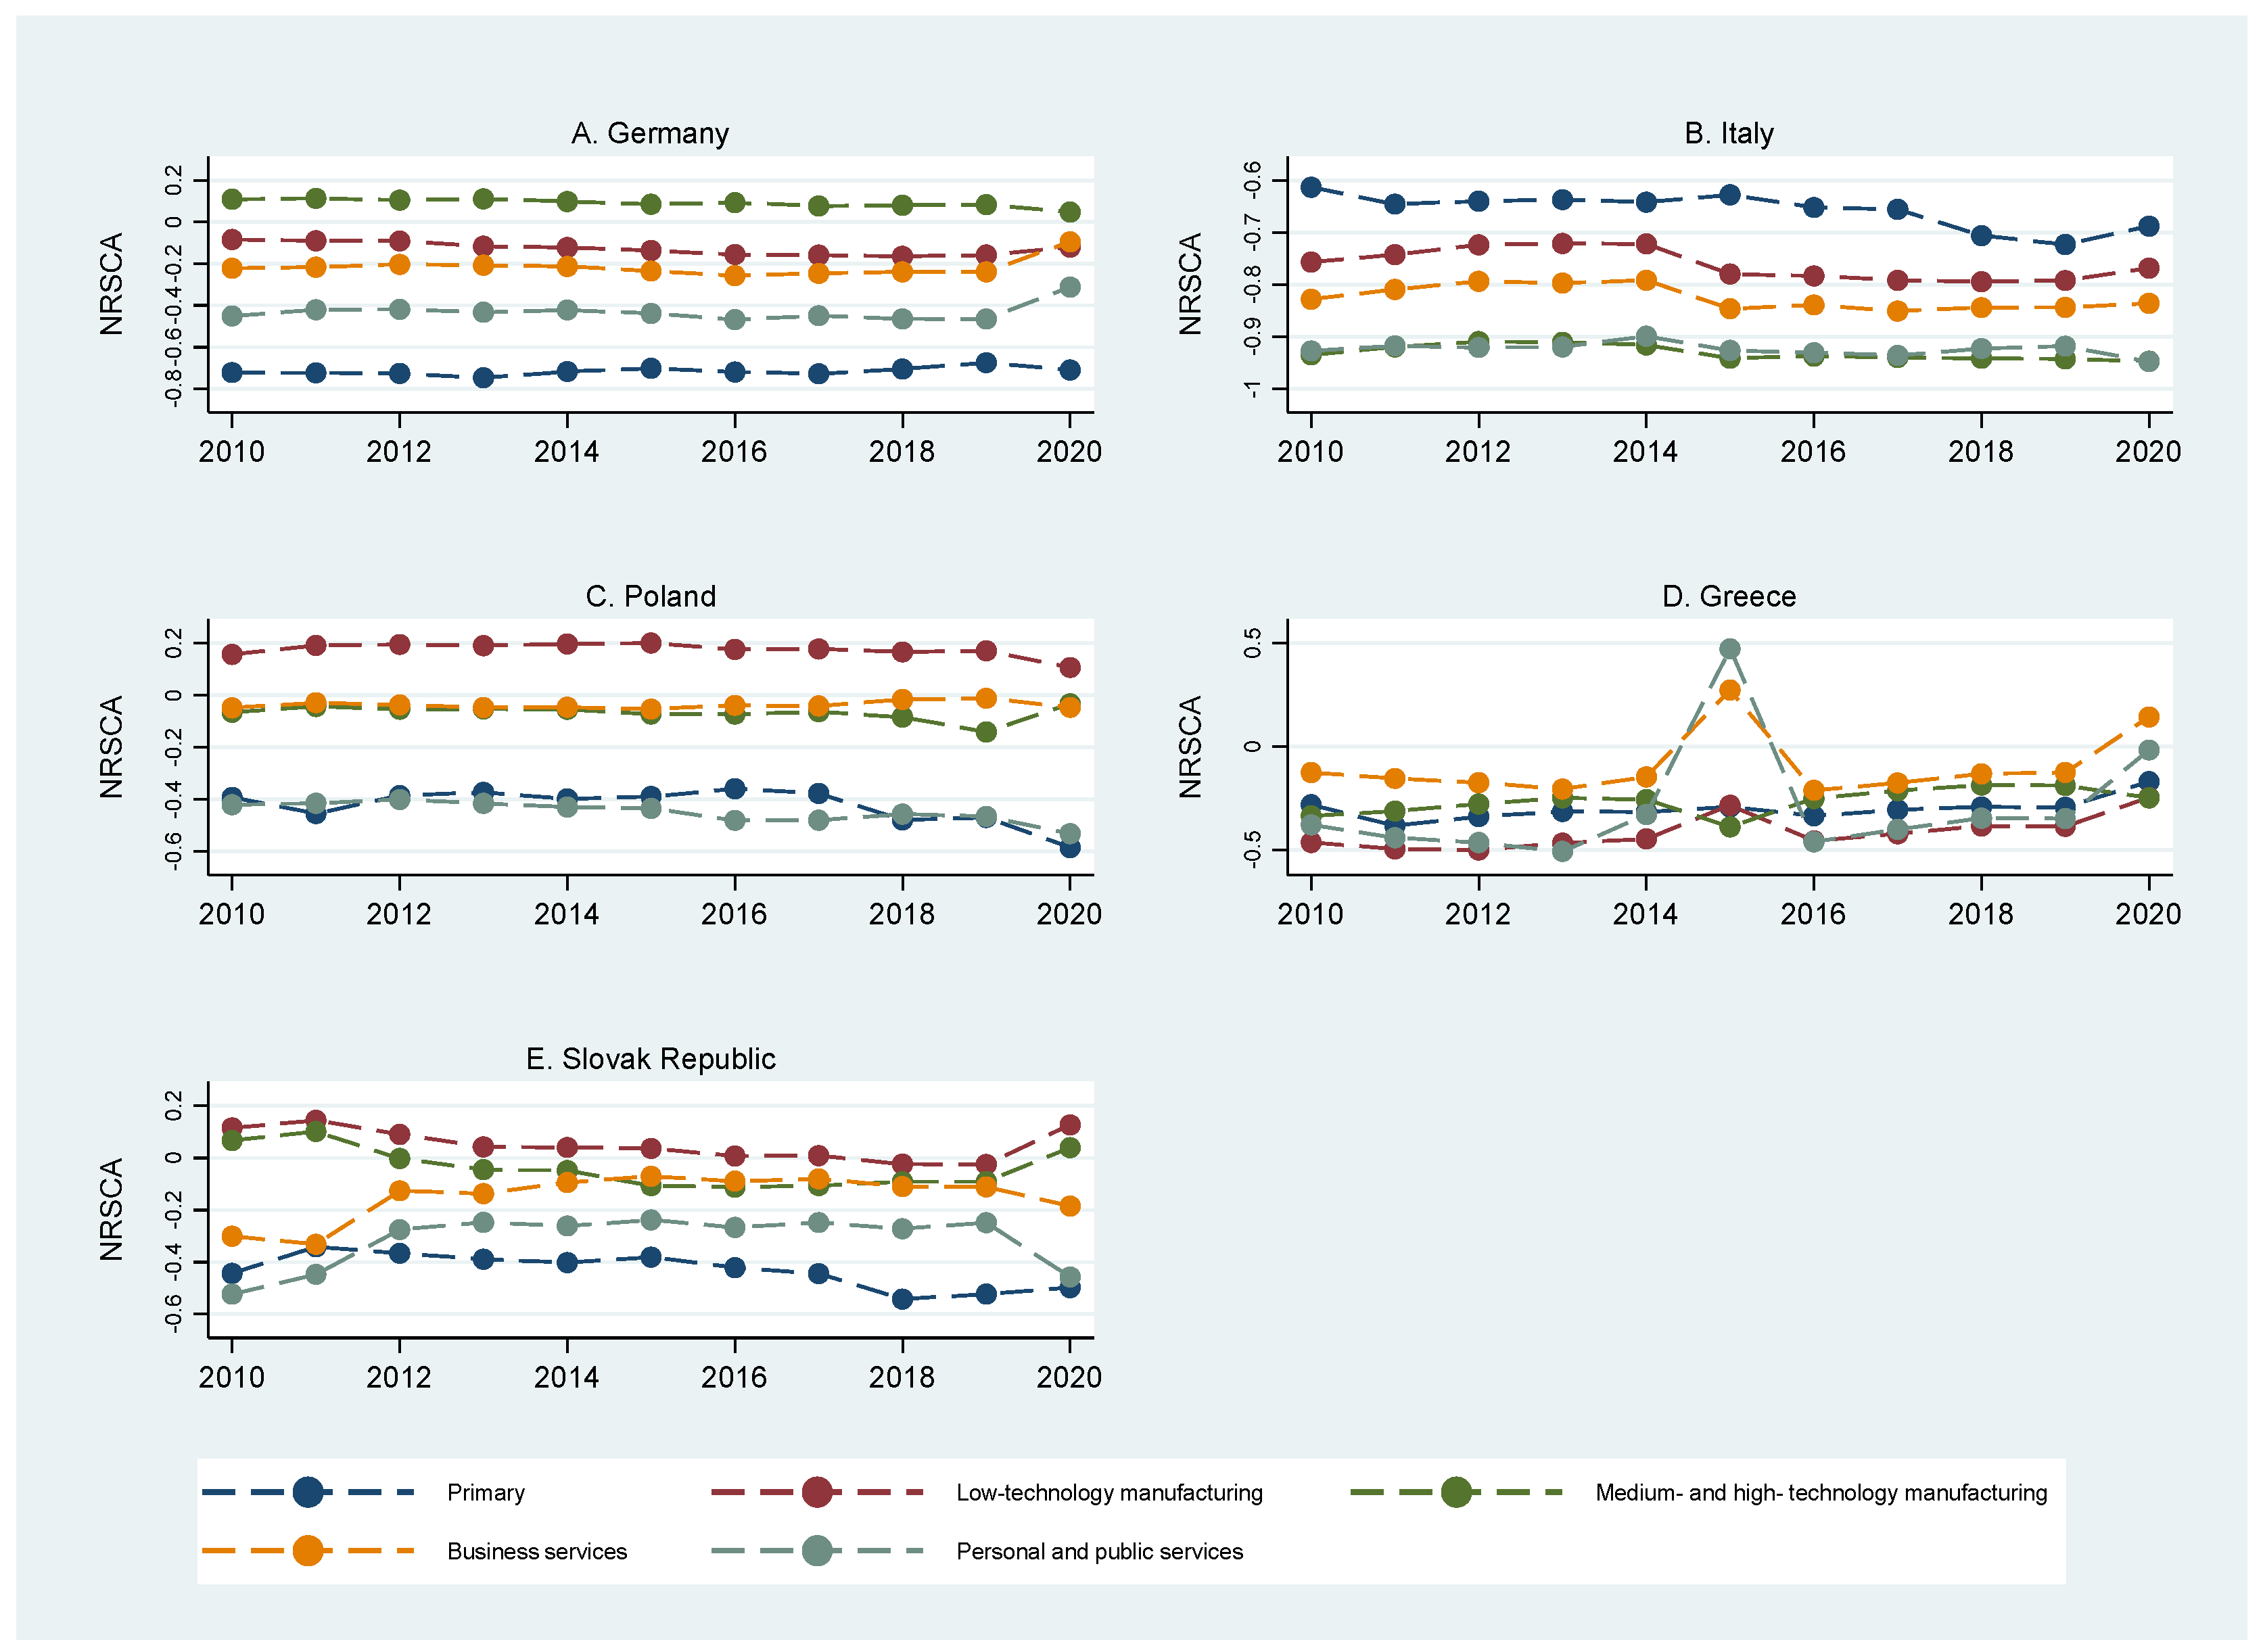
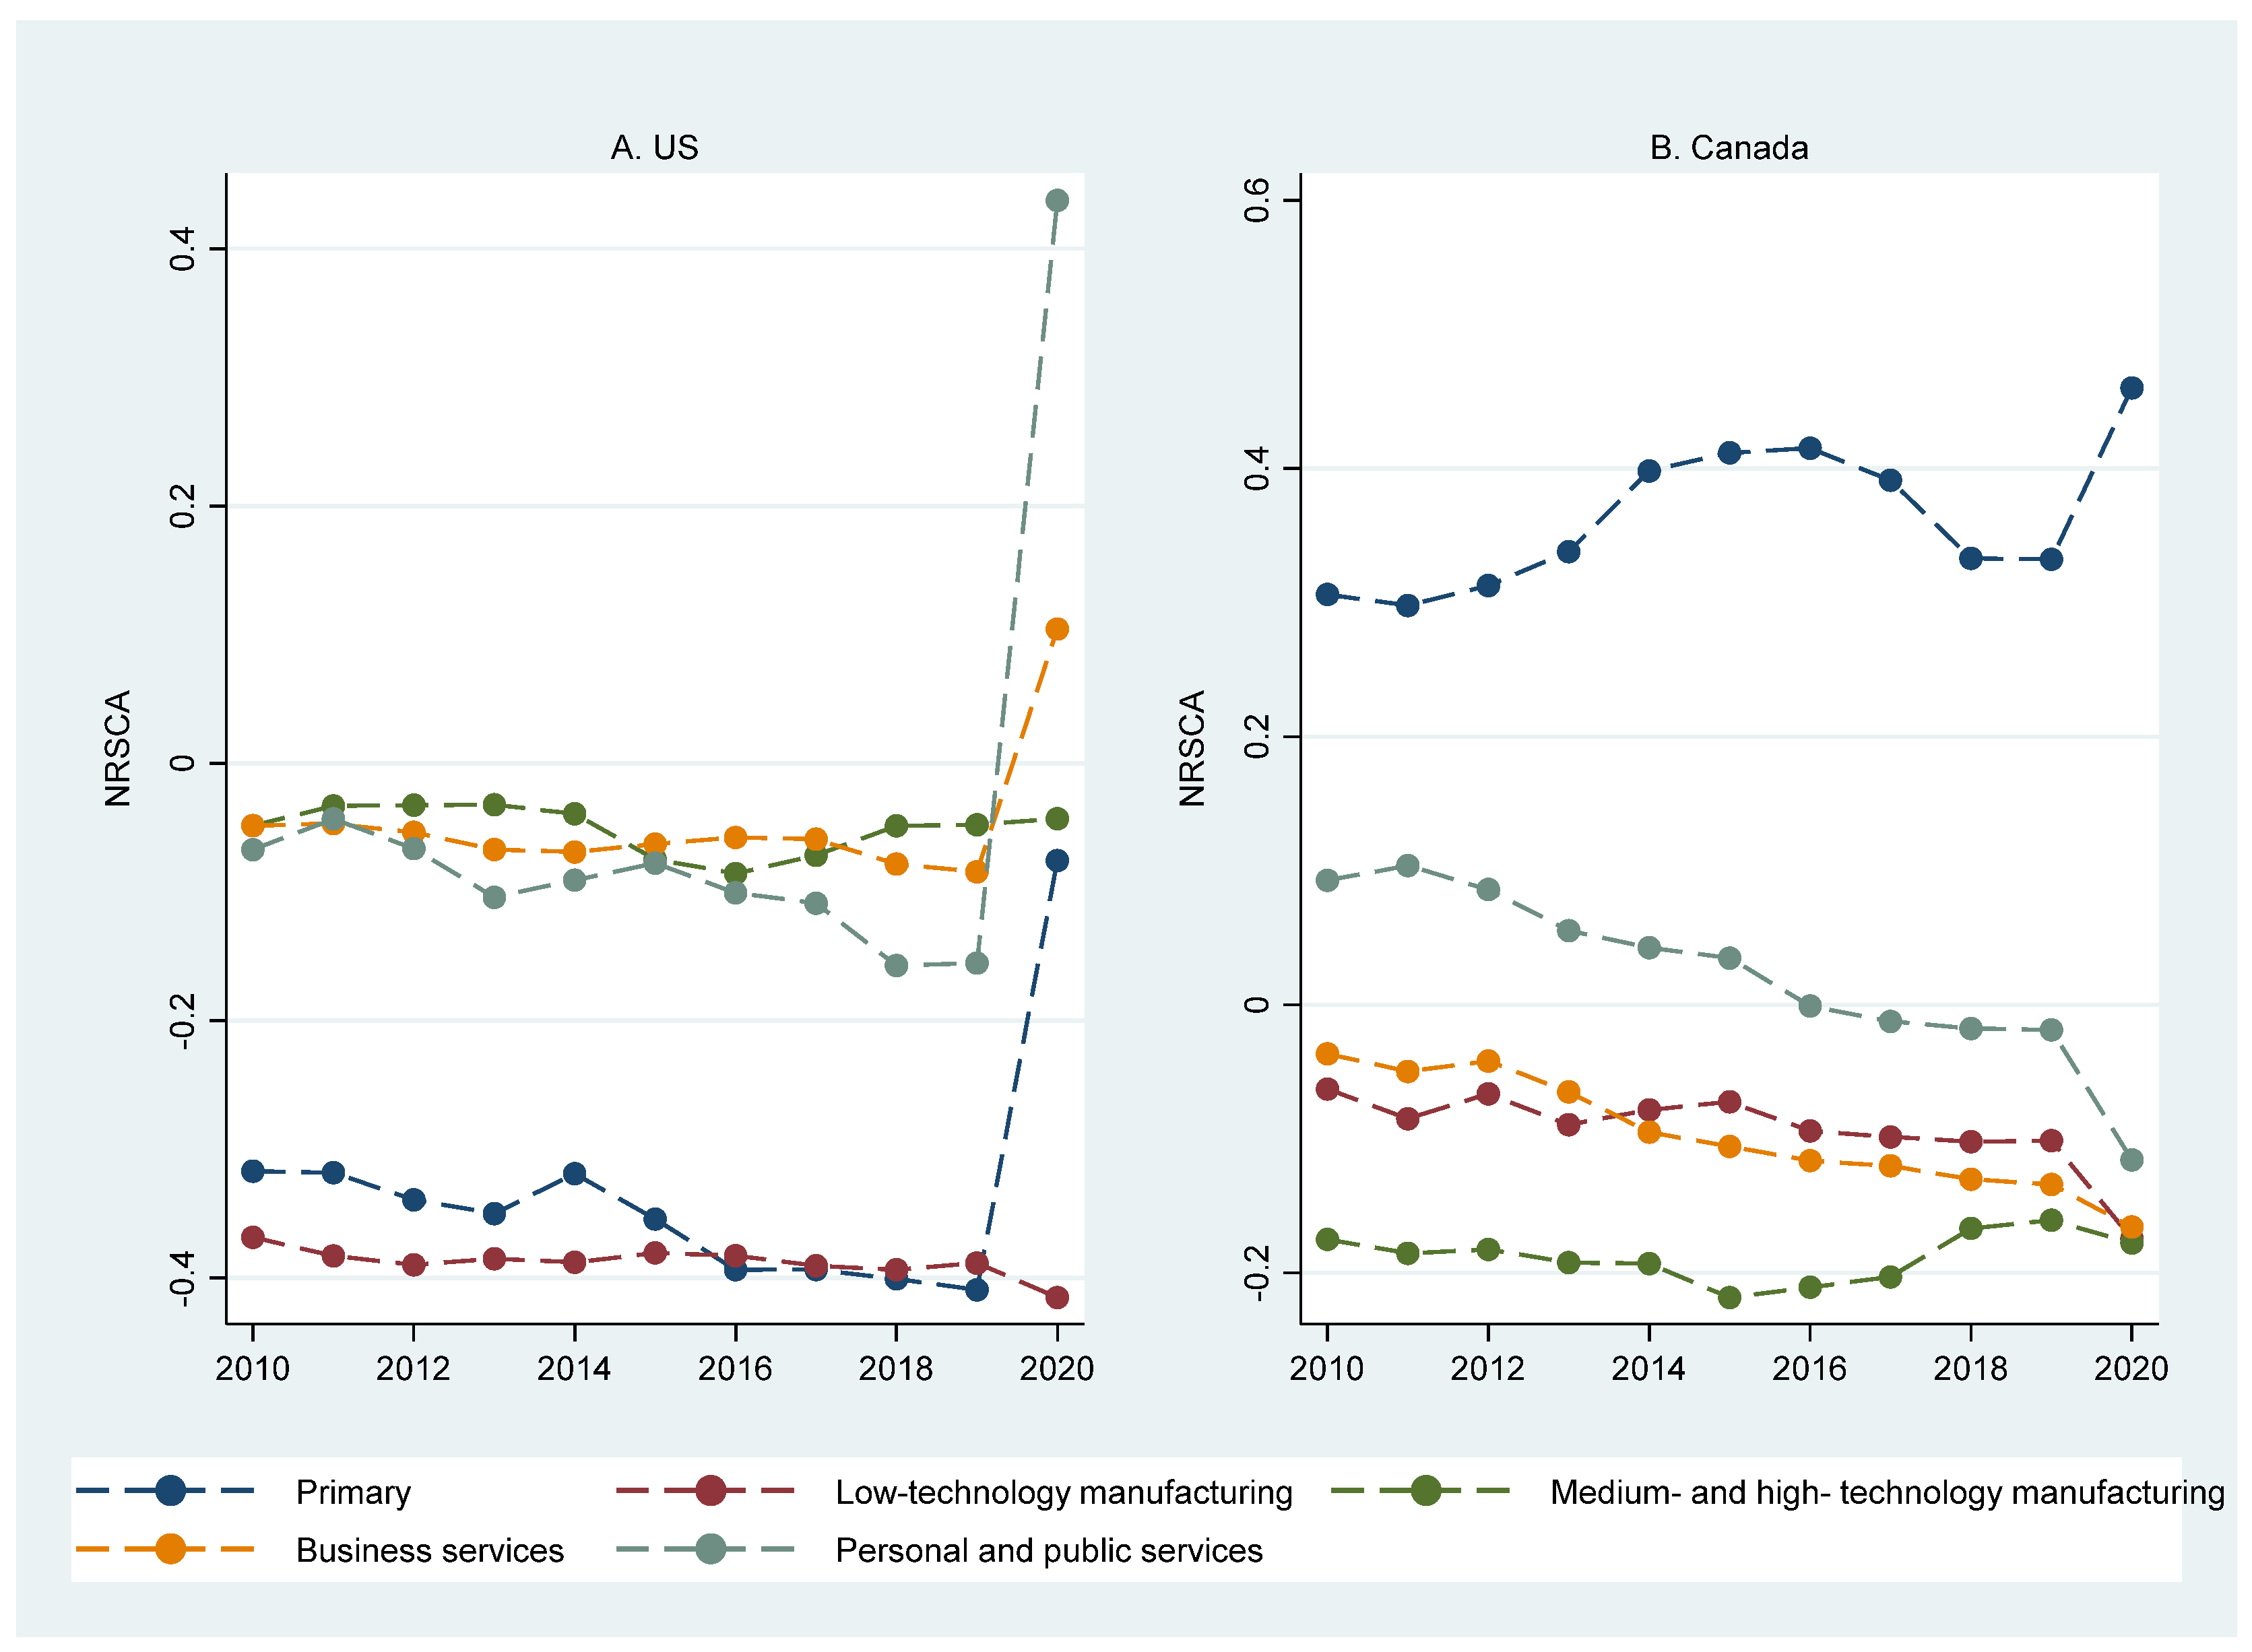
4.4. New Revealed Symmetric Comparative Advantage in ASEAN and Developed Countries
4.5. The System GMM Dynamic Panel Estimation
4.6. Robustness Tests
5. Conclusions
Funding
Institutional Review Board Statement
Informed Consent Statement
Data Availability Statement
Acknowledgments
Conflicts of Interest
Appendix A
| No. | Group | Countries |
|---|---|---|
| 1 | ASEAN | Malaysia, Indonesia, Thailand, Philippines, Singapore, Viet Nam, Brunei Darussalam, Lao PDR, Cambodia |
| 2 | East Asia | Japan, People’s Republic of China, Republic of Korea |
| 3 | EU | Austria, Bulgaria, Belgium, Czech Republic, Cyprus, Germany, Denmark, Spain, Estonia, France, Finland, Greece, Croatia, Hungary, Ireland, Italy, Lithuania, Luxembourg, Malta, Latvia, Netherlands, Poland, Portugal, Romania, Slovenia, Slovak Republic, Sweden |
| 4 | NA | Canada, United States |
References
- Amendolagine, Vito, Andrea F. Presbitero, Roberta Rabellotti, and Marco Sanfilippo. 2019. Local Sourcing in Developing Countries: The Role of Foreign Direct Investments and Global Value Chains. World Development 113: 73–88. [Google Scholar] [CrossRef]
- Arellano, Manuel, and Olympia Bover. 1995. Another Look at the Instrumental Variables Estimation of Error Component Models. Journal of Econometrics 68: 29–51. [Google Scholar] [CrossRef]
- Arellano, Manuel, and Stephen Bond. 1991. Some Tests of Specification for Panel Data: Monte Carlo Evidence and an Application to Employment Equations. Review of Economic Studies 58: 277–97. [Google Scholar] [CrossRef]
- Asian Development Bank. 2015. Global Value Chains Indicators for International Production Sharing. Key Indicators for Asia and the Pacific 2015. Manila: Asian Development Bank. Available online: https://www.adb.org/sites/default/files/publication/175162/gvc.pdf (accessed on 9 March 2022).
- Asian Development Bank. 2019. The Evolution of Indonesia’s Participation in Global Value Chains. Manila: Asian Development Bank. Manila: Asian Development Bank. [Google Scholar] [CrossRef]
- Athukorala, Prema-Chandra, and Nobuaki Yamashita. 2006. Production Fragmentation and Trade Integration: East Asia in Global Context. North American Journal of Economics and Finance 17: 233–56. [Google Scholar] [CrossRef]
- Ayadi, Rym, Giorgia Giovannetti, Enrico Marvasi, Giulio Vannelli, and Chahir Zaki. 2021. Demand and Supply Exposure through Global Value Chains: Euro-Mediterranean Countries during COVID. The World Economy 45: 637–56. Available online: https://onlinelibrary.wiley.com/doi/epdf/10.1111/twec.13156 (accessed on 1 July 2023). [CrossRef] [PubMed]
- Balassa, Bela. 1965. Trade Liberalisation and ‘Revealed’ Comparative Advantage. The Manchester School 33: 99–123. [Google Scholar] [CrossRef]
- Baldwin, Richard E., and Beatrice W. di Mauro, eds. 2020. Economics in the Time of COVID-19. A VoxEU.org eBook. London: CEPR Press. Available online: https://voxeu.org/article/economics-time-covid-19-new-ebook (accessed on 2 April 2023).
- Baltagi, Badi H. 2005. Econometric Analysis of Panel Data. Hoboken: John Wiley & Sons Ltd. [Google Scholar]
- Blundell, Richard, and Stephen Bond. 1998. Initial Conditions and Moment Restrictions in Dynamic Panel Data Models. Journal of Econometrics 87: 115–43. Available online: https://www.ucl.ac.uk/~uctp39a/Blundell-Bond-1998.pdf (accessed on 15 June 2022).
- Borin, Alessandro, and Michele Mancini. 2019. Measuring What Matters in Global Value Chains and Value-Added Trade. WPS 8804. Available online: http://hdl.handle.net/10986/31533 (accessed on 30 November 2022).
- Brakman, Steven, and Charles Van Marrewijk. 2017. A Closer Look at Revealed Comparative Advantage: Gross-versus Value-Added Trade Flows. Papers in Regional Science 96: 61–92. [Google Scholar] [CrossRef]
- Burlina, Chiara, and Eleonora Di Maria. 2020. Manufacturing and Value-Added Dynamics in Global Value Chains: The Case of Italy. Competitiveness Review 30: 457–70. [Google Scholar] [CrossRef]
- Ceglowski, Janet. 2017. Assessing Export Competitiveness through the Lens of Value Added. World Economy 40: 275–96. [Google Scholar] [CrossRef]
- Chen, Ji-Ming, and Yi-Qing Chen. 2022. China Can Prepare to End Its Zero-COVID Policy. Nature Medicine 28: 1104–1105. [Google Scholar] [CrossRef]
- Elsalih, Osama, Kamil Sertoglu, and Mustafa Besim. 2021. Determinants of Comparative Advantage of Crude Oil Production: Evidence from OPEC and Non-OPEC Countries. International Journal of Finance and Economics 26: 3972–83. [Google Scholar] [CrossRef]
- Espitia, Alvaro, Aaditya Mattoo, Nadia Rocha, Michele Ruta, and Deborah Winkler. 2022. Pandemic Trade: COVID-19, Remote Work and Global Value Chains. World Economy 45: 561–89. [Google Scholar] [CrossRef]
- Faheem Ur, Rehman, Islam Md. Monirul, and Kazi Sohag. 2024. Does Infrastructural Development Allure Foreign Direct Investment? The Role of Belt and Road Initiatives. International Journal of Emerging Markets 19: 1026–50. [Google Scholar] [CrossRef]
- Fan, Zhaobin, Sajid Anwar, and Ying Zhou. 2023. Centralization of Trade Agreements Network and Global Value Chain Participation. Quarterly Review of Economics and Finance 94: 11–24. [Google Scholar] [CrossRef]
- Gereffi, Gary, John Humphrey, and Timothy Sturgeon. 2005. The Governance of Global Value Chains. Review of International Political Economy 12: 78–104. [Google Scholar] [CrossRef]
- Ghuzini, Diny, Josephine Wuri, and Kuntari Dasih. 2020. Structural Shocks and Macroeconomic Conditions in Indonesia. Journal of Applied Economic Sciences XV: 488–506. Available online: https://www.ceeol.com/search/article-detail?id=894712 (accessed on 25 June 2024).
- González, Javier Lopez, and Przemyslaw Kowalski. 2017. Global Value Chain Participation in Southeast Asia: Trade and Related Policy Implications. In Production Networks in Southeast Asia. Edited by Lili Yan Ing and Fukunari Kimura. New York: Routledge. [Google Scholar]
- Hao, Yu, Hua Liao, and Yi-Ming Wei. 2015. Is China’s Carbon Reduction Target Allocation Reasonable? An Analysis Based on Carbon Intensity Convergence. Applied Energy 142: 229–39. [Google Scholar] [CrossRef]
- Hayakawa, Kazunobu, and Hiroshi Mukunoki. 2021. Impacts of COVID-19 on Global Value Chains. Developing Economies 59: 154–77. [Google Scholar] [CrossRef]
- Hubbard, R. Glenn, Anthony P. O’Brien, Matthew Rafferty, and Robert J. Gordon. 2014. Macroeconomics. London: Pearson Education Limited. [Google Scholar]
- Hummels, David, Jun Ishii, and Kei-Mu Yi. 2001. The Nature and Growth of Vertical Specialization in World Trade. Journal of International Economics 54: 75–96. [Google Scholar] [CrossRef]
- Ing, Lili Yan, and Fukunari Kimura, eds. 2017a. Production Networks in Southeast Asia. Economic Research Institute for ASEAN and East Asia. New York: Routledge, Taylor and Francis Group. Available online: https://www.eria.org/publications/production-networks-in-southeast-asia/ (accessed on 24 September 2022).
- Ing, Lili Yan, and Fukunari Kimura, eds. 2017b. Global Value Chain Participation in Southeast Asia: Trade and Related Policy Implications. In Production Networks in Southeast Asia. New York: Routledge. [Google Scholar]
- Inomata, Sitoshi. 2013. Trade in Value Added: An East Asian Perspective. ADBI Working Paper Series; Tokyo: Asian Development Bank Institute. [Google Scholar] [CrossRef]
- Ito, Tadashi, Lorenzo Rotunno, and Pierre Louis Vézina. 2017. Heckscher–Ohlin: Evidence from Virtual Trade in Value Added. Review of International Economics 25: 427–46. [Google Scholar] [CrossRef]
- Johnson, Robert C., and Guillermo Noguera. 2012. Accounting for Intermediates: Production Sharing and Trade in Value Added. Journal of International Economics 86: 224–36. [Google Scholar] [CrossRef]
- Johnson, Robert C., and Guillermo Noguera. 2017. A Portrait of Trade in Value-Added over Four Decades. Review of Economics and Statistics 99: 896–911. [Google Scholar] [CrossRef]
- Kaufmann, Daniel, Aart Kraay, and Massimo Mastruzzi. 2010. The Worldwide Governance Indicators: Methodology and Analytical Issues. Hague Journal on the Rule of Law 3: 220–46. [Google Scholar] [CrossRef]
- Kazunobu, Hayakawa, and Mukunoki Hiroshi. 2020. Impacts of COVID-19 on Global Value Chains. Institute of Developing Economies (IDE) Discussion Papers 791. Available online: https://ir.ide.go.jp/?action=pages_view_main&active_action=repository_view_main_item_detail&item_id=51871&item_no=1&page_id=39&block_id=158 (accessed on 15 January 2023).
- Kee, Hiau Looi, and Heiwai Tang. 2016. Domestic Value Added in Exports: Theory and Firm Evidence from China. American Economic Review 106: 1402–36. [Google Scholar] [CrossRef]
- Koopman, Robert, Zhi Wang, and Shang-Jin Wei. 2014. Tracing Value-Added and Double Counting in Gross Exports. Amrican Economic Review 104: 459–94. [Google Scholar] [CrossRef]
- Laursen, Keld. 2015. Revealed Comparative Advantage and the Alternatives as Measures of International Specialization. Eurasian Business Review 5: 99–115. [Google Scholar] [CrossRef]
- Leontief, Wassily W. 1936. Quantitative Input and Output Relations in the Economic System of the United States. Review of Economics and Statistics 18: 105–25. Available online: https://orion.math.iastate.edu/driessel/15Models/1936_Input_Output.pdf (accessed on 15 August 2022). [CrossRef]
- Leromain, Elsa, and Gianluca Orifice. 2014. New Revealed Comparative Advantage Index: Dataset and Empirical Distribution. International Economics 139: 48–70. [Google Scholar] [CrossRef]
- Levchenko, Andrei A. 2007. Institutional Quality and International Trade. Review of Economic Studies 74: 791–819. [Google Scholar] [CrossRef]
- Liu, Xuepeng, Aaditya Mattoo, Zhi Wang, and Shang-Jin Wei. 2020. Services Development and Comparative Advantage in Manufacturing. Journal of Development Economics 144: 102438. [Google Scholar] [CrossRef]
- Lofrano, Giusy, Sureyya Meriç, Gülsüm Emel Zengin, and Derin Orhon. 2013. Chemical and Biological Treatment Technologies for Leather Tannery Chemicals and Wastewaters: A Review. Science of the Total Environment 461–62: 265–81. [Google Scholar] [CrossRef]
- Marcato, Marilia, Carolina Baltar, and Fernando Sarti. 2019. International Competitiveness in a Vertically Fragmented Production Structure: Empirical Challenges and Evidence. Economics Bulletin 39: 876–93. Available online: https://ideas.repec.org/a/ebl/ecbull/eb-18-00788.html (accessed on 5 September 2023).
- Mouanda, Gilhaimé M., and Jiong Gong. 2019. Determinants of Global Value Chains Participation for Landlocked Countries. International Journal of Social Science and Economic Research 4: 3265–94. Available online: https://ijsser.org/files_2019/ijsser_04__246.pdf (accessed on 25 June 2023).
- Natsuda, Kaoru, Noriyuki Segawa, and John Thoburn. 2013. Liberalization, Industrial Nationalism, and the Malaysian Automotive Industry. Global Economic Review 42: 113–34. Available online: https://www.tandfonline.com/doi/abs/10.1080/1226508X.2013.791475 (accessed on 8 September 2023). [CrossRef]
- Parobek, Jan, Hubert Paluš, Martina Kalamarova, Erika Loučanova, Anna Križanova, and Katarina Repkova Štofkova. 2016. Comparative Analysis of Wood and Semi-Finished Wood Product Trade of Slovakia and Its Central European Trading Partners. Drewno 59: 183–94. [Google Scholar] [CrossRef]
- Pata, Ugur Korkut, Mehmet Metin Dam, and Funda Kaya. 2023. How Effective Are Renewable Energy, Tourism, Trade Openness, and Foreign Direct Investment on CO2 Emissions? An EKC Analysis for ASEAN Countries. Environmental Science and Pollution Research 30: 14821–37. [Google Scholar] [CrossRef]
- Prete, Davide Del, Giorgia Giovannetti, and Enrico Marvasi. 2018. Global Value Chains: New Evidence for North Africa. International Economics 153: 42–54. [Google Scholar] [CrossRef]
- Qin, Meng, Xiuyan Liu, and Xiaoxue Zhou. 2020. COVID-19 Shock and Global Value Chains: Is There a Substitute for China? Emerging Markets Finance and Trade 56: 3588–98. [Google Scholar] [CrossRef]
- Rahayu, Caecilia Wahyu Estining, Christina Heti Tri Rahmawati, Josephine Wuri, Yuliana Rini Hardanti, and Laurentius Bambang Harnoto. 2024. Role of Indonesia’s G20 Presidency and Exchange Rate on LQ45 Stock Price: Dynamic Panel Model Approach. Migration Letters 21: 926–39. [Google Scholar] [CrossRef]
- Shuai, Jing, Xinjie Peng, Yujia Zhao, Yilan Wang, Wei Zu, Jinhua Cheng, Yang Lu, and Jingjin Wang. 2022. A Dynamic Evaluation on the International Competitiveness of China’s Rare Earth Products: An Industrial Chain and Tech-Innovation Perspective. Resources Policy 75: 102444. [Google Scholar] [CrossRef]
- Smith, Adrian, John Pickles, Milan Buček, Rudolf Pástor, and Bob Begg. 2014. The Political Economy of Global Production Networks: Regional Industrial Change and Differential Upgrading in the East European Clothing Industry. Journal of Economic Geography 14: 1023–51. [Google Scholar] [CrossRef]
- Song, Yiru, Chunjiao Yu, Lulu Hao, and Xi Chen. 2021. Path for China’s High-Tech Industry to Participate in the Reconstruction of Global Value Chains. Technology in Society 65: 101486. [Google Scholar] [CrossRef]
- Timmer, Marcel P., Bart Los, Robert Stehrer, and Gaaitzen J. de Vries. 2013. Fragmentation, Incomes, and Jobs: An Analysis of European Competitiveness. Economic Policy 28: 613–61. [Google Scholar] [CrossRef]
- Vidya, C. T., and K.P. Prabheesh. 2020. Implications of COVID-19 Pandemic on the Global Trade Networks. Emerging Markets Finance and Trade 56: 2408–21. [Google Scholar] [CrossRef]
- Wang, Qiang, Jiayi Sun, Rongrong Li, and Ugur Korkut Pata. 2024. Linking Trade Openness to Load Capacity Factor: The Threshold Effects of Natural Resource Rent and Corruption Control. Gondwana Research 129: 371–80. [Google Scholar] [CrossRef]
- Wang, Zhi, Shang-jin Wei, and Kunfu Zhu. 2018. Quantifying International Production Sharing at the Bilateral and Sector Levels. NBER Working Paper 19677. Cambridge: National Bureau of Economic Research, Revised February 2018. Available online: https://www.nber.org/papers/w19677 (accessed on 5 March 2021).
- Widodo, Tri, Rini Setyastuti, and Sri Adiningsih. 2018. ‘Flying Geese’ Paradigm: Review, Analytical Tool, and Application. Munich Personal RePEc Archive. Available online: https://mpra.ub.uni-muenchen.de/87171/ (accessed on 10 February 2024).
- Wuri, Josephine, Tri Widodo, and Amirullah Setya Hardi. 2022. Global Value Chains Participation during the COVID-19 Pandemic: A Dynamic Panel Approach. Economies 10: 121. [Google Scholar] [CrossRef]
- Wuri, Josephine, Tri Widodo, and Amirullah Setya Hardi. 2023. Speed of Convergence in Global Value Chains: Forward or Backward Linkage. Heliyon 9: e18070. [Google Scholar] [CrossRef] [PubMed]
- Wuri, Josephine, Yuliana Rini Hardanti, Laurentius Bambang Harnoto, Caecilia Wahyu Estining Rahayu, and Christina Heti Tri Rahmawati. 2024. The Impact of Interest Rate Spillover on Output Gap: A Dynamic Spatial Durbin Model. Economies 12: 22. [Google Scholar] [CrossRef]
- Xu, Haifeng. 2016. Financial Intermediation and Economic Growth in China: New Evidence from Panel Data. Emerging Markets Finance and Trade 52: 724–32. [Google Scholar] [CrossRef]
- Zapata, Amadeo Navarro, María Arrazola, and José de Hevia. 2023. Determinants of High-Tech Exports: New Evidence from OECD Countries. Journal of the Knowledge Economy 15: 1103–17. [Google Scholar] [CrossRef]
- Zergawu, Y. Zewdu, Yabibal M. Walle, and José M. G. Gómez. 2020. The Joint Impact of Infrastructure and Institutions on Economic Growth. Journal of Institutional Economics 16: 481–502. [Google Scholar] [CrossRef]
- Zhang, Qian. 2024. The Impact of Digitalization on the Upgrading of China’s Manufacturing Sector’s Global Value Chains. Journal of the Knowledge Economy, 1–24. [Google Scholar] [CrossRef]
- Zhong, Sheng, and Bin Su. 2021. Investigating Asean’s Participation in Global Value Chains: Production Fragmentation and Regional Integration. Asian Development Review 38: 159–88. [Google Scholar] [CrossRef]
| Variables | Description | Measurement | Expectation | Source |
|---|---|---|---|---|
| BPR | Backward GVC participation ratio | Share of foreign value added (FVA) to total world exports (ratio) | - | Multi-Regional Input–Output (MRIO), computed by authors, 2010–2020 |
| FPR | Forward GVC participation ratio | Share of domestic value added (DVA) to total world exports (ratio) | - | MRIO, computed by authors, 2010–2020 |
| TVA | Trade in value added | FPR + BPR | - | MRIO, computed by authors, 2010–2020 |
| NRSCA | New revealed symmetric comparative advantage | Share of an economic sector’s forward-linked measure of DVA in exports | Positive | MRIO, computed by authors, 2010–2020 |
| COVID | Coronavirus disease 19 pandemic | Dummy COVID-19 pandemic (1 = 2019–2020, 0 = otherwise) | Negative | - |
| GOV | Government effectiveness | Index lies between −2.5 and 2.5 | Positive | World Governance Indicators (WGI), 2010–2020 |
| CC | Control of corruption | Index lies between −2.5 and 2.5 | Positive | WGI, 2010–2020 |
| Category | Term | Description | Formula |
| DVA FIN | 1 | Domestic Value Added in final use commodity exports | |
| DVA_INT | 2 | DVA in intermediate exports utilized by direct importers to manufacture final local products. | |
| DVA_INTrex | 3 | DVA in intermediate exports used by the direct importer to produce intermediate exports and consumed in other countries except for the source country s. | |
| 4 | DVA in intermediate exports utilized by the direct importer to produce final-use exports to other countries except for the source country s. | ||
| 5 | DVA in intermediate exports utilized by the direct importer to produce intermediate exports to other countries except for the source country s. |
| Group | Variable | Obs | Mean | SD | Variance | Maximum | Minimum |
|---|---|---|---|---|---|---|---|
| Full Sample | FPR | 451 | 0.420 | 0.111 | 0.012 | 0.846 | 0.164 |
| BPR | 451 | 0.345 | 0.128 | 0.016 | 0.726 | 0.077 | |
| TVA | 451 | 0.765 | 0.093 | 0.009 | 1.000 | 0.431 | |
| NRSCA | 451 | 0.114 | 0.206 | 0.042 | 0.654 | −0.824 | |
| GOV | 451 | 0.952 | 0.724 | 0.524 | 2.335 | −0.943 | |
| CC | 451 | 0.738 | 0.949 | 0.900 | 2.405 | −1.326 | |
| ASEAN | FPR | 99 | 0.464 | 0.162 | 0.026 | 0.846 | 0.210 |
| BPR | 99 | 0.286 | 0.128 | 0.016 | 0.563 | 0.077 | |
| TVA | 99 | 0.750 | 0.111 | 0.012 | 0.960 | 0.431 | |
| NRSCA | 99 | 0.132 | 0.155 | 0.024 | 0.654 | −0.095 | |
| GOV | 99 | 0.352 | 0.894 | 0.780 | 2.335 | −0.943 | |
| CC | 99 | −0.117 | 0.977 | 0.955 | 2.180 | −1.326 | |
| East Asia | FPR | 33 | 0.432 | 0.047 | 0.002 | 0.522 | 0.347 |
| BPR | 33 | 0.236 | 0.088 | 0.008 | 0.396 | 0.133 | |
| TVA | 33 | 0.669 | 0.077 | 0.006 | 0.818 | 0.532 | |
| NRSCA | 33 | −0.095 | 0.073 | 0.005 | 0.022 | −0.170 | |
| GOV | 33 | 1.041 | 0.582 | 0.339 | 1.822 | 0.004 | |
| CC | 33 | 0.592 | 0.791 | 0.626 | 1.695 | −0.562 | |
| EU | FPR | 297 | 0.393 | 0.083 | 0.007 | 0.721 | 0.164 |
| BPR | 297 | 0.388 | 0.110 | 0.012 | 0.726 | 0.162 | |
| TVA | 297 | 0.782 | 0.083 | 0.007 | 1.000 | 0.586 | |
| NRSCA | 297 | 0.135 | 0.223 | 0.050 | 0.608 | −0.824 | |
| GOV | 297 | 1.092 | 0.564 | 0.318 | 2.241 | −0.329 | |
| CC | 297 | 0.975 | 0.787 | 0.620 | 2.405 | −0.272 | |
| NA | FPR | 22 | 0.562 | 0.039 | 0.002 | 0.702 | 0.508 |
| BPR | 22 | 0.184 | 0.064 | 0.004 | 0.258 | 0.107 | |
| TVA | 22 | 0.746 | 0.055 | 0.003 | 0.861 | 0.678 | |
| NRSCA | 22 | 0.067 | 0.056 | 0.003 | 0.151 | −0.012 | |
| GOV | 22 | 1.629 | 0.147 | 0.022 | 1.854 | 1.319 | |
| CC | 22 | 1.600 | 0.313 | 0.098 | 2.070 | 1.069 |
| Variables | ADF Test | LLC Test |
|---|---|---|
| FPR | −7.9632 | −39.5926 |
| (0.0000) | (0.0000) | |
| BPR | −7.7441 | −39.2365 |
| (0.0000) | (0.0000) | |
| TVA | −9.6258 | −61.2305 |
| (0.0000) | (0.0000) | |
| NRSCA | −3.0311 | −2.4029 |
| (0.0012) | (0.0081) | |
| GOV | −7.3071 | −6.0623 |
| (0.0000) | (0.0000) | |
| CC | −2.4413 | −11.7025 |
| (0.0073) | (0.0000) |
| Variables | FPR | BPR | TVA |
|---|---|---|---|
| (1) | (2) | (3) | |
| Lag of Dep Var | 0.115 *** | 0.831 *** | 0.034 *** |
| (0.009) | (0.053) | (0.004) | |
| NRSCA | 0.265 *** | 0.010 *** | 0.171 *** |
| (0.022) | (0.014) | (0.019) | |
| GOV | 0.012 *** | 0.029 *** | 0.045 *** |
| (0.004) | (0.011) | (0.004) | |
| CC | 0.032 *** | 0.021 ** | 0.021 *** |
| (0.008) | (0.009) | (0.004) | |
| COVID-19 | −0.010 *** | −0.010 *** | −0.009 *** |
| (0.001) | (0.001) | (0.0008) | |
| Constant | 0.424 ** | 0.002 | 0.726 *** |
| (0.007) | (0.010) | (0.006) | |
| No. of observations | 369 | 328 | 369 |
| No. of countries | 41 | 41 | 41 |
| Hansen test, p-value | 35.13; 0.972 | 34.21; 0.194 | 37.60; 0.488 |
| AB–AR (1); p-value | −1.76; 0.079 | −3.55; 0.000 | −1.70; 0.090 |
| AB–AR (2); p-value | −0.73; 0.464 | −0.58; 0.560 | 0.44; 0.657 |
| Variables | FPR | BPR | TVA |
|---|---|---|---|
| (1) | (2) | (3) | |
| Lag of Dep Var | 0.116 *** | 0.077 *** | 0.012 ** |
| (0.008) | (0.011) | (0.005) | |
| NRSCA | 0.248 *** | 0.024 * | 0.032 *** |
| (0.015) | (0.013) | (0.012) | |
| GOV | 0.009 ** | 0.069 *** | 0.069 *** |
| (0.004) | (0.007) | (0.009) | |
| CC | 0.029 *** | 0.036 *** | 0.033 *** |
| (0.009) | (0.008) | (0.008) | |
| COVID shocks | −0.031 *** | −0.063 *** | −0.083 *** |
| (0.005) | (0.007) | (0.003) | |
| Constant | 0.406 *** | 0.207 *** | 0.733 *** |
| (0.007) | (0.019) | (0.009) | |
| No. of observations | 369 | 410 | 410 |
| No. of countries | 41 | 41 | 41 |
| Hansen test, p-value | 34.99; 0.973 | 35.51; 0.969 | 38.86; 0.652 |
| AB–AR (1); p-value | −1.69; 0.092 | −2.50; 0.012 | −1.33; 0.185 |
| AB–AR (2); p-value | −0.83; 0.408 | −1.37; 0.172 | −1.02; 0.307 |
Disclaimer/Publisher’s Note: The statements, opinions and data contained in all publications are solely those of the individual author(s) and contributor(s) and not of MDPI and/or the editor(s). MDPI and/or the editor(s) disclaim responsibility for any injury to people or property resulting from any ideas, methods, instructions or products referred to in the content. |
© 2024 by the author. Licensee MDPI, Basel, Switzerland. This article is an open access article distributed under the terms and conditions of the Creative Commons Attribution (CC BY) license (https://creativecommons.org/licenses/by/4.0/).
Share and Cite
Wuri, J. The Role of Comparative Advantage in Enhancing Trade in Value-Added Using a Dynamic GMM Model. Economies 2024, 12, 187. https://doi.org/10.3390/economies12070187
Wuri J. The Role of Comparative Advantage in Enhancing Trade in Value-Added Using a Dynamic GMM Model. Economies. 2024; 12(7):187. https://doi.org/10.3390/economies12070187
Chicago/Turabian StyleWuri, Josephine. 2024. "The Role of Comparative Advantage in Enhancing Trade in Value-Added Using a Dynamic GMM Model" Economies 12, no. 7: 187. https://doi.org/10.3390/economies12070187
APA StyleWuri, J. (2024). The Role of Comparative Advantage in Enhancing Trade in Value-Added Using a Dynamic GMM Model. Economies, 12(7), 187. https://doi.org/10.3390/economies12070187


