
Accessibility and Older and Foreign Populations: Exploring Local Spatial Heterogeneities across Italy


Abstract
1. Introduction
2. Theoretical Background and Literature Review
2.1. Accessibility: Concept and Measures
2.2. On the Role of Accessibility in Economic and Demographic Change
2.3. On the Spatial Heterogeneity in the Accessibility–Population Change Nexus
3. Methodology
3.1. Data and Indicators
3.2. Local Spatial Analysis
3.3. Regression Analysis
4. Results
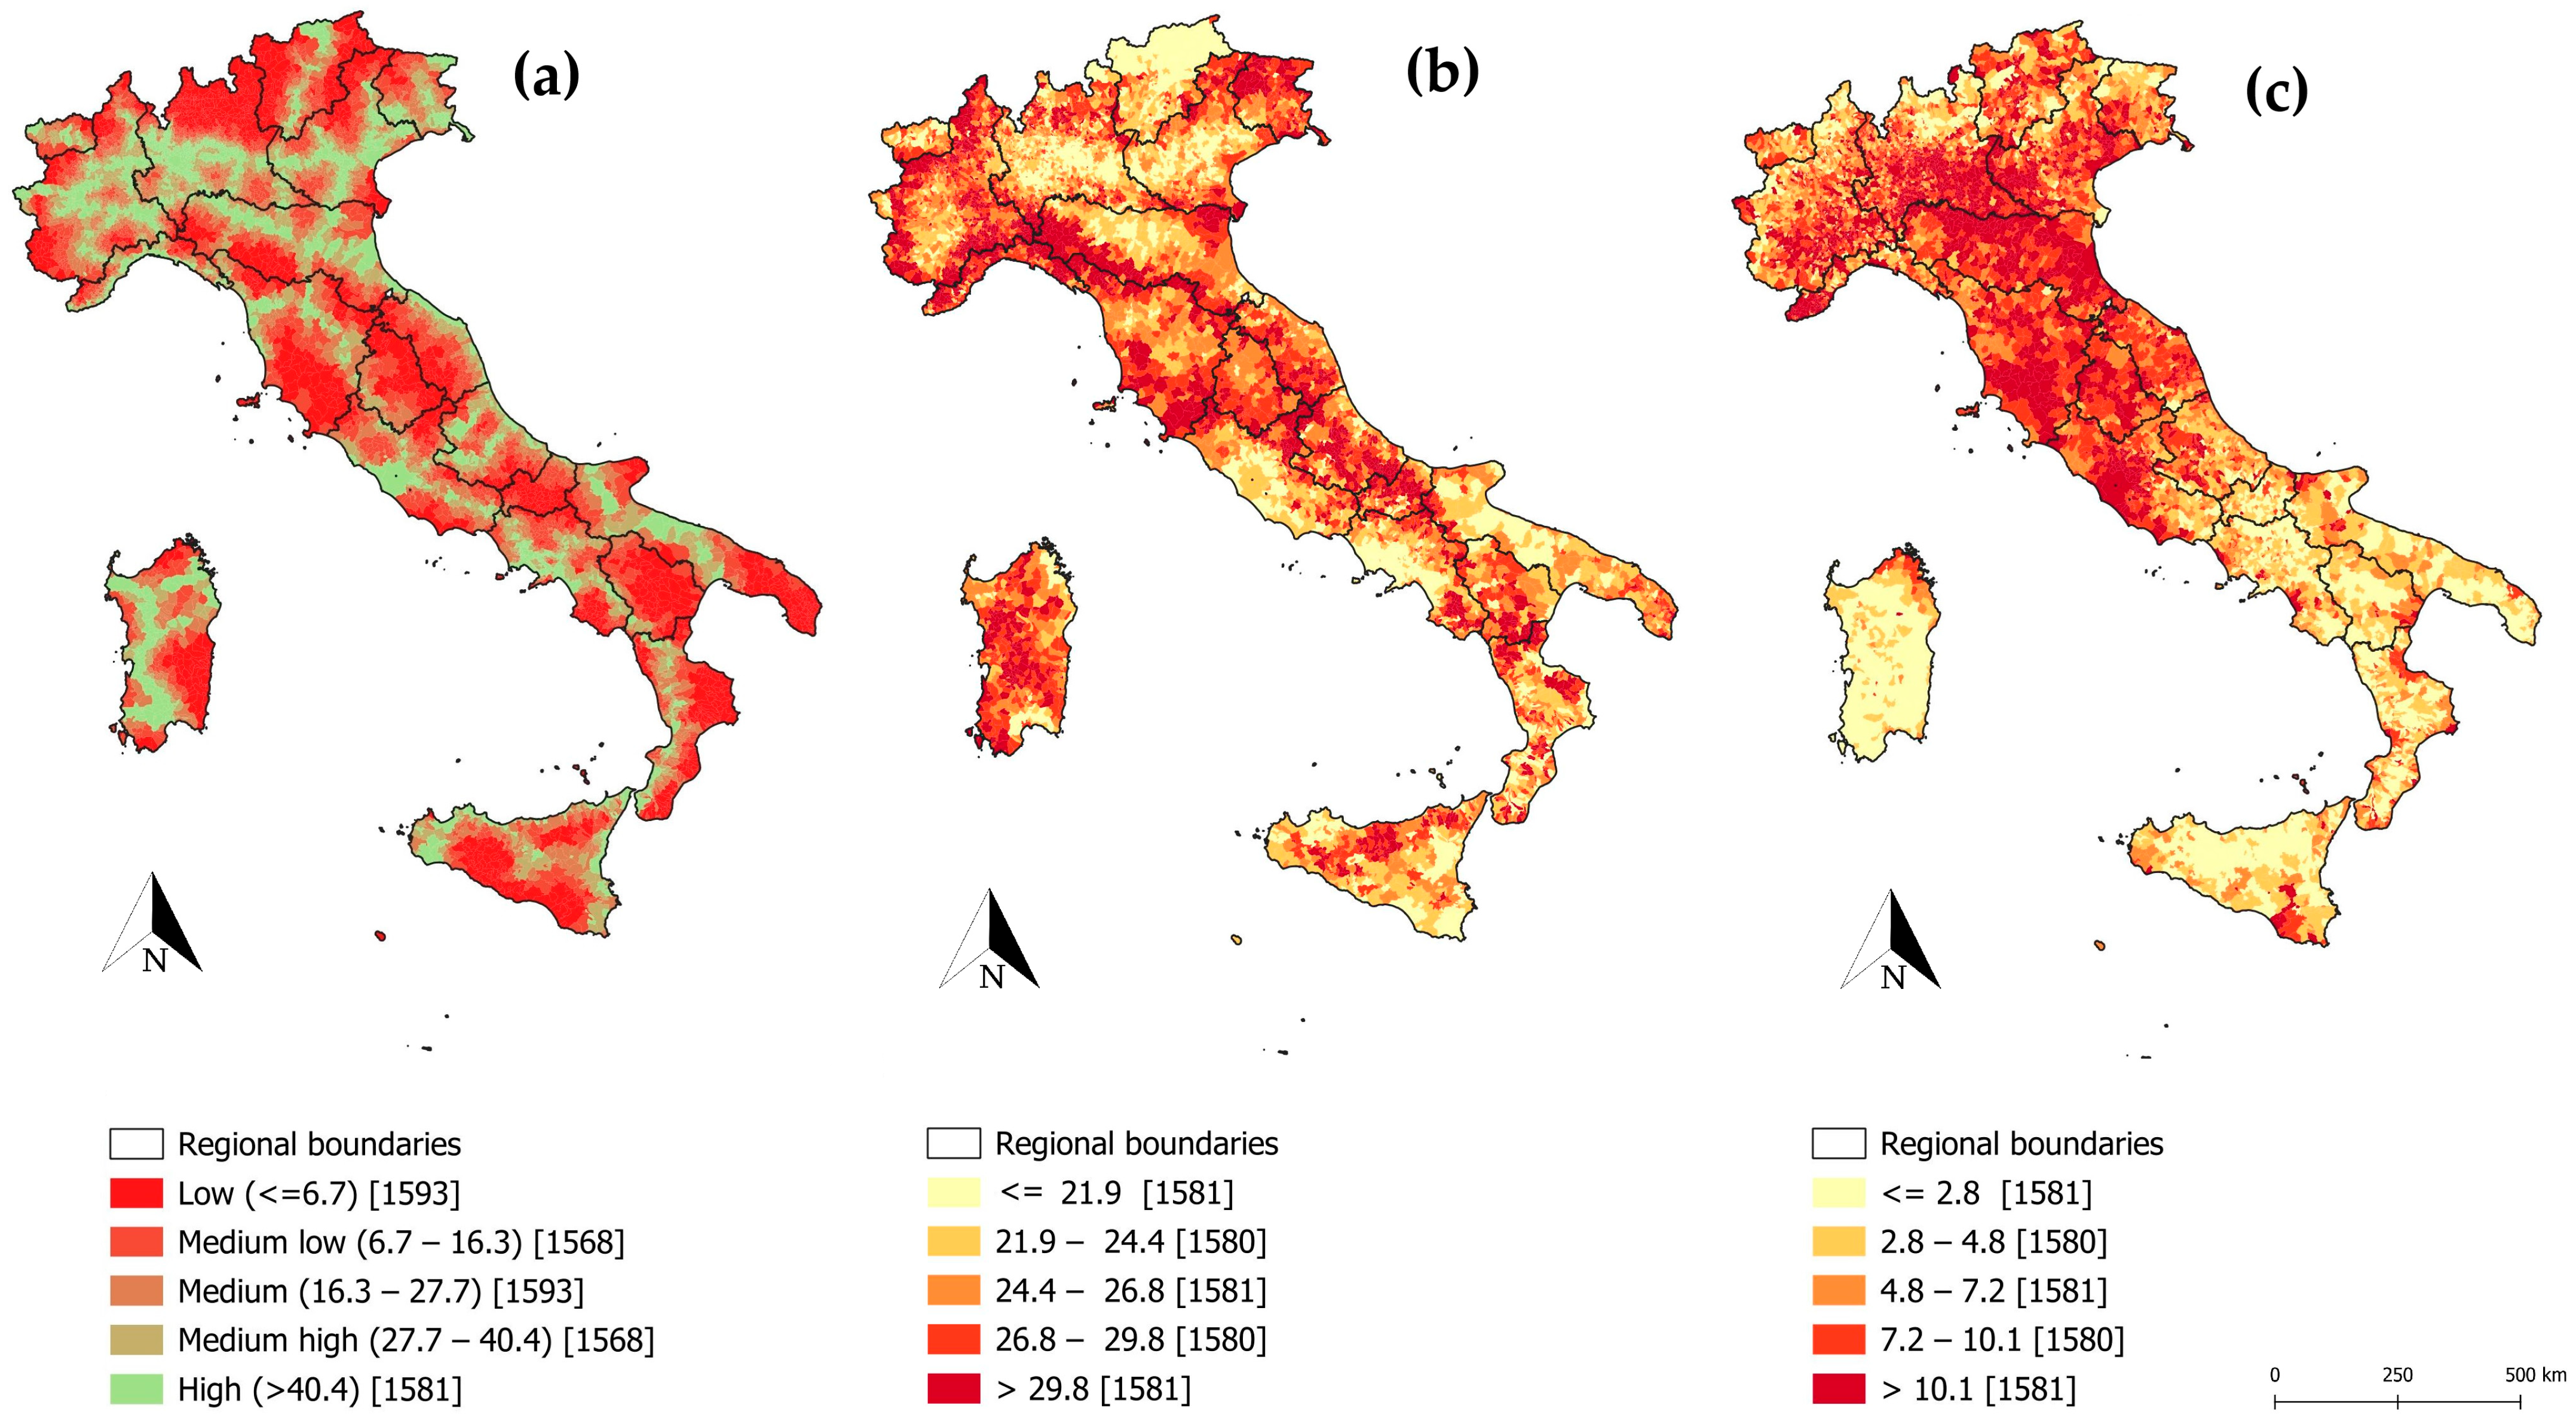
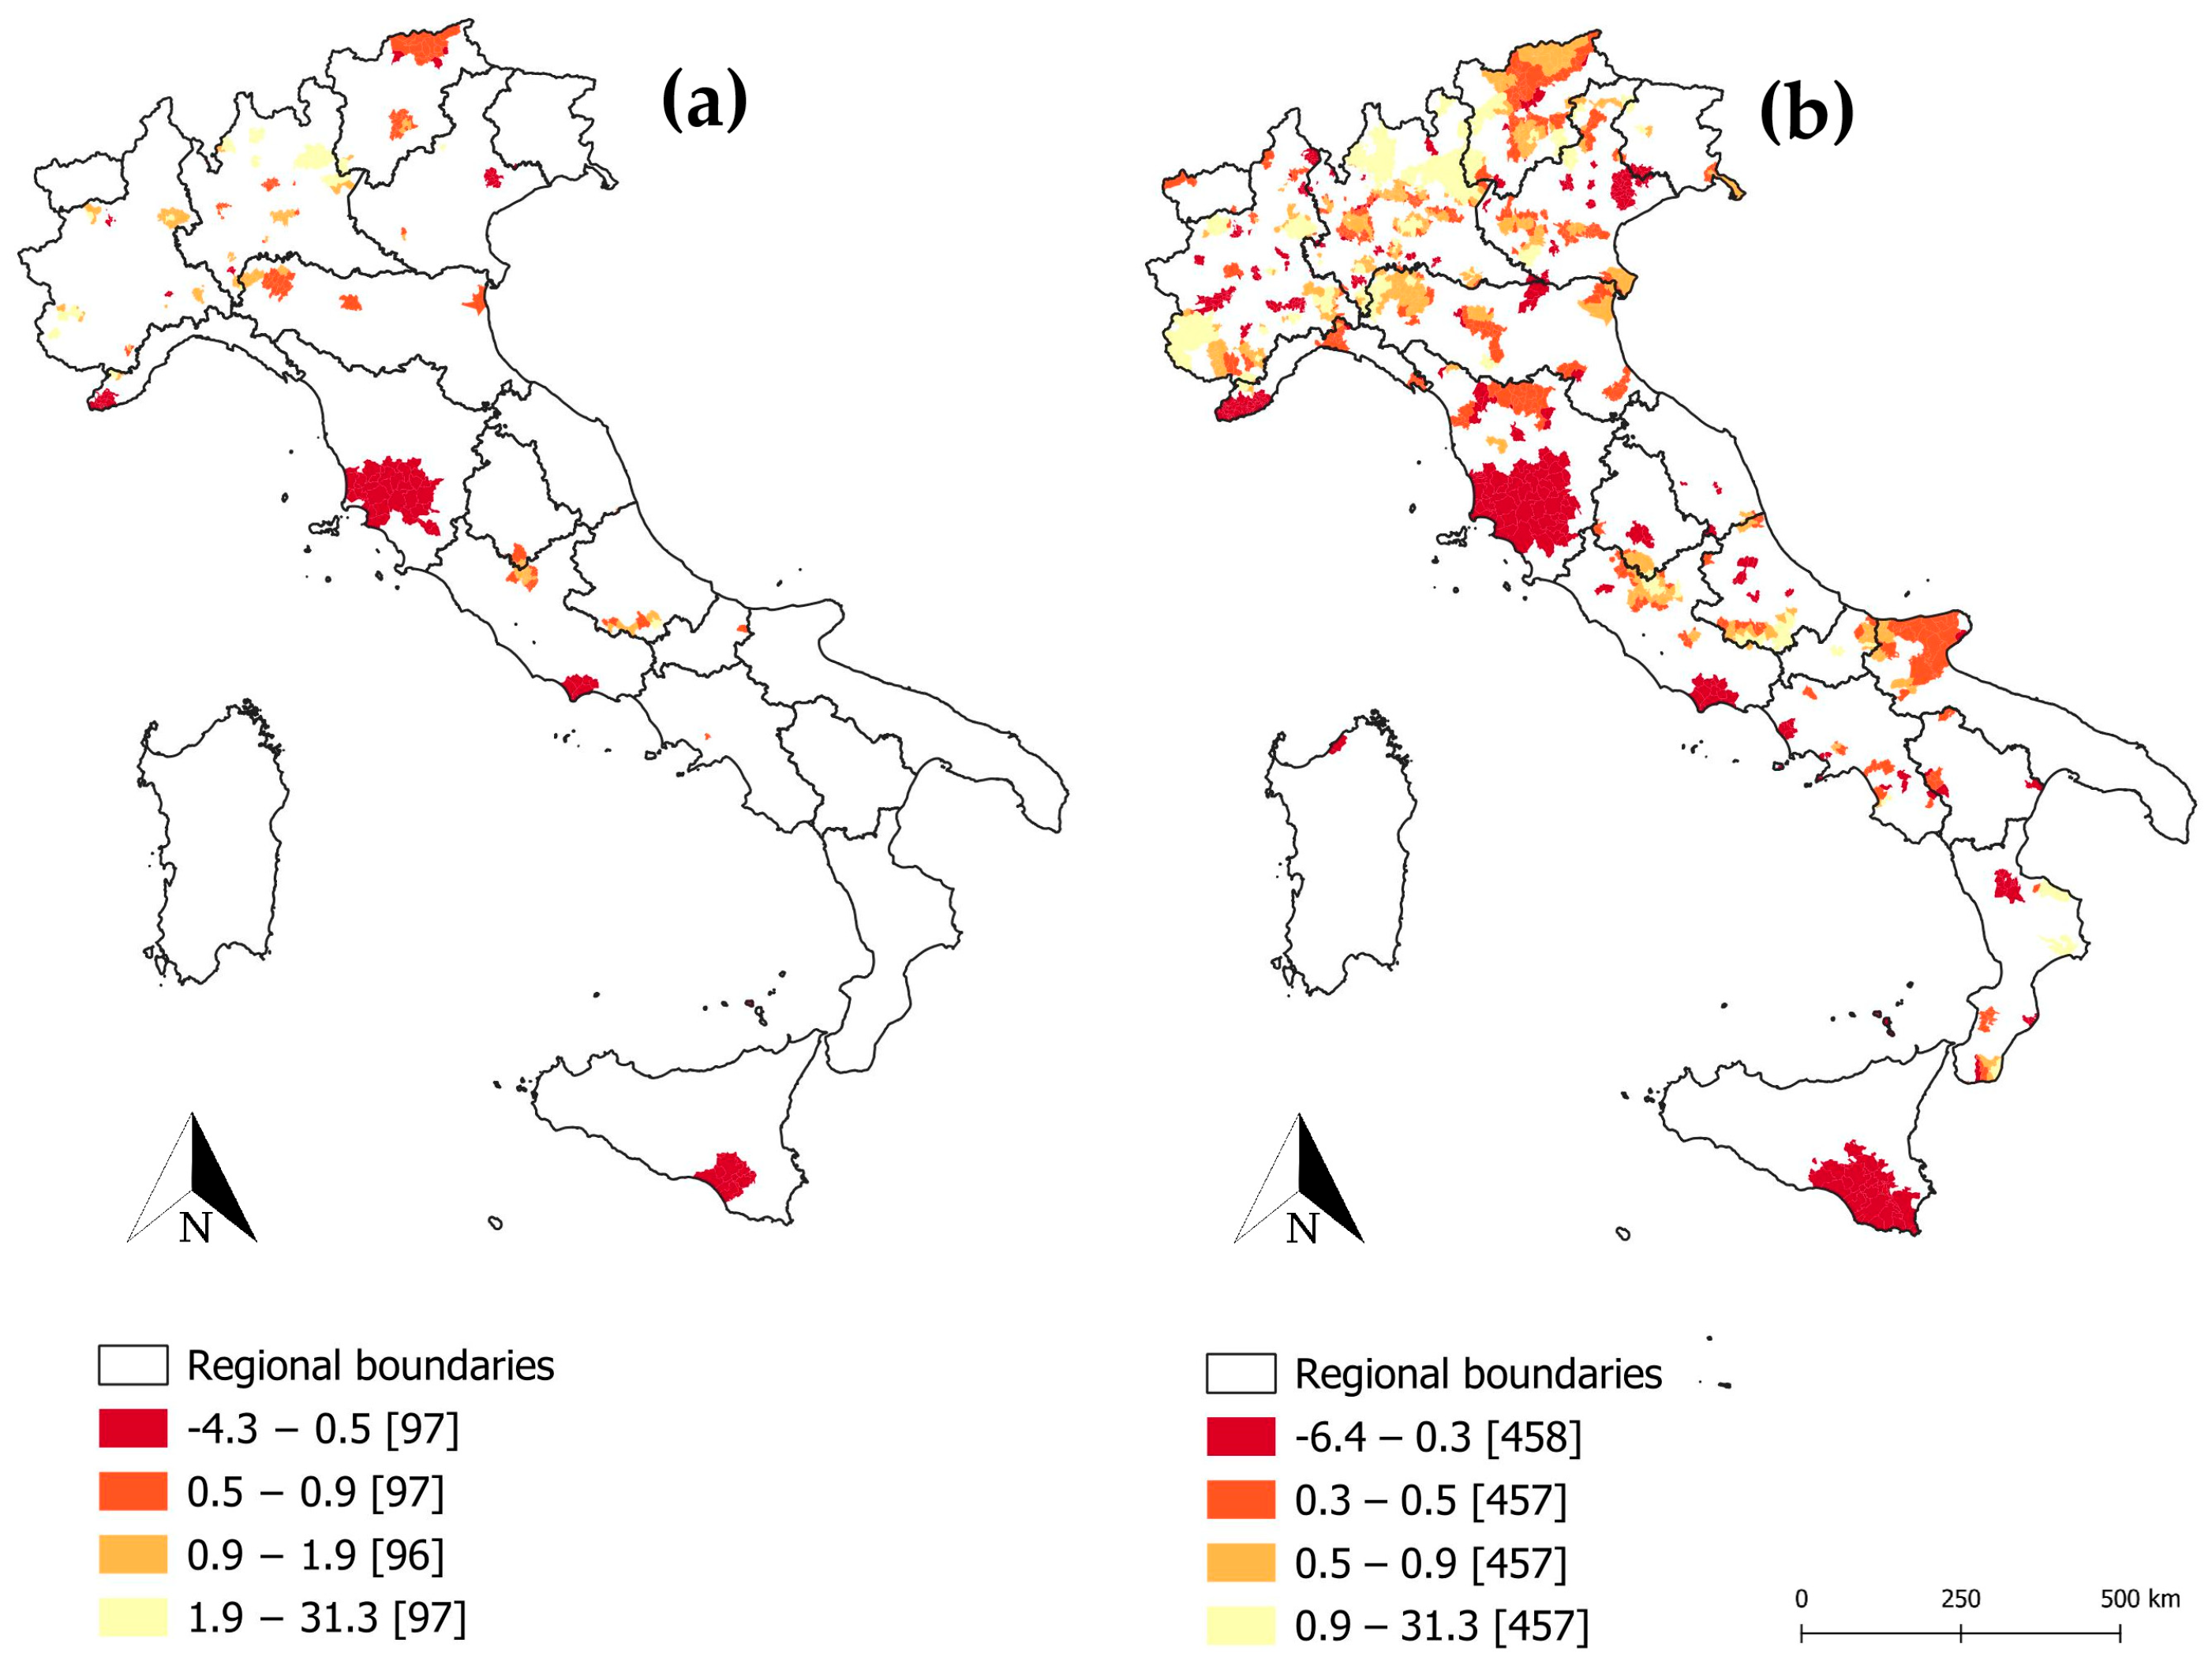
4.1. Geographic Distribution and Local Spatial Autocorrelation Analysis
4.2. Regression Models
5. Discussions
6. Conclusions
Author Contributions
Funding
Institutional Review Board Statement
Informed Consent Statement
Data Availability Statement
Conflicts of Interest
Appendix A
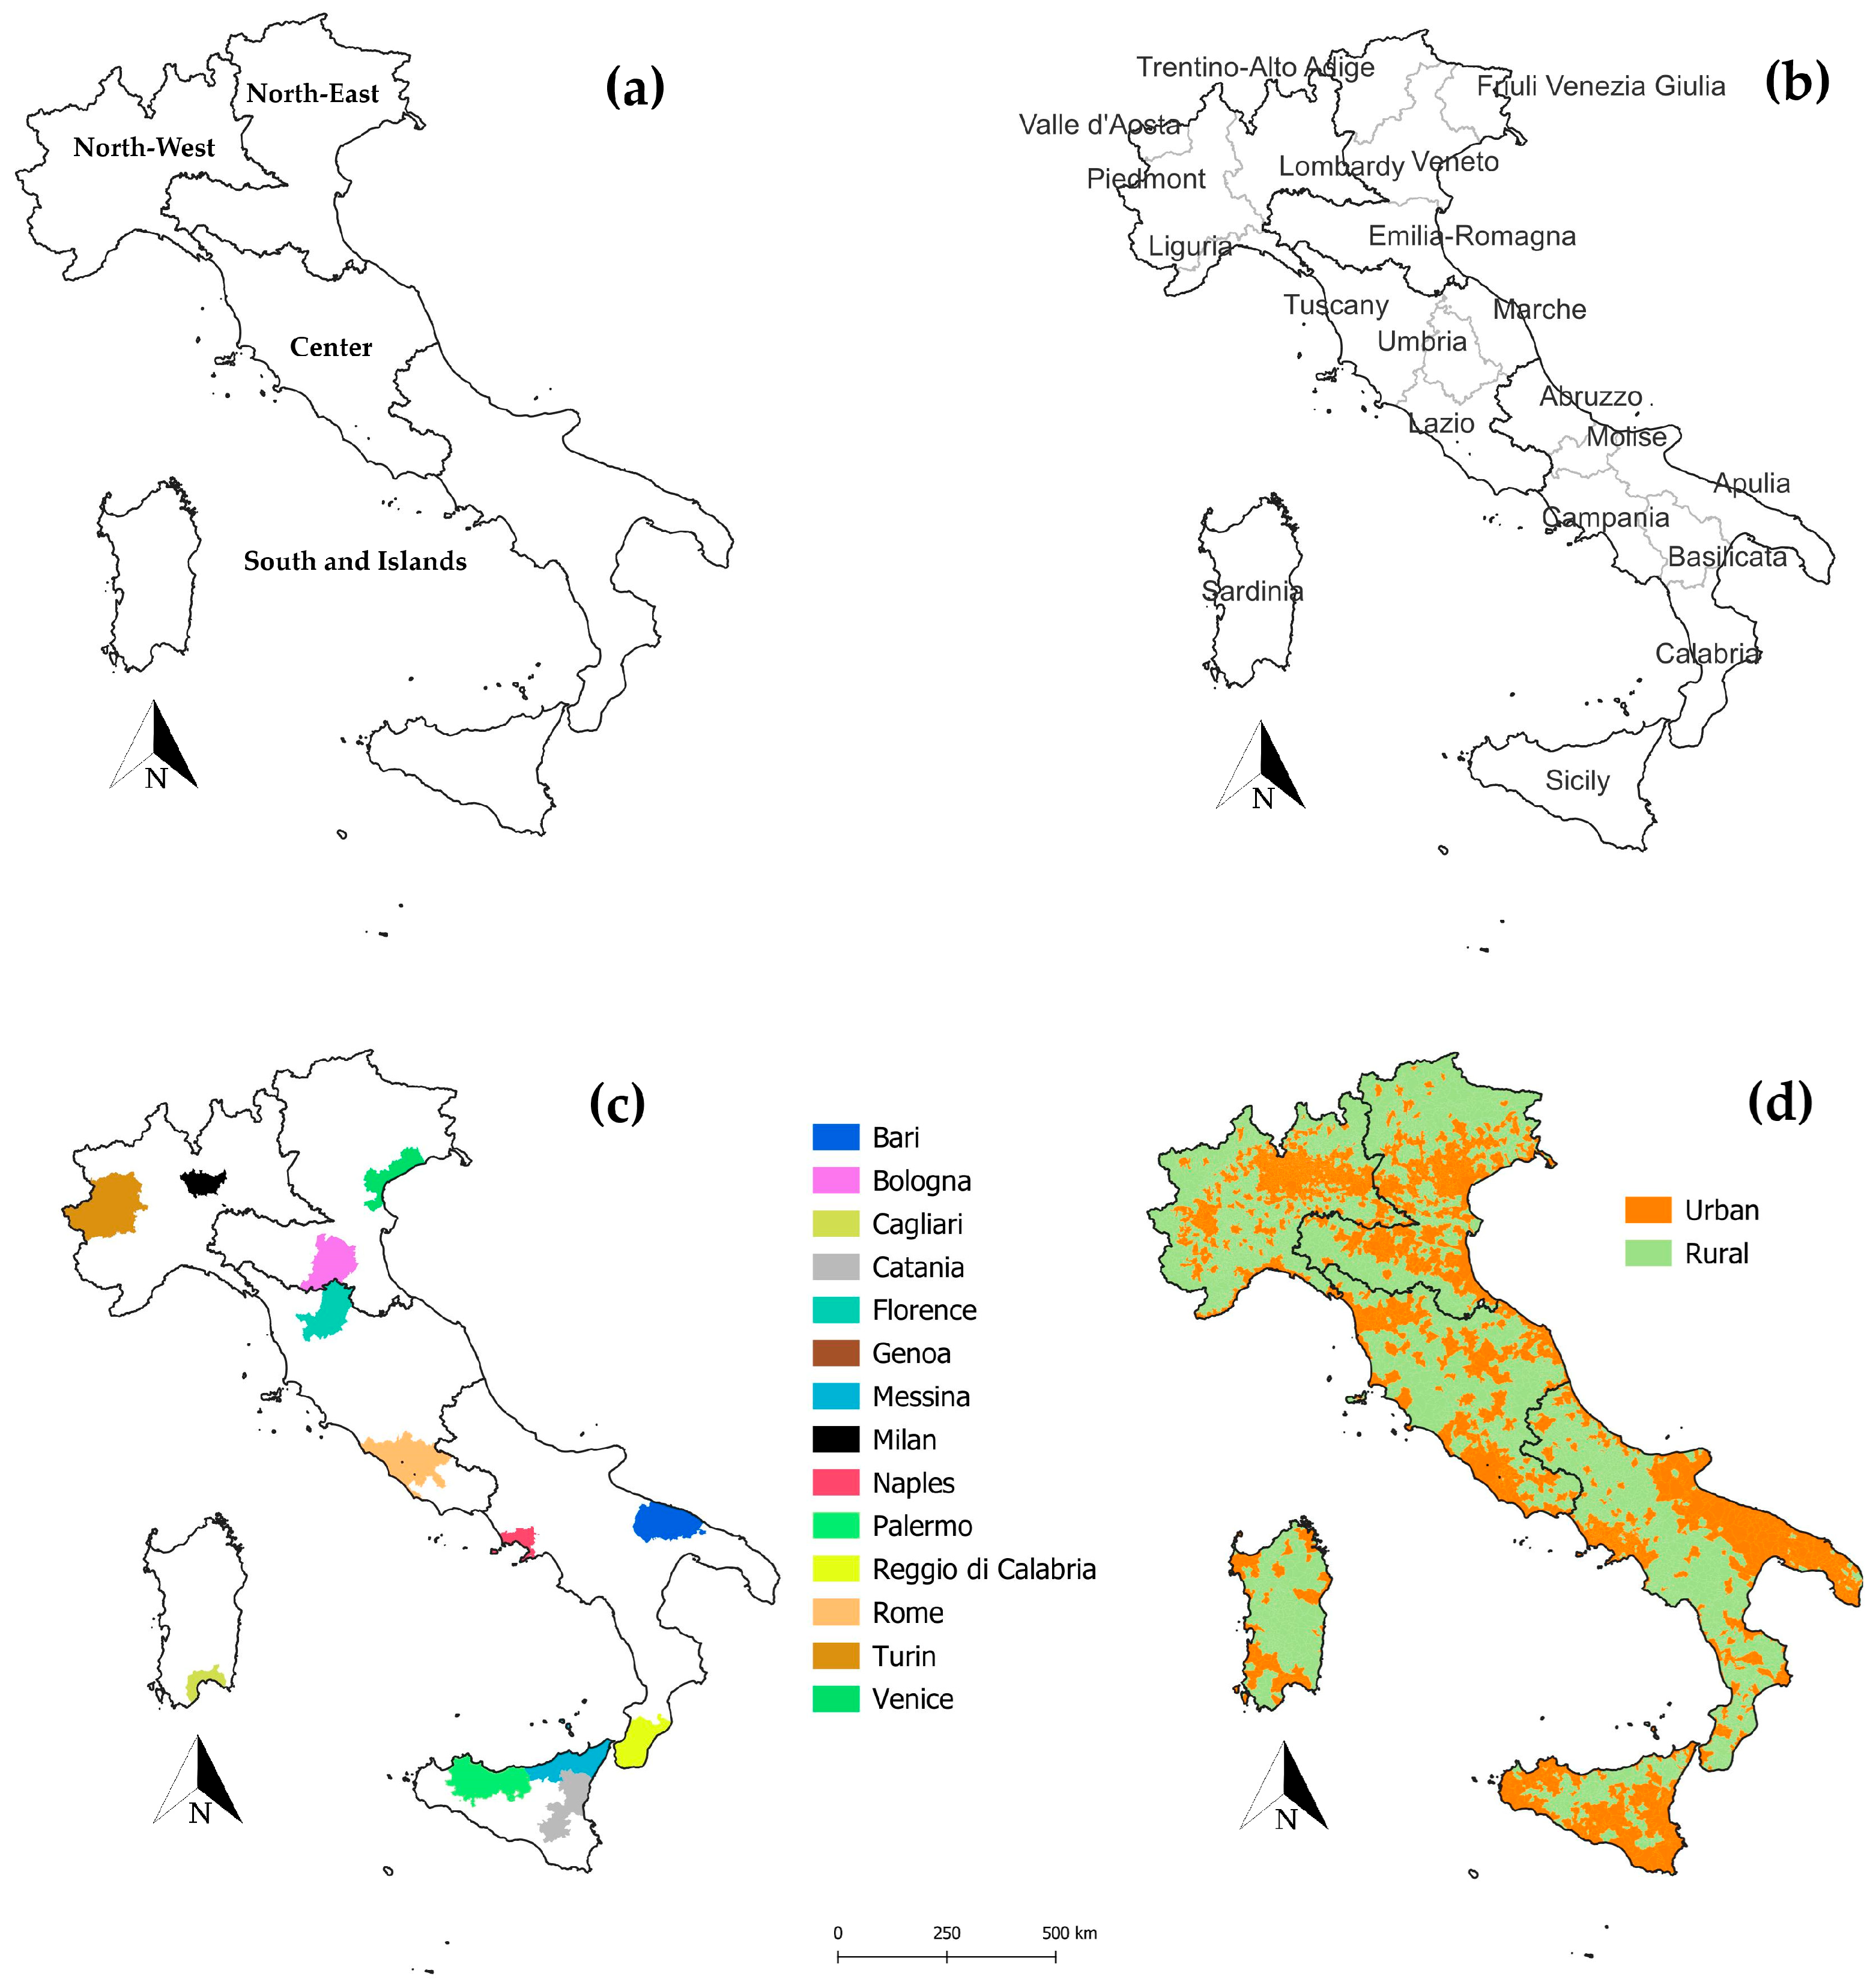
| 1 | For a better reading and interpretation of the results, it is recommended to consult not only the maps included in this section but also those provided in the Appendix of the contribution, which relate respectively to the Italian macro-regions, Italian regions, Italian metropolitan cities, and Italian municipalities classified as urban and rural according to the degree of urbanization (Degurba) indicator. |
References
- Alamá-Sabater, Luisa, Vincente Budí, Josè Maria G. Álvarez-Coque, and Norat Roig-Tierno. 2019. Using mixed research approaches to understand rural depopulation. Economía Agraria y Recursos Naturales-Agricultural and Resource Economics 19: 99–120. [Google Scholar]
- Alamá-Sabater, Luisa, Vincente Budí, Norat Roig-Tierno, and Josè Maria G. Álvarez-Coque. 2021. Drivers of depopulation and spatial interdependence in a regional context. Cities 114: 103217. [Google Scholar] [CrossRef]
- Allen, Jeff, Steven Farber, Stephen Greaves, Geoffrey Clifton, Hao Wu, Somwrita Sarkar, and David M. Levinson. 2021. Immigrant settlement patterns, transit accessibility, and transit use. Journal of Transport Geography 96: 103187. [Google Scholar] [CrossRef]
- Annunziata, Alfonso, Francesco Scorza, Simone Corrado, and Beniamino Murgante. 2024. Unveiling intra-rural divides: Investigating decline and prosperity in rural areas. The case study of southern Italy. European Planning Studies 32: 1478–505. [Google Scholar] [CrossRef]
- Armenise, Massimo, Federico Benassi, Marica D’Elia, Marianna Mantuano, and Francesca Petrei. 2022. The Exposure Geography of Italian Local Economies to Major Foreign Ones. Evidence from a Multiscale Spatial Experiment Based on Granularity. Jahrbücher für Nationalökonomie und Statistik—Journal of Economics and Statistics 242: 87–105. [Google Scholar] [CrossRef]
- Bagavos, Christos. 2022. On the contribution of foreign-born populations to overall population change in Europe. Demographic Research 46: 179–216. [Google Scholar] [CrossRef]
- Barca, Fabrizio. 2009. An Agenda for a Reformed Cohesion Policy. A Place-Based Approach to Meeting EU Challenges and Expectations. Brussels: European Commission, pp. 1–248. [Google Scholar]
- Barca, Fabrizio. 2019. Place-based policy and politics. Renewal: A Journal of Social Democracy 27: 84–95. [Google Scholar]
- Benassi, Federico, Annalisa Busetta, Gerardo Gallo, and Manuela Stranges. 2021a. Diseguaglianze tra territori. In L’Italia e le Sfide della Demografia. Edited by Francesco C. Billari and Cecilia Tomassini. Bologna: Il Mulino, Rapporto Sulla Popolazione, pp. 135–62. [Google Scholar]
- Benassi, Federico, Annalisa Busetta, Gerardo Gallo, and Manuela Stranges. 2023. Neighbourhood effects and determinants of population changes in Italy: A spatial perspective. Vienna Yearbook of Population Research 23: 311–38. [Google Scholar] [CrossRef]
- Benassi, Federico, Cecilia Tomassini, and Carlo Lallo. 2024. The local regression approach as a tool to improve place-based policies: The case of Molise (Southern Italy). Spatial Demography 12: 1–28. [Google Scholar] [CrossRef]
- Benassi, Federico, Marica D’Elia, and Francesca Petrei. 2021b. The “meso” dimension of territorial capital: Evidence from Italy. Regional Science Policy and Practice 13: 159–75. [Google Scholar] [CrossRef]
- Berechman, Joseph, and Robert Paaswell. 2001. Accessibility improvements and local employment: An empirical analysis. Journal of Transportation and Statistics 4: 49–66. [Google Scholar]
- Bhatta, Saurav Dev, and Matthew P. Drennan. 2003. The economic benefits of public investment in transportation: A review of recent literature. Journal of Planning Education and Research 22: 288–96. [Google Scholar] [CrossRef]
- Billari, Francesco C., and Cecilia Tomassini. 2021. Rapporto sulla Popolazione. L’Italia e le Sfide della Demografia. Bologna: Il Mulino, pp. 1–262. [Google Scholar]
- Bose, Pablo S. 2014. Refugees in Vermont: Mobility and acculturation in a new immigrant destination. Journal of Transport Geography 36: 151–59. [Google Scholar] [CrossRef]
- Buonomo, Alessio, Federico Benassi, Gerardo Gallo, Luca Salvati, and Salvatore Strozza. 2024. In-between centers and suburbs? Increasing differentials in recent demographic dynamics of Italian metropolitan cities. Genus 80: 1. [Google Scholar] [CrossRef]
- Burnley, Ian H. 2002. Evolution of Chinese settlement geographies in Sydney, Australia. Urban Geography 23: 365–87. [Google Scholar] [CrossRef]
- Campagnucci, Fabiano, and Gabriele Morettini. 2024. Inner areas matter: A place-sensitive approach for the identification of the daily life spaces in the Italian Abruzzo region. Socio Economic Planning Sciences 93: 101859. [Google Scholar] [CrossRef]
- Cardille, Jeffrey A., Stephen J Ventura, and Monica G. Turner. 2001. Environmental and social factors influencing wildfires in the Upper Midwest, United States. Ecological Applications 11: 111–27. [Google Scholar] [CrossRef]
- Cardoso, Rodrigo Viseu. 2022. City-regional demographic composition and the fortunes of regional second cities. Urban Geography 44: 1541–63. [Google Scholar] [CrossRef]
- Carella, Maria, Federico Benassi, Roberta Misuraca, and Massimo Armenise. 2024. Accessibility, population ageing, and foreign presence: A first investigation across local heterogeneities in Italy. In La Geografía ante los Retos del Desarrollo Local. Edited by Francisco Javier García-Delgado, María Hernández-Hernández, Antonio Martínez-Puche, Luis Alfonso Hortelano Mínguez and Vicente M. Zapata Hernández. XII Coloquio de Desarrollo Local—I European Meeting on Geography and Local Development. Alicante: University of Alicante, pp. 186–92. [Google Scholar] [CrossRef]
- Caschili, Simone, Andrea De Montis, and Daniele Trogu. 2015. Accessibility and rurality indicators for regional development. Computers, Environment and Urban Systems 49: 98–114. [Google Scholar] [CrossRef]
- Chi, Guangqing. 2010. The impacts of highway expansion on population change: An integrated spatial approach. Rural Sociology 75: 58–89. [Google Scholar] [CrossRef]
- Chi, Guangqing. 2012. The impacts of transport accessibility on population change across rural, suburban and urban areas: A case study of Wisconsin at sub-county levels. Urban Studies 49: 2711–31. [Google Scholar] [CrossRef]
- Chi, Guangqing, and David W. Marcouiller. 2009. Rethinking the Migration Effects of Natural Amenities: Part II. Canadian Journal of Regional Science 32: 349–59. [Google Scholar]
- Chi, Guangqing, and Domenico Parisi. 2011. Highway expansion effects on urban racial redistribution in the post—Civil rights period. Public Works Management and Policy 16: 40–58. [Google Scholar]
- Chiocchini, Raffaela, and Sandro Cruciani. 2009. L’accessibilità ai nodi infrastrutturali: Un’applicazione sperimentale attraverso l’uso di strumenti GIS. In Indicatori e Modelli Statistici per la Valutazione degli Squilibri Territoriali. Edited by Giorgio Alleva and Piero Demetrio Falorsi. Milano: Franco Angeli, pp. 309–42. [Google Scholar]
- Christiaanse, Suzan. 2020. Rural facility decline: A longitudinal accessibility analysis questioning the focus of Dutch depopulation-policy. Applied Geography 121: 102251. [Google Scholar] [CrossRef]
- Costa da Silva Firmino, Diego, J. Paul Elhorst, and Raul da Mota Silveira Neto. 2017. Urban and rural population growth in a spatial panel of municipalities. Regional Studies 51: 894–908. [Google Scholar] [CrossRef]
- Dalvi, M. Quasim, and Keith M. Martin. 1976. The measurement of accessibility: Some preliminary results. Transportation 5: 17–42. [Google Scholar] [CrossRef]
- Darwent, David F. 1969. Growth poles and growth centers in regional planning—A review. Environment and Planning A 1: 5–31. [Google Scholar] [CrossRef]
- De Montis, Andrea, and Aura Reggiani. 2012. JTG special section on accessibility and socio-economic activities: Methodological and empirical aspects. Journal of Transport Geography 25: 95–97. [Google Scholar] [CrossRef]
- Debrezion, Ghebreegziabiher, Eric Pels, and Piet Rietveld. 2007. The impact of railway stations on residential and commercial property value: A meta-analysis. The Journal of Real Estate Finance and Economics 35: 161–80. [Google Scholar] [CrossRef]
- Delfmann, Heike. 2014. Why start a business in a declining rural area with an ageing society? A UK–NL case study. Presented at the 54th Congress of the European Regional Science Association: “Regional Development and Globalisation: Best Practices”, St. Petersburg, Russia, August 26–29. [Google Scholar]
- Ehrenhalt, Alan. 2012. The Public Service Heritage. In Human Resource Management in Public Service: Paradoxes, Processes, and Problems. Thousand Oaks: SAGE Publications, p. 11. [Google Scholar]
- European Commission. 1999. European Spatial Development Perspective: Towards Balanced and Sustainable Development of the Territory of EU. Luxembourg: Publications Office for the European Union. [Google Scholar]
- Ewing, Reid. 1997. Is Los Angeles-style sprawl desirable? Journal of the American Planning Association 63: 107–26. [Google Scholar] [CrossRef]
- Farmer, Jane, Amy Nimegeer, John H. Farrington, and Gaener Rodger. 2012. Rural citizens’ rights to accessible health services: An exploration. Sociologia Ruralis 52: 134–44. [Google Scholar] [CrossRef]
- Farrell, Chad R. 2016. Immigrant suburbanisation and the shifting geographic structure of metropolitan segregation in the United States. Urban Studies 53: 57–76. [Google Scholar] [CrossRef]
- Fotheringham, A. Stewart, and Mehak Sachdeva. 2022. On the importance of thinking locally for statistics and society. Spatial Statistics 50: 100601. [Google Scholar] [CrossRef]
- Fotheringham, A. Stewart, Chris Brunsdon, and Martin Charlton. 2003. Geographically Weighted Regression: The Analysis of Spatially Varying Relationships. Hoboken: Wiley & Sons. [Google Scholar]
- Gesano, Giuseppe, and Salvatore Strozza. 2011. Foreign migrations and population aging in Italy. Genus 67: 83–104. [Google Scholar]
- Getis, Arthur, and Keith J. Ord. 1992. The analysis of spatial association by use of distance statistics. Geographical Analysis 24: 189–206. [Google Scholar] [CrossRef]
- Geurs, Karst T., and Bert van Wee. 2004. Accessibility evaluation of land-use and transport strategies: Review and research directions. Journal of Transport Geography 12: 127–40. [Google Scholar] [CrossRef]
- Geurs, Karst T., and Jan R. Ritsema van Eck. 2001. Accessibility Measures: Review and Applications. Evaluation of Accessibility Impacts of Land-Use Transportation Scenarios, and Related Social and Economic Impact. RIVM Rapport 408505006. Bilthoven: National Institute for Public Health and the Environment. [Google Scholar]
- Glaeser, Edward L., Jose A. Scheinkman, and Andrei Shleifer. 1995. Economic growth in a cross-section of cities. Journal of Monetary Economics 36: 117–43. [Google Scholar] [CrossRef]
- Golini, Antonio, Antonio Mussino, and Mira Savioli. 2000. Il Malessere Demografico in Italia. Una Ricerca sui Comuni Italiani. Bologna: Il Mulino. [Google Scholar]
- Graham, Daniel J., and Stephen Gibbons. 2019. Quantifying wider economic impacts of agglomeration for transport appraisal: Existing evidence and future directions. Economics of Transportation 19: 100121. [Google Scholar] [CrossRef]
- Graves, Philip E. 1983. Migration with a composite amenity: The role of rents. Journal of Regional Science 23: 541–46. [Google Scholar] [CrossRef]
- Gutiérrez, Javier, Ana Condeço-Melhorado, and Juan Carlos Martín. 2010. Using accessibility indicators and GIS to assess spatial spillovers of transport infrastructure investment. Journal of Transport Geography 18: 141–52. [Google Scholar] [CrossRef]
- Haartsen, Tialda, and Viktor Venhorst. 2010. Planning for decline: Anticipating on population decline in the Netherlands. Tijdschrift Voor Economische en Sociale Geografie 101: 218–27. [Google Scholar] [CrossRef]
- Handy, Susan L., and Debbie A. Niemeier. 1997. Measuring accessibility: An exploration of issues and alternatives. Environment and planning A 29: 1175–94. [Google Scholar] [CrossRef]
- Hansen, Walter G. 1959. How accessibility shapes land use. Journal of the American Institute of Planners 25: 73–76. [Google Scholar] [CrossRef]
- Harper, Sarah. 2014. Economic and social implications of aging societies. Science 346: 587–91. [Google Scholar] [CrossRef]
- Hiebert, Daniel. 2000. Immigration and the changing Canadian city. Canadian Geographer/Le Géographe Canadien 44: 25–43. [Google Scholar] [CrossRef]
- Iammarino, Simona, Andrés Rodriguez-Pose, and Michael Storper. 2019. Regional inequality in Europe: Evidence, theory and policy implications. Journal of Economic Geography 19: 273–98. [Google Scholar] [CrossRef]
- Isserman, Andrew M., Edward Feser, and Drake E. Warren. 2009. Why some rural places prosper and others do not. International Regional Science Review 32: 300–42. [Google Scholar] [CrossRef]
- ISTAT. 2023. L’Accessibilità dei Comuni alle Principali Infrastrutture di Trasporto. Rome: Statistiche Focus. [Google Scholar]
- Karou, Saleem, and Angela Hull. 2014. Accessibility modelling: Predicting the impact of planned transport infrastructure on accessibility patterns in Edinburgh, UK. Journal of Transport Geography 35: 1–11. [Google Scholar] [CrossRef]
- Kazemipur, Abdolmohammad, and Shiva Halli. 2000. The invisible barrier: Neighbourhood poverty and integration of immigrants in Canada. Journal of International Migration and Integration/Revue de l’Integration et de la Migration Internationale 1: 85–100. [Google Scholar] [CrossRef]
- Kneebone, Elizabeth, and Emily Garr. 2010. The Suburbanization of Poverty. Washington, DC: Brookings Institute. [Google Scholar]
- La Bianca, Marilena, and Francisco Navarro Valverde. 2019. Depopulation and aging in rural areas in the European Union: Practicing starting from the LEADER approach. Perspectives on Rural Development 3: 223–52. [Google Scholar]
- Litman, Todd. 2015. Evaluating Public Transit Benefits and Costs. Victoria: Victoria Transport Policy Institute. [Google Scholar]
- Lo, Lucia, Amir Shalaby, and Baha Alshalalfah. 2011. Relationship between immigrant settlement patterns and transit use in the Greater Toronto Area. Journal of Urban Planning and Development 137: 470–76. [Google Scholar] [CrossRef]
- Lucas, Karen. 2012. Transport and social exclusion: Where are we now? Transport Policy 20: 105–13. [Google Scholar] [CrossRef]
- Lundberg, Johan. 2006. Spatial interaction model of spillovers from locally provided public services. Regional Studies 40: 631–44. [Google Scholar] [CrossRef]
- Matthews, Stephen A., and Daniel M. Parker. 2013. Progress in spatial demography. Demographic Research 28: 271–312. [Google Scholar] [CrossRef]
- Matthews, Stephen A., and Tse-Chuan Yang. 2012. Mapping the results of local statistics: Using geographically weighted regression. Demographic Research 26: 151–66. [Google Scholar] [CrossRef]
- Melo, Patricia C., Conceiccao Rego, Paulo R. Anciães, Nuno Guiomar, and Josè Muñoz-Rojas. 2022. Does road accessibility to cities support rural population growth? Evidence for Portugal between 1991 and 2011. Journal of Regional Science 62: 443–70. [Google Scholar] [CrossRef]
- Moran, Patrick A.P. 1948. The interpretation of statistical maps. Journal of the Royal Statistical Society B 10: 243–51. [Google Scholar] [CrossRef]
- Moya-Gómez, Borja, Maria Henar Salas-Olmedo, Juan Carlos García-Palomares, and Javier Gutiérrez. 2018. Dynamic accessibility using big data: The role of the changing conditions of network congestion and destination attractiveness. Networks and Spatial Economics 18: 273–90. [Google Scholar] [CrossRef]
- Muti, Ördecan. 2023. Regional Population Diversity and Social Cohesion in the Local Context. Population Policy Discussion Paper, 20. Available online: https://population-europe.eu/files/documents/dp_reg_pop_div_web_18.07.pdf (accessed on 5 September 2024).
- Neumeier, Stefan. 2016. Accessibility to services in rural areas. disP–The Planning Review 52: 32–49. [Google Scholar] [CrossRef]
- OECD, The European Commission, Food and Agriculture Organization of the United Nations, United Nations Human Settlements Programme, International Labour Organization, and The World Bank. 2021. Applying the Degree of Urbanisation: A Methodological Manual to Define Cities, Towns and Rural Areas for International Comparisons. In OECD Regional Development Studies. Paris: OECD Publishing. Brussels: European Union. [Google Scholar] [CrossRef]
- Ord, Keith J., and Arthur Getis. 1995. Local spatial autocorrelation statistics: Distributional issues and an application. Geographical Analysis 24: 286–306. [Google Scholar] [CrossRef]
- Oshan, Taylor M., Ziqi Li, Wei Kang, Levi J. Wolf, and A. Stewart Fotheringham. 2019. Mgwr: A Python implementation of multiscale geographically weighted regression for investigating process spatial heterogeneity and scale. ISPRS International Journal of Geo-Information 8: 269. [Google Scholar] [CrossRef]
- Ozbay, Kaan, Dilruba Ozmen, and Joseph Berechman. 2006. Modeling and analysis of the link between accessibility and employment growth. Journal of Transportation Engineering 132: 385–93. [Google Scholar] [CrossRef]
- Panagiotopoulos, George, and Dimitris Kaliampakos. 2024. Accessibility, rural depopulation & the Modified Areal Unit Problem: An analysis of mainland Greece. European Journal of Geography 15: 42–53. [Google Scholar]
- Partridge, Mark D., Dan S. Rickman, Kamar Ali, and M. Rose Olfert. 2008. The geographic diversity of US nonmetropolitan growth dynamics: A geographically weighted regression approach. Land Economics 84: 241–66. [Google Scholar] [CrossRef]
- Patuelli, Roberto, Aura Reggiani, Sean P. Gorman, Peter Nijkamp, and Franz-Josef Bade. 2007. Network analysis of commuting flows: A comparative static approach to German data. Networks and Spatial Economics 7: 315–31. [Google Scholar] [CrossRef]
- Rasker, Ray, Patricia H. Gude, Justin A. Gude, and Jeff Van den Noort. 2009. The economic importance of air travel in high-amenity rural areas. Journal of Rural Studies 25: 343–53. [Google Scholar] [CrossRef]
- Rees, Philip, Nicole van der Gaag, Joop de Beer, and Frank Heins. 2012. European regional populations: Current trends, future pathways and policy options. European Journal of Population 28: 385–416. [Google Scholar] [CrossRef]
- Reitz, Jeffrey G. 2002. Host societies and the reception of immigrants: Research themes, emerging theories and methodological issues. International Migration Review 36: 1005–19. [Google Scholar] [CrossRef]
- Reynaud, Cecilia, and Sara Miccoli. 2023. Demographic sustainability in Italian territories: The link between depopulation and population ageing. Vienna Yearbook of Population Research 21: 1–22. [Google Scholar] [CrossRef]
- Reynaud, Cecilia, Sara Miccoli, Federico Benassi, Alessia Naccarato, and Luca Salvati. 2020. Unravelling a demographic ‘Mosaic’: Spatial patterns and contextual factors of depopulation in Italian Municipalities, 1981–2011. Ecological Indicators 115: 106356. [Google Scholar] [CrossRef]
- Roback, Jennifer. 1982. Wages, rents, and the quality of life. Journal of political Economy 90: 1257–78. [Google Scholar] [CrossRef]
- Rodríguez-Rodríguez, David, and Remedios Larrubia Vargas. 2022. Protected areas and rural depopulation in Spain: A multi-stakeholder perceptual study. Land 11: 384. [Google Scholar] [CrossRef]
- Rosina, Alessandro, and Roberto Impicciatore. 2022. Storia Demografia d’Italia. Crescita, Crisi e Sfide. Rome: Carocci, pp. 1–187. [Google Scholar]
- Salvati, Luca. 2014. Population distribution and urban growth in Southern Italy, 1871–2011: Emergent polycentrism or path-dependent monocentricity? Urban Geography 35: 440–53. [Google Scholar] [CrossRef]
- Sánchez-Mateos, Martínez, and Ruiz A. R. Pulpón. 2021. Closeness is not accessibility: Isolation and depopulated rural areas in the proximity of metropolitan urban areas, a case-study in inland Spain. European Countryside 13: 410–35. [Google Scholar] [CrossRef]
- Shelukdov, Alexander, Johannes Kamp, and Daniel Müller. 2020. Decreasing labor intensity in agriculture and the accessibility of major cities shape the rural population decline in postsocialist Russia. Eurasian Geography and Economics 62: 481–506. [Google Scholar]
- Solé-Ribalta, Albert, Sergio Gómez, and Alex Arenas. 2018. Decongestion of urban areas with hotspot pricing. Networks and Spatial Economics 18: 33–50. [Google Scholar] [CrossRef]
- Staniscia, Barbara, and Federico Benassi. 2018. Does regional development explain international youth mobility? Spatial patterns and global/local determinants of the recent emigration of young Italians. Belgeo. Reveu Belge de Géographie 3: 1–25. [Google Scholar]
- Stepniak, Marcin, and Piotr Rosik. 2018. The role of transport and population components in change in accessibility: The influence of the distance decay parameter. Networks and Spatial Economics 18: 291–312. [Google Scholar] [CrossRef]
- Strozza, Salvatore, Federico Benassi, Raffaele Ferrara, and Gerardo Gallo. 2016. Recent demographic trends in the major Italian urban agglomerations: The role of foreigners. Spatial Demography 4: 39–70. [Google Scholar] [CrossRef]
- Termote, Marc. 2005. Implicazioni urbane dei mutamenti demografici e economici nei paesi sviluppati. Il caso Italiano. Rivista Italiana di Economia, Demografia e Statistica 54: 75–85. [Google Scholar]
- Thompson, Chris, and Tim Bawden. 1992. What are the potential economic development impacts of high-speed rail? Economic Development Quarterly 6: 297–319. [Google Scholar] [CrossRef]
- Tragaki, Alexandra, and Antonis Rovolis. 2014. Immigrant population in Italy during the first decade of the 21st century: Changing demographics and modified settlement patterns. European Urban and Regional Studies 21: 286–300. [Google Scholar] [CrossRef]
- Van den Heuvel, Frank P., Liliana Rivera, Karel H. Van Donselaar, Ad de Jong, Yossi Sheffi, Peter W. de Langen, and Jan C. Fransoo. 2014. Relationship between freight accessibility and logistics employment in US counties. Transportation Research Part A: Policy and Practice 59: 91–105. [Google Scholar] [CrossRef]
- Vickerman, Roger. 1974. Accessibility, attraction, and potential: A review of some concepts and their use in determining mobility. Environment and Planning A 6: 675–91. [Google Scholar] [CrossRef]
- Vickerman, Roger, Klaus Spiekermann, and Michael Wegener. 1999. Accessibility and economic development in Europe. Regional Studies 33: 1–15. [Google Scholar] [CrossRef]
- Viesti, Gianfranco. 2021. Centri e Periferie: Europa, Italia, Mezzogiorno dal XX al XXI Secolo. Bari: Giuseppe Laterza e Figli. [Google Scholar]
- Voss, Paul R., and Guangqing Chi. 2006. Highways and population change. Rural Sociology 71: 33–58. [Google Scholar] [CrossRef]
- Wang, Qingfang. 2008. Race/ethnicity, gender and job earnings across metropolitan areas in the United States: A multilevel analysis. Urban Studies 45: 825–43. [Google Scholar] [CrossRef]
- Wolff, Manuel, and Thorsten Wiechmann. 2018. Urban growth and decline: Europe’s shrinking cities in a comparative perspective 1990–2010. European Urban and Regional Studies 25: 122–39. [Google Scholar] [CrossRef]
- Yu, Hanchen, A. Stewart Fotheringham, Ziqi Li, Taylor Oshan, Wei Kang, and Levi John Wolf. 2020. Inference in multiscale geographically weighted regression. Geographical Analysis 52: 87–106. [Google Scholar] [CrossRef]
- Zambon, Ilaria, Kostas Rontos, Cecilia Reynaud, and Luca Salvati. 2020. Toward an unwanted divided? Fertility decline and the North-South divide in Italy, 1952–2018. Quality and Quantity 54: 169–87. [Google Scholar] [CrossRef]


| Model | Beta | p-Value |
|---|---|---|
| model 1 (SOP = f RAI) | −0.326 | 0.000 |
| model 2 (SFP = f RAI) | 0.179 | 0.000 |
| R2 model 1 | 0.106 | |
| R2 model 2 | 0.032 | |
| AIC model 1 | 21,542.626 | |
| AIC model 2 | 22,173.894 | |
| Moran’s I model 1 residuals | 0.578 | |
| Moran’s I model 2 residuals | 0.578 | |
| Model | Mean | Standard Deviation |
|---|---|---|
| model 1 (SOP = f RAI) | −0.567 | 2.840 |
| R2 | 0.677 | |
| AIC | 15,030.774 | |
| Moran’s I model 1 residuals | 0.036 | |
| model 2 (SFP = f RAI) | 0.288 | 1.629 |
| R2 | 0.608 | |
| AIC | 16,568.788 | |
| Moran’s I model 2 residuals | 0.036 | |
Disclaimer/Publisher’s Note: The statements, opinions and data contained in all publications are solely those of the individual author(s) and contributor(s) and not of MDPI and/or the editor(s). MDPI and/or the editor(s) disclaim responsibility for any injury to people or property resulting from any ideas, methods, instructions or products referred to in the content. |
© 2024 by the authors. Licensee MDPI, Basel, Switzerland. This article is an open access article distributed under the terms and conditions of the Creative Commons Attribution (CC BY) license (https://creativecommons.org/licenses/by/4.0/).
Share and Cite
Armenise, M.; Benassi, F.; Carella, M.; Misuraca, R. Accessibility and Older and Foreign Populations: Exploring Local Spatial Heterogeneities across Italy. Economies 2024, 12, 248. https://doi.org/10.3390/economies12090248
Armenise M, Benassi F, Carella M, Misuraca R. Accessibility and Older and Foreign Populations: Exploring Local Spatial Heterogeneities across Italy. Economies. 2024; 12(9):248. https://doi.org/10.3390/economies12090248
Chicago/Turabian StyleArmenise, Massimo, Federico Benassi, Maria Carella, and Roberta Misuraca. 2024. "Accessibility and Older and Foreign Populations: Exploring Local Spatial Heterogeneities across Italy" Economies 12, no. 9: 248. https://doi.org/10.3390/economies12090248
APA StyleArmenise, M., Benassi, F., Carella, M., & Misuraca, R. (2024). Accessibility and Older and Foreign Populations: Exploring Local Spatial Heterogeneities across Italy. Economies, 12(9), 248. https://doi.org/10.3390/economies12090248