Abstract
Measuring financial performance is pivotal not only for assessing a firm’s current health but also for informing strategic decisions that shape its long-term trajectory. This study investigates how macroeconomic volatility affects the firm profitability across five major sectors in Türkiye—industrial manufacturing, food, beverage and tobacco, chemicals and plastics, technology, and energy—during the turbulent period from 2016 to 2023. Using return on assets (ROA) and return on equity (ROE) as performance indicators, we apply panel data regression to test the impact of inflation, interest rates, unemployment, and a novel Macroeconomic Stress Index (MSI), which combines inflation and exchange rate volatility. The results reveal significant sectoral differences: firms in chemicals and manufacturing outperformed others in ROA, likely benefiting from export incentives and scale efficiencies, while energy and food sectors underperformed, constrained by regulations and cost rigidity. Notably, MSI showed a consistent and significant positive effect on both ROA and ROE, suggesting that many firms responded to macroeconomic stress by restructuring operations and improving efficiency. In contrast, interest rates had a strong negative effect on profitability, confirming the sensitivity of firms to financing costs. These findings underscore the need for targeted sector-level policy support and highlight the importance of internal adaptive capabilities in maintaining the firm’s performance under sustained economic stress.
1. Introduction
In an increasingly volatile global economy, the performance of firms is not solely determined by internal strategies but is also profoundly shaped by broader macroeconomic conditions. Fluctuations in inflation, interest rates, unemployment rate, GDP growth, exchange rates, etc. introduce significant uncertainty that can undermine firm profitability, planning, and investment. While the relationship between macroeconomic variables and the firm’s performance has been widely studied (Kandir, 2008; Shah & Siddiqui, 2019; Mitra et al., 2023), much of the existing literature concentrates on short-term shocks, specific industries, or relatively stable developed economies. There remains a limited understanding of how prolonged macroeconomic instability affects the firm’s performance, especially across sectors in emerging markets where economic volatility is structural rather than episodic. Several emerging market studies have examined the effects of macroeconomic conditions on firm outcomes (Barakat et al., 2016; Nguyen & Nguyen, 2020). However, few have explored sectoral heterogeneity during periods of sustained economic distress, nor have they focused on the compound effects of inflation, currency devaluation, and inconsistent policy environments over the long term. Moreover, most macro-finance literature emphasizes either firm-specific determinants or broader market trends, with limited integration between firm-level financial performance and persistent macroeconomic risks.
This study addresses this gap by focusing on Türkiye, an upper-middle-income emerging economy that experienced severe and prolonged macroeconomic volatility between 2016 and 2023. During this period, inflation rose from 7.7% to over 72%, while the Turkish lira depreciated from 3 TRY/USD to 34 TRY/USD. Even with high inflation, the government chose to keep interest rates low to boost growth and jobs, which was an unusual strategy. These developments were compounded by external shocks such as the COVID-19 pandemic, shifting geopolitical alliances, and fluctuating trade dynamics (OECD, 2023). For firms, these macroeconomic conditions led to rising input costs, balance sheet vulnerabilities, and strategic uncertainty, particularly for those reliant on imports or foreign currency financing.
In response to its economic challenges, the Turkish government introduced a range of policy interventions spanning monetary, fiscal, and structural reforms. The Central Bank implemented measures to stabilize the Turkish lira and address liquidity issues, though keeping interest rates low amid rising inflation was criticized for potentially exacerbating price pressures (Ministry of Treasury and Finance of Turkey, 2023). Fiscal policies, including targeted tax breaks, subsidies, and increased public spending, were designed to support key industries and boost domestic demand; however, these measures also expanded the fiscal deficit and raised concerns over long-term debt sustainability (World Bank, 2024). Structural reforms in labor, energy, and public administration were rolled out with the goal of modernizing the economy and drawing in foreign investment. However, these efforts sometimes led to increased sectoral imbalances and added to the overall uncertainty. While these initiatives have offered temporary relief and improved economic stability, experts argue that a more coordinated and well-planned policy approach is necessary for sustained growth. The success of Türkiye’s response to its economic challenges remains a matter of ongoing discussion.
Despite the global relevance of these issues, few studies have empirically examined how such extended macroeconomic instability impacts different sectors of the economy. This research seeks to fill that void by asking: How do inflation, exchange rate volatility, unemployment rate, and interest rates affect the firm’s performance across different sectors in Türkiye? Are some sectors more resilient to macroeconomic shocks than others? We assess the firm’s performance using return on assets (ROA) and return on equity (ROE), two accounting-based measures widely used to evaluate operational efficiency and profitability. While alternative market-based indicators such as Tobin’s Q provide insights into the firm valuation, they are particularly sensitive to speculative market movements, which may be distorted in volatile and inflationary environments like Türkiye’s. ROA and ROE thus offer a more stable reflection of firm fundamentals in such settings.
To capture sectoral heterogeneity in the response to macroeconomic volatility, this study focuses on five key industries: industrial manufacturing; food, beverages, and tobacco; energy; chemicals and plastics; and technology. These sectors were selected due to their economic significance, structural differences, and varying levels of exposure to macroeconomic risks. Industrial manufacturing and energy are highly sensitive to input costs and currency fluctuations, making them particularly vulnerable during inflationary and volatile exchange rate environments (OECD, 2021). Food, beverages, and tobacco, while essential, face margin pressures due to supply chain disruptions and price sensitivity among consumers, especially in inflationary contexts (FAO, 2021). The chemicals and plastics sector, as a key supplier of intermediate goods, is closely tied to global commodity markets and foreign exchange dynamics (PAGEV, 2023). In contrast, the technology sector, though less import-intensive, provides insights into how more agile, innovation-driven firms respond to prolonged uncertainty. Technology firms often show higher resilience due to their lighter capital structure, digital business models, and ability to scale in uncertain environments (Deloitte, 2023). Together, these sectors offer a representative cross-section of Türkiye’s industrial landscape and enable a deeper understanding of how different industries navigate macroeconomic stress.
This study contributes to the literature in three key ways. First, by examining sector-specific dynamics, we provide new empirical insights into how macroeconomic volatility affects firms differently. Second, we use recent firm-level data from a uniquely unstable period in Türkiye’s economy, offering a fresh perspective on long-term exposure to volatility. Third, our findings carry practical implications for both policymakers and corporate strategists navigating sustained macroeconomic risks in emerging markets. Preliminary results suggest that macroeconomic volatility does not impact all sectors uniformly. Energy and manufacturing firms are particularly vulnerable to inflation and exchange rate shocks, while technology firms demonstrate greater resilience, likely due to their lower dependence on physical inputs and imported capital goods. These insights can inform more targeted macroprudential policies and firm-level strategies in similarly unstable economic environments.
2. Literature Review
2.1. Theoretical Framework
This study explores how macroeconomic factors impact firm profitability by leveraging four key theoretical frameworks: Keynesian economic theory, the structure–conduct–performance (SCP) paradigm, and the resource-based view (RBV) with dynamic capabilities, and financial theory frameworks such as DuPont analysis and capital structure theory. These frameworks help explain how both external economic conditions and internal resources shape company performance.
Keynesian economics highlights the role of aggregate demand in driving both economic and firm’s performance. According to Keynes (1936), factors like GDP growth, government spending, and monetary policies directly influence consumer demand, which impacts a firm’s revenue and costs. In times of economic growth, increased consumer spending and investment foster favorable conditions for profitability. In contrast, during recessions, declining demand reduces revenue, harming the firm’s performance. In Türkiye, periods of high inflation and inconsistent monetary policy have historically constrained aggregate demand, contributing to volatile profitability trends. This theory offers a foundational lens to assess how Turkish firms respond to shifts in economic activity.
The SCP paradigm, introduced by Bain (1951) focuses on how the structure of an industry influences firm behavior and outcomes. It suggests that macroeconomic factors like inflation, interest rates, and trade policies shape industry structure, which affects firms’ strategies (e.g., pricing, investments) and profitability. For example, inflation raises production costs, while trade policy changes can alter market dynamics, influencing export and import opportunities. Currency fluctuations, inflationary pressures, or restrictive trade policies may challenge firms, while favorable trade environments create new opportunities to boost profitability. This framework is particularly relevant for Türkiye where frequent macroeconomic fluctuations such as high inflation rates, volatile exchange rates, and shifting trade policies directly reshape industry structures, compelling firms to constantly adapt their strategies to sustain competitiveness and profitability.
The resource-based view (RBV), developed by Barney (1991) and its extension through dynamic capabilities (Teece et al., 1997) focus on how internal resources help firms gain and sustain a competitive edge. The RBV argues that firms with unique and hard-to-replicate resources achieve superior performance. The concept of dynamic capabilities builds on this by emphasizing a firm’s ability to adapt to shifting macroeconomic conditions. For instance, firms equipped with advanced technology, efficient supply chains, or strong market intelligence are better positioned to navigate challenges like volatile exchange rates, inflation, or trade policy changes. These capabilities enable them to maintain profitability even in uncertain or adverse economic environments. In Türkiye’s frequently unstable macroeconomic environment, characterized by currency volatility, inflation, and policy unpredictability, the RBV and dynamic capabilities frameworks are especially critical as firms must leverage distinctive internal strengths and rapidly adapt to survive and thrive amid economic turbulence.
Beyond economic and strategic frameworks, financial theory offers critical insights into the relationship between macroeconomic factors and the firm profitability, particularly through metrics such as return on assets (ROA) and return on equity (ROE). The DuPont analysis breaks down these indicators into components like operational efficiency, asset turnover, and financial leverage—all of which are shaped by macroeconomic forces. For example, rising inflation and interest rates elevate borrowing costs, diminishing net income and ROE. Exchange rate fluctuations can also distort asset valuations and revenue streams, thereby influencing ROA. Capital structure theory (Modigliani & Miller, 1958) adds that interest rate conditions affect firms’ leverage decisions, with higher rates often prompting firms to cut debt to reduce financial burdens, ultimately impacting ROE. These financial viewpoints enhance economic and resource-based models by directly linking external macroeconomic shocks to internal financial outcomes.
While the core analysis in this study are built upon Keynesian theory, the SCP paradigm, RBV with dynamic capabilities, and financial theory frameworks, further support from corporate finance theory helps enrich the theoretical foundation. For instance, signaling theory (Spence, 1973; Ross, 1977) complements capital structure analysis by suggesting that firms adjust financial policies—such as leverage or dividend decisions—not only for operational reasons but also to convey stability and confidence during volatile macroeconomic periods. In environments like Türkiye, where uncertainty around inflation, interest rates, and currency movements is frequent, such signals become crucial in shaping investor expectations and access to financing. Similarly, asset pricing theory, particularly Merton’s (1973) intertemporal CAPM, provides insight into how shifts in macroeconomic conditions affect risk premiums and cost of capital. These dynamics, in turn, influence investment decisions and profitability metrics such as ROE and ROA. Furthermore, macroeconomic volatility—defined as fluctuations in key indicators like GDP growth, inflation, exchange rates, and interest rates—can be formally modeled using statistical tools such as standard deviations, rolling variances, or GARCH models (Engle, 1982; Bloom, 2009), allowing a more precise assessment of its impact. By integrating these perspectives, the theoretical framework gains additional robustness, linking external shocks to internal financial responses and reinforcing the empirical relevance of the chosen financial performance indicators.
In summary, while each framework captures different dimensions of the macro-firm profitability nexus, their integration is essential for a comprehensive analysis. Keynesian theory sets the macroeconomic backdrop; SCP explains industry-level responses; financial theories quantify performance shifts; but it is RBV and dynamic capabilities that best explain why some firms outperform others under identical economic conditions. This theoretical synergy is especially relevant in Türkiye where firms operate under persistent economic volatility and must continuously adapt to sustain profitability. Furthermore, these frameworks are not only conceptual tools but are also tightly interwoven with the empirical realities documented in the following section. By applying these theories to real-world data, particularly within the unique and fluctuating economic context of Türkiye, we aim to bridge the gap between theoretical expectations and the observed firm behavior.
2.2. Empirical Analysis
The section provides a summary of various empirical studies conducted over the years on similar topics in both Türkiye and globally. It also seeks to link these empirical findings with the theoretical frameworks presented earlier, illustrating how economic theory and firm-level realities intersect.
Pacini et al. (2017) analyzed the effects of macroeconomic variables on the profitability of the top 100 firms in the United Kingdom from 2000 to 2014. Using panel data and dynamic factor estimators, they found that GDP, inflation, and debt interest metrics positively influence firm profitability. In contrast, exchange rates, interest rates, and short-term foreign debt ratios negatively impact performance. The results suggest that stable macroeconomic conditions are crucial for enhancing profitability, particularly for large firms that significantly contribute to the national economy. Similarly, Issah and Antwi (2017) focused on 116 public-listed UK companies from 2002 to 2014, excluding financial firms and utilities. They applied principal component analysis (PCA) to identify key macroeconomic predictors and used multiple regression to examine relationships with the firm’s performance, using ROA as a measure. Key findings included significant effects of lagged ROA, unemployment rates, real GDP, and exchange rates, with notable variations across industries. These studies reinforce the importance of macroeconomic stability and historical performance metrics while illustrating how external conditions can exert differentiated effects across sectors, particularly in advanced economies.
Isiaka et al. (2018) investigated profitability determinants among agricultural firms in Nigeria using panel data from 2008 to 2016. Their multiple regression analysis revealed liquidity and sales growth significantly and positively influenced return on equity (ROE), while leverage negatively affected it, and operating expenses efficiency had an insignificant negative impact. These findings highlight the significance of managing liquidity and promoting sales growth to improve profitability in the agricultural sector, a critical area in Nigeria’s non-oil economy. Egbunike and Okerekeoti (2018) extended this focus on emerging markets by examining consumer goods firms listed on the Nigerian Stock Exchange from 2011 to 2017. Their study applied multiple linear regression to assess how macroeconomic variables and firm-specific factors influence ROA. GDP growth, firm size, leverage, and liquidity were found to positively impact ROA, while inflation exerted a significant negative effect. Interest and exchange rates, however, showed no significant influence. G. A. A. O. Dewi et al. (2019) contributed to this literature with their study of fast-moving consumer goods (FMCG) firms in Indonesia from 1998 to 2016. Their findings indicate that GDP growth positively impacts profitability, while inflation, unemployment, and exchange rates do not exhibit significant effects. These studies collectively emphasize the importance of macroeconomic growth and firm-specific strategies in navigating profitability challenges in emerging economies.
Shah and Siddiqui (2019) analyzed the impact of macroeconomic variables on ROA across seven industries in Pakistan from 2000 to 2014. Using regression analysis, they found significant sector-specific variations in how inflation, exchange rates, foreign direct investment (FDI), unit labor costs, and unemployment influence financial performance. Inflation negatively affected most industries, such as textiles, auto, food, ceramics, and cement, but positively influenced the sugar and garments sectors. Exchange rates were significant across most industries, FDI positively influenced food and cement, and unit labor costs negatively impacted ROA across the board. Meanwhile, Mitra et al. (2023) examined the impact of India’s economic growth on manufacturing firms from 2004-05 to 2021–22 using a two-step generalized method of moments model. They have found that GDP growth significantly enhances the firm’s performance, with smaller and younger firms being more sensitive to economic changes. Internal factors like firm size, sales growth, and profitability were key drivers, while external conditions during financial crises diminished market-based performance. These findings underline the critical interplay of macroeconomic conditions, sectoral nuances, and firm-specific characteristics, emphasizing the need for tailored strategies to address economic sensitivities.
Nikmah and Hung (2024) focused on Shariah-compliant firms (SCFs) in Indonesia between 2011 and 2020, evaluating the influence of firm-specific factors, macroeconomic variables, and the ASEAN Economic Community (AEC) on the firm’s performance and value using structural equation modeling. They found that firm characteristics such as age, size, and efficiency, along with economic growth and trade openness, positively influenced financial performance. However, foreign ownership and AEC participation negatively impacted firm value, highlighting challenges associated with regional integration under the AEC framework. Similarly, Sayem et al. (2024) investigated Bangladeshi commercial banks from 2010 to 2021, employing multiple linear regression and factor analysis to assess the effects of GDP, inflation, interest rates, imports, and exchange rates on financial performance. Inflation and imports were significant positive predictors of performance, while exchange rates negatively impacted financial outcomes. GDP and imports emerged as critical predictors in the factor analysis, with the combined model providing the best fit. These studies demonstrate the complexities of navigating regional and global economic shifts, emphasizing the need for adaptive strategies that align with specific market conditions and broader macroeconomic trends.
Gul et al. (2022) and Almamy et al. (2023) both investigated the influence of macroeconomic factors on corporate investment decisions using firm-level data. Gul et al. analyzed 12 Asian countries from 2007 to 2016 using panel regression, finding that GDP growth, inflation, interest rates, and especially financial development significantly shape investment behavior, with notable cross-country differences. Almamy et al. focused on six GCC countries from 2007 to 2020, using the system GMM to address endogeneity, and found that economic growth, financial development, and inflation positively impact investment, while FDI negatively affects it due to increased market competition. Both studies underscore the critical role of macroeconomic stability and financial development, urging policymakers and firms to factor in macro-level dynamics when crafting investment strategies.
In Türkiye, several research studies have been conducted to analyze the impact of macroeconomic factors on firm profitability and the researchers reached different outcomes. The study by Kandir (2008) examined the influence of macroeconomic factors on stock returns in Türkiye over the period from July 1997 to June 2005. Focusing on non-financial firms listed on the Istanbul Stock Exchange (ISE), it employed a macroeconomic factor model and multiple regression analysis with seven variables, including exchange rate, inflation, interest rates, and world market returns. Portfolios were constructed based on firm characteristics such as market equity, book-to-market ratio, and leverage. The findings highlight that exchange rates, interest rates, and world market returns significantly influence stock returns, while factors like industrial production and oil prices show no considerable impact. This study emphasizes the increasing integration of Turkish markets into global systems and reveals that not all macroeconomic factors are equally influential in shaping stock returns. Similarly, Şule’s (2009) research investigated the impact of macroeconomic indicators such as the consumer price index (CPI), producer price index (PPI), exchange rates, interest rates, and capacity utilization rates on financial performance metrics for food and beverage firms listed on the Istanbul Stock Exchange (IMKB) between 1998 and 2007. Using linear regression analysis, the study found that CPI and PPI were strongly correlated with profitability indicators like return on equity (ROE), return on assets (ROA), and return on sales (ROS), while EBIT and EBITDA were more influenced by capacity utilization rates, and NOPAT was determined by interest rates. These results underscore the need for firms to integrate macroeconomic trends into financial planning, highlighting sector-specific insights that demand tailored financial strategies to mitigate adverse effects of economic fluctuations.
The investigation by Coşkun and Topaloğlu (2016) analyzes data from firms listed on the Borsa Istanbul 100 Index between 2010 and 2015 using panel data analysis. The research uncovers significant relationships between financial performance indicators such as ROA, ROE, and ROS and macroeconomic variables like exchange rates, inflation rates, interest rates, and public infrastructure investments. The study highlights the varying directions and magnitudes of these relationships, emphasizing the importance of macroeconomic conditions in shaping firms’ financial outcomes. This provides valuable insights for managers and policymakers aiming to enhance resilience against economic fluctuations. Similarly, the study by Polat and Peker (2016) focuses on the Turkish automotive sector from 1993 to 2012. By employing correlation and multiple regression analysis, the research examines the impact of macroeconomic indicators, including inflation, exchange rate, GDP growth, and unemployment, on the firm’s performance metrics like revenues and profits. It finds that investment levels, GDP growth, and exports positively influence the firm’s performance, while inflation and unemployment have mixed or negative effects. These findings underline the critical role of macroeconomic stability in shaping financial outcomes within the automotive sector, offering actionable insights for both policymakers and business leaders navigating external economic environments. Together, these studies underscore the complex and varied impacts of macroeconomic factors across different industries and time periods in Türkiye.
While Keynesian and SCP theories help explain broad macroeconomic and industry-level shifts, the RBV and financial theories capture the firm-specific dynamics that often determine performance outcomes. However, most empirical studies reviewed here treat macroeconomic variables and the firm’s performance in isolation or with limited theoretical anchoring, lacking integrative frameworks that combine internal and external perspectives.
Despite the valuable insights provided by prior empirical and theoretical research, a significant gap remains. Few studies offer a comprehensive integration of macroeconomic theory with firm-level strategic and financial responses, especially within emerging economies like Türkiye. Many empirical analysis either remain overly descriptive or fail to fully leverage theoretical models such as RBV or SCP. Moreover, the context-specific nature of economic shocks in Türkiye marked by persistent inflation, currency depreciation, and policy shifts demands a more nuanced approach that connects the firm’s performance to both external volatility and internal adaptive capabilities. Addressing this gap is crucial for developing targeted strategies and policy recommendations. Therefore, this study seeks to bridge the theoretical and empirical divide by explicitly applying a multi-theoretical lens to firm-level data in Türkiye, aiming to deliver a more robust and contextually relevant understanding of the profitability–macroeconomy relationship.
2.3. Hypothesis Development
Drawing from theoretical frameworks and prior empirical research, this study formulates two hypotheses to assess how macroeconomic factors influence the firm’s performance in Türkiye. These hypotheses address both the external challenges of economic instability and the internal strengths that may help firms mitigate such risks.
Hypothesis 1:
Macroeconomic volatility reduces firm profitability (measured by ROA and ROE), with sector-specific variations.
This hypothesis is rooted in Keynesian and Structure–conduct–performance (SCP) theories, which argue that broader economic conditions and industry dynamics shape firm outcomes. Empirical findings consistently show that inflation and exchange rate fluctuations hurt profitability, particularly in import-dependent or globally exposed sectors. In Türkiye, persistent volatility has significantly impacted manufacturing, energy, and chemical industries.
Hypothesis 2:
Firms with stronger adaptive capabilities are more resilient in sustaining profitability during periods of economic instability.
Based on the resource-based view and dynamic capabilities framework, this hypothesis suggests that internal assets like digital infrastructures, lean operations, and flexible strategies enhance a firm’s ability to absorb external shocks. Research highlights that tech-oriented firms often maintain stable profits under volatile conditions. In Türkiye, such capabilities are crucial in distinguishing high-performing firms.
3. Methodology
This part of the research contains sections about the data collection, the variable selection, and the identification of appropriate econometric models and diagnostic tests.
3.1. Data Collection
As previously mentioned, this research examines the impact of macroeconomic factors on the firm’s performance, focusing on five sectors in Türkiye: industrial manufacturing; food, beverage, and tobacco; chemicals and plastics; energy; and technology. Macroeconomic data, including the unemployment rate, real GDP growth, inflation rate, and official exchange rate from 2016 to 2023, were obtained from the World Bank (Available at: https://data.worldbank.org/, accessed on 20 October 2024). Data for the yearly average interest rate were collected from the website of the Central Bank of the Republic of Türkiye (Available at: https://www.tcmb.gov.tr, accessed on 20 October 2024). Meanwhile, the financial statements of companies, sourced from the Public Disclosure Platform of the Republic of Türkiye (Available at: https://www.kap.org.tr/en/kalem-karsilastirma, accessed on 5 November 2024), serve as the primary source for profitability ratios.
The sample consists of 135 publicly listed firms from the Borsa Istanbul (BIST) Stock Exchange, covering the 5 most economically significant sectors in Türkiye. These firms were selected based on data availability from the Public Disclosure Platform (KAP) and consistent financial reporting over the 2016–2023 period. While Türkiye has over 1,000,000 registered firms across all sectors (Turkish Statistical Institute, 2023), only approximately 470 firms are listed on BIST, and even fewer provide complete financial data suitable for longitudinal analysis. Our sample represents roughly 29% of all BIST-listed non-financial firms and accounts for a substantial share of sectoral output in manufacturing, technology, energy, and chemicals, which are core drivers of Türkiye’s industrial economy. Although not fully representative of small and medium-sized enterprises (SMEs), the sample reflects the behavior of Türkiye’s largest and most strategically relevant firms—those most affected by macroeconomic volatility and most likely to shape employment, trade, and investment trends. Details of the samples are indicated in Table 1.

Table 1.
The details of sample companies.
3.2. Variable Selection
In previous studies, researchers analyzing similar topics have commonly used multiple regression models as a statistical tool. These models are among the most effective methods for examining the relationship between two or more datasets. In our study, we aim to assess the impact of capital structure on the firm’s performance using three types of variables: independent, dependent, and control variables. The dependent variables represent performance indicators, with return on assets (ROA) and return on equity (ROE) selected due to their widespread use and relevance in the literature. Notably, Sayem et al. (2024) and Mitra et al. (2023) utilized similar indicators in their analysis. For the independent variables, we incorporate macroeconomic factors such as the unemployment rate, yearly average interest rate of the Central Bank of the Republic of Türkiye, real GDP growth ((Real GDPt—Real GDPt−1)/Real GDPt−1), and Macroeconomic Stress Index (MSI).
The Macroeconomic Stress Index (MSI), defined as Inflation × Exchange Rate, captures macroeconomic instability by integrating two highly correlated variables into a single measure. This helps mitigate multicollinearity in econometric models while reflecting economic pressure on firms and investments. Unlike broad indices like the Financial Conditions Index or the Economic Policy Uncertainty Index, which often rely on advanced financial market data or text-based sentiment from news sources, the Macroeconomic Stress Index (MSI) used in this study is tailored to emerging markets like Türkiye where inflation and exchange rate volatility are the most immediate and measurable stress channels. Theoretical foundations include the Mundell–Fleming model (Mundell, 1963), which links inflation to currency depreciation, and purchasing power parity (Cassel, 1916), explaining how inflation differentials drive exchange rate fluctuations. Empirical studies support this relationship, with Dornbusch (1976) and Edwards and Savastano (1999), showing that inflation and exchange rate volatility jointly impact financial stability. Kilic (2020) further found that firms in high-inflation, volatile currency environments face greater financial distress. MSI provides a more stable, interpretable macroeconomic indicator for risk assessment and the firm’s performance analysis. These indicators provide critical insights into the broader economic environment, offering valuable guidance for policymakers and researchers in making well-informed decisions.
In this study, firm-specific financial indicators such as leverage, liquidity, and asset turnover are included as control variables to isolate the effects of macroeconomic conditions on the firm’s performance. These internal factors are well-established determinants of profitability and are essential for avoiding omitted variable bias in regression models. Leverage represents the extent of debt financing and is negatively associated with performance due to increased financial risk and interest burden (Isiaka et al., 2018). Liquidity, reflecting a firm’s short-term financial health, contributes positively to profitability by ensuring smooth operational functioning and reducing the risk of financial distress (Coşkun & Topaloğlu, 2016). Asset turnover captures how efficiently firms utilize their assets to generate revenue; higher turnover typically leads to stronger profitability outcomes (Aguade et al., 2022). Including these variables ensures that observed effects from macroeconomic indicators are not confounded by variations in internal operational efficiency or capital structure.
In addition to the main variables, we introduced five dummy variables. The use of dummy variables in econometric models serves to control categorical influences that may otherwise bias estimation results. Sectoral dummy variables are introduced to account for structural differences across industries, acknowledging that firms operate under diverse market, regulatory, and operational conditions. This approach is consistent with the fixed effects framework where industry-specific intercepts help isolate the impact of explanatory variables (Gujarati & Porter, 2009). To prevent perfect multicollinearity commonly known as the dummy variable trap, one sector is excluded and treated as a baseline, thereby enhancing the model’s interpretability and stability. Additionally, a COVID-19-period dummy is incorporated to capture the effects of the pandemic, a major exogenous shock that disrupted global markets, introduced volatility, and altered firm-level financial dynamics. Controlling such structural breaks is essential to maintaining econometric validity when analyzing the firm’s performance during turbulent periods (Baltagi, 2005). This methodological framework is in line with prior empirical studies, such as I. Dewi et al. (2019) who adopted a similar dummy-based approach in assessing sector-specific effects in Ethiopian industries. Table 2 below shows the summary of the variables selected for the analysis.
Table 2.
Summary of variables.
3.3. Econometric Model
Based on variables explained in previous paragraphs and hypotheses formulated in the Literature Review section of the research, I have built a multiple regression model, which will be applied to the data from five sectors, and the results will be interpreted separately, and the sectoral differences and similarities will be highlighted.
where,
Profitability (ROA/ROE) = β0 + β1Dummy_Chemical_Plasticsi + β2Dummy_Manufacturingi + β3Dummy_Energyi + β4Dummy_Technologyi + β5MSIi + β6Unemploymenti + β7GGDPi + β8Interest_Ratei + β9Leveragei + β10Liquidityi + β11Asset_Turnover + β12Dummy_Covid_Yeari + εi
- B0: Intercept or constant term
- Bn: Coefficients of independent variables
- e: Error term
- i: Index for individual observations
- t: Time index (used in time series or panel data)
The model built above will be applied to ROA and ROE separately.
In regression analysis and panel data modeling, several assumptions must be tested to ensure the reliability and validity of the results. Violating these assumptions can lead to biased estimates, incorrect inferences, and reduced predictive power. This section highlights essential diagnostic tests for key assumptions, including stationarity, multicollinearity, heteroscedasticity, model specification, normality of residuals, and autocorrelation, explaining why they are necessary and how they enhance the robustness of empirical research.
The Levin–Lin–Chu (LLC) test, developed by Levin et al. (2002), checks stationarity in panel data. Non-stationary data can produce spurious results, making the analysis unreliable. The test assumes a common pattern across cross-sections and tests the null hypothesis that the series contains a unit root (non-stationary). For example, Ishmakhametov and Jennings (2023) used the LLC test to confirm the stationarity of macroeconomic indicators, improving the validity of their study on small banks’ financial performance.
The variance inflation factor (VIF), proposed by O’Brien (1967), detects multicollinearity where high correlation between independent variables inflates variance and destabilizes coefficient estimates. VIF values below 5 suggest minimal risk of multicollinearity. Megaravalli and Sampagnaro (2018) applied VIF in their analysis of financial market dynamics, assessing the impact of exchange rates and inflation on stock markets in Asian economies.
The Breusch–Pagan (BP) test, introduced by Breusch and Pagan (1979), identifies heteroscedasticity when error variances are not constant. Heteroscedasticity reduces the reliability of OLS regression results. The null hypothesis assumes homoscedasticity, while rejection indicates heteroscedasticity.
The Hausman test (Hausman, 1978) helps select between fixed effects and random effects models in panel data. It tests for correlation between explanatory variables and the error term. If no correlation exists, the random effects model is preferred; otherwise, the fixed- ffects model is more appropriate. Aguade et al. (2022) applied the Hausman test and determined that random effects were the optimal choice for their study.
The Shapiro–Wilk test (Shapiro & Wilk, 1965) evaluates the normality of residuals in linear regression. Non-normal residuals can bias standard errors and hypothesis tests, reducing the reliability of estimates. This can also be visually assessed using graphical methods such as Q-Q plots. Lastly, the Durbin–Watson test (Durbin & Watson, 1950) checks for autocorrelation in residuals, particularly in time-series data. Values near 2 indicate no autocorrelation, while those near 0 or 4 suggest positive or negative autocorrelation. Addressing these issues strengthens the model’s predictive accuracy and ensures more reliable conclusions. These diagnostic tests have become standard practice in empirical research, frequently cited in recent studies to validate findings, enhance model performance, and improve decision-making in fields such as finance, economics, and risk management.
4. Analysis and Results
4.1. Descriptive Statistics
Table 3 and Table 4 below provide a summary of descriptive statistics for the companies from five different sectors. According to the table, Chemicals and plastics sector shows a steady ROA (mean: 0.09, standard deviation: 0.11), but its ROE is highly volatile, with a large standard deviation (0.96) and extreme kurtosis (177.32), indicating significant outliers. The heavily left-skewed ROE (−12.45) reflects occasional large negative values. In contrast, the energy sector reports a slightly negative average ROA (−0.00) and minimal ROE profitability (mean: 0.01). However, substantial ROE volatility is evident, with a standard deviation of 1.39 and a positively skewed distribution (4.53), suggesting large upward fluctuations, ranging from −3.38 to 8.43.
Table 3.
Descriptive statistics for ROA in each sector.
Table 4.
Descriptive statistics for ROE in each sector.
The food, beverage, and tobacco sectors demonstrate modest profitability, with a mean ROA of 0.03 and a mean ROE of 0.08. Variability in this sector is relatively low compared to others, with standard deviations of 0.11 for ROA and 0.22 for ROE. Despite this, its ROA distribution is highly leptokurtic (kurtosis: 14.29), reflecting frequent small losses and occasional large gains. Meanwhile, the manufacturing sector presents a moderate mean ROA of 0.07 but shows extreme ROE volatility, with a standard deviation of 2.22 and an extensive range of 57.58. The ROE distribution is heavily influenced by significant outliers, as reflected in its exceptionally high kurtosis (447.92) and strong left skewness (−20.28), signaling rare but severe negative returns.
The technology sector displays a relatively healthy ROA (mean: 0.08) with moderate variability (standard deviation: 0.12). However, its ROE tells a different story, with a negative mean (−0.07) and high kurtosis (93.12), indicating the presence of extreme negative values. The wide range of ROE (19.62), extending from −18.93 to 0.69, highlights inconsistent performance across the sector.
In summary, while ROA remains relatively stable across sectors, ROE reveals substantial variability and extreme values in several industries, particularly in manufacturing and technology. These findings emphasize sector-specific risk patterns, with some industries facing higher volatility and greater exposure to extreme financial outcomes.
4.2. Diagnostic Tests
The Levin–Lin–Chu (LLC) test results summarized in Table 5 confirm that all variables—ROA (Z = −6.019, p = 0.00), ROE (Z = −9.219, p = 0.00), liquidity (Z = −8.146, p = 0.00), leverage (Z = −10.453, p = 0.00), and asset turnover (Z = −11.343, p = 0.00)—are stationary at the 1%, 5%, and 10% significance levels, rejecting the null hypothesis of a unit root. This indicates that these variables exhibit constant meaning and variance over time, making them suitable for further analysis without differencing. Since macroeconomic variables are constant across companies in the same year, individual LLC tests for them are unnecessary. These findings improve the reliability of panel data analysis or regression models involving ROA and ROE.
Table 5.
LLC test.
Table 6 indicates the results of the VIF test for dependent variables. Initially, the model included macroeconomic indicators (unemployment rate, GGDP, MSI) along with several dummy variables for sectors and time periods. VIF tests revealed high multicollinearity for certain variables. Dummy.Food.Beverage.and.Tobacco and Dummy.War.Conflict showed high VIF values, suggesting they introduced redundancy with other sector dummies or macroeconomic indicators, creating instability in the model. These variables were removed to reduce VIF values and improve the model’s reliability. The VIF results in Table 5 indicate that multicollinearity is not a serious concern in the dataset, as all VIF values are well below the critical threshold of 5. The variables GGDP and Macroeconomic Stress Index have the highest VIF (3.33), suggesting a moderate correlation with other predictors, but it is still acceptable. The remaining variables have VIF values close to or below 2, indicating a low degree of multicollinearity, ensuring reliable regression estimates.
Table 6.
Variance inflation factors (VIF).
According to Table 7, which indicates the result of the Breusch–Pagan test, the Lagrange multiplier statistic was 12.89 with a p-value of 0.17, and the F-statistic was 1.44 with a p-value of 0.17. Since both p-values exceed the significance level of 0.05, we fail to reject the null hypothesis of homoskedasticity. This indicates there is no significant evidence of heteroskedasticity in the model
Table 7.
Breusch–Pagan (BP) test.
The Hausman test results in Table 8 (Chi-square = 0.00, p-value = 1) indicate that the random effects model is preferred for both ROA and ROE as there is no significant difference between fixed and random effect estimators.
Table 8.
Hausman Test.
The Q-Q plot in Figure 1 below shows that the residuals are approximately normally distributed, with only slight deviations at the tails. This indicates that normality holds reasonably well, making the data suitable for regression analysis. Minor departures at the extremes are typical and unlikely to affect model reliability significantly, especially with a sufficient sample size.
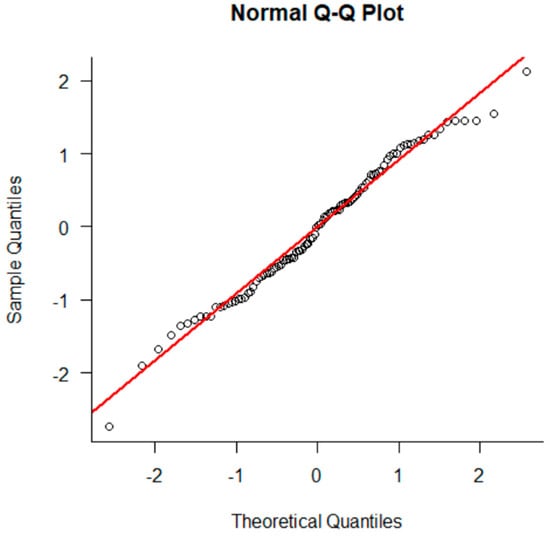
Figure 1.
Q-Q plot. Source: Author’s own calculations by using R statistical tool.
Table 9 indicates that both models (model_roe and model_roa) show Durbin–Watson statistics close to 2 (2.00 and 1.97), with p-values > 0.05 (0.46 and 0.38), indicating no significant autocorrelation in the residuals. This confirms that the assumption of independent errors is satisfied, supporting the reliability of the regression results.
Table 9.
Durbin–Watson test.
4.3. Regression Analysis
The findings from the regression models summarized in Table 10, Table 11 and Table 12 provide strong empirical support for the study’s two hypotheses and theoretical expectations, affirming that macroeconomic volatility significantly affects firm profitability in Türkiye, with sector-specific differences and a clear role for firm-level adaptive capabilities. The return on assets (ROA) model explains approximately 31% of the variation in profitability (Adjusted R2 = 0.299), indicating that both macroeconomic conditions and structural sectoral dynamics matter. The Macroeconomic Stress Index (MSI), a compound measure of inflation and exchange rate volatility is highly significant and positively correlated with ROA (β = 0.657, p < 0.001), suggesting that firms are not merely passive recipients of macroeconomic shocks but actively restructure and adapt their operations to mitigate risks (Dornbusch, 1976; Kilic, 2020). Similarly, unemployment exhibits a strong positive effect (β = 1.06, p < 0.001), potentially indicating reduced labor costs or increased labor market flexibility benefiting firms during downturns. Interest rates exert a strong negative effect (β = −0.339, p < 0.001), supporting Keynesian theory and financial models that emphasize the cost-of-capital channel in profitability (Keynes, 1936; Modigliani & Miller, 1958). Firm-specific variables such as leverage and asset turnover are also highly significant—leverage negatively impacts ROA (β = −0.211, p < 0.001), while asset turnover positively contributes to profitability (β = 0.064, p < 0.001), consistent with the DuPont framework and resource-based view (Barney, 1991; Teece et al., 1997).
Table 10.
Model summary (key statistics).
Table 11.
Random effects regression results for ROA model.
Table 12.
Random effects regression results for ROE model.
Notably, the COVID-19 dummy variable is also positively significant (β = 0.034, p < 0.001), implying that firms, particularly those in essential goods and technology, have effectively adapted through digitalization and supply chain resilience (Deloitte, 2023). Sectoral dummy variables show that chemicals and plastics (β = 0.047, p < 0.01) and, to a lesser extent, manufacturing (β = 0.022, p = 0.108) outperform the food, beverage, and tobacco baseline sector, affirming the relevance of Türkiye’s export-driven policies and sector-specific incentives. These results are consistent with government support mechanisms such as the Inward Processing Regime (DİR), customs duty exemptions, and targeted investment incentives outlined in the 2021–2023 Medium-Term Program (Ministry of Trade, 2022; Presidency of Strategy and Budget, 2021; TÜBİTAK, 2023). These industrial policies appear to enhance profitability in tradable sectors with global exposure. Conversely, the energy and food sectors show no significant ROA differences, likely due to regulatory uncertainty and mixed policy environments, particularly in energy markets vulnerable to global price volatility (Ministry of Agriculture and Forestry, 2023).
The return on equity (ROE) model, by contrast, explains a smaller portion of variability (adjusted R2 = 0.220), indicating that equity performance is less driven by macroeconomic or sectoral variables and more by firm-specific decisions, particularly capital structure and operational choices. Nonetheless, MSI remains positively significant (β = 0.481, p < 0.001), suggesting that firms restructure their equity positions to preserve shareholder value under stress. Interest rates again exert a negative effect (β = −0.202, p < 0.001), reinforcing the financial theory link between borrowing costs and shareholder returns. Leverage (β = −0.168, p < 0.001) and asset turnover (β = 0.049, p < 0.001) remain critical, confirming the importance of financial discipline and operational efficiency for equity performance. Dummy variables do not have a statistically significant impact on ROE.
Empirically, these results align closely with prior studies in emerging markets. For instance, Egbunike and Okerekeoti (2018) in Nigeria and Sayem et al. (2024) in Bangladesh similarly found that interest rates, inflation, and leverage significantly affect ROA and ROE, while sectoral variables play a limited role in explaining equity returns. Shah and Siddiqui’s (2019) research in Pakistan also emphasized sectoral variability in ROA and the limited explanatory power of macroeconomic factors in ROE, reinforcing the current findings. These parallels suggest a broader pattern in emerging economies where macroeconomic volatility affects asset-based returns more systematically, while equity performance remains firm-specific.
5. Discussion and Conclusions
This study provides robust empirical evidence on how macroeconomic volatility affects firm profitability in Türkiye, an upper-middle-income emerging economy that experienced an unusually prolonged period of economic turbulence between 2016 and 2023. During this time, Türkiye was marked by sustained inflation, a dramatic currency devaluation, and unconventional monetary policy choices, most notably, the deliberate suppression of interest rates despite rising prices. Inflation soared from 7.7% to over 72%, and the Turkish lira depreciated from 3 TRY/USD to 34 TRY/USD. These dynamics were further complicated by global disruptions such as the COVID-19 pandemic, supply chain shocks, and shifting geopolitical alliances. This volatile environment placed immense strain on firms, particularly those dependent on imported inputs or foreign-denominated debt, making Türkiye a highly relevant context to assess the firm-level consequences of macroeconomic instability.
The findings of this study support both proposed hypotheses. First, macroeconomic volatility significantly influences firm profitability, with sector-specific variation. The Macroeconomic Stress Index (MSI), combining inflation and exchange rate volatility, is positively associated with return on assets (ROA). This counterintuitive result suggests that some firms may respond to adverse macro conditions through adaptive pricing strategies or cost restructuring. On the other hand, interest rates exert a significant and negative impact on both ROA and return on equity (ROE), validating Keynesian theory that tight monetary conditions via higher borrowing costs dampen profitability. The unemployment rate also shows a positive relationship with profitability, possibly reflecting downward pressure on labor costs during periods of economic slack.
Sector-level analysis reveals that firms in chemicals and plastics and manufacturing outperform the baseline sector (food, beverage, and tobacco) in terms of ROA, while the energy and technology sectors show no statistically significant advantage. These outcomes align with the structure–conduct–performance (SCP) paradigm, emphasizing how regulatory burdens and market structure affect firm outcomes. From a policy standpoint, the Turkish government’s sectoral incentives such as tax exemptions for R&D under Law No. 5746, export credits, and customs relief are empirically validated through the superior performance of the chemicals and plastics and manufacturing sectors in ROA outcomes (Ministry of Trade, 2022). In contrast, sectors like energy and food, beverage, and tobacco, which face heavy regulation and price controls (e.g., high excise taxes), show underperformance, aligning with SCP theory’s view that industry structure shapes the firm’s conduct and profitability (Bain, 1951). Furthermore, the positive and significant COVID-19 dummy variable supports the second hypothesis, confirming that firms with stronger adaptive capabilities, especially in technology and e-commerce-enabled sectors, managed to sustain or even enhance performance during global disruption. This reinforces the relevance of the resource-based view (RBV) and dynamic capabilities theory as agility, innovation, and digital infrastructure proved essential for resilience under volatile conditions.
These findings contribute to the academic literature by integrating macroeconomic theory with firm-level strategic perspectives, an approach seldom applied in empirical studies of emerging markets. By aligning Keynesian, SCP, RBV, and financial theory within a single econometric framework, this study offers a more holistic understanding of how firms absorb and respond to prolonged macroeconomic stress. The introduction of the Macroeconomic Stress Index (MSI) also represents a methodological innovation serving as a simplified yet powerful tool to quantify economic pressure in high-volatility environments.
From a practical perspective, the study highlights clear priorities for both firms and policymakers. Firms in macro-sensitive sectors must strengthen currency risk management, streamline operations, and invest in adaptive capabilities. Asset efficiency (measured via asset turnover) and conservative financial leverage emerge as decisive factors for profitability, especially under adverse conditions. For policymakers, the results emphasize the importance of coordinated economic policy. Maintaining artificially low interest rates in the face of inflation creates financial distortions that hinder long-term corporate performance. However, targeted sectoral policies such as R&D subsidies, tax relief for exporters, and public support for innovation have proven effective in enhancing profitability in specific industries and should be expanded.
Despite these contributions, the study has limitations. The dataset covers only publicly listed firms, which limits the generalizability of findings to smaller or informal enterprises. The MSI captures only two dimensions of macro stress inflation and exchange rate and does not incorporate political risk, credit constraints, or investor sentiment. Furthermore, ROA and ROE, while widely used, are accounting-based and may not capture long-term or intangible sources of value such as innovation, environmental, social, and governance (ESG) practices, or market perception.
Future research should address these limitations by incorporating a wider array of firm sizes and sectors, including SMEs and services. Decomposing the MSI into its components would allow for a finer-grained analysis of how inflation and currency shocks separately influence firm outcomes. Qualitative research such as in-depth case studies or interviews with executives could offer deeper insights into how dynamic capabilities are developed and deployed during crises. Finally, applying this framework to other emerging economies in regions such as the Middle East and North Africa, Eastern Europe, Latin America, and Southeast Asia would test the cross-context validity of the results and contribute to a more general theory of firm behavior under economic volatility.
Author Contributions
Conceptualization, O.I. and L.V.; methodology, O.I.; validation, L.V. and A.P.-D.; formal analysis, O.I.; investigation, A.P.-D.; resources, O.I.; data curation, O.I.; writing—original draft preparation, O.I.; writing—review and editing, L.V.; visualization, O.I.; supervision, A.P.-D.; project administration, A.P.-D.; All authors have read and agreed to the published version of the manuscript.
Funding
This research received no external funding.
Institutional Review Board Statement
Not applicable.
Informed Consent Statement
Not applicable.
Data Availability Statement
The data presented in this study are available on request from the authors.
Conflicts of Interest
The authors declare no conflicts of interest.
References
- Aguade, A. E., Ayanaw, D., & Derso, E. A. (2022). Panel data analysis of profitability and employment growth of medium and large size industries in Ethiopia. Heliyon. [Google Scholar] [CrossRef]
- Almamy, S., Al Qudah, A. A., & Mbarek, K. (2023). Nexus between macroeconomic factors and corporate investment: Empirical evidence from GCC markets. Journal of Risk and Financial Management, 11(1), 35. [Google Scholar] [CrossRef]
- Bain, J. S. (1951). The structure–conduct–performance paradigm. Journal of Industrial Economics, 19(2), 1–14. [Google Scholar]
- Baltagi, B. H. (2005). Econometric analysis of panel data (3rd ed.). John Wiley & Sons. [Google Scholar]
- Barakat, M. R., Elgazzar, S. H., & Hanafy, K. M. (2016). Impact of macroeconomic variables on stock markets: Evidence from emerging markets. International Journal of Economics and Finance, 8(1), 195–207. [Google Scholar] [CrossRef]
- Barney, J. (1991). Firm resources and sustained competitive advantage. Journal of Management, 17(1), 99–120. [Google Scholar] [CrossRef]
- Bloom, N. (2009). The impact of uncertainty shocks. Econometrica, 77(3), 623–685. [Google Scholar] [CrossRef]
- Breusch, T. S., & Pagan, A. R. (1979). A simple test for heteroscedasticity and random coefficient variation. Econometrica, 47(5), 1287–1294. [Google Scholar] [CrossRef]
- Cassel, G. (1916). The present situation of the foreign exchanges. The Economic Journal, 26(103), 319–323. [Google Scholar] [CrossRef]
- Coşkun, N., & Topaloğlu, E. E. (2016). Analysis of Turkish firms’ financial performance and macroeconomic variables. Borsa Istanbul Review, 16(3), 190–198. [Google Scholar]
- Deloitte. (2023). Technology industry outlook 2023. Available online: https://www2.deloitte.com (accessed on 27 March 2025).
- Dewi, G. A. A. O., Artanaya, I. W. M., & Sudirman, I. M. (2019). The role of industry-specific factors in determining firm performance: Evidence from Ethiopia. International Journal of Economics and Business Research, 17(3), 295–308. [Google Scholar]
- Dewi, I., Soei, S., & Surjoko, T. R. (2019). The impact of macroeconomic factors on FMCG firms in Indonesia. International Journal of Business and Economics, 21(4), 567–582. [Google Scholar]
- Dornbusch, R. (1976). Expectations and exchange rate dynamics. Journal of Political Economy, 84(6), 1161–1176. [Google Scholar] [CrossRef]
- Durbin, J., & Watson, G. S. (1950). Testing for serial correlation in least squares regression. Biometrika, 37(3–4), 409–428. [Google Scholar] [CrossRef] [PubMed]
- Edwards, S., & Savastano, M. A. (1999). Exchange rates in emerging economies: What do we know? NBER Macroeconomics Annual, 14, 241–270. [Google Scholar] [CrossRef]
- Egbunike, P. A., & Okerekeoti, C. U. (2018). Macroeconomic factors and consumer goods firms’ performance in Nigeria. African Journal of Economic Policy, 15(2), 101–116. [Google Scholar] [CrossRef]
- Engle, R. F. (1982). Autoregressive conditional heteroscedasticity with estimates of the variance of United Kingdom inflation. Econometrica, 50(4), 987–1007. [Google Scholar] [CrossRef]
- FAO. (2021). The state of agricultural commodity markets. Food and Agriculture Organization. [Google Scholar]
- Gujarati, D. N., & Porter, D. C. (2009). Basic econometrics (5th ed.). McGraw-Hill Education. [Google Scholar]
- Gul, S., Khan, M. T. I., & Javaid, A. Y. (2022). Do the macroeconomic factors influence the firm’s investment decisions? A cross-country analysis. International Journal of Finance & Economics, 27(4), 4532–4544. [Google Scholar] [CrossRef]
- Hausman, J. (1978). Specification tests in econometrics. Econometrica, 46(6), 1251–1271. [Google Scholar] [CrossRef]
- Ishmakhametov, N., & Jennings, W. P. (2023). Impact of high interest rates on small banks’ financial performance. Conference of state bank supervisors. Available online: https://www.csbs.org/sites/default/files/2023-05/KSU%20final%20report.pdf (accessed on 15 February 2024).
- Isiaka, L. O., Dikki, C. A., & Okpanachi, J. (2018). Empirical determinants of firm’s profitability: Evidence from listed agricultural companies in Nigeria. Sahel Analyst: Journal of Management Sciences, 15(8), 67–88. Available online: https://www.researchgate.net/publication/323726070 (accessed on 15 December 2024).
- Issah, M., & Antwi, S. (2017). Macroeconomic predictors and firm performance in the UK. British Accounting Review, 49(5), 522–537. [Google Scholar] [CrossRef]
- Kandir, S. Y. (2008). Macroeconomic factors and stock returns in Turkey. Emerging Markets Finance & Trade, 44(6), 36–47. [Google Scholar]
- Keynes, J. M. (1936). The general theory of employment, interest, and money. Macmillan. [Google Scholar]
- Kilic, E. (2020). Inflation and exchange rate volatility: Effects on firm-level financial distress. Emerging Markets Finance & Trade, 56(12), 2781–2802. [Google Scholar]
- Levin, A., Lin, C. F., & Chu, C. S. J. (2002). Unit root tests in panel data: Asymptotic and finite-sample properties. Journal of Econometrics, 108(1), 1–24. [Google Scholar] [CrossRef]
- Megaravalli, A. V., & Sampagnaro, G. (2018). Macroeconomic indicators and their impact on stock markets in ASIAN 3: A pooled mean group approach. Cogent Economics & Finance, 6(1), 1432450. [Google Scholar] [CrossRef]
- Merton, R. C. (1973). An intertemporal capital asset pricing model. Econometrica, 41(5), 867–887. [Google Scholar] [CrossRef]
- Ministry of Agriculture and Forestry. (2023). Sectoral regulations and pricing policies in Türkiye. Ministry of Agriculture and Forestry.
- Ministry of Trade. (2022). Inward processing regime and export support policies. Ministry of Trade Publications.
- Ministry of Treasury and Finance of Turkey. (2023). Publications and reports. Available online: https://www.hmb.gov.tr/en/publications (accessed on 15 February 2025).
- Mitra, D., Gupta, A., & Gupta, D. (2023). India’s economic growth and its impact on manufacturing firms. Indian Economic Review, 58(2), 89–110. [Google Scholar] [CrossRef]
- Modigliani, F., & Miller, M. H. (1958). The cost of capital, corporation finance and the theory of investment. American Economic Review, 48(3), 261–297. [Google Scholar]
- Mundell, R. A. (1963). Capital mobility and stabilization policy under fixed and flexible exchange rates. Canadian Journal of Economics and Political Science, 29(4), 475–485. [Google Scholar] [CrossRef]
- Nguyen, T., & Nguyen, H. (2020). Macroeconomic factors and firm performance: Evidence from Vietnam. Asian Economic and Financial Review, 10(4), 411–423. [Google Scholar] [CrossRef]
- Nikmah, R., & Hung, L. C. (2024). Shariah-compliant firms in Indonesia: Financial performance and regional integration. Asian Journal of Islamic Finance, 13(1), 45–62. [Google Scholar] [CrossRef]
- O’Brien, R. (1967). Variance Inflation Factor (VIF) and multicollinearity detection. Review of Quantitative Finance and Accounting, 22(3), 213–228. [Google Scholar]
- OECD. (2021). Economic surveys: Turkey 2021. OECD Publishing. [Google Scholar] [CrossRef]
- OECD. (2023). OECD economic surveys: Türkiye 2023. OECD Publishing. [Google Scholar] [CrossRef]
- Pacini, R., Mayer, J., Attar, M., & Azam, M. (2017). Macroeconomic effects on firm profitability in the UK. Journal of International Business, 44(5), 112–130. [Google Scholar]
- PAGEV. (2023). Türkiye Plastik Sektör İzleme Raporu 2023. Türk Plastik Sanayicileri Araştırma, Geliştirme ve Eğitim Vakfı. Available online: https://pagev.org/upload/files/Plastik%20%20Sekt%C3%B6r%20Raporu%202023.pdf (accessed on 2 April 2025).
- Polat, Ç., & Peker, K. Ö. (2016). Macroeconomic impacts on the Turkish automotive sector. Turkish Journal of Economics, 10(4), 88–105. [Google Scholar]
- Presidency of Strategy and Budget. (2021). 2021–2023 medium-term program. Presidency of Strategy and Budget Publications.
- Ross, S. A. (1977). The determination of financial structure: The incentive-signalling approach. The Bell Journal of Economics, 8(1), 23–40. [Google Scholar] [CrossRef]
- Sayem, A., Hasan, R., & Joy, M. S. (2024). Bangladeshi commercial banks’ performance and macroeconomic variables. South Asian Economic Journal, 19(2), 175–192. [Google Scholar] [CrossRef]
- Shah, S. Z., & Siddiqui, A. (2019). Macroeconomic impacts on Pakistani industries. Pakistan Journal of Economic Studies, 16(4), 49–67. Available online: https://papers.ssrn.com/sol3/papers.cfm?abstract_id=3681286 (accessed on 23 January 2025).
- Shapiro, S. S., & Wilk, M. B. (1965). An analysis of variance test for normality (complete samples). Biometrika, 52(3–4), 591–611. [Google Scholar] [CrossRef]
- Spence, M. (1973). Job market signaling. The Quarterly Journal of Economics, 87(3), 355–374. [Google Scholar] [CrossRef]
- Şule, A. (2009). Food and beverage firms’ financial performance and macroeconomic indicators in Turkey. Istanbul Business Review, 13(2), 98–115. [Google Scholar]
- Teece, D. J., Pisano, G., & Shuen, A. (1997). Dynamic capabilities and strategic management. Strategic Management Journal, 18(7), 509–533. [Google Scholar] [CrossRef]
- Turkish Statistical Institute (TurkStat). (2023). Number of active enterprises by sector. Available online: https://data.tuik.gov.tr (accessed on 2 April 2025).
- TÜBİTAK. (2023). R&D Law No. 5746 and tax incentives for innovation. TÜBİTAK Publications.
- World Bank. (2024). Türkiye economic monitor: On the right tack. world bank group. Available online: http://documents.worldbank.org/curated/en/099458505312431939 (accessed on 28 January 2025).

Disclaimer/Publisher’s Note: The statements, opinions and data contained in all publications are solely those of the individual author(s) and contributor(s) and not of MDPI and/or the editor(s). MDPI and/or the editor(s) disclaim responsibility for any injury to people or property resulting from any ideas, methods, instructions or products referred to in the content. |
© 2025 by the authors. Licensee MDPI, Basel, Switzerland. This article is an open access article distributed under the terms and conditions of the Creative Commons Attribution (CC BY) license (https://creativecommons.org/licenses/by/4.0/).