Article

Evaluation of Operational Efficiency in China’s Pharmaceutical Industry and Analysis of Environmental Impacts

1
Department of Social Science & Management, Faculty of Humanities, Management & Science, Universiti Putra Malaysia, Bintulu Campus, Nyabau Road, Bintulu 97008, Sarawak, Malaysia
2
Strategic Research Center of Chengdu Maidison Pharmaceutical Technology Co., Ltd., No. 733, East Section, Hubin Road, Xinglong Subdistrict, Tianfu New Area, Chengdu 610000, China
3
Institute of Ecosystem Science Borneo, Universiti Putra Malaysia, Bintulu Sarawak Campus, Nyabau Road, Bintulu 97008, Sarawak, Malaysia
*
Author to whom correspondence should be addressed.
Economies 2025, 13(4), 90; https://doi.org/10.3390/economies13040090
Submission received: 10 February 2025 / Revised: 17 March 2025 / Accepted: 20 March 2025 / Published: 27 March 2025

Abstract

:
The pharmaceutical industry is a cornerstone of national economies and plays a critical role in public health. However, China’s pharmaceutical industry faces significant challenges, including regional disparities in development. The existing research on operational efficiency evaluation primarily focuses on financial or innovation metrics, lacking a comprehensive approach. Moreover, studies on the environmental impact on operational efficiency often rely on a limited set of indicators, failing to offer a holistic understanding of how environmental factors influence efficiency. This study aims to address these gaps by comprehensively evaluating operational efficiency and analyzing the impact of broader environmental factors on efficiency. To achieve these objectives, the study employs a Three-Stage Data Envelopment Analysis method combined with Principal Component Analysis to evaluate the operational efficiency of the pharmaceutical industry across 31 provinces in China, considering both financial and innovation dimensions.The findings reveal that overall efficiency has improved annually, with regional disparities gradually narrowing. Specifically, innovation capability and innovation environment have a positive impact on operational efficiency, while living standards and openness exhibit a negative correlation. Additionally, the current environmental conditions in the northwestern region are found to be conducive to the development of the pharmaceutical industry. This study is the first to integrate three-stage data envelopment analysis with principal component analysis, constructing a comprehensive framework for analyzing the relationship between environmental factors and operational efficiency. The results provide empirical evidence for policymakers aiming to enhance the efficiency of the pharmaceutical industry.

1. Introduction

Since the Policy of China’s Reform and Opening-Up policy, the pharmaceutical industry (PI) in China has experienced rapid development. Particularly since 2000, the total output value of the pharmaceutical industry has increased by 13 times, with the compound annual growth rate of 12.85% (National Bureau of Statistics of China, 2023). Currently, China has become one of the significant components of the supply chain in the pharmaceutical industry. However, despite the remarkable achievements in recent years, the pharmaceutical industry of China still faces severe challenges in terms of innovation, scale efficiency, low profit, and sustainable development (Bhardwaj, 2024; Borja Reis & Pinto, 2022).
Firstly, China’s PI started late and invested less in research and development (R&D), resulting in a lower share of the international pharmaceutical market and the international competitiveness of the pharmaceutical industry (H. Guo & Shi, 2021; Jia, 2022; G. Wang & Zhang, 2023). In addition, China’s regional economic development is not balanced. The efficiency of the PI in various regions varies significantly; whether in the innovation capacity or the overall level of operation, there is an uneven phenomenon. At the same time, because pharmaceutical companies, as part of a highly polluting industry, along with the overall development of China’s economy, some developed regions (such as Beijing, Shanghai, etc.) are gradually shifting from the production of raw materials and chemical drugs to the development of biopharmaceuticals and other fields. Many pharmaceutical companies are, therefore, relocating to more environmentally favorable regions in search of further development (Bai et al., 2022; Dou & Han, 2019; Lai et al., 2020; T. Liu et al., 2020). It is important to note that the daily operations of an industry or enterprise are often constrained by regional political, economic, cultural, and technological conditions. Therefore, when selecting a development area, industries typically prioritize regions with comparative advantages. At the same time, the formation of industrial clusters has a significant impact on the operational efficiency of local industries. This regional selection and environmental adaptation not only determine the competitiveness of enterprises but also profoundly influence the overall development pattern of the industry (P. Chen et al., 2025; Imran et al., 2024a, 2017; W. Wang et al., 2024; M. Zhang et al., 2024).
To address these challenges mentioned above, a series of policies have been proposed at the national level to promote the high-quality development of the pharmaceutical industry. For instance, the 14th Five-Year Plan for the Development of the Pharmaceutical Industry emphasizes the need to enhance resource utilization efficiency, reduce pollution emissions, and achieve a green and low-carbon transformation. Simultaneously, local governments are exploring differentiated strategies aligned with regional development objectives, aiming to strengthen policy support and environmental regulation to foster the growth of the pharmaceutical industry. However, the implementation of these policies faces several challenges. Notably, there is a lack of systematic quantitative research on the specific impact of environmental constraints on industrial efficiency. Additionally, policy formulation often lacks a sufficiently targeted and evidence-based foundation. Addressing how to comprehensively improve the efficiency of the regional pharmaceutical industry under policy guidance has become a critical and urgent issue requiring resolution (Y. Liu et al., 2022; Xu et al., 2022).
Despite the importance of these endeavors, there are still significant research gaps on how to assess the effectiveness of the implementation of these policies, and in particular, how these policies specifically affect the development of the pharmaceutical industry. Most of the current evaluations of firm efficiency focus on a single dimension such as finance or innovation, neglecting the fact that the pharmaceutical industry is a combination of both dimensions. In addition, the existing studies mainly limit the environmental impact to a single indicator, adopting one indicator to represent a certain evaluation dimension and lacking a systematic study of the overall environmental impact on efficiency.
To fill the current research gaps described above, this study evaluated PI efficiency from a comprehensive perspective and reveals the influence of comprehensive environmental factors on efficiency.
To achieve the research objectives, this study focused on the pharmaceutical industry across 31 provincial-level administrative units in China. It employed a three-stage data envelopment analysis (DEA) method combined with principal component analysis (PCA) to comprehensively evaluate the operational efficiency of China’s pharmaceutical industry in both both financial and innovation dimensions. PCA is used to extract key components from a large number of environmental factors, which are then used as environmental variables to reveal the impact of the comprehensive operational environment on the efficiency of the pharmaceutical industry.
The innovations of this study are reflected in the following aspects: First, the existing research on the impact of environmental factors on efficiency typically relies on single indicators to substitute for specific dimensions in regression analysis. In contrast, this study employs PCA to extract principal components from a large number of environmental indicators, thereby enhancing the scientific rigor and feasibility of the conclusions. Second, the integration of PCA effectively eliminates multicollinearity issues, improving the robustness and explanatory power of the regression model. Finally, in the evaluation of pharmaceutical-industry operational efficiency, previous studies have predominantly focused on a single dimension, such as financial or innovation indicators. This study adopted a multidimensional, comprehensive evaluation approach, providing a more holistic and precise assessment of pharmaceutical-industry efficiency.
This study has theoretical and practical significance. By integrating multiple evaluation dimensions and employing the combination of the three-stage DEA and PCA, this research provides a more comprehensive assessment of the characteristics of the pharmaceutical industry and its influencing factors, addressing the limitations of traditional single-dimensional analysis. Furthermore, the study conducted an in-depth analysis of the drivers of efficiency changes, revealing the effects of factors such as pure technical efficiency and economies of scale on performance and thereby offering a refined theoretical framework for efficiency analysis. From an economic perspective, the research further investigates regional influencing factors, exploring how economic elements such as the local economy and local innovation influence the efficiency of the PI. These analyses not only enhance the understanding of efficiency dynamics in the pharmaceutical sector but also provide a theoretical foundation for formulating targeted industry policies and optimizing resource allocation, underscoring the study’s academic and economic significance.
This study is organized into six sections. Section 1 outlines the research background, identifies the research problem, and defines the study objectives. Section 2 conducts a comprehensive literature review, summarizing relevant theoretical frameworks and efficiency measurement methodologies, justifying the adoption of the three-stage approach, and highlighting gaps in the existing literature and the conceptual framework of this study. Section 3 details the research methodology, encompassing data sources, theoretical models, and the selection of variables. Section 4 presents the empirical results, beginning with data validation, followed by the first-stage result, principal component extraction and regression analysis (second stage), and DEA-based efficiency measurement (third stage). Section 5 discusses the distribution of efficiency, its temporal evolution over a decade, regional efficiency disparities, the influence of environmental factors on efficiency across regions, and a comparative analysis between the findings of this study and prior research. Finally, Section 6 concludes the study by summarizing the main findings, the implication for policy-makers, and the limitations of this study, proposing directions for future research.

2. Literature Review

2.1. The Basic Theory and General Measurement Methods of Efficiency

Value maximization theory: This theory posits that an industry or enterprises should balance financial performance with the consideration of various stakeholders’ interests and the equilibrium between long-term and short-term goals. Specifically, a comprehensive evaluation of the industry or companies should integrate both financial outcomes and innovation, reflecting the balance of short-term and long-term interests. Therefore, this theory emphasizes the necessity of evaluating the industry using the financial and innovation dimensions (Colm, 1960; Friedman, 2007; Grossman & Stiglitz, 1977).
Regional cluster economic theory: Michael Porter’s regional cluster economic theory suggests that the competitiveness of an industry is influenced by multiple factors such as technology, government policies, and local resources. Although environmental regulations may pose challenges, they can foster technological innovation, enhancing productivity and competitiveness. Furthermore, regional clusters facilitate cooperation, knowledge sharing, and technological advancement among firms, thereby strengthening the competitive advantage of enterprises and promoting overall regional economic growth. Therefore, the study of the impact of regional environments on industry efficiency is of significant theoretical and practical importance (Martin & Sunley, 2003; Porter, 1990b, 1998).
Resource-based view (RBV) theory: The resource-based view (RBV) theory asserts that the competitive advantage of firms and industries stems from their unique resources and capabilities, particularly those that possess value, rarity, inimitability, and non-substitutability (VRIN). Effective resource allocation, especially the integration and dynamic adjustment of resources, is crucial for maintaining competitive advantage. This theory provides a theoretical foundation for analyzing local industry resources and their impact on competitive advantage (J. Barney, 1991; J. B. Barney & Arikan, 2005; Ge et al., 2024; Kaur & Singh, 2024; Teece et al., 1997; M. Zhang et al., 2024).
Efficiency, as a concept, was first articulated by the Italian economist Pareto, who framed it as an optimal state of resource allocation, commonly called “Pareto optimality”. In this state, no reallocation of resources can increase the benefit of one party without reducing the benefit of others. Pareto optimality fundamentally reveals the economic meaning of efficiency, which is to achieve optimal economic output through the rational distribution of resources. Building on this theory, Farrell (1957) further developed the theory of efficiency by decomposing it into technical efficiency and allocative efficiency. Farrell’s work laid a solid foundation for modern efficiency evaluation theory and provided a theoretical basis for the development of efficiency measurement methods. Efficiency measurement methods are mainly divided into two categories: parametric and non-parametric methods. Among these, stochastic frontier analysis (SFA), as a representative of parametric methods, is commonly used, while data envelopment analysis (DEA) is a typical non-parametric method (Greene, 2008; Lampe & Hilgers, 2015; Resti, 2000).

2.2. Efficiency Measurement Methods: A Comparison of SFA and DEA

SFA, a classical parametric method, was proposed by Aigner et al. (1977). The basic principle of SFA is to decompose the efficiency of decision-making units (DMUs) into two parts: random error and an inefficiency term. The random error reflects the impact of uncontrollable factors such as the external environment, such as weather, policy changes, or market fluctuations; and the inefficiency term reflects the loss of efficiency caused by the internal management or technical level of the firm (Aigner et al., 1977; Li & Fan, 2009). SFA evaluates the technical efficiency and the total efficiency by constructing a production frontier function combined with maximum likelihood estimation techniques. The advantage of this method is that it can distinguish between the impact of external uncontrollable factors and internal management factors on efficiency, thus making the assessment results closer to the actual situation. Due to its wide applicability, SFA has been widely used in many fields such as agriculture, industry and environmental research (Kumbhakar & Tsionas, 2011; Lee & Jeon, 2023; Đokić et al., 2022; Singh et al., 2020; J. Wang et al., 2020; R. Wang & Duan, 2023).
However, as a parametric method, SFA requires assumptions about the functional form of the production function and the distribution of inefficiency and random error. If the assumptions deviate from the actual situation, it may lead to biased efficiency estimates. Moreover, the application of SFA involves certain limitations when dealing with inputs and outputs that have different units and dimensions (Ahmed & Melesse, 2018; Kalirajan & Shand, 1994; Madaleno & Moutinho, 2023; Moulay Ali et al., 2024).
DEA is a method that constructs an best-practice frontier based on the DMUs and then compares other DMUs with this to determine their relative efficiency. This method offers several advantages in efficiency evaluation. First, it does not require predefined assumptions about the functional form of the production function, thus avoiding the model bias that may result from incorrect function specification (Charnes et al., 1978). Second, DEA can handle multi-input, multi-output efficiency issues simultaneously without the need to weight these variables, which gives it an advantage when dealing with multidimensional data (Banker et al., 1984). Moreover, DEA can identify sources of inefficiency, such as scale inefficiency or insufficient technical efficiency, providing decision-makers with directions for improvement (Cooper et al., 2007). In terms of sample size requirements, DEA is well suited to small sample data, making it particularly useful for industry studies or case analyses (Zhu, 2009). Additionally, DEA can provide improvement paths for non-DEA efficient DMUs by analyzing reference sets and clarifying the directions for adjusting inputs or outputs (Tone, 2001). Finally, the flexibility of DEA models is considerable, with the ability to incorporate various extensions, such as three-stage DEA, weight-restricted models, and indirect economic efficiency models (Camanho et al., 2024; Mergoni et al., 2024). With the development of DEA research, it has found wide application in efficiency testing across various industries (André et al., 2024; C. Guo et al., 2024; Y. Guo et al., 2024; Rashid et al., 2024; Sun et al., 2024).
However, DEA also faces certain limitations. First, it cannot separate the influence of external environmental factors and random noise on efficiency, which may lead to efficiency estimates being affected by external conditions or data fluctuations. Second, DEA is unable to further analyze the specific sources of inefficiency for non-DEA efficient DMUs, such as whether it is due to management issues, environmental constraints, or random factors (Coelli et al., 2005; Dyson et al., 2001; Hjalmarsson et al., 1996; Joe & Wu, 1996; Ma, 2010).

2.3. The Method of Three-Stage DEA and Advantage

To address the limitations of traditional data envelopment analysis (DEA) in handling efficiency measurement errors caused by environmental factors and the constraints of stochastic frontier analysis (SFA), which requires assumptions about error distribution and struggles with multiple inputs and outputs, Fried et al. (2002) proposed the three-stage DEA method. This approach integrates DEA and SFA to improve the accuracy of efficiency measurement. In the first stage, a conventional DEA model is used to compute initial efficiency scores and identify slack variables. In the second stage, SFA is applied to regress the slack variables against environmental factors, allowing for the separation of environmental influences and stochastic disturbances on efficiency. Finally, in the third stage, after eliminating the effects of environmental and random factors, the adjusted input data are used in a final DEA calculation to obtain a more precise measure of technical efficiency (Charnes et al., 1978; Fried et al., 2002; Luo, 2012).
Compared to traditional DEA methods, the three-stage DEA approach offers significant advantages. It retains the flexibility of DEA, such as not requiring a predefined production function, while also isolating the effects of external environmental factors and stochastic noise, thereby enhancing the accuracy of efficiency evaluation (Avkiran & Rowlands, 2008; Fried et al., 2002; Na et al., 2019; Z. Wang et al., 2017). Consequently, this method has been widely applied in various fields, including energy management, environmental governance, public services, the pharmaceutical industry, and innovation efficiency assessment, providing a more reliable tool for efficiency measurement (G. Chen & Chen, 2024; Guanglan & Zhening, 2024; Shi et al., 2025; Song & Ma, 2024; Z. Wang et al., 2024; Wei & Zhao, 2024; L. Zhang & Cui, 2024).

2.4. The Current Research on Efficiency in the PI

Currently, there is limited research on the efficiency of the pharmaceutical industry (PI), and existing studies tend to focus on a single dimension, such as innovation efficiency or financial efficiency.

2.4.1. Innovation Efficiency Research

Innovation is one of the key characteristics of the pharmaceutical industry. However, research on innovation efficiency is still very limited. In studies of listed pharmaceutical companies or the pharmaceutical industry, Xiong and Meng (2019) used DEA analysis to find that, in China’s PI, the efficiency of biopharmaceuticals is the highest, with the main inefficiency stemming from pure technical inefficiency. The efficiency of translating innovation into revenue is also low, primarily due to excessive research and development investment. Moreover, in China, innovation efficiency is not only low but also unevenly distributed (Hao & Ruan, 2022; Lai et al., 2020; Qiu et al., 2023).
International research has also been conducted on pharmaceutical innovation. SFA and multiple-frontier analysis were applied to evaluate the 705 pharmaceutical companies’ efficiency in America, revealing that different open innovation approaches had distinct impacts on performance (Shin et al., 2018). In terms of the efficiency of large global enterprises, it was found that even globally renowned companies face efficiency challenges (Gascón et al., 2017; Schuhmacher et al., 2023, 2021).

2.4.2. Pharmaceutical Companies’ Financial Efficiency Evaluation

Financial efficiency evaluation is a common method for assessing companies. In 2013, a method combining data envelopment analysis (DEA) and stochastic frontier analysis (SFA) was applied, and the results revealed that increased technical knowledge reserves significantly improved company revenue, with similar conclusions drawn using different DEA models (Cai & Sun, 2013). Xia et al. (2022) applied the BCC-DEA to evaluate the operational efficiency of public pharmaceutical firms in China. Their analysis indicated a general decline in overall financial efficiency, with the exception of the biopharmaceutical sector, which exhibited growth. In contrast, the chemical pharmaceuticals and traditional Chinese medicine sectors experienced a reduction in efficiency. Similarly, Lin et al. (2021) utilized a two-stage network DEA approach combined with Malmquist indices to assess the impact of government subsidies. Their findings suggested that such subsidies had no significant effect on financial efficiency. Further research by Yang (2024) applied a three-stage DEA model and Malmquist indices, revealing that the overall efficiency of Chinese pharmaceutical companies remains relatively low, with notable year-to-year variability. Regarding the selection of indicators, domestic researchers typically rely on operating income and profits as output metrics due to the accessibility of these data. In contrast, international scholars often incorporate a wider array of indicators, including human capital efficiency, structural capital efficiency, intellectual capital efficiency, earnings per share, dividends per share, and returns on equity (Hamad & Tarnoczi, 2021; Riaz et al., 2023).

2.5. Research Gap

Up to now, the research on the efficiency of pharmaceutical companies and the pharmaceutical industry has been limited both in terms of the quantity of studies and the depth of their integration.
(1)
Current evaluations of the operational efficiency of the PI are based solely on financial or innovation dimensions, lacking comprehensive research.
In the innovation dimension, scholars typically use indicators such as sales of new products and the number of patent applications (Hao & Ruan, 2022; Lai et al., 2020; Qiu et al., 2023). Other scholars also evaluate the operational efficiency use the new molecular entity (NME) and impact factors of the publication (Gascón et al., 2017; Schuhmacher et al., 2023, 2021). The financial evaluation dimension includes a broader range of indicators, with operation revenue and operation profit being the most widely used (Gascón et al., 2017; Lin et al., 2021; Yang, 2024). Other financial indicators, such as asset turnover, returns on equity (ROE), and earnings per share (EPS), are also employed (Hamad & Tarnoczi, 2021; Riaz et al., 2023; Xia et al., 2022). To date, the only study that has combined both financial and innovation dimensions in evaluating the operational efficiency of pharmaceutical companies is Gascón et al. (2017). No other research has conducted a combination evaluation of both dimensions. However, the financial indicators primarily reflect a company’s short-term profitability; innovation serves as a measure of its long-term growth potential. Therefore, a separate evaluation of the financial and innovation performance overlooks the balance between short-term and long-term interest.
(2)
The current research on the impact of environmental factors on efficiency is limited.
Although previous studies have employed three-stage DEA to analyze the impact of the environment on efficiency, the use of a single indicator to represent a dimension lacks a comprehensive understanding of the environment. Qiu et al. (2023) used the number of employees to represent company size, the number of employees with a bachelor’s degree or higher to represent employee quality, and returns on equity (ROE) and the ratio of total liabilities to total assets (LEV) as environmental indicators. Yang (2024) used government subsidies, per capita GDP, and the years that a company has been established to measure and explain the environmental influence on efficiency. Sun et al. (2024), construct environmental indicators using per capita disposable income to represent wealth levels, the working-age population to represent the labor supply, and local GDP to represent the local economic level. Although these studies explore the impact of environmental factors on efficiency from different perspectives, they remain inadequate. Environmental factors are complex, and using a single indicator for regression analysis cannot fully capture the overall environmental impact. Moreover, when too many environmental indicators are included in regression, potential multicollinearity issues may arise, which could compromise the accuracy of regression results (Baird & Bieber, 2016; Haitovsky, 1969; Shrestha, 2020).
In conclusion, there are notable research gaps in the current research regarding the comprehensive efficiency evaluation of the PI and the in-depth exploration of how the environmental factors impact efficiency. Addressing these gaps will not only contribute to the theoretical framework but also provide a more scientific implication for policy-makers and companies in the PI, improving their operation efficiency.

2.6. The Conceptual Framework of This Study
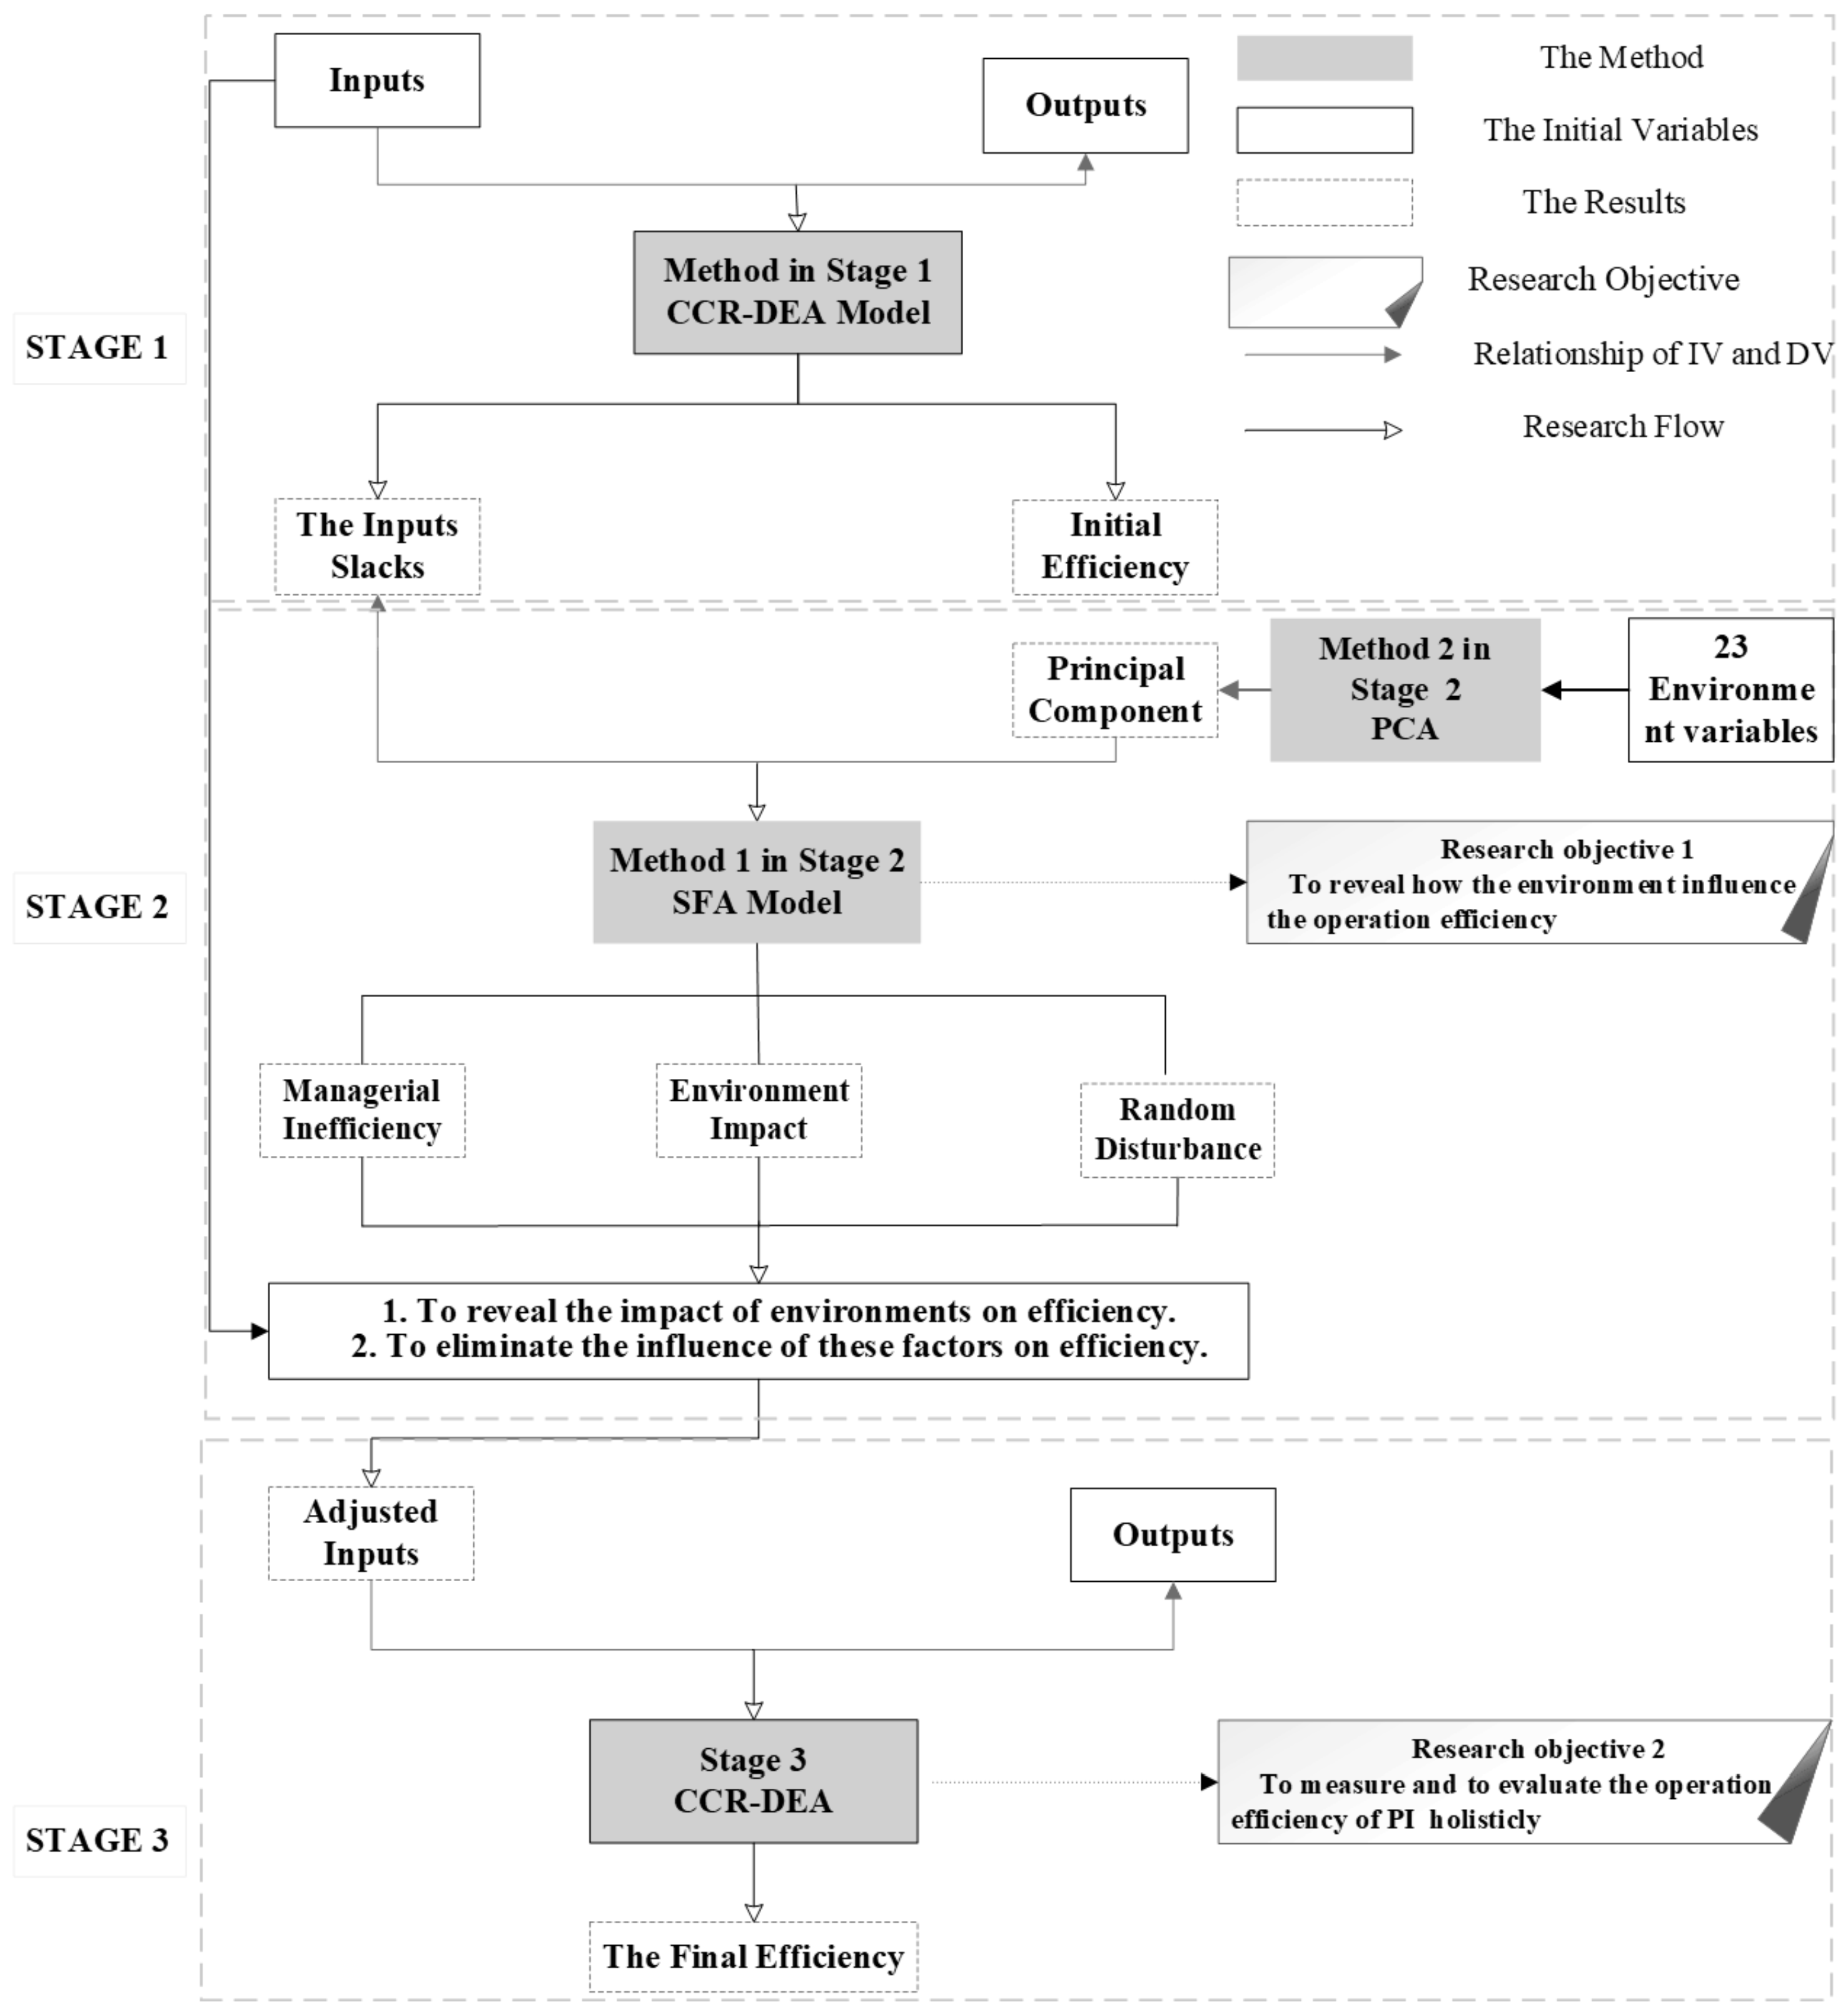
Based on the research gap, the study had two primary objectives: first, to accurately measure the operational efficiency of the PI in both the financial and innovation dimensions and, second, to reveal the impact of comprehensive environmental factors on operational efficiency. To achieve these research objectives, the study employed a combined method of three-stage DEA and PCA. The process can be divided into three stages.
(1)
Stage 1: initial efficiency measurement.
In this stage, DEA was used to calculate the efficiency values of 31 provincial-level regions in China. The main objective was to measure the current efficiency distribution and calculate the sales of input variables.
(2)
Stage 2: environmental factor analysis and adjustment.
At the beginning of this stage, PCA was employed to extract principle components from multiple potential environmental variables. The environmental variable values were calculated based on the variance contribution of each component. The extracted environmental variables were used as independent variables (IV), and the slacks of the inputs from Stage 1 were used as the dependent variable (DV) in the SFA regression. This stage aimed to reveal how the comprehensive environment influences efficiency and then eliminate the impact of environmental factors and random disturbances on the input variables by adjusting the input indicators.
(3)
Stage 3: efficiency adjustment and recalculation.
Adjusted inputs were obtained in Stage 2, and the original output was employed in this stage to recalculate the final and accurate efficiency using the DEA model. This stage aimed to measure the accurate efficiency of PI in China while removing the effects of environmental factors.
The conceptual framework of this study was primarily based on the theoretical frameworks of Zhao et al. (2019) and L. Zhang and Cui (2024), which form the analytical model for this research, as well as the PCA-DEA approach proposed by Stević et al. (2022). Figure 1 illustrates the conceptual framework of this study.

3. Materials and Methods

3.1. Data Source and Software

Data source: The sample data were sourced from the China High-Tech Statistical Yearbook.1 The environmental indicators used for PCA were sourced from the China Statistical Yearbook https://www.stats.gov.cn (accessed on 27 October 2024). https://www.stats.gov.cn (accessed on 27 October 2024).
Sample scope: the sample covers data from the pharmaceutical and pharmaceutical manufacturing industries across 31 provincial-level administrative units in China.
Time of the data: the data span from 2013 to 2022, totaling 10 years.
Data processing: all data used for the DEA analysis had undergone non-negativity and zero-adjustment processing to ensure the accuracy of the model calculations.
The software used in this study: EAP 2.1, Frontier 4.1, and SPSS 27.0.1.0. All of this software is free versions.

3.2. Theratical Model

3.2.1. BCC-DEA Model

Due to the imbalanced development of the pharmaceutical industry in China and significant regional-scale differences, the BCC model is more adaptable compared to the fixed-scale CCR model. Additionally, both pharmaceutical enterprises and the industry as a whole are more focused on improving efficiency by reducing inputs, making an input-oriented approach more in line with practical needs. Therefore, this study employed the input-oriented BCC-DEA model. The theoretical model is as follows:
min θ ε i = 1 n s i + r = 1 s s r + s . t . j = 1 n x i j λ j + s i = θ x i j 0 , i ( 1 , 2 , , m ) j = 1 n Y r j λ j s r + = θ y r j 0 , r ( 1 , 2 , , s ) j = 1 n λ j = 1 θ , λ j , s i , s r + 0 , j = 1 , 2 , , n
In Equation (1), s i and s r + represent slack, where n and s are the numbers of input and output indicators. When θ = 1 , s i = 0 , and s r + = 0 , DMU j is strongly efficient, indicating that its production factors have reached an optimal combination and that output efficiency is optimal and the TE is at its best. When s i and s r + , any one of those elements’ slack, s, is non-zero.
The efficiency results obtained from the DEA-BCC model represent TE, which can be further decomposed into pure technical efficiency (PTE) and scale efficiency (SE) using the formula “TE = PTE * SE”.

3.2.2. SFA Model

Based on the regional cluster theory of Michael Porter, and Krugman’s theory of industrial agglomeration, industries, enterprises, institutions, and related organizations can generate synergistic effects through geographical agglomeration, thereby enhancing regional competitiveness and innovation capabilities. Regional cluster theory posits that geographical agglomeration is not only dependent on the physical location of enterprises but is also driven by multiple factors, such as the industrial chain, technological exchanges, and market demand, thereby promoting the collaborative development of the entire industry. In contrast, the theory of industrial agglomeration focuses on the clustering of enterprises within the same or related industries, emphasizing that such agglomeration can enhance competitiveness by sharing resources, reducing costs, improving production efficiency, and promoting technological innovation (Krugman, 1991; Porter, 1990a). In the context of the pharmaceutical industry, factors such as the local economic conditions, technological levels, and policy support collectively influence the development of the pharmaceutical industry in a region. To more accurately assess the operational efficiency of the pharmaceutical industry, it is necessary to eliminate the interference of external environmental factors and random errors in the efficiency measurement results.
First, the definition of the slack variable is in Equation (2):
S i j = x i j λ i j χ i j
According to the definition of slack in Equation (2), which represents the input slack of the i-th input factor in the j-th decision-making unit (DMU), this slack or the reason for inefficiency can be divided into three parts: environmental reasons, management reasons, and random disturbance. These can also be understood as the three causes of inefficiency. Equation (3) shows the impact of these three components on the input slack variable.
S i j = f ( Z j , β i ) + v i j + μ i j , j = 1 , 2 , , M ; i = 1 , 2 , , N
In Equation (3), S i j represents j-th input slacks for the i-th DMU. Z j represents the environmental variables (the values is from the PCA in this study), and β i represents their corresponding coefficients. Thus, f ( Z j , β i ) is the valued impact of environment on input slacks, which is generally assumed to be f ( Z j , β i ) = Z j β i , and v i j + μ i j is the composite error term ( ε i j ), which can decompose into a random error term ( v i j ) and a management inefficiency term ( μ i j ). The random error v i j follows a symmetric normal distribution N ( 0 , σ v 2 ) , representing statistical noise, while the μ i j follows a non-negative truncated normal distribution, N + ( 0 , σ u 2 ) , accounting for inefficiency effects (Luo, 2012). Additionally, the parameters and error terms can be estimated using the maximum likelihood estimation (MLE) method or the adjusted least squares (ALS) method, thereby obtaining technical efficiency.
Based on these assumptions, as follows the literature of Luo in 2012, managerial inefficiency can be calculated using Equations (4)–(9).
ε = S i j f ( Z j , β i )
σ μ = ( γ σ 2 )
σ v = σ 2 σ μ 2
σ = ( σ μ σ v ) / σ
λ = σ μ / σ v
E ( μ | ε ) = σ ϕ λ ε σ ϕ λ ε σ + λ ε σ
The random error term can be calculated using Equation (10).
v i j = S i j Z j ( β i ^ ) E ^ ( v i j | v n i + μ i j ) , j = 1 , 2 , , M ; i = 1 , 2 , , N
Readjusting the input factor variables can be achieved as follows:
x i j ^ = x i j + max n { Z j β i ^ } Z j β i ^ + max n { v i j ^ } v i j
where x i j ^ represents the adjusted input, and β i ^ represents the estimated coefficients of the external environmental variables and represents the estimated values of the random disturbance term.

3.2.3. PCA Method

Due to the complexity of the environment and the multicollinearity caused by the interaction among various environmental factors, it is necessary to reduce the dimensionality of these complex environmental factors and extract the main components, while eliminating the multicollinearity between variables. Therefore, principal component analysis (PCA) was used in this stage.
PCA is a dimensionality reduction method designed to extract the principal components by linearly combining the original variables, retaining the main information of the data while reducing redundancy between variables. PCA calculates the principal components through eigenvalue decomposition or singular value decomposition. These principal components are linear combinations of the original variables and are orthogonal (uncorrelated) to each other. The first principal component maximizes the explanation of the total variance of the data, while subsequent components explain the remaining variance. Typically, the first few components can retain most of the information. PCA does not require strict assumptions such as normality or linearity, making it suitable for high-dimensional data reduction, information compression, and the elimination of multicollinearity. The main steps of PCA are as follows (Greenacre et al., 2022):
(1)
Variable standardization: Standardize the original data so that all variables have the same scale. Due to significant scale differences between the pharmaceutical industries across provinces and large variations in the data, this study applied the min–max normalization method for standardization).
(2)
Calculation of the correlation or covariance matrix: compute the correlation matrix or covariance matrix based on the standardized data.
(3)
Eigenvalue and eigenvector decomposition: perform eigenvalue decomposition of the correlation or covariance matrix to obtain the eigenvalues and their corresponding eigenvectors.
(4)
Selection of principal components: select the principal components that explain most of the variance, usually choosing components that cumulatively explain more than 60% of the variance.
(5)
Calculation of principal component scores: Use the eigenvectors as weights to calculate the projections of the original data along the principal component axes, resulting in principal component scores. Through these steps, PCA reduces the number of initial variables, retaining principal components that carry the main information and form the underlying structure of the data.

3.3. The Design of the Indicators

Input indicators: In this study, total assets ( X 1 ), the number of employees ( X 2 ), and R&D investment ( X 3 ) were applied as the input indicators. First, the total assets of the pharmaceutical industry in a given region represent the capital strength and resource allocation capacity of the sector. The number of employees, as a crucial indicator of human resources in the industry, directly affects production efficiency and talent reserves, especially in the pharmaceutical sector, which is highly dependent on skilled professionals. Lastly, R&D investment, as a key driver of technological advancement in the pharmaceutical industry, directly impacts new drug development, improvements in production processes, and the overall market competitiveness of enterprises. This indicator not only reflects a company’s commitment to innovation but also plays a significant role in determining the future development potential of the industry (Gascón et al., 2017; Lin et al., 2021).
Output indicators: In this study, total sales ( Y 1 ), total profit ( Y 2 ), new product sales ( Y 3 ), and the number of patents ( Y 4 ) were adopted as output indicators in the dimension of financial and innovation capability. Total sales represent the market size and industrial competitiveness of the PI in a region. Total profit indicates the profitability and cost control efficiency of the pharmaceutical industry. The sales of new products measure the market conversion capability of technological innovation achievements within the PI. Lastly, the number of patents quantifies the technological innovation capacity of the PI, reflecting its accumulation of intellectual property and research strength (Gascón et al., 2017; Lai et al., 2020; Qiu et al., 2023).
Environment indicators: When selecting potential environmental indicators for principal component analysis, consideration was given to the potential impacts of political, economic, and cultural factors, as well as technological innovation and ecological resources (Imran & Jijian, 2023; Imran et al., 2024b, 2025a, 2024c, 2025b; Tang & Imran, 2024; W. Wang et al., 2024). Therefore, the main principle was to choose those that effectively reflect key factors of industrial development while also considering that these indicators are typically macroeconomic conditions that the pharmaceutical industry cannot directly control. Key indicators in the economic environment, such as economic level, income level, foreign investment, and regional fiscal revenue, directly affect the operation and development of the pharmaceutical industry. In the social environment, the population structure and education level influence the source of the workforce in the pharmaceutical industry. In the technological environment, indicators such as the number of patent applications, government investment in technological innovation, and the ability to transfer scientific achievements are crucial factors affecting the technological development of the pharmaceutical industry. In the ecological environment, the level of pollution control directly impacts the production compliance and sustainable development of the pharmaceutical industry (Lai et al., 2020; Qin et al., 2023; Qiu et al., 2023; Sun et al., 2024; Yan, 2012).
Therefore, these 23 macro-environmental factors, as potential influences on the operation of the pharmaceutical industry, are selected for principal component analysis in this study. These are used to extract the principal components. Four main components were extracted, namely economic and technological foundation ( Z 1 ), residents’ living standards ( Z 2 ), local pollution levels ( Z 3 ), and the level of openness to the foreign market ( Z 4 ). The extraction process and variance details can be found in Section 4.4 of this study.
In summary, all variables used in this study are summarized in Table 1.

4. Empirical Result

4.1. Positive Verification of Input-Output Variables

When applying the DEA method for efficiency measurement, first of all, it is essential to ensure that the input and output indicators satisfy the condition of directional consistency, meaning that an increase in an input factor should lead to a corresponding increase in the output. In this study, Pearson correlation tests were used to verify the directional consistency between inputs and outputs. The results of the Pearson correlation are presented in Table 2.
Since all input and output variables exhibit positive correlation coefficients, with relatively high values, they indicate that an increase in inputs leads to a corresponding increase in outputs. Additionally, the p-values are less than 0.01, suggesting that the observed correlation is not due to random fluctuations but is highly reliable. This aligns with the directional consistency condition required by the DEA model, confirming a significant positive correlation between inputs and outputs.

4.2. Efficiency Measurement Result in the First Stage

In the first stage, efficiency measurement was conducted using DEAP 2.1, based on the input-oriented BCC model. The detailed results of the measurement are presented in Table 3. Technical efficiency (TE) is a comprehensive measure of the PI in a region’s ability of efficiency in resource allocation and utilization, while pure technical efficiency (PTE) reflects the production efficiency influenced by factors such as management and technology. Scale efficiency (SE) assesses the impact of scale factors on production efficiency. The overall TE of the sample enterprises, referred to operation efficiency in the region, is the product of PTE and SE.
As shown in Table 3, of the 31 provincial-level regions in China, Tianjin, Liaoning, and Tibet exhibit the highest levels of both TE and PTE, while Ningxia, Gansu, and Xinjiang have the lowest levels of TE and PTE. In this stage, the regional disparities in China’s PI are illustrated in Figure 5, and the regional distribution of overall TE in China can be found in Figure 6a.

4.3. The Results of the SFA Regression in Stage 2

In the first step of the second stage, it is necessary to extract the key environmental variables from a large number of potential environmental factors. Additionally, due to the large number of environmental factors, multicollinearity issues may arise in the regression analysis, which could affect the robustness of the results. Therefore, in the first step of the SFA, principal component analysis (PCA) is used to extract the principle components from the various environmental factors. This approach not only provides a comprehensive value of the environmental variables but also effectively eliminates the impact of multicollinearity, enhancing the reliability of the model.
Therefore, the second stage of this study was divided into two parts. The first part involved extracting the environmental variables, while the second part conducted the SFA regression analysis of the input slack variables and the environmental variables.

4.3.1. Extraction of Environmental Variables

In this study, 23 environmental factors that could potentially influence the efficiency of the pharmaceutical industry, but which cannot be controlled, were collected. These factors encompass aspects such as economic foundations, consumption levels, foreign investment, local fiscal revenue, investment in technology and education, and the composition of the labor force.
(1)
Step 1: Method suitability verification.
The suitability of the data for principal component analysis (PCA) was verified using the Kaiser–Meyer–Olkin (KMO) measure, and cumulative variance was explained. When the KMO value is greater than 0.6, it indicates strong correlations between the variables, making the data suitable for PCA. If the KMO value is below 0.6, it suggests weak correlations between the variables, making the data unsuitable for PCA. Additionally, when the cumulative variance explained is 70% or higher, it indicates that the extracted principal components effectively explain the majority of the variation in the original data, making the data suitable for further analysis. Conversely, if the cumulative variance explained is below 70%, it suggests that the extracted components do not adequately capture the main information in the data (Hair et al., 2010). Table 4 shows the KMO measure and Bartlett’s test results, while Table 5 presents the analysis of cumulative variance before and after rotation.
As shown in Table 4, the KMO value is 0.902, which exceeds the acceptable threshold of 0.60, indicating that these environmental factors are well suited for the principal PCA method. Furthermore, Bartlett’s test of sphericity results ( χ 2 = 15,737 , d f = 253 , p < 0.001 ) demonstrate significant correlations between the variables, further validating the appropriateness of conducting PCA.
As shown in Table 5, after PCA was applied, only four main principle components were extracted from the 23 potential environmental factors. These principal components collectively already explain 89.35% of the total variance, indicating a very high level of explanatory power in the dataset.
(2)
Step 2: Rotated component.
In PCA, the initially extracted components may be complex, with variable loadings that are difficult to clearly distinguish, which hinders the interpretation of the results. Therefore, rotating the components helps simplify the structure of variable loadings, allowing each variable to concentrate on a few main components. This increases the interpretability of the principal components, clarifies their actual meaning, and enhances the explanatory power regarding the study subject. Table 6 presents the results of the rotated component loading matrix.
Based on the results of the rotated component matrix in Table 6, four principal components were extracted. To better interpret the environmental factors reflected by each principal component, only variables with loadings greater than 0.5 were retained. For the purpose of the subsequent efficiency analysis, the extracted factors were classified and named according to the characteristics of the principal components.
(3)
Step 3: Name component.
Principal Component 1: economic and technological foundation level ( Z 1 ).
The first principal component includes variables such as regional economic levels, government fiscal revenue, and government investments in technology, education, innovation, and technological outputs. Therefore, this component reflects the region’s economic development and innovation capacity, and it is named “Economic and technological foundation level”.
Principal Component 2: residents’ living standards ( Z 2 ).
The second principal component comprises variables like per capita GDP, resident income, and consumption levels, which reflect the living quality and economic status of the region’s residents. Thus, this component is named “Residents’ Living Standards”.
Principal Component 3: local pollution levels ( Z 3 ).
The third principal component primarily consists of waste emissions and pollution levels in the natural environment. The higher the pollutant emissions, the higher the local pollution level, which is why this component is named “Local Pollution Level”.
Principal Component 4: openness to the foreign market ( Z 4 ).
The fourth principal component is mainly composed of variables related to foreign investment, reflecting the region’s level of openness and its ability to attract foreign capital. Hence, this component is named “Openness to the foreign market”.

4.3.2. The Result of the SFA Regression

The objective of this stage was to reveal how environmental variables affect efficiency. To achieve this objective, the principal components extracted from the PCA in the previous stage were used as the IV, while the input slacks obtained in the first stage were used as the DV, and SFA regression was then conducted using Frontier 4.1 to examine the impact of environmental variables on efficiency. The regression results are presented in Table 7.
As shown in Table 7, the likelihood ratio (LR) test values for the three input slack variables are 204.38, 204.72, and 310.85, respectively, all significantly exceeding the critical value of the mixed chi-square distribution at the 1% significance level (10.83). This confirms the suitability of the model and the validity of the assumptions. At the same time, the γ values are close to 1, indicating that the input slack is primarily caused by managerial inefficiency, rather than random noise. This suggests that there is significant potential for management optimization to improve operational efficiency. By optimizing management and adjusting strategies, input slack can be effectively reduced, further enhancing the operational efficiency of the pharmaceutical industry.
From Table 7, it can be seen that external environmental factors have a complex impact on the operational efficiency of the pharmaceutical industry. For example, the local economic and technological innovation capabilities can reduce asset allocation through innovation, thereby reducing the enterprise’s input. On the other hand, the standard of living increases input from various aspects, indicating that, in regions with higher living standards, input in the pharmaceutical industry increases, which is not conducive to its development. Regions with a higher environmental capacity tend to increase investment in labor and assets, but they can reduce R&D investment. In contrast, regions with higher openness to the outside world increase investment in assets while reducing the number of employees, indicating that foreign investment upgrades asset allocation and reduces labor input. A detailed analysis of these impacts is presented in Section 5.
Another research objective of this stage was to exclude the influence of environmental factors and random noise on efficiency to provide a more equitable environment and place all DMUs at the same level of randomness, ultimately calculating the adjusted input values. The specific calculation process was as follows.
After Frontier was run, the environmental values were calculated using the coefficients in Table 7, and the principal component shares were obtained through PCA. Subsequently, Formulas (4)–(9) were applied to calculate managerial inefficiency, and random errors were estimated using Formula (10). Finally, adjusted input values were obtained through Formula (11). This series of calculations eliminated the interference of environmental impacts and random errors, ensuring that the efficiency values reflect only the managerial issues within the enterprises themselves.

4.4. The Result of Stage 3

In Stage 3, the BCC-DEA model was employed, with the adjusted inputs obtained in Stage 2 and initial outputs. All the results are presented in Table 2.
As shown in Table 2, the overall average technical efficiency values in the first and third stages do not differ significantly, with the most notable difference observed in pure technical efficiency. Since this study uses cross-sectional data, the efficiency values obtained represent the relative efficiency between the DMUs. In the third stage, Tianjin remains the region with the highest pharmaceutical-industry efficiency, while Liaoning and Jiangxi have shown significant improvements. This suggests that the efficiency of these two regions was underestimated in the previous stage and indicates that the environmental conditions in these regions are not conducive to the development of the pharmaceutical industry. The regions with the lowest technical efficiency are the same as in the first stage, indicating that the development of the pharmaceutical industry in these regions remains suboptimal.
An analysis of efficiency trends reveals notable advancements in areas like Heilongjiang, Beijing, and Sichuan. This implies that the initial assessments may have undervalued the efficiency levels in these regions. Moreover, it underscores the challenging environmental circumstances that are less conducive to the growth of the pharmaceutical sector in these locales. In contrast, the regions that experienced significant declines in efficiency include Tibet, Ningxia, Fujian, and Qinghai. Moreover, all provinces in the northwest have seen a decline in efficiency, suggesting that the external environment is currently more favorable for the development of the pharmaceutical industry in other regions.
As shown in the table, the average efficiency has shown a consistent upward trend over the years, increasing from 0.642 in 2013 to 0.767 and indicating a continuous improvement in efficiency levels. Additionally, the probability distribution of efficiency for each year also shows some improvement. The Gaussian distribution graph based on the efficiency distribution across 31 provinces each year is shown in Figure 2.
As shown in Figure 2, there was a noticeable change in the overall efficiency distribution. In 2013, the efficiency values were concentrated in the lower range, with a relatively broad distribution, indicating low efficiency and significant disparities. Over the years, the curve gradually shifted to the right, reflecting an increase in efficiency levels, and the distribution became more concentrated, showing higher efficiency values. By 2022, the efficiency level had significantly improved, with a steeper distribution, indicating reduced efficiency disparities and a more balanced overall efficiency. This change reflects the gradual improvement in the efficiency of the pharmaceutical industry and the narrowing of efficiency gaps across different regions.
Meanwhile, the coefficient of variation (CV, calculated as average efficiency/SD) decreased from 0.352 to 0.191, indicating a reduction in the disparity of efficiency levels. The decline in the coefficient of variation suggests that the efficiency levels across different regions are becoming more balanced, which may reflect an increase in the fairness of resource allocation or faster efficiency improvements in underdeveloped regions.
This section applies a three-stage DEA method combined with PCA to measure the operational efficiency of the pharmaceutical industry across 31 provinces in China in the holistic dimension and to reveal the impact of comprehensive external factors on operational efficiency. However, the causes of these differences are multifaceted, and the current section will provide a detailed discussion of the factors contributing to these disparities.

5. Discussion

In the empirical analysis of the previous chapter, it was found that the overall efficiency of China’s pharmaceutical industry is gradually increasing, with the gap between regions narrowing. However, different regions exhibit distinct trends. Additionally, the study revealed the specific impact of environmental factors on efficiency. The following sections will further explore the underlying causes of these phenomena.

5.1. Discussion on the Efficiency Distribution of the Pharmaceutical Industry Across China’s Regions

The results presented in the results section reveal that there are differences in efficiency across regions in both the first and third stages. To further explore the overall differences in the operational efficiency of the PI across regions and the underlying causes, this study decomposed TE into PTE and SE. By using the average values of TE and SE as thresholds, the efficiency of each region was classified into four quadrants: high PTE–high SE, high PTE–low SE, low PTE–high SE, and low PTE–low SE. Figure 3 illustrates the relative positions of the regions based on their PTE and SE performance.
(1)
Efficiency analysis of pharmaceutical enterprises in first-tier regions.
Pharmaceutical enterprises in first-tier regions, including Tianjin, Liaoning, and Jiangxi, exhibit high PTE and SE. These regions demonstrate strong resource allocation capabilities and significant economies of scale, leading to higher overall efficiency. While the economic strength of these regions is not the highest, they effectively leverage abundant human resources, low labor costs, and strong government support to optimize resource utilization. Through the synergistic effects of technology, resources, and policies, these regions have developed their unique high-efficiency models. Additionally, the well-established industrial support foundation in these regions promotes inter-industry coordination, which further enhances both technical and scale efficiencies.
(2)
Efficiency analysis of pharmaceutical enterprises in second-tier regions.
Pharmaceutical enterprises in second-tier regions also show high PTE but relatively low SE. These regions include Jiangsu, Shandong, Guangdong, and Ningxia. Except for Ningxia, the other provinces (Jiangsu, Shandong, Guangdong) are among the economically strongest in China. According to the SFA analysis, the high efficiency in Ningxia is primarily due to favorable environmental factors such as strong national support, a large environmental capacity, and the relatively low income and living standards of the local population, which together create a high level of resource allocation.
However, enterprises in Jiangsu, Shandong, and Guangdong, despite their strong performance in technical innovation and resource allocation, efficiently utilize technology and management methods to achieve high technical efficiency. These regions’ enterprises possess advanced production technologies and robust R&D capabilities. However, despite their strengths in technological efficiency, they have struggled to achieve economies of scale during expansion, resulting in a persistent situation of decreasing returns to scale (DRS) over the past decade. This phenomenon can be attributed to factors such as market saturation, with enterprises finding it difficult to match increased production capacity with sufficient market demand, inefficient resource allocation, despite strong technological performance, with issues in the distribution of resources such as funds, talent, and equipment, and management bottlenecks, through which the original management system is unable to adapt to the complexity brought about via scale expansion, thereby limiting the improvement of scale efficiency.
(3)
Efficiency analysis of pharmaceutical enterprises in third-tier regions.
Pharmaceutical enterprises in third-tier regions show high SE but relatively low PTE. These regions include Beijing, Shanghai, Chongqing, Hunan, Henan, and Yunnan. The potential causes for the low PTE in these regions vary. For instance, in Chongqing, Beijing, and Shanghai, although these regions possess strong economic and technological foundations, they are hindered by strict environmental and safety policies. High environmental protection requirements in places like Beijing and Shanghai have restricted investment in technological upgrades and innovation, thereby limiting improvements in technical efficiency. Additionally, high production factor costs, such as labor, land, and energy prices, have become significant obstacles to enhancing technological performance. Despite these constraints, enterprises in these regions can achieve economies of scale through market size advantages and industrial agglomeration effects, which allow them to lower unit costs through increased production.
In contrast, enterprises in regions like Hunan and Yunnan, despite facing challenges in technical efficiency, have performed well in scale efficiency. These regions’ enterprises have relatively limited investments in technological innovation and R&D, which results in stagnation in technological progress and affects their production efficiency. However, due to lower production factor costs and government policy support, such as tax reductions and industrial subsidies, enterprises in these regions can achieve economies of scale. The local government’s policies further enhance the efficiency of enterprises when expanding production to meet the growing market demand, thereby boosting scale efficiency.
(4)
Efficiency analysis of pharmaceutical enterprises in fourth-tier regions.
Pharmaceutical enterprises in fourth-tier regions, such as Gansu and Shanxi, generally exhibit low TE and PTE. These regions’ enterprises mainly rely on traditional technologies and relatively extensive management models, lacking advanced technical support and process optimization. As a result of insufficient technological innovation, the production efficiency in these regions is low. Moreover, the geographical locations and economic foundations of Gansu and Shanxi make them less attractive for highly skilled talent and technological capital, preventing enterprises from absorbing external advanced technologies and management experience. The severe shortage and outflow of local talent have further constrained technological improvements. Additionally, the weak economic foundation and limited government support for technological innovation and research restrict the ability of enterprises to invest in necessary upgrades, leading to a lack of improvement in technical and pure technical efficiency.

5.2. Discussion on the Changes in Regional Efficiency and Their Causes

Over the past decade, the overall efficiency of the PI has shown an upward trend. However, it is important to note that, in some regions, efficiency has declined year by year. Therefore, this study divides the 31 regions of China into seven large areas and decomposes the TE of these areas into PTE and SE. PTE reflects the efficiency improvements achieved through technological innovation or resource allocation optimization in a region, excluding the impact of economies of scale, while SE measures whether a region can effectively achieve economies of scale as production scale increases. Figure 4a–c show the changes in pharmaceutical-industry efficiency in the seven large regions of China over the decade.
As shown in Figure 4a, the overall efficiency of China’s PI has steadily increased over the past decade, with most regions experiencing relatively stable changes and minimal fluctuations. This indicates that the overall development trend of the PI is stable, and efficiency is gradually becoming balanced. However, certain regions have shown persistent increases or decreases in efficiency. This suggests that, although the overall trend is positive, some areas still face different challenges and opportunities, necessitating a more in-depth analysis of the underlying causes.
The operation efficiency of Central China (including Henan, Hubei, and Hunan) experienced a noticeable decline from 2013 to 2022. A decomposition of TE reveals that the primary reason for this decline is low PTE. The possible causes include inefficient resource allocation and insufficient innovation output in these regions, which have constrained the improvement of PTE. Specifically, the lack of innovation capacity in the central region (including Henan, Hubei, and Hunan) has resulted in poor performance in technological advancement and production efficiency optimization, thereby limiting the enhancement of PTE. These three provinces lag behind in technological innovation, potentially due to insufficient government emphasis on pharmaceutical research and development (R&D), limited investment in R&D, and a continued reliance on traditional production methods. The lack of introduction and application of new technologies has further constrained the improvement of production efficiency. Moreover, the pharmaceutical industry in the central region remains predominantly focused on manufacturing, leading to slow progress in technological upgrading and industrial transformation. The issue of brain drain is also prominent in these provinces, with a shortage of high-end technical and innovative talent further restricting the development of technological innovation. Inadequate policy support and financial investment from the government have weakened the motivation of enterprises to engage in R&D and technological transformation, making it difficult to establish an effective innovation ecosystem. Therefore, the central region faces multiple challenges in improving operational efficiency and technical efficiency. It is imperative to address these issues by increasing R&D investment, optimizing resource allocation, promoting industrial upgrading, and attracting high-end talent to improve the current situation.
In contrast, the TE in Southern and Northwestern China has significantly improved from 2013 to 2022. Given the economic characteristics and scale differences between these two regions, further decomposition of the TE into PTE and SE reveals different underlying causes for the improvement. As is shown in Figure 4b, the increase in TE in Southern China is primarily due to improvements in PTE, while the efficiency improvement in Northwestern China is mainly attributed to SE. This suggests that the driving forces behind growth in these regions are distinct, and targeted strategies are needed to promote their continued development.
The annual increase in TE in Southern China is primarily due to improvements in pure technical efficiency. Southern China, being one of the most economically developed regions in the country, has seen substantial support from both the government and enterprises for high-tech industries, particularly in sectors such as pharmaceuticals, electronics, and advanced manufacturing, with research and development investments increasing annually. Additionally, the southern region benefits from well-developed infrastructure and a strategic geographical location, attracting a concentration of high-end technical talent and innovative enterprises and thereby further optimizing resource allocation efficiency. Improvements in management practices and production organization methods have also contributed to higher production efficiency. These factors collectively underpin the region’s outstanding performance in PTE, driving the overall improvement in technical efficiency. Moving forward, if the southern region continues to prioritize technological innovation and talent acquisition while further optimizing industrial structure and resource allocation, its technical efficiency is expected to achieve even greater progress.
The improvement in TE in Northwestern China is mainly driven by SE. The likely cause is that PI in this region has expanded production scale, achieving economies of scale, which, in turn, has enhanced TE. An analysis of returns to scale (RTS) reveals that, over the past decade, in the total 50 samples from the five provinces in Northwestern China, only one year exhibited decreasing returns to scale (DRS), while the remaining years were under increasing returns to scale (IRS). This indicates that increasing scale investments in the region can further improve efficiency. With the transfer of the PI to Northwestern China, SE in this region has improved, leading to an increase in TE. This industrial relocation is primarily attributed to national policy support, relatively lenient environmental regulations, and abundant environmental capacity. In recent years, the Chinese government has implemented strategies such as the “Western Development” and the “Belt and Road” initiatives, providing tax incentives, fiscal subsidies, and infrastructure support to the northwestern region, thereby attracting a significant number of pharmaceutical enterprises. Simultaneously, the relatively relaxed environmental standards in the northwest have reduced operational costs for enterprises, while its vast land, sparse population, and abundant natural resources have provided favorable conditions for large-scale production. These factors collectively contributed to the improvement of scale efficiency and, through economies of scale, promoted the enhancement of technical efficiency, injecting new momentum into regional economic development. In the future, if the northwestern region can further strengthen infrastructure construction, optimize the business environment, and enhance technological innovation capabilities, the development potential of its pharmaceutical industry will become even more significant.

5.3. The Discussion of Regional Disparities in China’s Pharmaceutical Industry

To further discuss the regional disparities of PI across different regions in China, this study employed the coefficient of variation (CV) as an indicator. A larger CV indicates regional disparities between regions, suggesting an uneven distribution of resource allocation and operational efficiency. In contrast, a smaller CV reflects more balanced operational efficiency, implying relatively rational resource distribution. Figure 5 presents the CV trend of TE in PI across 31 regions from 2013 to 2022, giving deeper insights into developmental disparities between regions.
As shown in Figure 5, both in Stage 1 and Stage 3, despite a slight increase in the coefficient of variation (CV) between 2017 and 2019, the overall trend shows a significant decline. This suggests that the regional disparities in China’s pharmaceutical industry are gradually narrowing.
The potential reasons for this include government macro-control measures and the changes in scale efficiency brought about via industrial transfer. Firstly, the government has implemented stringent safety, environmental, and tax policies in developed regions, which have placed significant pressure on the pharmaceutical industry, particularly on pollution-intensive sectors such as active pharmaceutical ingredients (APIs) and pharmaceutical intermediates. This has prompted these industries to gradually shift to underdeveloped regions, contributing to a more balanced regional distribution. Additionally, pharmaceutical companies tend to choose regions with fewer regulations, tax incentives, and larger environmental capacities for their development.
However, the increased disparity between 2017 and 2019 could be attributed to major policy adjustments, such as centralized procurement and a consistency evaluation of the generic drug in PI. Industries such as APIs and intermediates, which could not participate in centralized procurement and consistency evaluation, experienced a decline in overall output, thereby increasing regional disparities.

5.4. Discussion of the Impact of the Environment in Different Regions

To analyze the impact of existing environments on the pharmaceutical industry (PI) across different regions, this study compared the 10-year average technical efficiency of Stage 1 and Stage 3. If the technical efficiency has increased, it suggests an underestimation of efficiency in Stage 1, further indicating that the local environment is unfavorable for PI development. Conversely, if efficiency has decreased, it implies an overestimation of efficiency, and the region’s environment is conducive to PI development.
Figure 6 presents the efficiency distribution of the 31 provinces in Stage 1 and Stage 3. Figure 6a shows the average efficiency distribution of each region in Stage 1, while Figure 6b illustrates the efficiency distribution in Stage 3. Figure 6c compares the changes between Stage 1 and Stage 3.
As shown in Figure 6, after the impact of environmental factors was removed, the efficiency of 10 provinces decreased, while 21 provinces experienced efficiency improvements. In the 10 provinces where technical efficiency declined, some saw a decline exceeding 10%. Notably, most of these provinces are located in the western regions of China, with the exception of Fujian. In contrast, the provinces that experienced efficiency gains are generally more economically developed, indicating that, over the past decade, environmental factors have had a negative impact on the development of the pharmaceutical industry in these regions.
According to the empirical results from SFA, economic and innovation foundations can effectively reduce asset investment in the PI. However, regions with high levels of economics and innovation always have higher living standards. Therefore, regions with medium economic or income levels, such as Sichuan, Henan, Hebei, and Heilongjiang, have become unfavorable for the development of the PI.
In contrast, regions like Shanghai, Jiangsu, Guangdong, Zhejiang, and Shandong, despite having the highest living standards nationwide, also exhibit the highest levels of innovation and foreign investment. These advantages partially mitigate the adverse effects of high living costs, rendering these regions comparatively less unfavorable for the development of the PI.
As the capital of China, Beijing has high innovation capabilities. However, compared to developed regions such as Shanghai, Jiangsu, and Guangdong, its natural environmental conditions are relatively less favorable. Consequently, Beijing has implemented some of the most stringent safety management and regulatory frameworks in the country. To address environmental pressures and ensure public safety, the Beijing municipal government has enforced stricter environmental protection regulations and safety production standards, such as limits on pollutant emissions, oversight of high-risk industries, and rigorous requirements for pharmaceutical production processes. While these stringent regulatory measures help improve environmental quality and safety production levels, they also increase operational costs and management challenges for enterprises. As a result, compared to regions like Shanghai and Guangdong, Beijing has become an unfavorable environment region for the development of the PI.
National development strategies have explicitly demonstrated policy support for the PI in the western region. Since the implementation of the Western Development Strategy in 2000, the PI in this region has made significant strides, largely due to targeted policy support and resource allocation. Notably, the release of the Catalogue of Advantageous Industries for Foreign Investment in Central and Western China (2014) and the Catalogue of Encouraged Industries in the Western Region (2020 and 2025 editions), alongside supporting regulations on environmental protection and safety production, has further solidified national support for the pharmaceutical industry in the western region. These policies not only provide clear guidance for the sector’s development but also foster its clustering, greening, and high-quality growth through various measures such as tax incentives, fiscal subsidies, and land use policies. This multi-level and multidimensional policy support framework has established a strong foundation for the sustainable development of the pharmaceutical industry in the western region. Policy support in western China has facilitated the gradual relocation of the PI to this area, leading to a sustained improvement in SE, particularly in the five provinces of Northwestern China. Among the 50 samples over the past decade, 49 exhibited IRS. As a result, this industrial transfer has significantly enhanced resource allocation efficiency and productivity levels by expanding production scale and achieving economies of scale. This has fundamentally driven the improvement of SE and ultimately positioned Northwestern China as an advantageous area with favorable environmental conditions and significant potential for PI development.
Further analysis of the pharmaceutical industry’s characteristics reveals that it is a high-pollution sector. Compared to traditional chemical industries, pharmaceutical production not only generates significant pollution but also involves high concentrations, high salinity, and high activity, all of which are difficult to treat (Chaturvedi et al., 2021; Okeke et al., 2022; Tang et al., 2019; Wu et al., 2023; Y. Zhang et al., 2024). Additionally, since most pharmaceutical companies in China engage in generic drug production, they occupy lower positions in the industrial chain. With the development of China’s industrial sector, regional industrial economies have been continuously undergoing structural adjustments, and the development of the PI, particularly in the active pharmaceutical ingredient and intermediate sector, faces significant challenges.
From the perspective of the comparative advantage theory, pharmaceutical companies, when establishing a new industry site, tend to choose locations based on a variety of factors, prioritizing areas with better tax incentives and environmental capacity. This phenomenon also applies to the development of the PI. Recent investment policies and industrial developments show that the chemical pharmaceutical industry faces significant challenges in developed regions such as Zhejiang, Jiangsu, Shanghai, Beijing, and Guangdong. This indicates that the relocation of the PI to the Northwestern regions is both a result of comparative advantage and further enhances the scale effects in those areas.
In summary, empirical analysis has shown that the efficiency of China’s pharmaceutical industry has presented an upward trend, and regional disparities have gradually decreased, reflecting a positive development trend in the industry. However, it is also important to note that the development of certain regions deviates from this trend. This chapter analyzes the causes of these deviations by decomposing TE. Additionally, by comparing the efficiencies of Stage 1 and Stage 3, the impact of environmental factors on the operational efficiency of the pharmaceutical industry is examined, thereby identifying the regions most favorable for the development of the pharmaceutical industry.

5.5. The Relationship with Existing Research

By empirical analysis, this study finds that there are regional disparities in China’s pharmaceutical industry, which is consistent with some existing studies (Qiu et al., 2023; Sun et al., 2024; Zhong et al., 2022). However, it also reveals that regional differences in Chinese pharmaceutical enterprises have gradually decreased, a finding that has not yet been reported in the existing literature.
Additionally, this study finds that environmental factors have a significant impact on the development of the pharmaceutical industry, which aligns with similar findings in the existing literature (Sun et al., 2024). However, by conducting a detailed comparison of the efficiency differences between Stage 1 and Stage 3, this study further highlights that, among the 31 provincial-level units in China, the five provinces in Northwestern China are in regions more favorable for pharmaceutical industry development. While this finding is similar to those in existing literature, it provides a more comprehensive and representative perspective.
The deeper reason is that China’s pharmaceutical industry is also constantly upgrading, from the early APIs and pharmaceutical intermediate in the international pharmaceutical industry chain moving towards final drugs and innovative drugs. China’s industrial foundation and environmental capacity influence the migration of this industrial distribution. High-end industries tend to gather in areas with high technology, high innovation, and better management. PI has the characteristics of high innovation, high pollution, and, at the same time, a variety of industries together; therefore, it can choose different regions according to the position in the industrial chain Deore et al. (2019); Feng and Li (2020); Madabushi et al. (2022); Mohs and Greig (2017); Solanki et al. (2024).

6. Conclusions

6.1. Main Findings of This Study

The objective of this study was to evaluate the operation efficiency of the pharmaceutical industry from the combination of financial and innovation dimensions and to reveal the impact of comprehensive environments on operation efficiency. The following findings were obtained through empirical analysis.
The research findings suggest that the operation efficiency of China’s PI has shown a steady improvement over the years, maintaining overall stability. However, significant efficiency disparities persist across regions. In Central China, efficiency has exhibited a general downward trend, primarily driven by a decline in PTE. In contrast, Southern China has experienced an upward trend in efficiency, which is attributed to improvements in PTE. Meanwhile, the efficiency improvements in Northwestern China can be largely explained by enhancements in SE. Although regional imbalances remain, these disparities are decreasing.
In terms of the impact of environmental factors on efficiency, the study demonstrates that innovation capabilities and the innovation environment have a positive influence on the operational efficiency of the PI, whereas higher living standards and ecological environment levels in certain regions are found to hinder efficiency improvements. Regionally, the environmental conditions in Northwestern China are identified as particularly conducive to the development of the PI. Conversely, the operating environments in regions such as Sichuan, Henan, Hebei, and Heilongjiang are considered negative for the operational efficiency of the PI.

6.2. Implication of This Study for Policy-Makers

Based on the empirical results of SFA, policymakers should focus on the following two aspects to enhance the operational efficiency and environmental sustainability of the pharmaceutical industry.
Enhancing environmental capacity and waste treatment facilities.
Policymakers can increase the local environmental capacity and waste treatment infrastructure, reducing the emission of waste, and alleviating the waste discharge pressure on the PI in the local region. This measure not only helps improve environmental quality but also directly reduces the costs for the PI. One of the specific policy recommendations is to establish regional waste treatment centers. Local governments should set up large-scale regional waste treatment facilities that would coordinate waste management across regions, adopt modern circular-economy technologies, and improve the comprehensive utilization of waste. This approach would prevent environmental capacity from becoming a constraint on the development of the pharmaceutical industry. Furthermore, the government should seek a balance between environmental governance and regulatory constraints, for instance, by simplifying approval processes, providing technical support, and implementing subsidy policies to gradually enhance the local industry’s environmental governance capabilities. This collaborative mechanism not only aids in achieving the government’s governance objectives but also fosters the concurrent improvement of internal governance capabilities within industries, thereby realizing a win-win situation for both environmental protection and industrial development.
Increasing investment in technology, education, and environmental protection.
As the SFA showed, although investments in technology, education, and environmental protection do not show significant correlations with labor input and R&D investment, these investments can significantly reduce asset input in the PI, increasing the operational efficiency. One of the specific policy recommendations is to develop a regional green technology industrial cluster. Governments should initiate the setting of regional green technology industrial bases to promote coordinated innovation capabilities. For example, the Collaborative Innovation Center of the Yangtza River Delta Region Green Pharmaceuticals serves as a successful model. Such an organization should be further expanded to another place in order to enhance the regional innovation capacity. It is also crucial to recognize that investments in education, environmental protection, and technology may encounter funding constraints in less developed regions. Policymakers should explore diversified financing mechanisms, such as leveraging social capital, establishing dedicated funds, or implementing public–private partnership (PPP) models, to mitigate financial pressures and ensure the sustainability of such investments.
Countries all over the world implemented substantial policy support for their PI. For instance, the United States encourages pharmaceutical companies to increase research and development expenditures through the "R&D Tax Credit" policy. Furthermore, the government allocates research funding through institutions such as the National Institutes of Health and the Biomedical Advanced Research and Development Authority, aiming to facilitate the development of innovative drugs and vaccines. Similarly, the European Union and Japan have enacted significant policies to support their domestic pharmaceutical sectors. The European Union, through the European Medicines Agency (EMA), offers a centralized approval process for multinational pharmaceutical companies and promotes drug innovation and accessibility via public health initiatives. In Japan, the government enhances pharmaceutical industry innovation by streamlining drug approval procedures, providing research grants, and offering tax incentives.
As a developing country, China can gain valuable insights from the experiences of those nations, particularly in policy making. For instance, increasing investment in innovation for major disease areas, accelerating the pharmaceutical industry’s approval processes, and providing tax incentives and financial support for the PI could increase the overall innovation capacity of China’s pharmaceutical industry.
Optimization of the PI structure based on operational environment.
From the perspective of the industrial layout of the national PI, it is essential to emphasize regionally coordinated development and differentiated positioning to optimize resource allocation and enhance the efficiency of the industrial chain. A specific policy recommendation is to focus on developing high-value-added sectors such as biotechnology, contract research organizations (CROs), and the headquarters economy of the PI in regions with strong innovation-driven capabilities, such as Beijing, Shanghai, and Guangdong. Simultaneously, corresponding industrial bases should be established in regions with favorable environmental conditions, such as Gansu and Shaanxi, to ensure the coordinated development of the pharmaceutical industry chain. This approach will promote balanced resource allocation and enhance the overall efficiency of the PI.

6.3. Limitations of This Study

Despite the use of three-stage DEA integretate with PCA, which can extract multiple environmental components, this study involved the following limitations.
Firstly, this study primarily focused on the operational efficiency and influencing factors of the Chinese PI, without incorporating comparative analyses of the international pharmaceutical industry. As a result, it failed to reveal the gaps of PI in China and other countries.
Secondly, due to limitations in official data sources, this study was unable to obtain detailed resource allocation method for individual units in PI, preventing in-depth empirical research at the enterprise level. Consequently, the implications of this study for individual units (e.g., pharmaceutical companies) are limited.
Since this study primarily focused on overall trends, cross-sectional data were employed for analysis. However, cross-sectional data only capture efficiency at a specific point in time and overlook the dynamic changes over time. Future research could combine both cross-sectional and panel data to provide a more comprehensive analysis, exploring the temporal changes and regional differences in the operational efficiency of the pharmaceutical industry.

6.4. Future Research

To address the limitations, future research can be conducted in the following directions.
International comparative studies: By conducting horizontal comparisons between the China and and the international countries, the operation efficiency levels of the Chinese PI in the global context and its influencing factors can be analyzed. This will help avoid the limitations of current rankings based solely on revenue, providing a more comprehensive efficiency evaluation framework.
Research on internal resource allocation in the pharmaceutical industry: In addition to the environmental factors explored in this study, future research should focus on the impact of internal resource allocation on efficiency. This would provide more specific insights for policymakers and industry managers, promoting the efficient allocation of resources and the overall improvement of efficiency.
To address the limitation of relying on cross-sectional data, future studies could incorporate panel data analysis to capture the dynamic changes in the operational efficiency of the pharmaceutical industry over time. By combining cross-sectional and longitudinal data, researchers can better analyze temporal trends, identify efficiency fluctuations, and explore the impact of time-varying factors such as policy changes, technological advancements, and market conditions.
By expanding in those directions, future studies can more comprehensively reveal the efficiency issues in the PI and provide more scientific decision-making implication for policymakers and enterprise managers.

Author Contributions

Conceptualization, A.B.R.; data curation, J.S. and X.Y.; formal analysis, J.S.; investigation, J.S. and X.Y.; methodology, A.B.R. and A.D.; supervision, A.B.R. and A.D.; writing—original draft preparation, J.S. and X.Y.; writing—review and editing, A.B.R. and A.D. All authors have read and agreed to the published version of the manuscript.

Funding

This research received no external funding.

Institutional Review Board Statement

Not applicable.

Informed Consent Statement

Not applicable.

Data Availability Statement

Data in this study is available in https://doi.org/10.5281/zenodo.14755469.

Acknowledgments

The authors thank the editorial team and anonymous reviewers for their insightful comments on the article.

Conflicts of Interest

Author Jiaqiang Sun was employed by the company Chengdu Maidison Pharmaceutical Technology Co., Ltd. The remaining authors declare that the research was conducted in the absence of any commercial or financial relationships that could be construed as a potential conflict of interest.

Note

1
Note: This study’s data sources do not include Hong Kong, Macau, or Taiwan, as their statistical data are processed separately in official Chinese reports.

References

  1. Ahmed, M. H., & Melesse, K. A. (2018). Impact of off-farm activities on technical efficiency: Evidence from maize producers of eastern Ethiopia. Agricultural and Food Economics, 6(1), 1–15. [Google Scholar] [CrossRef]
  2. Aigner, D., Lovell, C. K., & Schmidt, P. (1977). Formulation and estimation of stochastic frontier production function models. Journal of Econometrics, 6(1), 21–37. [Google Scholar] [CrossRef]
  3. André, F. J., Buendía, A., & Santos-Arteaga, F. J. (2024). Efficient water use and reusing processes across Spanish regions: A circular data envelopment analysis with undesirable inputs. Journal of Cleaner Production, 434, 139929. [Google Scholar] [CrossRef]
  4. Avkiran, N. K., & Rowlands, T. (2008). How to better identify the true managerial performance: State of the art using DEA. Omega, 36(2), 317–324. [Google Scholar] [CrossRef]
  5. Bai, H., Irfan, M., & Hao, Y. (2022). How does industrial transfer affect environmental quality? Evidence from China. Journal of Asian Economics, 82, 101530. [Google Scholar] [CrossRef]
  6. Baird, G. L., & Bieber, S. L. (2016). The Goldilocks dilemma: Impacts of multicollinearity—A comparison of simple linear regression, multiple regression, and ordered variable regression models. Journal of Modern Applied Statistical Methods, 15(1), 18. [Google Scholar]
  7. Banker, R. D., Charnes, A., & Cooper, W. W. (1984). Some models for estimating technical and scale inefficiencies in data envelopment analysis. Management Science, 30(9), 1078–1092. [Google Scholar] [CrossRef]
  8. Barney, J. (1991). Firm resources and sustained competitive advantage. Journal of Management, 17(1), 99–120. [Google Scholar] [CrossRef]
  9. Barney, J. B., & Arikan, A. M. (2005). The resource-based view: Origins and implications. In The Blackwell handbook of strategic management (pp. 123–182). Blackwell Publishers Ltd. [Google Scholar]
  10. Bhardwaj, R. (2024). Economics of the pharmaceutical and medical device industry: Supply chain, trade and innovation. Taylor & Francis. [Google Scholar] [CrossRef]
  11. Borja Reis, C. F. d., & Pinto, J. P. G. (2022). Center–periphery relationships of pharmaceutical value chains: A critical analysis based on goods and knowledge trade flows. Review of Political Economy, 34(1), 124–145. [Google Scholar] [CrossRef]
  12. Cai, L., & Sun, Y. (2013). Research on the efficiency of biopharmaceutical enterprises based on DEA and SFA. Science Technology and Management Research, 33(2), 24. [Google Scholar]
  13. Camanho, A. S., Silva, M. C., Piran, F. S., & Lacerda, D. P. (2024). A literature review of economic efficiency assessments using Data Envelopment Analysis. European Journal of Operational Research, 315(1), 1–18. [Google Scholar] [CrossRef]
  14. Charnes, A., Cooper, W. W., & Rhodes, E. (1978). Measuring the efficiency of decision making units. European Journal of Operational Research, 2(6), 429–444. [Google Scholar] [CrossRef]
  15. Chaturvedi, P., Shukla, P., Giri, B. S., Chowdhary, P., Chandra, R., Gupta, P., & Pandey, A. (2021). Prevalence and hazardous impact of pharmaceutical and personal care products and antibiotics in environment: A review on emerging contaminants. Environmental Research, 194, 110664. [Google Scholar] [CrossRef] [PubMed]
  16. Chen, G., & Chen, F. (2024). Changes in technological innovation efficiency and influencing factors of listed textile and apparel companies research—Based on three-stage DEA with Tobit modeling. PLoS ONE, 19(8), e0307820. [Google Scholar] [CrossRef]
  17. Chen, P., Ding, X., Chen, M., Song, H., & Imran, M. (2025). The impact of resource spatial mismatch on the configuration analysis of agricultural green total factor productivity. Agriculture, 15(1), 23. [Google Scholar] [CrossRef]
  18. Coelli, T. J., Rao, D. S. P., O’donnell, C. J., & Battese, G. E. (2005). An introduction to efficiency and productivity analysis. Springer Science & Business Media. [Google Scholar] [CrossRef]
  19. Colm, G. (1960). The theory of public finance: A study in public economy. JSTOR. [Google Scholar]
  20. Cooper, W. W., Seiford, L. M., & Tone, K. (2007). Data envelopment analysis: A comprehensive text with models, applications, references and dea-solver software (Vol. 2). Springer. [Google Scholar] [CrossRef]
  21. Deore, A. B., Dhumane, J. R., Wagh, R., & Sonawane, R. (2019). The stages of drug discovery and development process. Asian Journal of Pharmaceutical Research and Development, 7(6), 62–67. [Google Scholar] [CrossRef]
  22. Dou, J., & Han, X. (2019). How does the industry mobility affect pollution industry transfer in China: Empirical test on Pollution Haven Hypothesis and Porter Hypothesis. Journal of Cleaner Production, 217, 105–115. [Google Scholar] [CrossRef]
  23. Dyson, R. G., Allen, R., Camanho, A. S., Podinovski, V. V., Sarrico, C. S., & Shale, E. A. (2001). Pitfalls and protocols in DEA. European Journal of Operational Research, 132(2), 245–259. [Google Scholar] [CrossRef]
  24. Farrell, M. J. (1957). The measurement of productive efficiency. Journal of the Royal Statistical Society Series A: Statistics in Society, 120(3), 253–281. [Google Scholar] [CrossRef]
  25. Feng, M., & Li, X. (2020). Evaluating the efficiency of industrial environmental regulation in China: A three-stage data envelopment analysis approach. Journal of Cleaner Production, 242, 118535. [Google Scholar] [CrossRef]
  26. Fried, H. O., Lovell, C. K., Schmidt, S. S., & Yaisawarng, S. (2002). Accounting for environmental effects and statistical noise in data envelopment analysis. Journal of Productivity Analysis, 17, 157–174. [Google Scholar] [CrossRef]
  27. Friedman, M. (2007). The social responsibility of business is to increase its profits. In Corporate ethics and corporate governance (pp. 173–178). Springer. [Google Scholar]
  28. Gascón, F., Lozano, J., Ponte, B., & de la Fuente, D. (2017). Measuring the efficiency of large pharmaceutical companies: An industry analysis. The European Journal of Health Economics, 18, 587–608. [Google Scholar] [CrossRef] [PubMed]
  29. Ge, X., Imran, M., & Ali, K. (2024). Natural resource-driven prosperity: Unveiling the catalysts of sustainable economic development in the United States. In Natural resources forum. Blackwell Publishing Ltd. [Google Scholar]
  30. Greenacre, M., Groenen, P. J., Hastie, T., d’Enza, A. I., Markos, A., & Tuzhilina, E. (2022). Principal component analysis. Nature Reviews Methods Primers, 2(1), 100. [Google Scholar] [CrossRef]
  31. Greene, W. H. (2008). The econometric approach to efficiency analysis. The Measurement of Productive Efficiency and Productivity Growth, 1(1), 92–250. [Google Scholar]
  32. Grossman, S. J., & Stiglitz, J. E. (1977). On value maximization and alternative objectives of the firm. The Journal of Finance, 32(2), 389–402. [Google Scholar]
  33. Guanglan, Z., & Zhening, Z. (2024). Evaluation and influencing factors of regional environmental efficiency in China based on three-stage DEA model. SAGE Open, 14(4), 21582440241280825. [Google Scholar] [CrossRef]
  34. Guo, C., Song, Q., Yu, M.-M., & Zhang, J. (2024). A digital economy development index based on an improved hierarchical data envelopment analysis approach. European Journal of Operational Research, 316(3), 1146–1157. [Google Scholar] [CrossRef]
  35. Guo, H., & Shi, K. (2021). Evaluation of the international competitiveness of China’s pharmaceutical industry and high-quality development strategies during the 14th Five-Year Plan. Journal of Beijing University of Technology (Social Sciences Edition), 21(3), 65–79. [Google Scholar] [CrossRef]
  36. Guo, Y., Yu, M.-M., & See, K. F. (2024). Developing a sustainable development goals index for OECD countries: An effectiveness-based hierarchical data envelopment analysis. Environmental Science & Policy, 160, 103836. [Google Scholar] [CrossRef]
  37. Hair, J., Black, W., Babin, B., & Anderson, R. (2010). Multivariate data analysis (7th ed.). Prentice Hall. [Google Scholar]
  38. Haitovsky, Y. (1969). Multicollinearity in regression analysis: Comment. The Review of Economics and Statistics, 51, 486–489. [Google Scholar] [CrossRef]
  39. Hamad, M., & Tarnoczi, T. (2021). Efficiency analysis of companies operating in the pharmaceutical industry in the Visegrad countries. Intellectual Economics, 15(2), 131–155. [Google Scholar] [CrossRef]
  40. Hao, B., & Ruan, X. (2022). Research on the technological innovation efficiency of Chinese listed biopharmaceutical enterprises based on the two-stage DEA model. China Pharmacy, 12, 7–12. [Google Scholar] [CrossRef]
  41. Hjalmarsson, L., Kumbhakar, S. C., & Heshmati, A. (1996). DEA, DFA and SFA: A comparison. Journal of Productivity Analysis, 7, 303–327. [Google Scholar] [CrossRef]
  42. Imran, M., Alam, M. S., Jijian, Z., Ozturk, I., Wahab, S., & Doğan, M. (2024a). From resource curse to green growth: Exploring the role of energy utilization and natural resource abundance in economic development. In Natural resources forum. Blackwell Publishing Ltd. [Google Scholar] [CrossRef]
  43. Imran, M., & Jijian, Z. (2023). Exploring the relationship between financial inclusion and natural resource utilization in QUAD economies. Environmental Science and Pollution Research, 30(58), 122958–122971. [Google Scholar] [CrossRef]
  44. Imran, M., Khan, M. K., Alam, S., Wahab, S., Tufail, M., & Jijian, Z. (2024b). The implications of the ecological footprint and renewable energy usage on the financial stability of South Asian countries. Financial Innovation, 10(1), 102. [Google Scholar] [CrossRef]
  45. Imran, M., Khan, M. K., Wahab, S., Ahmed, B., & Jijian, Z. (2025a). The paradox of resource-richness: Unraveling the effects on financial markets in natural resource abundant economies. Financial Innovation, 11(1), 63. [Google Scholar] [CrossRef]
  46. Imran, M., Sattar, A., & Alam, M. S. (2024c). Heterogeneous analysis of free trade agreement between Pakistan and China: A policy guideline for CPEC. Journal of Economic and Administrative Sciences, 40(1), 76–94. [Google Scholar] [CrossRef]
  47. Imran, M., Tufail, M., Mo, C., Wahab, S., Khan, M. K., Hoo, W. C., & Ling, Z. (2025b). From resources to resilience: Understanding the impact of standard of living and energy consumption on natural resource rent in Asia. Energy Strategy Reviews, 57, 101590. [Google Scholar] [CrossRef]
  48. Imran, M., Zhang, G., & An, H. (2017). Impact of market access and comparative advantage on regional distribution of manufacturing sector. China Finance and Economic Review, 5, 1–14. [Google Scholar] [CrossRef]
  49. Jia, F. (2022). Research on the international competitiveness of China’s pharmaceutical industry from the perspective of the global value chain [Unpublished Master’s thesis, Kunming University of Science and Technology]. [Google Scholar]
  50. Joe, Z., & Wu, G. (1996). Dea theory, methods and applications. Science Press. [Google Scholar]
  51. Kalirajan, K. P., & Shand, R. (1994). Stochastic frontier production functions and technical efficiency measurements: A review. Palgrave Macmillan. [Google Scholar] [CrossRef]
  52. Kaur, N., & Singh, B. (2024). Dynamics of resource allocation–firm performance relationship: Panel autoregressive distributed lag approach. Managerial and Decision Economics, 45(6), 3663–3676. [Google Scholar]
  53. Krugman, P. (1991). Increasing returns and economic geography. Journal of Political Economy, 99(3), 483–499. [Google Scholar] [CrossRef]
  54. Kumbhakar, S. C., & Tsionas, E. G. (2011). Some recent developments in efficiency measurement in stochastic frontier models. Journal of Probability and Statistics, 2011(1), 603512. [Google Scholar] [CrossRef]
  55. Lai, H., Shi, H., & Zhou, Y. (2020). Regional technology gap and innovation efficiency trap in Chinese pharmaceutical manufacturing industry. PLoS ONE, 15(5), e0233093. [Google Scholar] [CrossRef]
  56. Lampe, H. W., & Hilgers, D. (2015). Trajectories of efficiency measurement: A bibliometric analysis of DEA and SFA. European Journal of Operational Research, 240(1), 1–21. [Google Scholar] [CrossRef]
  57. Lee, G. H., & Jeon, H. W. (2023). A stochastic frontier analysis (SFA)-based method for detecting changes in manufacturing energy efficiency by sector and time. In IFIP international conference on advances in production management systems (pp. 29–42). Springer. [Google Scholar]
  58. Li, S., & Fan, C. (2009). A review and comparison of SFA and DEA methods. Statistics and Decision, 7(283), 25–28. [Google Scholar]
  59. Lin, T.-X., Wu, Z.-h., Ji, X.-x., & Yang, J.-j. (2021). Research on the operating efficiency of Chinese listed pharmaceutical companies based on two-stage network DEA and Malmquist. Mathematical Problems in Engineering, 2021(1), 1475781. [Google Scholar] [CrossRef]
  60. Liu, T., Pan, S., Hou, H., & Xu, H. (2020). Analyzing the environmental and economic impact of industrial transfer based on an improved CGE model: Taking the Beijing–Tianjin–Hebei region as an example. Environmental Impact Assessment Review, 83, 106386. [Google Scholar] [CrossRef]
  61. Liu, Y., Zhang, N., Xie, C., Jiang, Y., Qin, Y., Zhou, L., Fan, Y., Ren, L., Yin, C., Yang, H., Xie, W., Zhai, Q., Li, G., Chen, H., & Chen, X. (2022). Evolution of drug regulations and regulatory innovation for anticancer drugs in China. Acta Pharmaceutica Sinica B, 12(12), 4365–4377. [Google Scholar] [CrossRef]
  62. Luo, D. (2012). A note on estimating managerial inefficiency of three-stage DEA model. Statistical Research, 29(4), 104–107. [Google Scholar]
  63. Ma, Z. X. (2010). Data envelopment analysis models and methods. Science Press. [Google Scholar]
  64. Madabushi, R., Seo, P., Zhao, L., Tegenge, M., & Zhu, H. (2022). Role of model-informed drug development approaches in the lifecycle of drug development and regulatory decision-making. Pharmaceutical Research, 39(8), 1669–1680. [Google Scholar] [CrossRef]
  65. Madaleno, M., & Moutinho, V. (2023). Stochastic frontier analysis: A review and synthesis. Advanced Mathematical Methods for Economic Efficiency Analysis, 692, 55–78. [Google Scholar] [CrossRef]
  66. Martin, R., & Sunley, P. (2003). Deconstructing clusters: Chaotic concept or policy panacea? Journal of Economic Geography, 3(1), 5–35. [Google Scholar] [CrossRef]
  67. Mergoni, A., Emrouznejad, A., & De Witte, K. (2024). Fifty years of data envelopment analysis. European Journal of Operational Research. [Google Scholar] [CrossRef]
  68. Mohs, R. C., & Greig, N. H. (2017). Drug discovery and development: Role of basic biological research. Alzh Dement-Trci, 3(4), 651–657. [Google Scholar] [CrossRef] [PubMed]
  69. Moulay Ali, H., Guellil, M. S., Mokhtari, F., & Tsabet, A. (2024). The effect of subsidies on tecnical efficiency of Algerian agricultural sector: Using stochastic frontier model (SFA). Discover Sustainability, 5(1), 98. [Google Scholar] [CrossRef]
  70. Na, H., Du, T., Sun, W., He, J., Sun, J., Yuan, Y., & Qiu, Z. (2019). Review of evaluation methodologies and influencing factors for energy efficiency of the iron and steel industry. International Journal of Energy Research, 43(11), 5659–5677. [Google Scholar] [CrossRef]
  71. National Bureau of Statistics of China. (2023). China statistical yearbook 2023. China Statistics Press. Available online: https://www.stats.gov.cn (accessed on 27 October 2024).
  72. Okeke, E. S., Ezeorba, T. P. C., Okoye, C. O., Chen, Y., Mao, G., Feng, W., & Wu, X. (2022). Environmental and health impact of unrecovered API from pharmaceutical manufacturing wastes: A review of contemporary treatment, recycling and management strategies. Sustainable Chemistry and Pharmacy, 30, 100865. [Google Scholar] [CrossRef]
  73. Đokić, D., Novaković, T., Tekić, D., Matkovski, B., Zekić, S., & Milić, D. (2022). Technical efficiency of agriculture in the European Union and Western Balkans: SFA method. Agriculture, 12(12), 1992. [Google Scholar] [CrossRef]
  74. Porter, M. E. (1990a). New global strategies for competitive advantage. Planning Review, 18(3), 4–14. [Google Scholar] [CrossRef]
  75. Porter, M. E. (1990b). The competitive advantage of nations. Macmillan Press LTD. [Google Scholar]
  76. Porter, M. E. (1998). Clusters and the new economics of competition. Harvard Business Review, 76(6), 77–90. [Google Scholar]
  77. Qin, Y., Zhang, P., Deng, X., & Liao, G. (2023). Innovation efficiency evaluation of industrial technology research institute based on three-stage DEA. Expert Systems with Applications, 224, 120004. [Google Scholar] [CrossRef]
  78. Qiu, L., Yu, R., Hu, F., Zhou, H., & Hu, H. (2023). How can China’s medical manufacturing listed firms improve their technological innovation efficiency? An analysis based on a three-stage DEA model and corporate governance configurations. Technological Forecasting and Social Change, 194, 122684. [Google Scholar] [CrossRef]
  79. Rashid, A. A., See, K. F., & Yu, M.-M. (2024). Measuring airline efficiency using a dynamic network data envelopment analysis in the presence of innovation capital. Technological Forecasting and Social Change, 206, 123457. [Google Scholar] [CrossRef]
  80. Resti, A. (2000). Efficiency measurement for multi-product industries: A comparison of classic and recent techniques based on simulated data. European Journal of Operational Research, 121(3), 559–578. [Google Scholar] [CrossRef]
  81. Riaz, M., Kazmi, S. M. A., Iqbal, M. S., & Hussain, A. (2023). Efficiency analysis of pharmaceutical companies in Pakistan: A case study of ten famous companies. Pakistan Journal of Humanities and Social Sciences, 11(3), 3823–3830. [Google Scholar] [CrossRef]
  82. Schuhmacher, A., Hinder, M., von Stegmann und Stein, A., Hartl, D., & Gassmann, O. (2023). Analysis of pharma R&D productivity—A new perspective needed. Drug Discovery Today, 28(10), 103726. [Google Scholar] [CrossRef]
  83. Schuhmacher, A., Wilisch, L., Kuss, M., Kandelbauer, A., Hinder, M., & Gassmann, O. (2021). R&D efficiency of leading pharmaceutical companies—A 20-year analysis. Drug Discovery Today, 26(8), 1784–1789. [Google Scholar] [CrossRef]
  84. Shi, Y., Charles, V., & Zhu, J. (2025). Bank financial sustainability evaluation: Data envelopment analysis with random forest and Shapley additive explanations. European Journal of Operational Research, 321(2), 614–630. [Google Scholar] [CrossRef]
  85. Shin, K., Lee, D., Shin, K., & Kim, E. (2018). Measuring the efficiency of US pharmaceutical companies based on open innovation types. Journal of Open Innovation: Technology, Market, and Complexity, 4(3), 34. [Google Scholar] [CrossRef]
  86. Shrestha, N. (2020). Detecting multicollinearity in regression analysis. American Journal of Applied Mathematics and Statistics, 8(2), 39–42. [Google Scholar]
  87. Singh, P. K., Bhatt, R. K., & Kiran, R. (2020). Investigating allocative efficiency, cost efficiency, technical efficiency using stochastic frontier analysis (SFA) of groundnut farm households: Evidence from a case in India. Custos e Agronegocio on Line, 16(4), 105–129. [Google Scholar]
  88. Solanki, N., Verma, J., Kumar, S., Seema, Mundlia, J., Saini, R., & Saini, S. (2024). Impact of contract research organizations on pharmaceutical industries: A review. Applied Drug Research, Clinical Trials and Regulatory Affairs, e26673371332371. [Google Scholar] [CrossRef]
  89. Song, H., & Ma, Y. (2024). Measurement and spatial and temporal characterization of logistics efficiency–Based on a three-stage DEA model. Heliyon, 10(19), e38455. [Google Scholar] [CrossRef] [PubMed]
  90. Stević, Ž., Miškić, S., Vojinović, D., Huskanović, E., Stanković, M., & Pamučar, D. (2022). Development of a model for evaluating the efficiency of transport companies: PCA–DEA–MCDM model. Axioms, 11(3), 140. [Google Scholar] [CrossRef]
  91. Sun, J., Rosli, A. B., & Daud, A. (2024). Operational efficiency of pharmaceutical companies in China: Based on three-stage DEA with undesirable outputs. Sustainability, 17(1), 207. [Google Scholar] [CrossRef]
  92. Tang, Y., & Imran, M. (2024). Trade-offs and synergies: Examining the impact of natural resource rents and energy efficiency on financial development in the RCEP context. In Natural resources forum. Blackwell Publishing Ltd. [Google Scholar] [CrossRef]
  93. Tang, Y., Yin, M., Yang, W., Li, H., Zhong, Y., Mo, L., Liang, Y., Ma, X., & Sun, X. (2019). Emerging pollutants in water environment: Occurrence, monitoring, fate, and risk assessment. Water Environment Research, 91(10), 984–991. [Google Scholar] [CrossRef]
  94. Teece, D. J., Pisano, G., & Shuen, A. (1997). Dynamic capabilities and strategic management. Strategic Management Journal, 18(7), 509–533. [Google Scholar] [CrossRef]
  95. Tone, K. (2001). A slacks-based measure of efficiency in data envelopment analysis. European Journal of Operational Research, 130(3), 498–509. [Google Scholar] [CrossRef]
  96. Wang, G., & Zhang, S. (2023). Evaluation of the international competitiveness and country dependence of China’s pharmaceutical manufacturing industry based on the global value chain. Science Technology and Industry, 23(13), 16–22. [Google Scholar]
  97. Wang, J., Han, D., & Wang, Y. (2020). Empirical research on innovation efficiency in China based on SFA model. In Iop conference series: Earth and environmental science (Vol. 474, p. 072055). IOP. [Google Scholar]
  98. Wang, R., & Duan, Y. (2023). Dynamic comparison on the technical efficiency between China’s EPEs and PEs: Two-dimensional measurement based on SFA. Journal of Cleaner Production, 406, 136986. [Google Scholar] [CrossRef]
  99. Wang, W., Imran, M., Ali, K., & Sattar, A. (2024). Green policies and financial development in G7 economies: An in-depth analysis of environmental regulations and green economic growth. In Natural resources forum. Blackwell Publishing Ltd. [Google Scholar] [CrossRef]
  100. Wang, Z., Li, Y., Wang, K., & Huang, Z. (2017). Environment-adjusted operational performance evaluation of solar photovoltaic power plants: A three stage efficiency analysis. Renewable and Sustainable Energy Reviews, 76, 1153–1162. [Google Scholar] [CrossRef]
  101. Wang, Z., Zhou, Y., Wang, T., & Zhao, N. (2024). Efficiency of construction waste and carbon reduction in the construction industry: Based on improved three stage SBM-DEA model in China. Engineering, Construction and Architectural Management. [Google Scholar] [CrossRef]
  102. Wei, X., & Zhao, R. (2024). Evaluation and spatial convergence of carbon emission reduction efficiency in China’s power industry: Based on a three-stage DEA model with game cross-efficiency. Science of the Total Environment, 906, 167851. [Google Scholar] [CrossRef]
  103. Wu, B., Li, J., Yao, Z., Li, X., Wang, W., Wu, Z., & Zhou, Q. (2023). Characteristics and reduction assessment of GHG emissions from crop residue open burning in China under the targets of carbon peak and carbon neutrality. Science of the Total Environment, 905, 167235. [Google Scholar] [CrossRef] [PubMed]
  104. Xia, F., Cui, Y. Y., Liu, J. P., & He, Y. F. (2022). Analysis of operational efficiency of listed pharmaceutical companies in China from 2013 to 2019. Chinese Pharmaceutical Journal, 31(11), 1–5. [Google Scholar]
  105. Xiong, A., & Meng, G. (2019). Research on the technological innovation efficiency of pharmaceutical enterprises based on DEA method: A case study of the top 15 listed companies in Shenzhen and Shanghai. Chinese Journal of New Drugs, 6. [Google Scholar] [CrossRef]
  106. Xu, T., Kang, C., & Zhang, H. (2022). China’s efforts towards carbon neutrality: Does energy-saving and emission-reduction policy mitigate carbon emissions? Journal of Environmental Management, 316, 115286. [Google Scholar] [CrossRef] [PubMed]
  107. Yan, L. (2012). Empirical study on the regional innovation efficiency evaluation index system in China. Management World, 174–175. [Google Scholar] [CrossRef]
  108. Yang, R. (2024). Operational efficiency analysis of listed biomedical companies in China: Three-stage DEA and Malmquist index. Advances in Economics and Management Research, 10(1), 264–273. [Google Scholar] [CrossRef]
  109. Zhang, L., & Cui, J. (2024). Research on total factor energy efficiency in western China based on the three-stage DEA-Tobit model. PLoS ONE, 19(4), e0294329. [Google Scholar] [CrossRef]
  110. Zhang, M., Imran, M., & Juanatas, R. A. (2024). Innovate, conserve, grow: A comprehensive analysis of technological innovation, energy utilization, and carbon emission in BRICS. In Natural resources forum. Blackwell Publishing Ltd. [Google Scholar]
  111. Zhang, Y., Wang, Y., Zhang, J., Liu, J., Ruan, J., Jin, X., Liu, D., Lu, Z., & Xu, Z. (2024). Research on waste gas treatment technology and comprehensive environmental performance evaluation for collaborative management of pollution and carbon in China’s pharmaceutical industry based on life cycle assessment (LCA). Science of The Total Environment, 919, 170555. [Google Scholar] [CrossRef] [PubMed]
  112. Zhao, H., Guo, S., & Zhao, H. (2019). Provincial energy efficiency of China quantified by three-stage data envelopment analysis. Energy, 166, 96–107. [Google Scholar] [CrossRef]
  113. Zhong, S., Liang, S., Zhong, Y., Zheng, Y., & Wang, F. (2022). Measure on innovation efficiency of China’s pharmaceutical manufacturing industry. Frontiers in Public Health, 10, 1024997. [Google Scholar] [CrossRef]
  114. Zhu, J. (2009). Quantitative models for performance evaluation and benchmarking: Data envelopment analysis with spreadsheets (Vol. 2). Springer. [Google Scholar]
Figure 1. The conceptual framework of this study.
Economies 13 00090 g001
Figure 2. Gaussian kernel density distribution of TE.
Economies 13 00090 g002
Figure 3. Average pte and se distribution of PI across Chinese provinces.
Economies 13 00090 g003
Figure 4. Decomposition of the operation efficiency in Stage 3.
Economies 13 00090 g004
Figure 5. Trend of CV changes in China’s PI from 2013 to 2022.
Economies 13 00090 g005
Figure 6. The impact of the environment on the efficiency of China’s pharmaceutical industry.
Economies 13 00090 g006
Table 1. The variables used in this study.
Variable CategoryIndicatorIndicator DefinitionUnit
Input IndicatorsAssets ( X 1 )Local total assets of PIMillon CNY
Personnel ( X 2 )Local total number of employees in PIPerson
R&D investment ( X 3 )Local total R&D investment of enterprisesMillon CNY
Output IndicatorsOperation revenue ( Y 1 )Main business revenue of the PIMillon CNY
Operation profit ( Y 2 )Total operating profit of the PIMillon CNY
New product sales ( Y 3 )Total sales revenue from new products in the PIMillion CNY
Number of patents ( Y 4 )Total number of patents owned by the PIPatents
Environmental Indicators 1Economic and technological foundation ( Z 1 )
Residents’ living standards ( Z 2 )-
Local pollution levels ( Z 3 )-
Openness to the foreign market ( Z 4 )-
1 Environment variables from Section 4.3.1.
Table 2. Pearson correlation test results for input-output variables.
VariablesOperation Revenue ( Y 1 )Operation Profit ( Y 2 )New Product Sales ( Y 3 )Number of Patents ( Y 4 )
Assets ( X 1 )0.736 ***0.609 ***0.783 ***0.879 ***
Personnel ( X 2 )0.939 ***0.642 ***0.749 ***0.759 ***
R&D Investment ( X 3 )0.829 ***0.701 ***0.899 ***0.925 ***
Note: *** indicates significance at the 1% level.
Table 3. Efficiency measurement results for the first and third stages.
RegionThe Efficiency in Stage 1The Efficiency in Stage 3
TEPTESETEPTESE
National WideAverage0.7080.7720.9230.7050.7930.891
SD0.1650.1780.0860.1730.1480.144
North ChinaBeijing0.6830.7370.9240.7450.7580.987
Tianjin0.9250.9400.9850.9350.9390.995
Hebei0.6410.6950.9270.6910.7030.985
Shanxi0.5880.5980.9850.6010.6820.871
Inner Mongolia0.6890.6980.9860.6770.7410.912
Northeast ChinaLiaoning0.9250.9460.9770.8810.9030.976
Jilin0.8240.8740.9380.8540.8820.967
Heilongjiang0.6560.7600.8860.7440.7740.955
East ChinaShanghai0.5970.6130.9730.6180.6300.981
Jiangsu0.6950.9220.7550.7200.9200.785
Zhejiang0.5520.6900.8190.6010.6940.889
Anhui0.7790.8420.9250.8090.8170.990
Jiangxi0.8600.8760.9800.8640.8760.986
Fujian0.7280.7500.9710.6470.7170.894
Shandong0.6280.8970.6980.6550.8970.729
Central ChinaHenan0.6290.7070.9040.6780.7150.951
Hubei0.5550.5830.9520.5790.5950.975
Hunan0.7820.8100.9630.7450.7640.976
South ChinaGuangdong0.6620.8620.7820.7060.8640.835
Guangxi0.8240.8660.9560.8270.8830.929
Hainan0.7820.8440.9270.8000.8650.916
Southwest ChinaChongqing0.5770.5990.9620.5840.6130.952
Sichuan0.7730.9040.8620.8330.9060.924
Guizhou0.7660.8170.9310.7960.8240.965
Yunnan0.7040.7850.9020.7450.7790.956
Tibet0.9610.9960.9650.6050.9840.612
Northwest ChinaShaanxi0.8200.8330.9840.8060.8460.947
Gansu0.4940.5110.9680.4750.6200.766
Ningxia0.5000.5180.9600.4480.7390.613
Qinghai0.8060.8690.9290.6950.8890.768
Xinjiang0.5440.5800.9420.4760.7480.643
Table 4. The result of KMO and Bartlett’s test.
KMO measure of sampling adequacy0.902
Bartlett’s test of sphericity approximate Chi-Square15,737
Degrees of freedom253
Significance0.000
Table 5. Eigenvalues and variance explained before and after rotation.
ComponentInitial EigenvaluesExtraction Sums of Squared LoadingsRotation Sums of Squared Loadings
Total% VarianceCum. %Total% of VarianceCum. %Total% of VarianceCum. %
115.1866.0066.0015.1866.0066.0011.8251.3751.37
22.9512.8378.832.9512.8378.834.1918.2169.58
31.406.0784.901.406.0784.902.3710.2979.87
41.024.4389.331.024.4389.332.189.4689.33
50.582.5690.81------
...---------
230.030.02100.00------
Table 6. Rotated component loadings.
ComponentPrinciple
Component 1
Principle
Component 2
Principle
Component 3
Principle
Component 4
Water Pollution Equivalent--0.769-
Air Pollution Equivalent--0.807-
Full-time R&D Hours0.927---
Annual Number of R&D Projects0.916---
Annual R&D Investment0.899---
New Product Projects0.95---
New Product Investment0.933---
Annual New Product Sales0.922---
Authorized Inventions0.760.516-
Authorized Utility Models0.898---
Authorized Designs0.885---
Per Capita Disposable Income-0.905--
Per Capita Consumption Level-0.908--
Number of Foreign-Funded Enterprises Registered0.723---
Foreign Investment Amount---0.895
Registered Capital of Foreign Investment-- 0.964
Higher Education Enrollment0.727---
Local General Budget Revenue0.777---
Government Support for Education0.809---
Government Support for Science and Technology0.809---
Government Support for Environmental Protection0.563---
Regional GDP0.832---
Per Capita GDP-0.880--
Table 7. Results of SFA on the impact of environmental variables on input slacks.
Independent VariableDependent Variable
Slack of Total AssetSlack of Employees NumberSlack of R&D Investment
Constant Term β 0 −17,973.69 ***−2638.33 ***−32.16 ***
t-ratio−14.03−23.19−5.09
Economic and technological
foundation ( Z 1 )
β 1 −6568.12 ***218.764.51 *
t-ratio−2.680.701.77
Residents’ living
standards ( Z 2 )
β 2 16,586.74 ***2117.79 ***40.48 ***
t-ratio25.285.7510.56
Local pollution levels ( Z 3 ) β 3 7163.00 ***2942.94 **−42.76 **
t-ratio39.442.01−2.41
Openness to the
foreign market ( Z 4 )
β 4 45,187.43 ***−4467.38 ***4.66
t-ratio9.31−4.630.10
σ 2 3,560,829,70057,626,093.0033,054.70
γ 0.9990.9990.999
LR test of the one-sided error204.38204.72310.85
Note: *, **, and *** indicate significance at the 10%, 5%, and 1% levels, respectively. Only coefficients with a significance level of 5% or lower (p ≤ 0.05) are included in subsequent calculations, while those above 5% (p > 0.05) are excluded.
Disclaimer/Publisher’s Note: The statements, opinions and data contained in all publications are solely those of the individual author(s) and contributor(s) and not of MDPI and/or the editor(s). MDPI and/or the editor(s) disclaim responsibility for any injury to people or property resulting from any ideas, methods, instructions or products referred to in the content.

