1. Introduction
One of the more important effects of economic integration recognized in the literature is the occurrence of the convergence and resemblance processes for economies at different levels of development. This is related to the catching-up process occurring in less developed countries, in relation to more developed economies, whose income rate per capita is at a significantly higher level. Reducing developmental disparities is of particular significance in the actions of the European Union, which is declaratively reflected in the structural politics it conducts, as well as the EU strategical documents being created. This issue is especially important in regards to countries of Central and Eastern Europe (CEE), which are on a much lower level of economic development in comparison to other EU states. Those issues are also crucial to the whole of the union, because it can determine the future operation of the union and the geographical expansion of the integration process. What is more, it references not only to the macroeconomic sphere but also can be crucial for the business area. Searching for sources of growth the business aspects should be included. Thus, it is very justified to analyze the business environment in its impact on economic growth.
The main aim of this article is to verify the existence of real convergence between the Central and Eastern Europe (CEE) countries (CEE10) and the Western Europe (WE) countries (EU15) in years 1995–2016. In addition, the article aims to verify the role of economic integration and business environment for the economic growth and convergence of the CEE countries. The achievement of the research aims is related with answering to the following questions:
Do the CEE countries develop in accordance with beta convergence hypothesis and is there a sigma convergence between CEE10 and EU15 in years 1995–2016?
What was the impact of accession to the EU on the economic growth and catching up process of the CEE countries?
Is there a relationship between economic growth and the business environment in the CEE countries?
Does the business environment contribute to the economic growth and convergence process of the CEE countries?
The issues of economic convergence is by no means a new one, however this article differs from previous ones by the range of research. Added value of this article is represented by a relatively long study period, which allowed certain conditions of the convergence process to be taken into account. This approach is recommended in many prior studies (
Halmai and Vásáry 2010;
Borsi and Metiu 2015). Introducing, in the empirical section, the gamma convergence scale, can also be recognized as an alternative approach to the issue, because this measurement is seldom used in empirical studies of convergence. Moreover, in many studies it is recommended to extend the research taking into account the CEE region (
Andersson et al. 2014;
Terjesen et al. 2013;
Perenyi and Losoncz 2018). The attempt to connect the business environment with economic growth and the catching up process of the CEE is advantage of this study.
This elaboration has been separated into substantive parts. The first one presents the issue of convergence, economic integration and business environments in a theoretical discourse and takes a look at previous studies regarding the issue being explored. The second section introduces the study methods and its assumptions. The last part contains the results and discussion, EU10 countries are those which joined the European Union in 2004 and 2007 (excluding Malta and Cyprus). The EU15 countries are treated as a single area constituting a kind of benchmark for the CEE countries. This type of approach can also be found in the studies by
Salsecci and Pesce (
2008),
Stanišić (
2012),
Rapacki and Próchniak (
2014). The study methods applied in the article consist of a wide range of quantitative methods, such as descriptive statistics, cluster analysis, Clark’s coefficient of divergence, and the Pearson correlation coefficient and regression (OLS and panel). The period chosen for the investigation are the years 1995–2016, which are divided into sub-periods: pre-accession period: 1995–2004 and post-accession period: 2004–2016.
2. Literature Review and Hypotheses Development
Convergence understood as a process of “approaching” or “catching up” of different areas of functioning of the countries has a special place in the process of European integration. Convergence as an economic category, however, may have multiple meanings. We can identify nominal, real, economic, social and technological convergence (
Islam 2003). The purpose of this elaboration is to investigate real convergence, in other words economic convergence, which is understood as a process of eliminating disparities in income and economic development between countries. Real convergence in the European Union has to be done when the countries or regions of the EU at a lower level of development are “catching up” with richer countries or regions, otherwise there is a process known as a divergence (
Barro and Sala-i-Martin 1992;
Sala-i-Martin 1996).
The theoretical basis for developing research in the field of economic convergence are the theories of economic growth. In a fact, the convergence theory is derived from the assumptions of the concept of neoclassical economic growth (
Sala-i-Martin 1996). Particularly important are also the endogenous growth concepts known as new theories of growth, which have brought a completely different view on the process of income convergence of the countries (
Lucas 1988;
Romer 1986,
1990). New growth theory, as well as neoclassical models, assumes removing barriers in trade and the mobility of production factors, as well as a harmonization of regulations related to environmental protection, which can influence the improvement of the monetary union, which will include member states showing progressing income convergence and productivity (
Martin 2005;
Delgado et al. 2010;
Berry et al. 2014;
Voigt et al. 2014;
Chambers and Dhongde 2017;
Loray 2017;
Emvalomatis 2017;
Martinez-Carrion and Maria-Dolores 2017;
Saygili 2017). On the other hand, endogenous growth theory does not assume decreasing returns to scale, which is the main argument behind the convergence process in the neoclassical assumptions (
Stanišić 2012). Empirical studies also do not present consistent positions as to the income convergence of the economies studied. However, the research results depend on many determinants.
Convergence arose as a subject of study in the 1950s. First empirical works on this topics were created around 30 years later (
Baumol 1986;
Abramovitz 1986;
De Long 1988). The phenomenon of economic convergence, in the context of economic integration theory, has become particularly interesting to people studying the economy of the European Union, after the introduction of the euro in 1999, and the creation of the Economic and Monetary Union (EMU). It also became a point of interest in the context of equalizing economic disparities between countries, especially after the eastward expansions in 2004 and 2007. The subject literature presents many opposing views of economic integration (
Haas 1958;
Lindberg 1963;
Balassa 1973;
Machlup 1977;
Molle 2006;
Recher and Kurnoga 2017;
Druzhinin and Prokopyev 2018).
Studies on the CEE convergence can be divided into two categories. The first category refers to the investigation of convergence process at countries level, and the second at the regions level.
Wilhelmsson (
2009) analyzed the influence of the EU enlargement on real convergence of Eastern borders regions in years 1995–2005 and proved that this process takes place at the level of countries but not at the level of regions. Similar findings are drawn by
Artelaris et al. (
2010) for 10 CEE countries over the period from 1990 to 2005. In turn,
Monfort (
2008);
Tselois (
2009);
Głodowska (
2015) confirmed existence of convergence processes among CEE regions toward Western countries (WE).
A majority of studies regarding the CEE have concentrated on growth and convergence at the country level. What is more, the convergence of the CEE countries toward EU15 is obvious in most cases. Convergence within CEE and WE countries was detected by
Verblane and Vahter (
2005),
Matkowski and Próchniak (
2006),
Vojinovic and Oplotnik (
2008) confirms the presence of both beta and sigma convergence among 8 CEE and 15 WE countries during the years 1990s and early 2000s.
Stanišić (
2012) found that poorer “new” members (CEE10) grew faster than richer “old” members (EU15) and as a result the relative per-capita income gap between these has narrowed. It was confirmed by applying sigma and beta convergence methods for years 1993–2010. Matkowski. Rapacki and Próchniak’s study encompassed 11 CEE countries, which joined the EU after 2004, excluding Cyprus and Malta. Results of the study indicate that membership in the EU significantly affected the acceleration of the pace of economic growth in the CEE countries (
Matkowski et al. 2016). Other research results confirming the positive effect of economic integration on the CEE convergence process can be found in the elaborations by
Schadler et al. (
2006),
Liberda (
2009),
Halmai and Vásáry (
2010),
Dobrinsky and Havlik (
2014).
Even though many studies have been published confirming the occurrence of a gradual process of convergence in the EU countries (CEE + WE), recent papers indicate divergent tendencies (
Cuestas et al. 2012;
Recher and Kurnoga 2017),
Alexe (
2012) studied the influence of the world crisis on the convergence of the EU countries, paying particular attention to countries which joined the Union after 2004. According to the author countries which joined the EU in 2004 are closing in on the Western European countries in terms of GDP growth per capita, however, in the cases of Bulgaria and Romania, this process is not that obvious.
Cuestas et al. (
2012) indicate the occurrence of club convergence. These results are in line with the research conducted by
Borsi and Metiu (
2015) for the EU27 in years 1970–2010. The authors investigated a clear separation between the CEE countries and WE countries in the long run.
The studies conducted so far on the income convergence of the European Union countries do not provide clear conclusions. The differences in the applied research methods, the number of countries covered by the analysis or the accepted research period caused that most of studies is of selective character. In view of the existing shortcomings of the research so far, an attempt has made to analyze the economic growth of the EU countries expressed in GDP per capita and pace of the change, while making the following hypotheses:
Hypothesis 1 (H1). CEE10 and EU15 in the years between 1995 and 2016 have been developed in accordance with the convergence hypothesis. Real convergence in the EU was the result of a relatively higher GDP per capita growth, observed in countries of Central and Eastern Europe (beta convergence).
Hypothesis 2 (H2). The economic integration of the Central Eastern European countries into the EU had had a positive and dynamic impact on their catching up process since 2004.
The investigation of the development and convergent trends is particularly justified when searching for driving sources of these phenomena. Assuming the hypothesis that catching up process of the CEE countries is a consequence of accession to the European Union the driving forces of their growth should be seen in the determinants related to economic integration. According to
Salsecci and Pesce (
2008), the main factors of the economic growth in the CEE countries after joining the EU were trade, capital flows and institutional changes.
Żuk et al. (
2018) investigated the CEE countries and Southern Eastern Europe (SEE) countries in terms of growth and they identified several determinants that are common to the most successful countries in the region in terms of the pace of convergence since 2000: institutional aspects, innovation, competitiveness, investments, openness and human capital changes. Taking the above into account, we can say that business environment is an important driver of economic growth related to economic integration.
The issues of business environment in the context of interaction with economic growth are derived from institutional economics, international business and entrepreneurship. Regarding the institutional economics, the pioneering works on the impact of institutions on economic growth were
Kormendi and Meguire (
1985),
Scully (
1988) and
Helliwell (
1994),
Knack and Keefer (
1995) were the first to apply the aggregate measure developed by international institution to show that law enforcement institution are crucial for economic growth. In the 1990s, numerous publications which demonstrate the relationship between the regulatory environment and the growth of economy, based on Economic Freedom Index, were made (
Easton and Walker 1997;
Ayal and Karras 1998;
Dawson 1998). Business environment and economic growth publications referred to internationalization process, the activity of multinational corporations and the location of foreign direct investment (FDI) (
Edrees 2015;
Bobenič-Hintošová et al. 2016;
Wach 2016). The relationship between internationalization at the macro level and the scale of FDI and economic growth in the CEE countries was investigated by
Lejko and Bojnec (
2011). In the field of entrepreneurship research, one can notice the correlation of business environment and productivity, investment, innovativeness or efficiency of factors of production, based on methodology employed by the World Bank (
Djankov et al. 2002;
Hanusch 2012;
Haider 2012;
Ani 2015). A review of the above-mentioned articles shows the research gap on the European Union area regarding the dependency analyses of the relations between the economic growth and business environment in the relation to convergence process. Therefore the last hypothesis is an attempt to partially fill this gap:
Hypothesis 3 (H3). Business environment and economic growth are strongly correlated. The economic growth in the groups of the CEE10 is positively affected by their business environment and thus it supports the catching-up process.
3. Methodology
The main purpose of the elaboration is to present the results of the analysis of the real convergence process of the countries of CEE (CEE10), to the WE (EU15). In addition, attention was paid to the impact of accession on the pace of development and convergence of CEE countries as well as the importance of the business environment for economic growth of the CEE countries in the context of catching up process. The EU10 is a group of countries with similar cultural and historical roots, with a common past has been related to the subjugation of the USSR, or which constituted part of it as Soviet republics. Two new member states, which are Cyprus and Malta, were not included in the study. The EU15 are the so-called “old Union” states and they are treated in the literature as one homogenous area forming a kind of development benchmark and a reference point for the CEE10. It is known that one can point out the development diversification among EU15 but the objective of this study is to show the process of convergence of the CEE countries toward EU15 in general omitting the scale to differentiate between individual economies. A similar approach can be found in previous studies (
Salsecci and Pesce 2008;
Stanišić 2012;
Rapacki and Próchniak 2014). The analysis of economic convergence was made between 1995 and 2016. The selection of 1995 as the starting year is justified by the fact that this year dates back as a formal start of the integration process by most CEE countries. The relatively long period of analysis was divided into the following subperiods: the pre-accesion period: 1995–2004 and the post-accession period: 2004–2016. These subperiods were devoted to paying special attention to the dynamics of economic growth after 2004 (accession to the EU new members). The GDP per capita statistics come from Eurostat resources, and calculations and drawings were made using Statistical Software Statistica, GRETL, and PQStat.
The intensification of research on the phenomenon of convergence in the real sphere has led to the identification of different types of convergence. The consequence was the identification of various methods of verification.
Krill (
2006) classifies the types of convergence according to their verification methods, pointing to beta, sigma, gamma, stochastic convergence. The present study examines real convergence in the classical context, which means the convergence of product per capita levels of different economies and the convergence of a given economy to its sustainable growth. The following convergence measures were used: beta, sigma and gamma. Under the hypothesis of convergence, the catch-up process occurs if the countries with initially lower values of the examined feature (in our case GDP per capita) show faster growth rates than those of the countries with initially higher values (
Baumol 1986;
Mankiw et al. 1992). The model used to verify the beta convergence is presented by the Formula (1).
where:
y(t)—GDP per capita at the end of the time period,
y(0)—GDP per capita at the initial the time period,
t—the number of years.
The beta convergence occurs when the estimator α
1 is negative and statistically significant. Positive estimator value α
1 indicates the existence of divergent trends, and the lack of statistical significance means that there is neither convergence nor divergence. Based on the estimator α
1 the convergence coefficient (Formula (2)) was determined (
Barro and Sala-i-Martin 1992).
when
β > 0, there is a divergence between the surveyed areas, and when
β < 0, there is a convergence process between the surveyed areas.
Additionally. the convergence factor informs about the percentage of distance from the state of equilibrium being passed over the year by the countries surveyed. Later in the paper, the so-called half-life was determined, which informs about the time that is needed to partially reduce growth differences (Formula (3)) (
Monfort 2008).
The occurrence of beta convergence is a necessary but not the only one condition for the presence of sigma convergence (
Sala-i-Martin 1996). Sigma convergence implies a decrease in the per capita GDP differentiation between the studied economies (
Friedman 1992;
Quah 1993;
Andrade et al. 2004). The standard deviation of the GDP per capita logarithm of the analyzed economies was used to determine this type of convergence (Formula (4)).
where
Sigma convergence occurs when σ(t) < σ(t − 1) or σ(t) ≤ σ(t − 1).
An interesting complement to the beta and sigma convergence tests is the gamma convergence measure adopted in the work. Although this measure was introduced by Boyle and McCarthy in 1997, its use is a new approach to convergence research. since the beta and sigma convergence models dominate in previous work (
Boyle and McCarthy 1997). According to Boyle and McCarthy, gamma convergence directly relates to inter-term mobility within per capita product distribution. For the gamma-convergence test, Kendall’s rank concordance coefficient was used. The starting point for the analysis was to assign ranks to individual economies in the study group according to the growing value of GDP per capita (Formula (5)) (
Boyle and McCarthy 1997).
where:
AR(Y)it—rank of GDP per capita level in the i-th country in year t.
AR(Y)i0—rank of GDP per capita level in the i-th country in year 0 (first period of analysis)
γ = 0 there is a convergence process between the examined economies.
γ ≠ 0 there is a divergence process between the studied economies.
The coefficient of concordance is a measure of rank consistency in the interval (0, t). Its value is closer to 0, the greater the mobility within the distribution. The value of 1 means no change. In the studied group of economies there was a convergence gamma if the value of γ coefficients decreases over time. The gamma convergence measure is particularly useful when beta and sigma convergence analysis provide divergent conclusions. Gamma convergence can resolve these types of interpretive dilemmas.
In addition, the Clark’s coefficient of divergence was used to determine the scales of differentiation and convergence at the same time, between CEE and WE countries (Formula (6)).
where:
The coefficient of divergence ranges from 0 to 1. The closer the value of the coefficient is to 0, the more similar the studied objects are, which means that they are at a similar level of economic development, measured by GDP per capita. In addition, on the basis of cluster analysis we identified clusters within EU15 countries in terms of GDP per capita and consequently we calculated distance between the CEE10 countries and identified clusters.
To analyze the relationship between business environment and economic growth, the aggregated measure economic freedom index (EFI) by the Heritage Foundation was used. Implementation of this index among others (Ease of Doing Business or the Global Competitiveness Report) was justified by formal and substantive factors. First of all, the availability of the data decides about appropriateness of this measure. Additionally, it comprehensively covers all the key aspects of establishing and running a business. The aggregate measure of economic freedom index encompasses following subcategories: property rights, judicial effectiveness, government integrity, tax burden, government spending, fiscal health, business freedom, labor freedom, monetary freedom, trade freedom, investment freedom, financial freedom. Additionally, we introduced control variables in the study assuming that the economic growth of the CEE countries was also determined by alternative factors. The focus was on the growth determinants arising from economic integration. Thus we introduced following control variables: foreign direct investment (FDI inflow as % of GDP) and export (EXP as % of GDP). The data was obtained from Eurostat database as well as World Bank.
As a research tool the panel regression was applied, which allowed to use panel data. Panel data have a more complex structure than cross-sectional date, which is why they show changes not only in a single section of units or time, but simultaneously in both cross-sections (
Głodowska 2017b). On the basis of the least-squares panel model (LSPM) and its testing with Wald’s Test and Braush Pagan’s test, the validity of applying a model with fixed (FE) and random (RE) effects was established in the study. Then, using the Hausman’s test, the priority of FE estimator was established (
Maciejewski 2017). Finally, two models were tested:
Model 1: verifying the relations between business environment (EFI) and the level of economic growth (GDP per capita) in the CEE countries in years 1995–2016.
Model 2: verifying the impact of the business environment (EFI) on the speed of economic growth (∆GDP per capita), i.e., convergence of the CEE countries in years 1995–2016.
The basic adopted model is presented in the Formula (7).
where:
4. Results and Discussion
The research on the convergence process of the CEE10 countries towards the EU15 will be preceded by a short general analysis of the entities considered (
Table 1).
On the basis of descriptive statistics, it can be noticed that the average value of GDP per capita for EU15 is much higher than for the CEE10 countries. At the beginning of analyzed period this value was three times higher for EU15 in relation to the CEE10. Therefore, it is possible to indicate quite large development disparities between “old” and “new” members of the EU. These two groups separately created very homogenous areas. It was confirmed by the coefficient of variation. It is worth noting, that in subsequent years the diversity within EU15 countries was growing, while within the CEE10 countries, it was decreasing. When the CEE10 and EU15 were combined, the coefficient of variation increased, which confirms the existence of significant development diversification in the European Union. Convergence study, therefore seems to be very desirable (
Table 1).
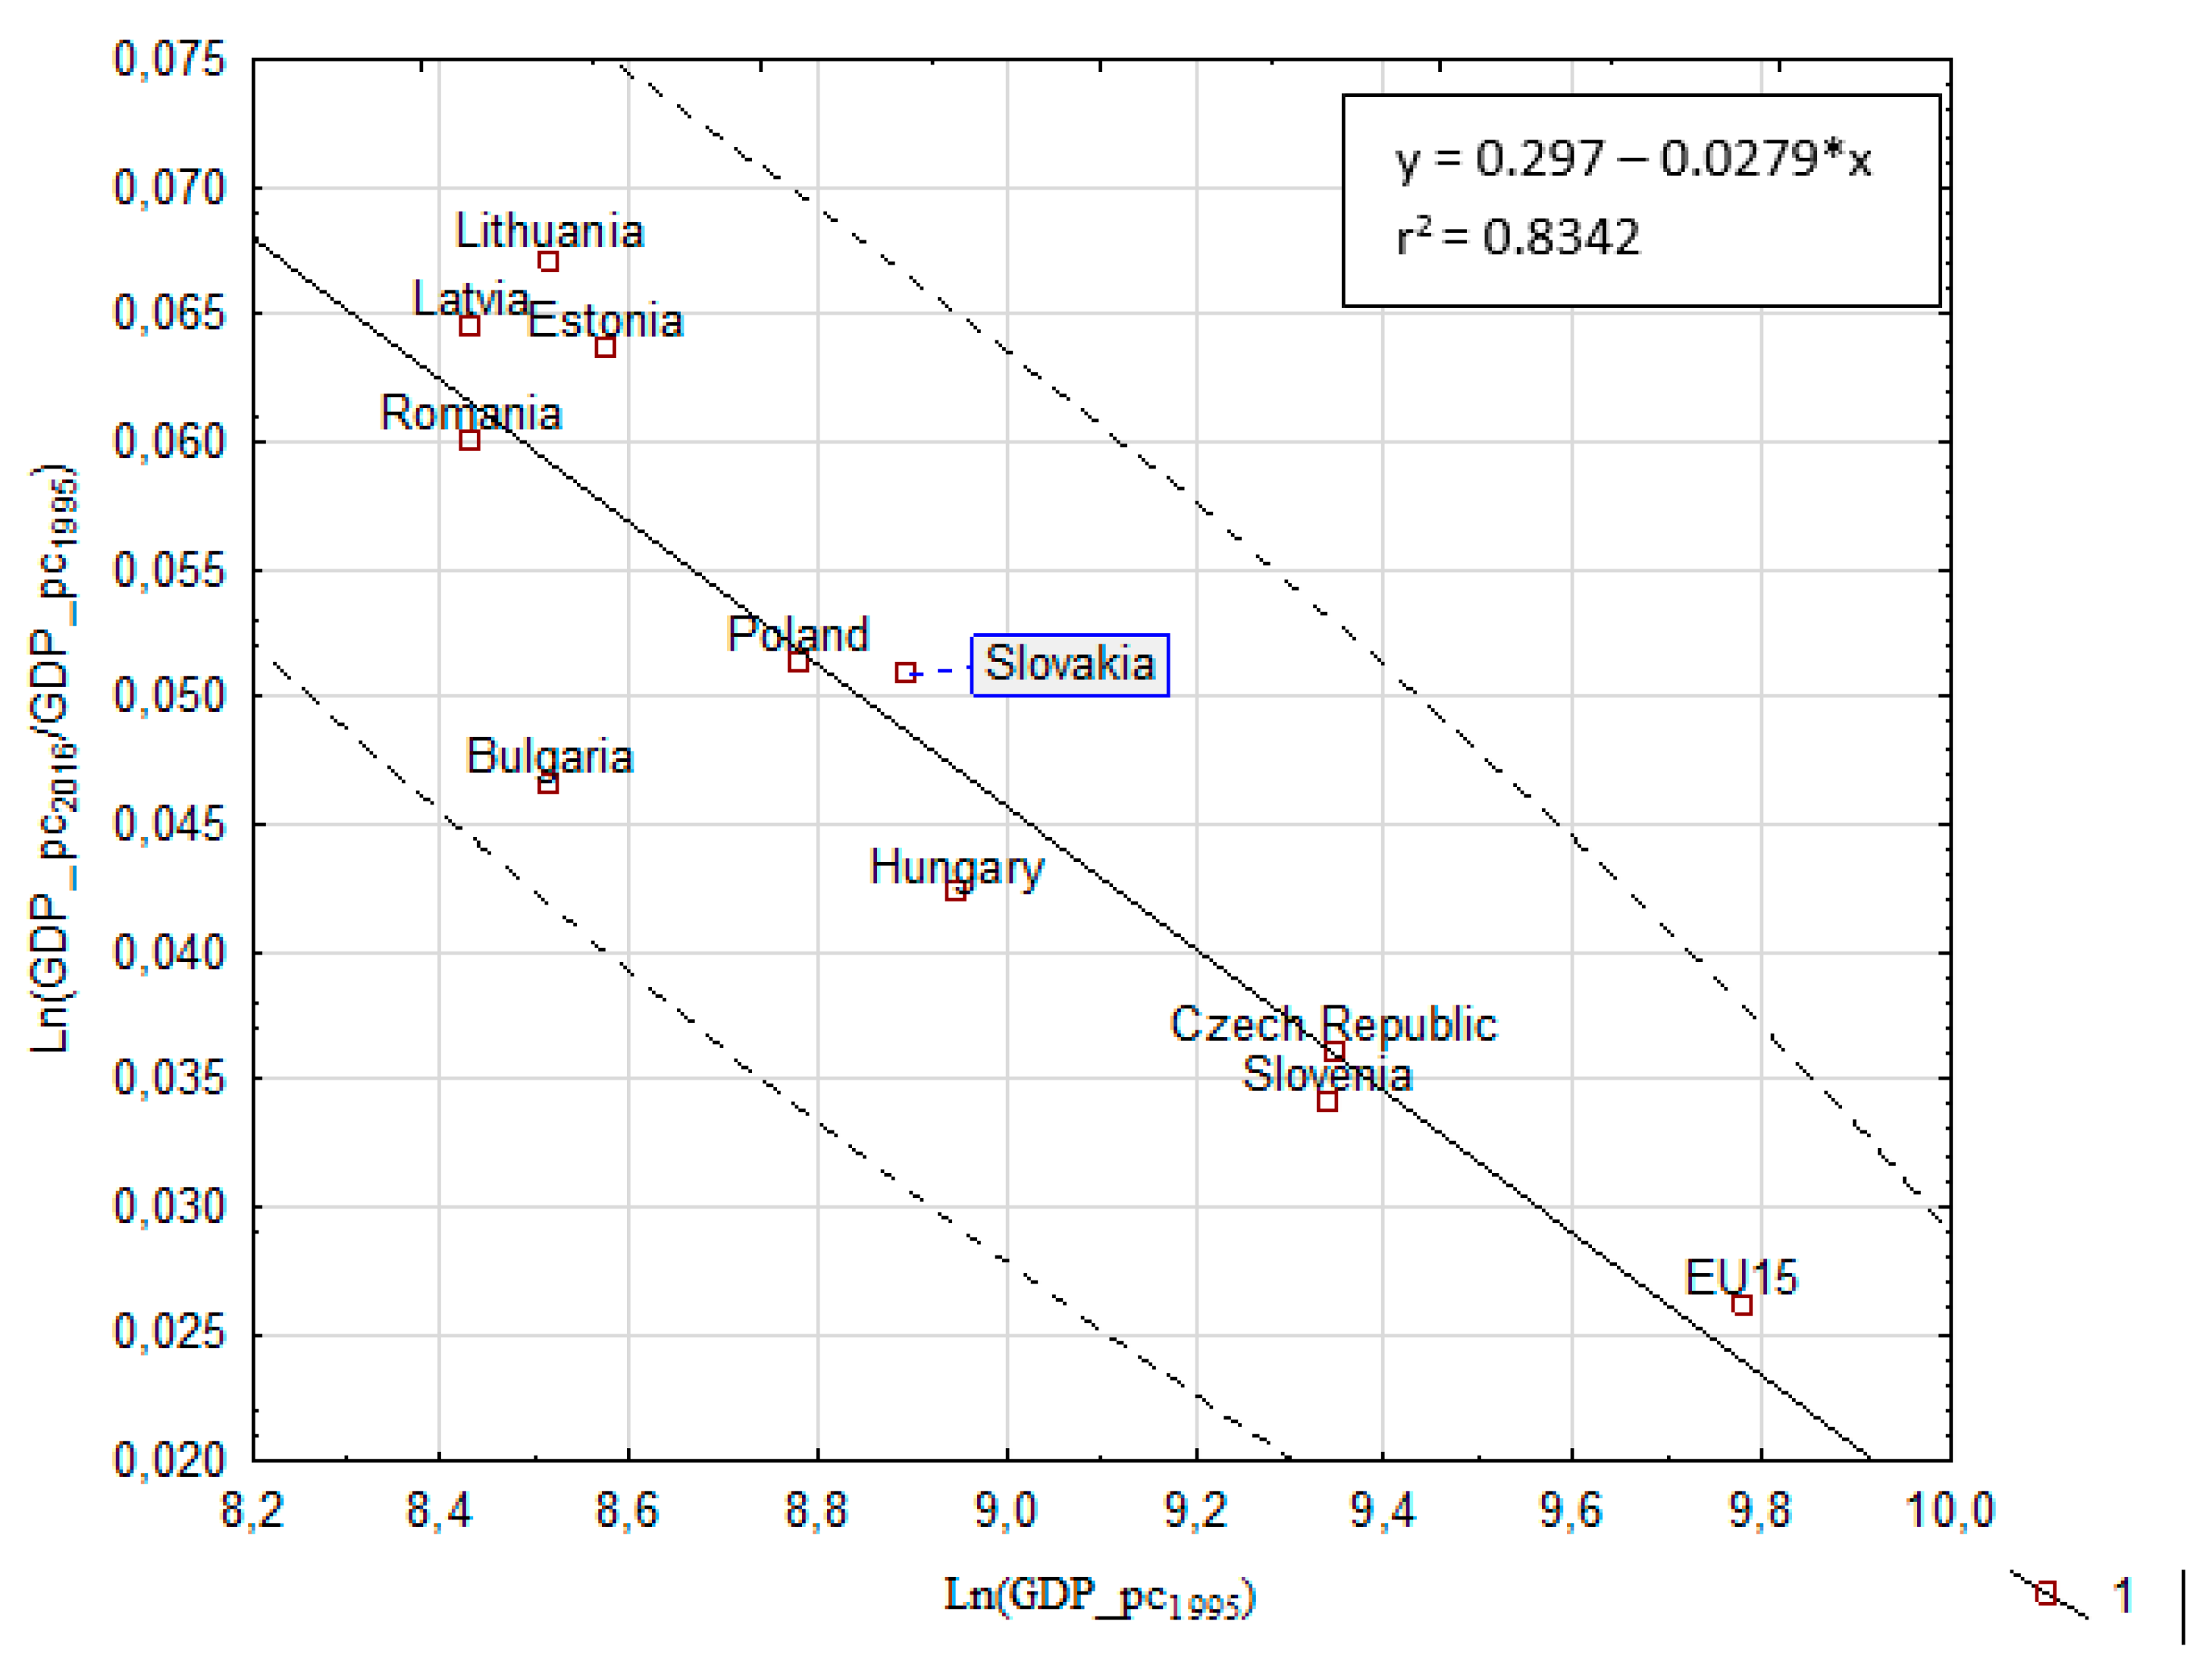
The results of the beta convergence analysis for the years 1995–2016 are shown in
Figure 1 and in
Table 2.
Table 2 also contains the analysis results for the selected sub-periods: 1995–2004. 2004–2016.
Studies have shown that in the analyzed period and selected sub-periods. the CEE countries developed in accordance with the convergence beta hypothesis in relation to the EU15 countries. In the years 1995–2016, the estimated linear trend equation is −0.2279, with a coefficient of variation at 0.8342. The negative value of the parameter and its statistical significance indicate that the analyzed economies developed in accordance with the absolute beta convergence hypothesis in the period considered. The CEE countries, with a lower level of economic growth in 1995, showed an average faster growth rate than the EU15. The Baltic States and Romania were the fastest developing countries. Between 1995 and 2016, the coefficient of convergence was 0.0432. The positive coefficient of convergence confirms the occurrence of convergence over the period considered, and the calculated value indicates that the difference in real GDP per capita over the years and the value of this variable in stationary steady state decreases by 4.32%, to reduce by half the income differences, more than 24 years (Hl = 24.84) is needed. Similar results were obtained by
Stanišić (
2012), while in this study, the group of the CEE countries was more numerous including Bulgaria and Romania. It is therefore an advantage to include all CEE EU members in the study. The same Author confirmed strong trend of convergence of the CEE countries’ national business cycles toward the Euro area countries in years 1995–2012 (
Stanišić 2013).
In the case of sub-periods, we can observe that the CEE10 countries also caught up with the UE15 and it means that their growth dynamic was higher than the EU15. In the pre-accession period, however, this dynamics was definitely lower than in post-accession period. The accession of CEE countries to the European Union has led to an increase in the dynamics of their development, thus we can conclude that integration processes have had a positive impact on the convergence of the CEE countries toward EU15. This is confirmed by the coefficient of convergence (0.0610). negative value of the parameter (−0.0417) and its statistical significance. Taking into account H
index it can be concluded that accession to the European Union of the CEE countries has shortened the development gap of these economies by half. If they developed at the same pace as in the pre-accession period. they would need over 33 years to shorten the distance by half compared to the EU15. Due to the growth dynamics as a consequence of economic integration. This development disparity can be offset over 16 years. These findings were in accordance with
Rapacki and Próchniak (
2014), who analyzed convergence process of the CEE11 towards EU15.
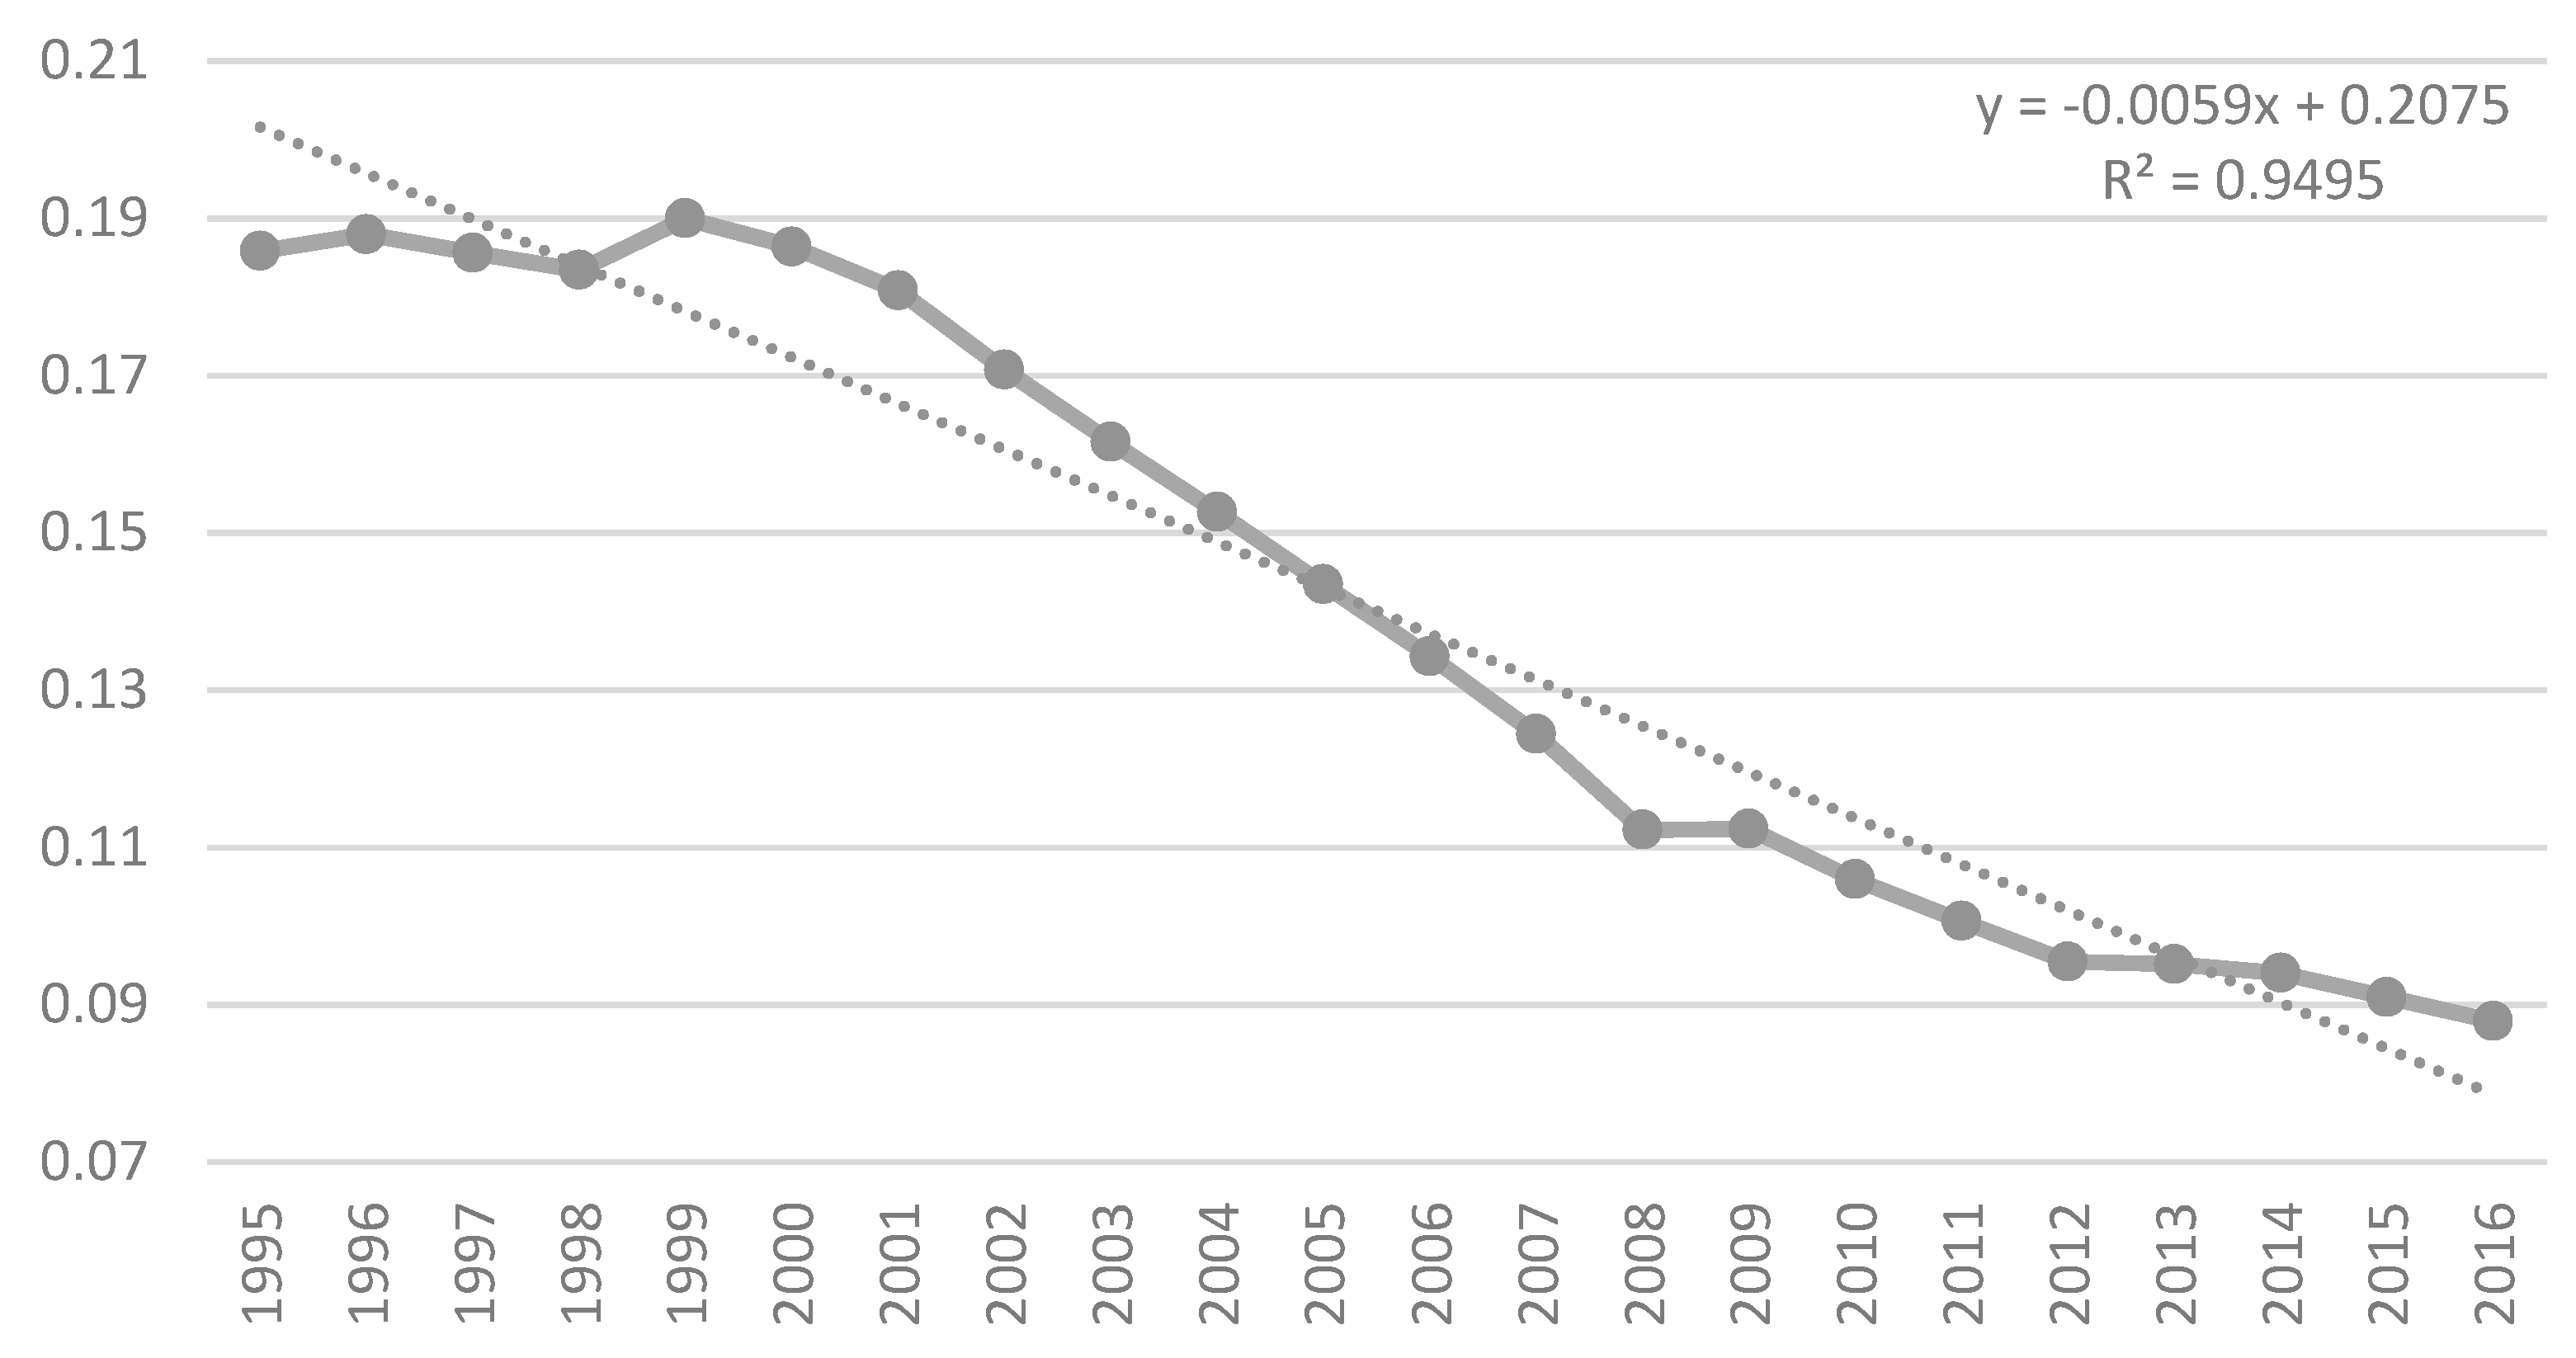
The results of the sigma convergence analysis from 1995 to 2016 are shown in
Figure 2.
Between 1995 and 2016, CEE and EU15 countries developed in accordance with the sigma convergence hypothesis. The value of standard deviations of natural logarithms of GDP per capita decreases in subsequent years, which confirms that the variation in income in the studied group of states decreases over time. The very high 0.9495 determination coefficient indicates the very large fit of the model to actual values. By analyzing the distribution of the standard deviations of the natural logarithm of GDP on the basis of the visual scattering of the empirical points, several characteristic periods can be distinguished in the time interval. The years 1995–2000 were the first such period. It is difficult to talk about convergence growth in the examined group of economies. Between 2001 and 2008, the slope of the line is very clear and indicates that the rate of divergence of GDP per capita in the study group was very high. Based on this observation, it can be concluded that this significant acceleration of sigma convergence is related to the process of integrating the EU10 into the European Union. This is also indicated in other works (
Matkowski et al. 2016;
Halmai and Vásáry 2010). In the period 2008–2009, the sigma convergence process stops, which is undoubtedly related to the economic crisis. In the years to come, the per capita GDP differentiation between the EU15 and the EU10 is declining again, but this process is considerably slower than the pre-crisis period. This means that the crisis has had a negative impact on the convergence of CEE countries. At the time of the escalation of the crisis (2008/2009), the process of convergence ceased completely, and subsequent years marked a significant slowdown.
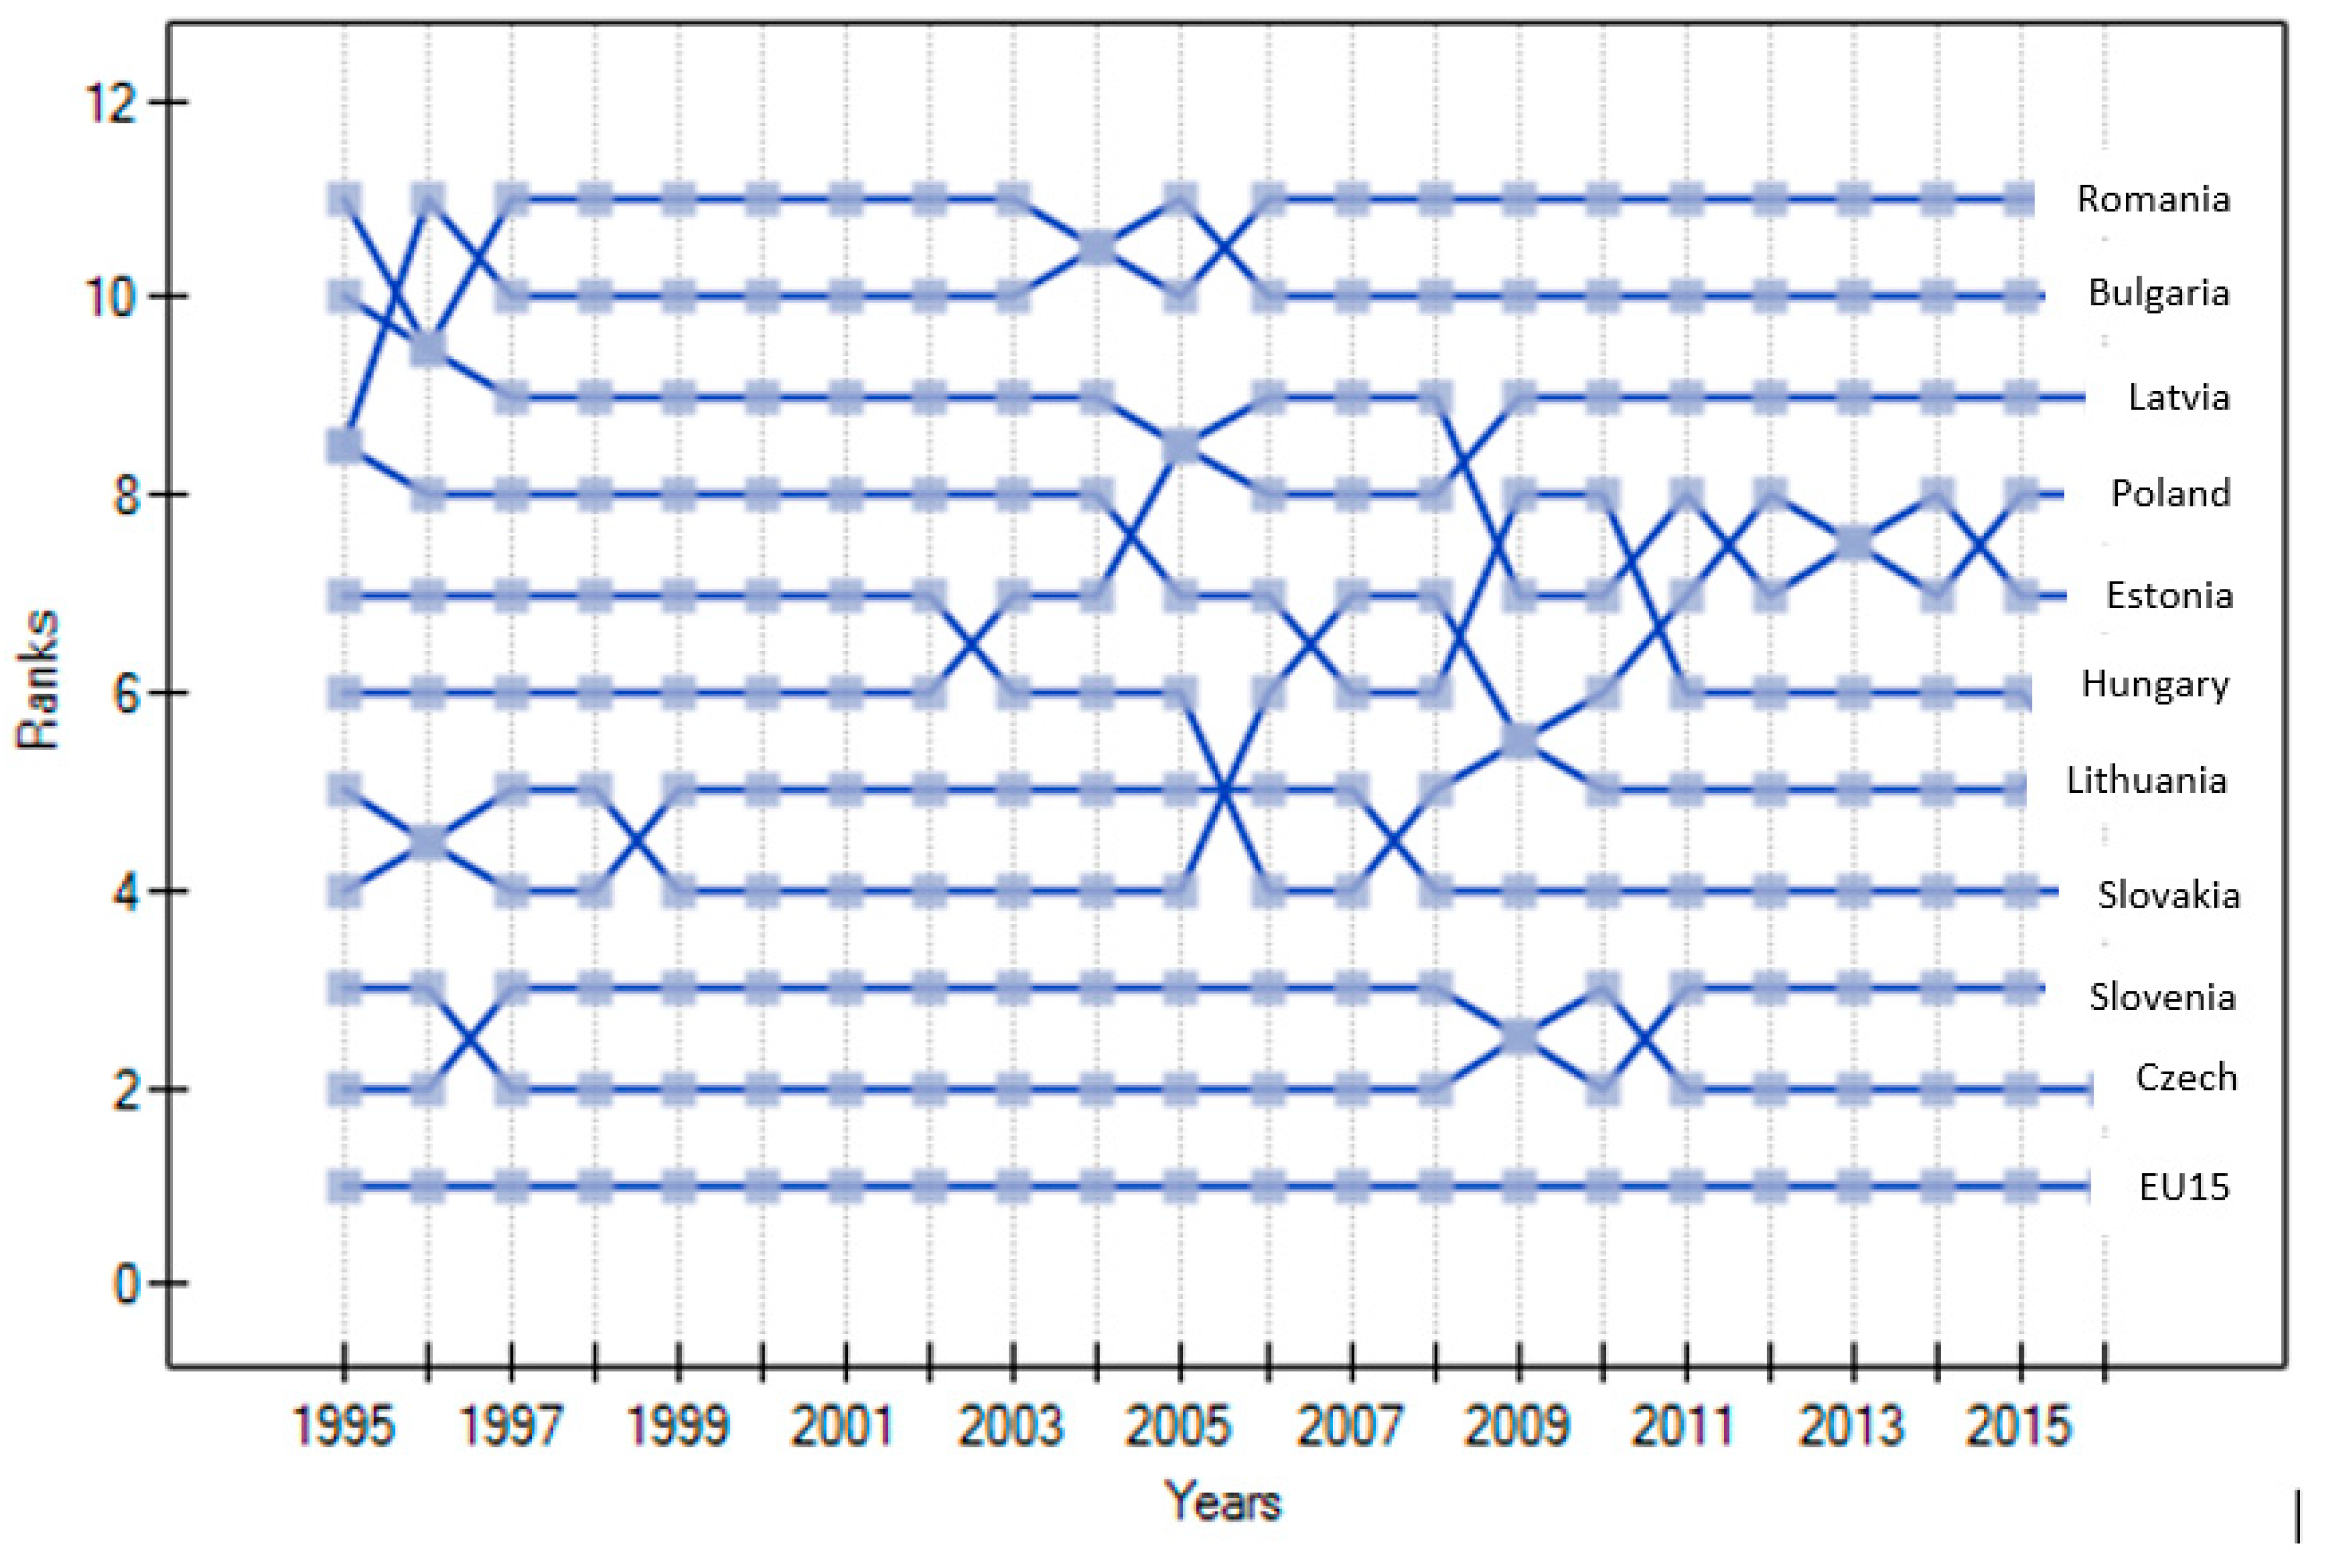
Figure 3 and
Table 3 show the results of the gamma-convergence verification. Testing for gamma convergence is particularly useful in identifying the occurrence of beta convergence and sigma divergence. Gamma convergence is then the decisive criterion for the studied processes. In this study, this situation does not exist, despite this, the measure will be used. Analysis of development of the Kendall Rank Concordance coefficient calculated for individual periods suggests the existence of gamma convergence in the group of studied countries. The negative (−0.0066) and statistically significant (R2 = 0.9306) coefficient in the linear function of the trend confirmed it and above all was a prerequisite for further study of this type of convergence.
Figure 3 shows the positions of individual countries between 1995 and 2016. Each economy was ranked according to the level of GDP per capita in a given year. The rank order is assigned ascending, which means that the country with the highest GDP per capita in a given year receives rank 1.
Figure 3 shows the changes in the position of individual economies, i.e., the mobility of economies within the distribution. The greatest mobility is seen between 2003 and 2009 in the group of countries that can be identified as countries of relatively moderate growth (between rank 4 and 9). Changes were also visible at the beginning of the analyzed period in the group of countries receiving the lowest wages, i.e., they recorded the lowest GDP per capita in the surveyed countries. Mobility of distribution is also visible after 2009 between ranks 5 and 8. Last years of gamma convergence analysis are characterized by relatively low mobility among the surveyed countries. Finally, the distribution of the examined feature is rather stationary than mobile. The lack of sufficiently high dynamics within the per capita distribution has not led to significant changes in the rankings given to individual economies in order to talk about the occurrence of gamma-convergence among the EU10 and EU15. The coefficient of Kendall’s ranged rank of 0.9352 means no change in the rank order of countries in the years studied, i.e., no gamma convergence. The calculated value of the statistics χ
2 of 205.75 significantly exceeded the critical value, with the assumed significance level of the order of 0.05, allowed the conclusion of the lack of gamma convergence. In the study by
Martin and Sanz (
2003), the gamma convergence was verified positively however this measure is not tested very often.
The next section focuses on a comparative analysis of each EU10 country’s GDP per capita towards the EU15 and groups of countries identified in it by using one of the methods of hierarchical clustering, i.e., the Ward’s method. Four groups of EU15 countries were distinguished from the benchmark group, apart from it (
Table 4). The divergence indicators were calculated for each EU10 country in relation to the identified groups of countries and the EU15 benchmark.
The results confirm that the convergence process has taken place in the period considered, but after the accession to the EU these changes were more significant and dynamic than during the association time. The shortest distance separates the CEE10 countries from the southern European countries (Spain, Portugal and Greece), and the largest one from Luxembourg. In the CEE10 group of countries, the leaders were the Czech Republic and Slovenia. These countries were already a short distance away from Spain, Portugal and Greece, considered as a one cluster. The most distant were Romania and Bulgaria (
Table 4).
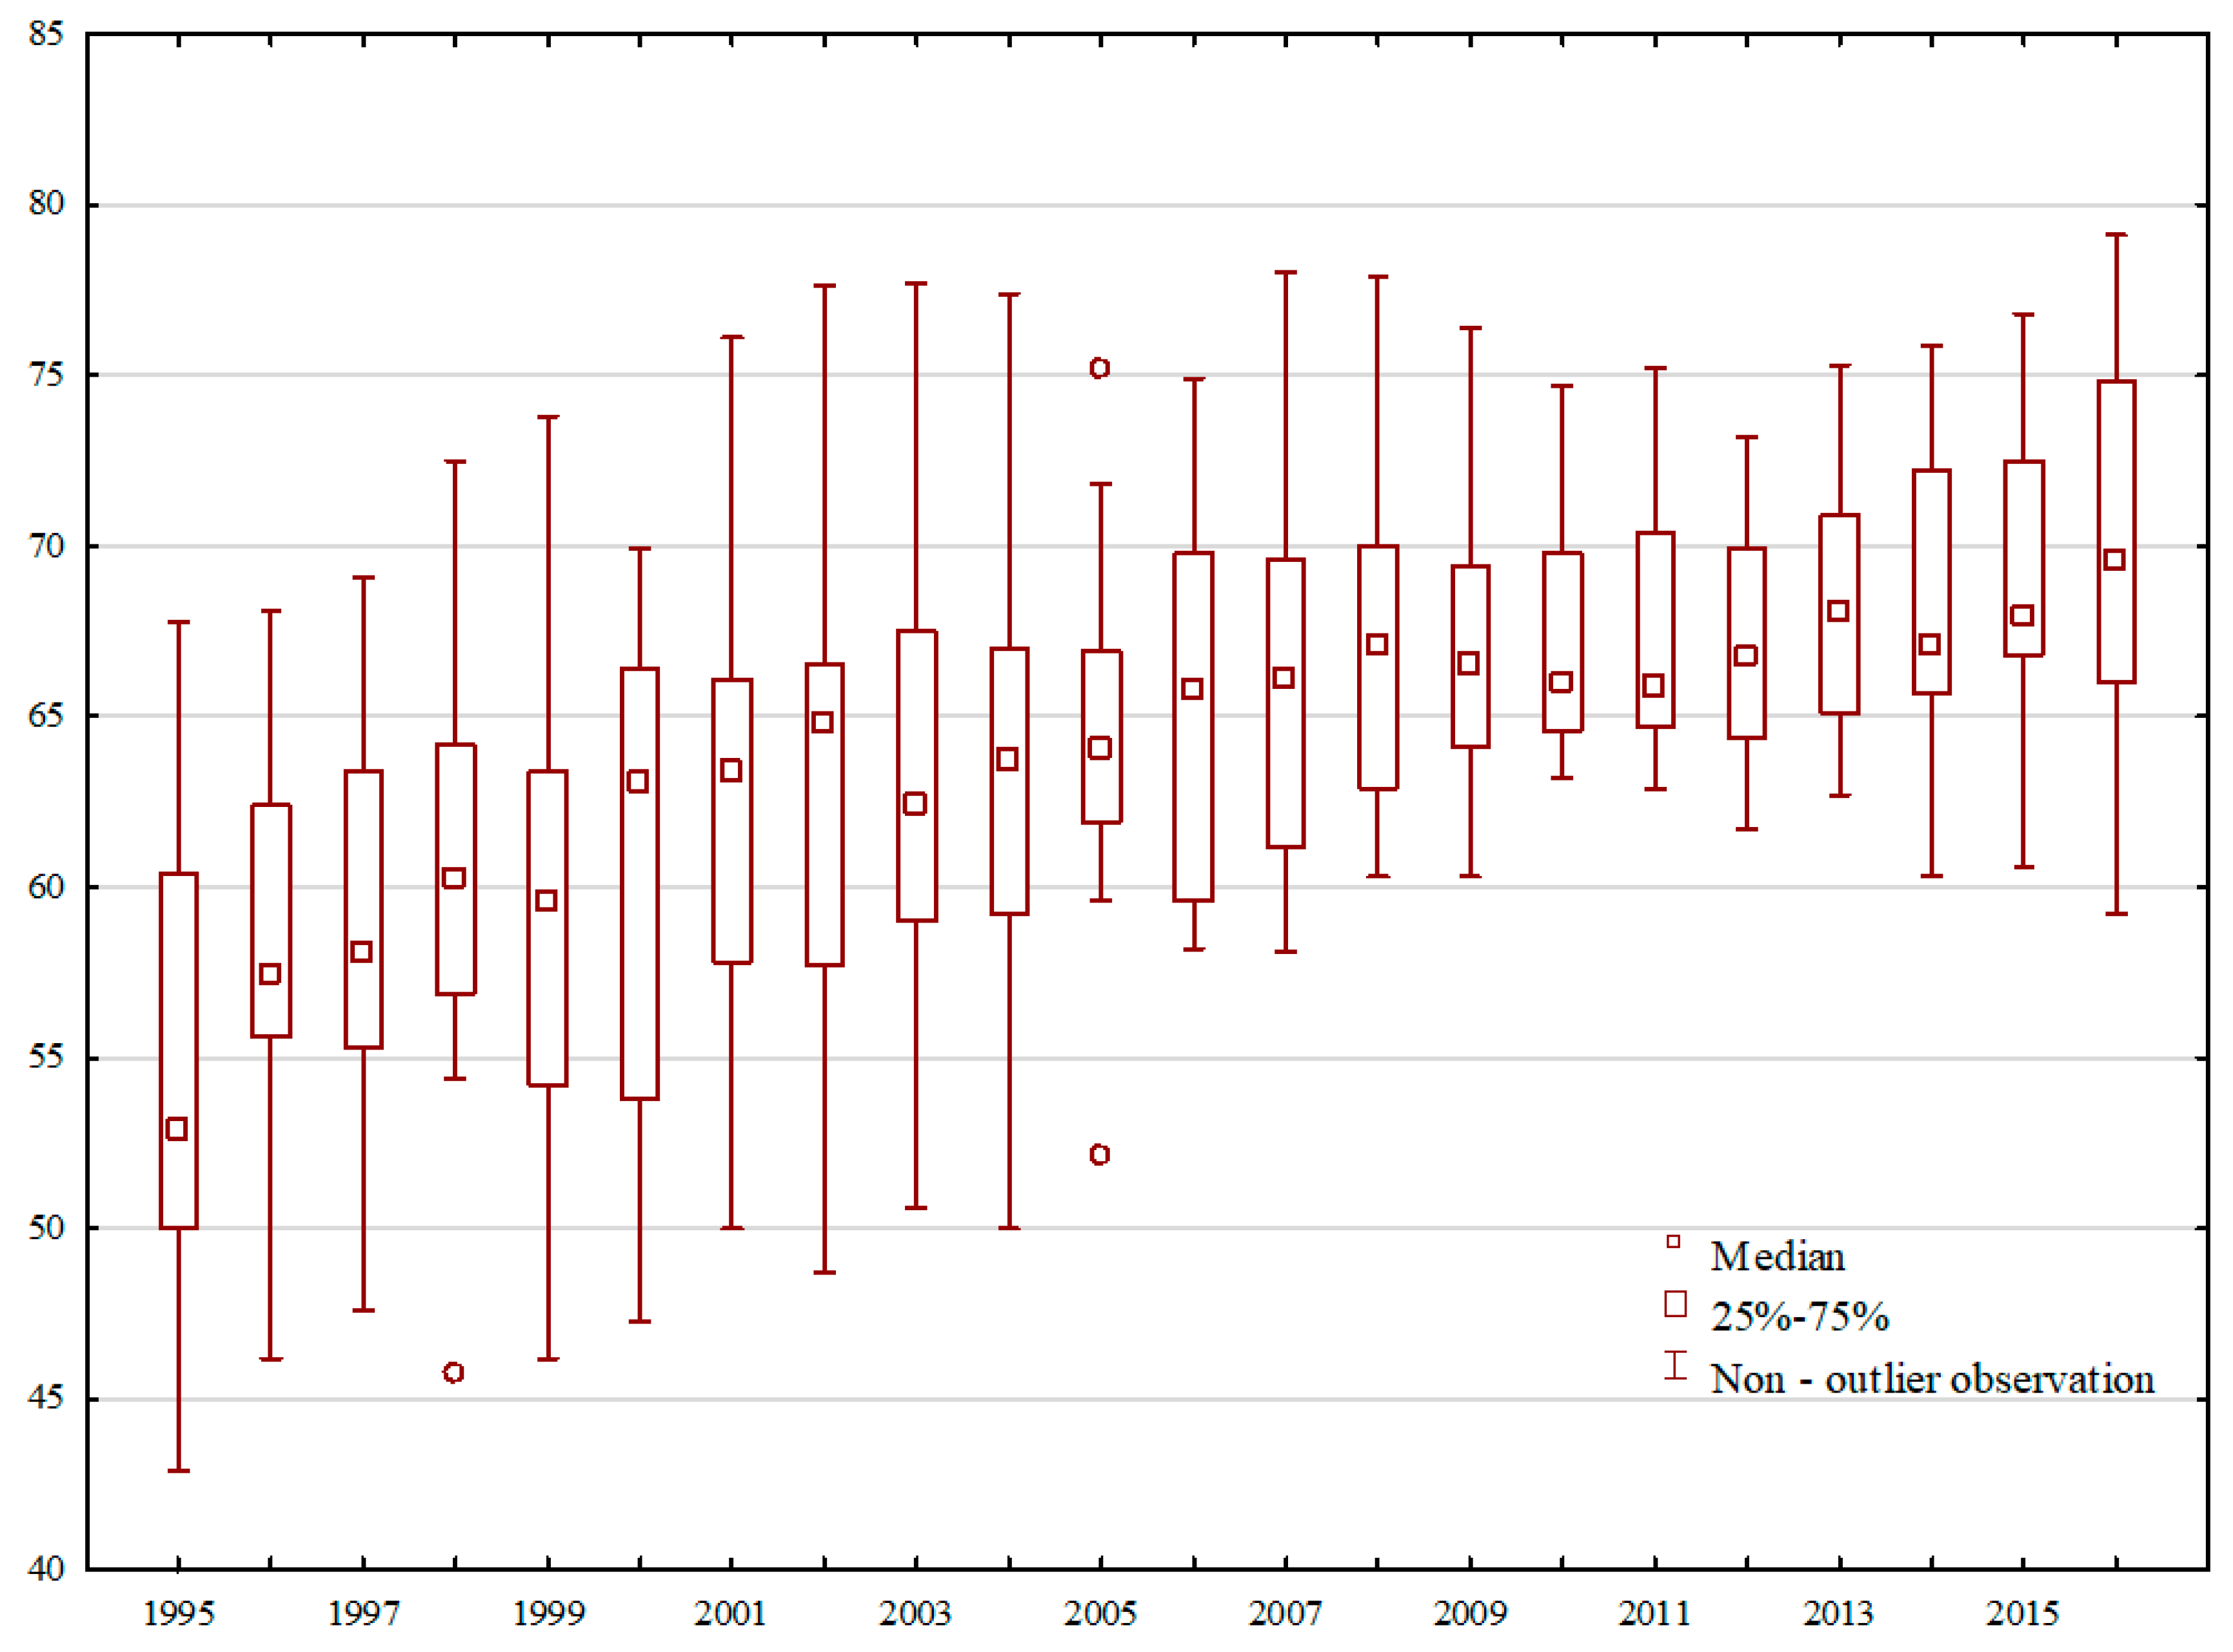
Figure 4 shows descriptive statistics of the economic freedom index for the CEE countries. The Heritage Foundation methodology uses a dual approach to measuring the economic freedom: (1) it is a ranking of countries based on the economic freedom index. (2) It is a relative ranking of each country on scale from 0 to 100, where 100 represents the most conducive environment. In this paper, the index was used in a relative way, i.e., on a scale for all studied countries of the CEE.
On the basis of
Figure 4. the business environment of the EU10 countries can be characterized as moderately differentiated particularly at the beginning of analyzed period. From 1995 to 2004, the heterogeneity of business environment has been considerable greater but in the coming years the progressive convergence of business environment can be observed. This is evidence by the decreasing distance between the upper and lower limits as well as between quartiles. Additionally. the significant improvement of the business environment of the EU10 took place after 2004. It can be associated with accession to the European Union. Between 2005 and 2010 there was right-sized asymmetry observed stating that more countries had lower values of features the average but after 2014 this trend is reversed while increasing the dispersion of the EFI. Similar findings were proposed by
Heckelman (
2015), who found that countries within the Europe converging for overall economic freedom.
The results of the analysis of the relationship between the business environment and the economic growth of the CEE10 countries are presented in
Table 5.
On the basis of the regression model verification we can confirm the existence of relation between the business environment and the level (Model 1) and growth rate (Model 2) of GDP per capita in the CEE countries. The business environment (EFI) has a positive impact on the level of economic growth. Along with the improvement of the business environment, the economic growth of the CEE countries is increasing, which means that it also determines the convergence process. Model 1 (LSDV-R
2 = 0.55, Within-R
2 = 0.56) explains a much larger part of the variability of the dependent variable than Model 2 (LSDV-R
2 = 0.55, Within-R
2 = 0.56). It is necessary to add that the business environment was not the only driving force of the CEE countries development during considered period. The export as % of GDP and FDI inflow (%GDP) also had influence on the level of development in the given countries. The FDI inflow is a determinant of economic growth rate of the CEE10 countries in analyzed years. Similar results were obtained by
Gwartney et al. (
1999),
Messaoud and Teheni (
2014),
Głodowska (
2017a),
Ghosh and Faber (
2010) as well as
Ani (
2015).
Ani (
2015) pointed out that business environment is the key determinants of economic growth for the Asian countries. The positive changes in the business environment and their significance for the economic growth in CEE countries can be driving force for catching up process toward Western European countries. Thus, indirectly, it can be concluded that the business environment is a stimulant of convergence processes as previously was confirmed by
Petrakos et al. (
2005),
Hu and Li (
2008),
Peev and Mueller (
2012). This study can be considered as preliminary, which confirms the need of more in–depth investigation on the impact of business environment on convergence processes within the CEE countries.
5. Conclusions
Real convergence is one of the pillars of the integration process. It is also the primary objective of the EU policy. The results of the executed statistic calculations, presented in the article and conducted analysis of real convergence among CEE10 and EU15 countries, have led to a verification of the research hypotheses stated in the article (
Table 6).
To summarize, it should be noted that in the group of studied countries, between 1995 and 2016, the beta and sigma convergence hypothesis was confirmed. However, the gamma convergence hypothesis has been rejected. It should be noted that the initial estimation of the Kendalla coefficients for each year showed a downward trend in the coefficient. Although these values were statistically significant, the changes in the countries studied were not large enough to trigger a sort of “overwhelm”, which would indicate a gamma convergence. The divergence of the results of convergence analysis does not disqualify the study, as they can be explained. In the study years, the relatively poorer economy in the initial study period developed faster than those with higher GDP per capita levels, which means growth of the surveyed economies according to the beta convergence hypothesis. As a result, in the years 1995–2016 there is a reduction in the growth disparities of the examined countries, the variation in the standard deviation of the logarithm of GDP per capita decreases year by year, thus confirming the development of the area under the sigma convergence hypothesis. Very large development divergences between the EU15 and the EU10 and the relatively low dynamics of the changes in the GDP per capita distribution in the CEE10 group did not, however, allow to fully catch up with the EU15 countries. A more in-depth analysis using Clark’s divergence coefficient, including subgroups of countries distinguished in the EU15 and referring to individual CEE10 countries, confirmed the dynamic process of reducing the development gap, especially in relation to the weakest countries of the “old EU”.
Positive changes in the business environment across the CEE10 countries and upward trends indicate a gradual approach of studied economies in these area. A quantitative analysis of dependence of growth from business environment has also been confirmed. The improvement of the business environment also determined the convergence process in the EU10. The business environment was not the only driving force of the studied countries development, but also export and FDI inflow were stimulants of economic growth.
The research was accompanied by certain limitations. Certain simplifying are treatments the UE15 as a homogenous organism. The EU15 was determined benchmark for the CEE10 countries in the accepted research assumptions.
Applying gamma, sigma and beta convergence also has certain imperfections, resulting from the assumptions of their models. They do not take into consideration structural parameters, which can have influence on economic growth. What is more, other control variables can be also considered as stimulants of growth. They should be included into the model testing the impact of business environment on economic growth. Despite this, the undertaken elaboration is justified and needed.
This study can be treated as an introductory investigation which determines necessity of its continuation with the applying more advanced methods, such as conditional convergence, whether also more complex measures i.e., stochastic convergence and technological convergence among the European Union countries. Particular attention should be paid for analyzing business environment and its direct role on real convergence of the EU countries. There is a need to conduct more comprehensive studies that take into account different stimulants of economic growth in one model. It would also give answer to the questions whether convergence is taking place and what are its determinants. Conducting this type of research in the future is very justified not only from a cognitive perspective but the results of the investigation may be of an application nature.


